

Abstract
Stimulus-induced increases in neuronal Ca2+concentration are important signaling events for transcriptional regulation and neuronal plasticity. Electrical inputs are thought to mediate Ca2+ responses in the soma by triggering action potentials, which in turn open voltage-gated Ca2+ channels in the somatic plasma membrane. It is not yet known to what extent internal Ca2+ amplification contributes to the somatic Ca2+ responses. Here we used fluorescent Ca2+measurements in cultured hippocampal neurons and report that the amplitude of the somatic Ca2+ increase triggered by field stimulation is independent of the extracellular Ca2+concentration as long as the concentration is greater than 50 μm. Furthermore, significantly more La3+ has to be added extracellularly for blocking Ca2+ responses, as predicted from the reported La3+ dependence of voltage-gated Ca2+ channels. These measurements suggest that field stimulation-induced somatic Ca2+ responses in hippocampal neurons are largely attributable to Ca2+release from intracellular stores. Only a small number of Ca2+ ions have to enter across the plasma membrane for this intracellular Ca2+ amplification process to occur. Rapid fluorescence-imaging measurements showed that the internal Ca2+ amplification occurs over 10–15 msec and linearly increases intracellular Ca2+ concentrations for up to 40 action potentials. At a fixed number of field pulses, frequencies of 40 Hz were optimal for somatic Ca2+ increases. Our studies suggest that the opening of intracellular Ca2+ release channels plays a crucial part in shaping the action potential-induced neuronal Ca2+ response.
Keywords: hippocampal neurons, action potential, calcium release, field stimulation, Fluo3, calcium amplification
Ca2+ signaling in neurons is important for neurotransmitter release, synaptic plasticity (Malenka, 1994;Malgaroli, 1994), and transcriptional control (Frank and Greenberg, 1994; Deisseroth et al., 1996). Although presynaptic and postsynaptic Ca2+ signals have been studied extensively (e.g., Augustine and Neher, 1992; Neher, 1993), less is known about the role and mechanism of action potential-induced Ca2+ increases in the soma. A likely function of such Ca2+ responses is to transduce information about the electrical activity into processes within the nucleus, because depolarization-mediated somatic Ca2+ increases have been shown to alter gene expression as well as other somatic processes (Frank and Greenberg, 1994; Deisseroth et al., 1996). In one Ca2+-dependent signal transduction pathway, transcriptional activation can be mediated by Ca2+/calmodulin-dependent protein kinase II- or IV-mediated phosphorylation of cAMP response element binding protein. The question arises of how the short-lasting Ca2+ influx during an action potential can sufficiently increase cytosolic and nuclear Ca2+ concentrations to activate the transcriptional machinery.
Here we investigate the significance of internal Ca2+release for action potential-induced somatic Ca2+transients. Similar to the internal Ca2+ amplification mechanisms in skeletal and cardiac muscle, an action potential-induced intracellular Ca2+ release process may lead to a much larger amplitude of the somatic Ca2+ response than could be attained by Ca2+ influx alone. In addition to a role in increasing the amplitude of Ca2+ transients, action potential-induced opening of intracellular Ca2+ release channels would also likely be important in mediating selective activation of enzymes and transcription factors that are colocalized with such release channels.
MATERIALS AND METHODS
Cell culturing. Primary hippocampal cultures were prepared using a modification of the procedure described by Ryan and Smith (1995). Hippocampal regions were removed from day 3 rat pups in Ca2+- and Mg2+-free HBSS, and the CA1–CA3 region was subdissected from the dentate gyrus and subicular structures. The CA1–CA3 region was then collected, minced, and incubated for 10 min at 37°C in the presence of 0.25% trypsin, 1 mg/ml DNase (both from Sigma, St. Louis, MO), and 10 mmMg2+. The cells were then triturated and plated onto acid-washed coverslips that had been coated previously with 0.01% poly-d-lysine (Sigma) and 1:100 Matrigel (Collaborative Research, Bedford, MA). Media consisted of minimum essential medium supplemented with 2% B27, 6% fetal calf serum (all from Life Technologies, Gaithersburg, MD), 30 mg/L insulin, and 100 mg/L transferrin (Sigma). Cell densities at plating were 30,000–50,000 cells/cm2. At 48 hr in culture cytosineb-d-arabinofuranoside (Sigma) was added to a final concentration of 6 μm. Feeding consisted of exchanging 50% of the media twice a week. Cultures were incubated in a 37°C humidified chamber maintained at 5% CO2. For all experiments, the neurons were used 2–5 weeks after plating. It has been shown that functional synapses exist in primary hippocampal cultures of this age (Basarsky et al., 1994). A chamber was formed by attaching to the coverslip a Teflon ring (inner diameter, 1.2 cm; height, 2–3 mm; total volume, ∼300 μl), using silicone vacuum grease as a sealant. During experiments the culturing medium was switched to a standard saline solution consisting of 135 mmNaCl, 5 mm KCl, 1.5 mm CaCl2, 1.5 mm MgCl2, 20 mm HEPES (buffered to pH 7.4), 10 mm glucose, 10 μm6-cyano-7-nitroquinoxaline-2,3-dione (CNQX) (Research Biochemicals International, Natick, MA), and 250 μm sulfinpyrazone (Sigma). The dye-loading solution consisted of 5 μmFluo3-AM (Molecular Probes, Eugene, OR) in the standard saline, with the omission of CNQX. The neurons were allowed to remain in the dye-loading solution for 20 min before being washed in the standard saline and used for experiments. Neurons with triangular or fusiform morphology, which are mostly either CA1 or CA3 type neurons (and not interneurons), were analyzed in these studies. All experiments were performed at room temperature (∼25°C).
Field stimulation. Ca2+ transients were stimulated with a standard protocol by lowering two parallel platinum electrodes (3 mm apart) into the chamber in near contact with the surface and then passing 1 msec current pulses between the electrodes, yielding fields of ∼10 V/cm across the surface of the coverslip. The standard protocol was a 1-sec-long train, or “burst,” of 30 current pulses (i.e., 30 Hz). A 486 IBM-compatible computer with analog-to-digital and digital-to-analog conversion boards was used along with a high voltage supply and self-built electronics to allow computer control of the timing and strength of the applied electric field pulses as well as for monitoring the amount of current applied to the cells. From the measured current, the electric field strength was calculated via a mathematical model using the known resistivity of saline: ρ = 60 Ω·cm. Each measurement in Figure 1, Cand D, involved six bursts. Three identical bursts were triggered 15 sec apart and were followed by three reference bursts (reference conditions: 10 V/cm; pulse width, 1 msec; 30 pulses over 1 sec). A relative peak amplitude of the experimental fluorescence was calculated by dividing the average amplitude of the fluorescence peak of the initial three responses by the averaged reference amplitude. All errors are plotted as SEM. Best fits were calculated via the Levenberg–Marquardt method using Deltagraph software (Deltapoint, Monterey, CA).
Fig. 1.

Somatic Ca2+ responses triggered by field stimulation. A, Transient increases in intracellular [Ca2+] are triggered by six trains of 30 field pulses applied at 30 Hz. Tracings from three cells are shown. Ca2+ responses were recorded in the soma of primary cultured hippocampal neurons loaded with the fluorescent Ca2+ indicator Fluo3. The relative increase in fluorescence of each response was ∼1.5. B, The amplitude of the Ca2+ response increased with the number of field pulses applied per train. Pulses were also applied at 30 Hz. C, The peak amplitude of the relative fluorescence versus the applied electric field strength is shown for an individual cell. A sharp threshold for triggering Ca2+ responses can be observed. Maximal responses typically required 10 V/cm. The line is the best fit to the data of the equation: A =aE1/2n/(E1/2n+ E1/2n), where Aas the relative amplitude, a is the maximal amplitude,E1/2 = 6.0 V/cm, and n = 40. D, [Ca2+] responses also show an all-or-none dependence on the duration of the field pulse. Pulses longer than 0.2 msec were typically required for triggering a [Ca2+] rise. No further [Ca2+] increase was observed by increasing the duration past 0.2 msec. The line is the best fit to the data with the form: A =aτn/(τn + τ1/2n), where τ1/2 = 0.13 msec, and n = 10.4.
Fluorescence imaging. The Ca2+ indicator Fluo3-AM was excited at 488 nm using an inverted Nikon Diaphot microscope and an Odyssey confocal imaging system with a 100 μm confocal slit (Noran Instruments, Middleton, WI). Fluorescence intensity traces from individual neurons were obtained by monitoring the average overall intensity of the soma of each cell every 100 msec by using Image-1 software (Universal Imaging Corporation, West Chester, PA). In the experiments depicted in Figure 3, a Raptor imaging board (Bitflow, Woburn, MA) and Eye Image Calculator software (IO Industries, London, Ontario, Canada) were used to capture delaced images from the confocal microscope every 16.7 msec. A second laser coupled into the optical axis was used to create a 2 msec timing pulse. This timing pulse was used to determine the onset of the field pulse and to confirm the line scan time. In this experiment, 1-msec-long field pulses were applied every 200 msec. A baseline fluorescence image was determined by averaging the 10 images before the onset of stimulation. This baseline was subtracted from all subsequent images. The images were scaled to a uniform signal height, and the average brightness in the vicinity of the plasma membrane was determined line by line. The analysis was completed by inserting the 2.3 msec interval between frames into the data, followed by rescaling to adjust for baseline and signal height. Only those traces with signal-to-noise ratios better than 50% of that of the best trace were used.
Fig. 3.

Spatial and temporal analysis of action potential-induced Ca2+ responses. Intracellular Ca2+ release occurs over 10–15 msec and originates mostly from Ca2+ stores close to the plasma membrane.A, Rise in fluorescence intensity induced by a single action potential in the soma of an individual neuron as determined by a confocal microscope in line scan analysis mode with a 60 μsec scan time (green, low fluorescence;red, high fluorescence). The trace begins ∼2 msec after the onset of the applied electric field pulse. The greatest rise in [Ca2+]i occurs near the plasma membrane.B, Rise in fluorescence intensity near the plasma membrane for a single action potential in three separate neurons. The time scale represents milliseconds after the onset of the applied electric field pulse, and the shaded box represents the duration of the field pulse. The small overshoot in fluorescence at at of approximately −3 msec resulted from error from a photomultiplier tube after an ultraviolet timing pulse. The interruptions seen resulted from 2.3 msec pauses in the data collection every 14.3 msec. The solid line is the best fit to the data of an equation of the form: F(t) =atn/(t1/2n+ tn), where t1/2= 4.9 msec , and n = 3.3. The individual fluorescence traces were statistically indistinguishable from the average (for individual traces, t1/2 = 4.6 ± 0.3, and n = 3.7 ± 0.3).C, Average fluorescence rise induced in the soma near the plasma membrane by a single action potential (n= 16 action potentials in nine distinct neurons). The shaded box again represents the duration of the electric field pulse, and the small overshoot at a t of approximately −3 msec represents photomultiplier tube error. The solid line is the best fit to the data of an equation of the form:F(t) =atn/(t1/2n+ tn). The dashed line is the first derivative of the calculated curve fit and demonstrates that the highest rate of rise occurs 3–5 msec after the onset of the field pulse, and a full Ca2+ rise requires 10–15 msec.
Perfusion of cultured neurons. Flow exchange in the chamber was accomplished with a gravity feed system of three solutions connected to a common output via a series of computer-controlled switches. The output was allowed to flow into one side of the chamber, and a suction device was placed above the surface of the saline solution on the opposite side of the chamber to drain fluid during flow. Computer-controlled mixing of solutions allowed a variety of Ca2+ concentrations to be achieved. The flow rate was ∼1.4 ml/min, and the chamber held ∼300 μl. The standard time for fluid exchange used was as long as 70–80 sec to prevent mechanical perturbance. The chamber contents could be exchanged to >98% in 70 sec, as verified by measuring the fluorescence of a 10 μmfluorescein solution. A standard saline solution with a [Ca2+] of 300 nm was made by adding 1 mm EGTA to standard saline with no added Ca2+, and the [Ca2+] was verified by using the fluorescent indicator indomethacin 1 in a fluorescence spectrophotometer. Similarly, a standard saline solution with a [Ca2+] of 30 nm was made by adding 10 mm EGTA. Each measurement in Figure 2 consisted of six bursts. Two reference bursts at a [Ca2+]e of 1.5 mm were followed by a full fluid exchange to a desired [Ca2+]e, two more bursts, a full fluid exchange back to a [Ca2+]e of 1.5 mm, and two final bursts. Burst parameters were the same as in Figure 1. A relative peak amplitude of fluorescence was calculated by dividing the average amplitude of the fluorescence peaks of the experimental condition by the linear interpolation of the relative peak amplitudes of the reference conditions. This procedure helped to correct for dye bleaching over these relatively long experiments. Each measurement in Figure 2C also consisted of six bursts. Two reference bursts in standard saline with no lanthanum present were followed by a full fluid exchange to standard saline with the desired [La3+] and then two experimental bursts. The experiment was completed with a 90% fluid exchange with standard saline without added Ca2+ and with 1 mm EGTA followed immediately by a full fluid exchange back to standard saline and two final reference bursts.
Fig. 2.
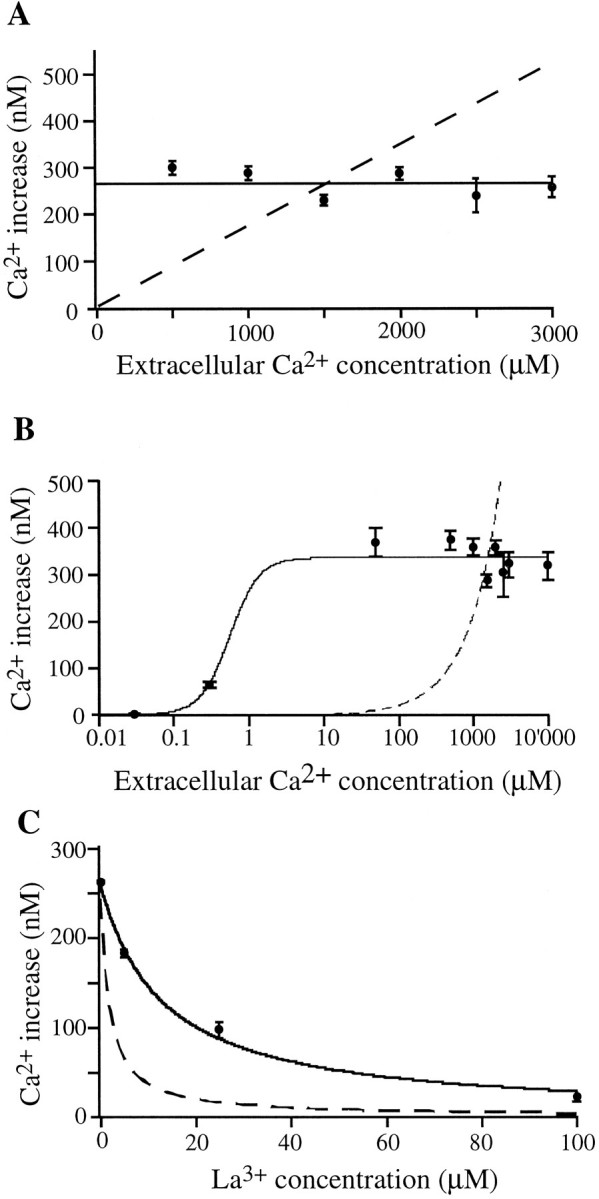
Dependence of somatic Ca2+ responses on extracellular Ca2+ concentration. A, The action potential-induced intracellular Ca2+ rise is independent of external Ca2+ concentration from 500 to 3000 μm (data points and solid line). Thedashed line illustrates the expected results of this experiment under the assumption that the intracellular Ca2+rise was the direct result of Ca2+ influx from voltage-gated Ca2+ channels. B, Only when external [Ca2+] is lowered below 50 μm does the action potential-induced Ca2+ rise become diminished.C, Dependence of somatic Ca2+ responses on extracellular lanthanum concentration. La3+ suppressed the action potential-induced intracellular Ca2+ rise but with a much higher IC50 (13 μm) than expected. An extracellular [Ca2+] of 1.5 mm was present throughout. The dashed line again represents the expectation based on the assumption of the Ca2+ rise coming directly from influx via voltage-gated Ca2+ channels, modeled on data from the effect of La3+ on individual voltage-gated Ca2+ channels, with an IC50 of 1.7 μm. The solid line is the best fit to the data with the form: A =aIC50/([La3+] + IC50), where IC50 = 13 μm, anda = 262 nm.
Calibration of Ca2+ concentration. The relative peak amplitude of fluorescence was converted to an apparent free intracellular [Ca2+] via a calibration performed on a similar neuron culture (n = 10 neurons), and repeated on several occasions with similar results. This calibration was accomplished via the equation [Ca2+] =Kd [F(t) −Fmin)/(Fmax −F(t)], where F(t) is the measured fluorescence intensity of Fluo3, Kd = 316 nm (Molecular Probes), and Fmaxwas measured as the fluorescence intensity after addition of ionomycin (∼1 μm) in the presence of an extracellular [Ca2+] of 1.5 mm. Fminwas calculated as 0.02% of Fmax. Background autofluorescence was negligible compared with the fluorescence of Fluo3-AM-loaded neurons. The background dark current was measured with the excitation laser blocked and was subtracted from F,Fmin, and Fmax.
RESULTS
Action potentials and Ca2+ responses induced by field stimulation
We investigated Ca2+ signals in the soma of primary cultured hippocampal neurons by field stimulation. Field stimulation of these cells has been used before, but no description of the relevant parameter ranges for field stimulation has been determined (Ryan and Smith, 1995; Deisseroth et al., 1996). First, we measured Ca2+ increases in response to field stimuli of different amplitudes and durations. Hippocampal neurons loaded with the fluorescent Ca2+ indicator Fluo3-AM responded with a significant increase in free [Ca2+]i in the soma to each train of 30 electric field pulses applied at 30 Hz (Fig.1A, tracings from three cells shown). Each Ca2+ transient reflects the net effect of 30 field pulses. The amplitude of the Ca2+ response increased with the number of field pulses applied per train (Fig.1B, one cell shown). The first Ca2+transient in Figure 1B was generated by two field pulses, and the last transient was generated by 16 field pulses. The increase in [Ca2+]i showed an all-or-none type dependence on the applied electric field strength (Fig.1C, typical result from an individual neuron). The voltage dependence was sharper for individual neurons than it was for the average of an ensemble of neurons, probably because of differences in the local electric field that each neuron experienced. This could be expressed best by fitting an apparent cooperativity coefficient to the data: n = 40 for the graph of the individual neuron shown (n = 26 ± 12 on average for five individual neurons). The same kind of all-or-none dependence was seen with variations of the pulse width (Fig. 1D). The high apparent cooperativity in the two analyses strongly suggests that the observed Ca2+ responses are indeed the result of field stimulation-induced action potentials. Most likely, each 1 msec field pulse induces a single action potential in this preparation.
In an additional control, application of 1 μmtetrodotoxin, an inhibitor of voltage-sensitive Na+channels, reversibly suppressed these [Ca2+]iincreases (data not shown). This all-or-none dependence and the requirement for functioning Na+ channels suggests that an applied short electric field pulse induces an individual action potential, which in turn leads to a [Ca2+]iincrease.
Extracellular Ca2+ dependence of Ca2+ responses
It is of functional importance whether the action potential-induced [Ca2+]i rise in the soma results from Ca2+ influx or from internal release of Ca2+, because internal release may increase the amplitude of Ca2+ signals significantly. We determined the significance of internal stores for Ca2+ release by varying the extracellular Ca2+ concentration. Studies have shown that the Ca2+ flux conducted by voltage-gated Ca2+ channels has a linear dependence on the extracellular Ca2+ concentration and shows half-maximal saturation between 14 and 50 mm, depending on the cell type and experimental method used (Frankenhaeuser and Hodgkin, 1957; Okamoto et al., 1976; Kawa, 1979; Hagiwara and Byerly, 1981). Therefore, if somatic Ca2+ rises result directly from Ca2+influx, a linear intracellular Ca2+ response would be expected below an extracellular Ca2+ concentration of 10 mm.
Surprisingly, no change in the amplitude of the Ca2+response was observed when the extracellular Ca2+concentration was varied between 0.5 and 3.0 mm (Fig.2A). The dashed linerepresents expected results based on the assumption of the Ca2+ rise coming directly from influx via voltage-gated Ca2+ channels (assuming linear dependence on the external calcium concentration). The contrasting solid line is the best fit to the data. Even when the extracellular Ca2+concentration was lowered to 50 μm or increased to 10 mm, the amplitude of the response was not changed (Fig.2B). Only below 50 μm, more than 30-fold below normal, was there a decrease in the action potential-induced Ca2+ response. Again, the dashed line in Fig. 2B represents expected results based on the assumption of the Ca2+ rise coming directly from influx via voltage-gated Ca2+ channels. These data are inconsistent with direct influx of Ca2+ as the main mechanism for the action potential-induced Ca2+ rise. Although earlier reports suggested that the time course of action potentials can be affected by large changes in extracellular Ca2+ concentration (Frankenhaeuser and Hodkin, 1957), it is unlikely that alterations in the properties of action potentials can explain this Ca2+ independence over such a large range of extracellular Ca2+ concentrations.
Lanthanum dependence of Ca2+ responses
To investigate further whether the rise in [Ca2+]i is a direct result of Ca2+ influx via voltage-gated Ca2+ channels, we tested whether blocking voltage-gated Ca2+ channels with La3+ affects the action potential-induced Ca2+rise. Earlier studies have shown that La3+ is a potent blocker of voltage-gated Ca2+ channels, with IC50 values of 1.7 μm for transient currents and 0.14 μm for sustained currents (Boland et al., 1991). Figure 2C shows that 13 μm[La3+] is required for half-maximal suppression of Ca2+ responses. Thus, [La3+] has to be increased nearly 8- to 100-fold above the IC50 for blocking of individual voltage-gated Ca2+ channels for inhibition of the intracellular Ca2+ response. The dashed linein Figure 2C represents the expectation based on the assumption of the Ca2+ rise coming directly from influx via voltage-gated Ca2+ channels (using the IC50reported previously for transient currents).
Interpretation of Figure 2C yields additional information regarding the mechanism of the Ca2+ rise. Between 90 and 99% of the individual voltage-gated Ca2+ channels are blocked at an [La3+] of 13 μm (Boland et al., 1991), but the action potential-induced Ca2+ rise was only reduced by 50%. This disparity implies that direct influx of Ca2+ via voltage-gated Ca2+ channels cannot be the main mechanism responsible for the Ca2+ rise. Together, the observations of Figure 2 strongly suggest that, although some Ca2+ influx is necessary, Ca2+ influx across the plasma membrane alone is not sufficient for a significant somatic Ca2+ rise to occur. In other words, each action potential causes voltage-gated Ca2+ channels to open, and the resulting Ca2+ influx triggers a much larger Ca2+ rise from other sources. The observed reduction of the maximal Ca2+ response for extracellular Ca2+concentrations below 50 μm suggests that the Ca2+ influx through voltage-gated Ca2+ channels leads to a more than 30-fold amplification of the Ca2+response by opening Ca2+ release channels in intracellular Ca2+ stores.
Because ryanodine receptors have been identified in hippocampal neurons by immunohistochemistry (Seymour-Laurent and Barish, 1995), we tested their potential involvement in Ca2+ release by applying 20 mm caffeine for up to 25 min and 10 μmryanodine for up to 20 min to the neurons. At least for these concentrations, no apparent change in the amplitude of action potential-induced Ca2+ responses could be observed (data not shown). This suggests that the involved internal Ca2+channels are not Ca2+-gated ryanodine receptors but either inositol trisphosphate receptors, which have also been observed in hippocampal neurons (Seymour-Laurent and Barish, 1995), or a different type of caffeine- and ryanodine-insensitive Ca2+ channel. The involvement of inositol trisphosphate receptors, however, is not likely, because they can be blocked by caffeine, at least inXenopus oocytes (Parker and Ivorra, 1991).
Rapid kinetics and spatial analysis of intracellular Ca2+ amplification
We determined the time course of internal Ca2+ release and the location of release using a confocal microscope in line scan analysis mode (60 μsec scan time). As shown in Figure3, the increase in Ca2+ concentration occurs over a period of 10–15 msec, much longer than the duration of an action potential (0.6–2.5 msec in hippocampal neurons) (Kandel et al., 1961; Peacock, 1979; Segal, 1983; Wiener et al., 1989; Bekkers and Stevens, 1991; Wheeler et al., 1996). The marked disparity between the time course of the Ca2+ rise and the duration of an action potential further strengthens the argument that most of the Ca2+ rise comes from release from internal stores and not from influx via voltage-gated Ca2+ channels. The time scale of 10–15 msec is similar to that observed for amplification mechanisms in smooth muscle, cardiac muscle, and skeletal muscle (Cannell et al., 1995; Nelson et al., 1995; Klein et al., 1996).
Figure 3A shows a spatial analysis of the Ca2+release sites in a surface plot of the fluorescence intensity (z-axis) along a line across the soma (x-axis) as a function of time after the field pulse (y-axis). The [Ca2+]i increases disproportionately more in regions close to the plasma membrane, suggesting that most of the Ca2+ release occurs in a region within <3 μm from the plasma membrane. Figure 3B shows such increases in fluorescence intensity in the region near the plasma membrane caused by three individual action potentials. Figure 3C shows a similar plot for an average of 16 action potentials (from nine neurons). The solid line is the best fit to the data, and the dashed line is the first derivative of the calculated curve fit. The highest rate of release occurred 3–5 msec after the onset of the field pulse, and Ca2+ release lasted for 10–15 msec. Delayed binding of Ca2+ to Fluo3 does not prolong the increase in fluorescence intensity significantly, because the Kon for Ca2+ binding by Fluo3 has been found to be 109m/sec or higher (Eberhard and Erne, 1989), suggesting that binding to the indicator occurs in <20 μsec (Kon × [Fluo3] with [Fluo3] assumed to be 50 μm).
Dependence of Ca2+ amplification on the number and frequency of action potentials
The properties of these internal Ca2+ release sites were investigated further by analyzing whether multiple action potentials cause potentiation or suppression of subsequent responses. Such a frequency dependence of Ca2+ responses may serve as a means for decoding electrical inputs within the soma. Physiologically meaningful repetition rates that have been observed in the hippocampusin vivo are in the range of 5–40 action potentials at frequencies of up to 50 Hz (Wiener et al., 1989). Interestingly, within the physiologically significant range, the peak [Ca2+]i was strikingly linear with the number of action potentials (Fig. 4A). Figure4B shows that the intracellular [Ca2+] response has a small dependence on the frequency of the field pulses, with a maximal [Ca2+] response triggered at ∼40 Hz. The experiment in Figure 4B used 20 field pulses per burst to keep total stimulation time at 10 Hz to 2 sec and thereby to minimize any reduction in peak amplitude caused by the action of Ca2+ pumps.
Fig. 4.

Dependence of internal Ca2+release on the number and frequency of action potentials. This analysis shows that neither potentiation nor suppression of Ca2+responses occurs over physiologically meaningful repetition rates (40 action potentials, <50 Hz). A, Linear dependence between the number of action potentials and the calculated peak intracellular free [Ca2+]. B, Intracellular [Ca2+] responses are maximal for frequencies of ∼40 Hz. Peak Ca2+ responses after 20 field pulses are shown.
Although the total amount of Ca2+ in the store was sufficient to cause a significant rise of [Ca2+] in the soma for a train of action potentials, each individual action potential caused an average somatic [Ca2+]i to increase by 10 nm. Nevertheless, Figure 3A demonstrates that a local [Ca2+]i close to the plasma membrane can rise significantly higher during a Ca2+transient. Taken together, these observations suggest that internal Ca2+ release functions mostly as a linear amplification device with a small potentiation of the [Ca2+] response for frequencies of ∼40 Hz.
DISCUSSION
Our data suggest that action potential-induced influx of Ca2+ into the soma results in a more than 30-fold amplification of the Ca2+ response by a 10- to 15-msec-long Ca2+ release process that requires Ca2+ stores close to the plasma membrane. This estimate is based on the observation that action potentials result in Ca2+ transients of identical amplitude in extracellular Ca2+ concentrations of 50 μm and 1.5 mm. This estimate also relies on the observed linear dependence of Ca2+ flux through voltage-gated Ca2+ channels as a function of the extracellular Ca2+ concentration (Frankenhaeuser and Hodgkin, 1957; Okamoto et al., 1976; Kawa, 1979; Hagiwara and Byerly, 1981). A second line of evidence suggesting a similarly large amplification process is indicated by the discrepancy between the concentration of La3+ necessary to block action potential-induced Ca2+ transients versus that needed to block individual voltage-gated Ca2+ channels. An amplification mechanism might be necessary, because Ca2+ is buffered between 100-fold in gonadotrophs (Tse et al., 1994) and 500- to 1000-fold in neurons (Muller et al., 1993; Llano et al., 1994), suggesting that a large influx or large internal release of Ca2+ ions is required to cause a substantial Ca2+ rise within the soma. Because adjacent neurons and glia are closely juxtaposed, and extracellular Ca2+ is buffered only weakly, there may be an insufficient number of extracellular Ca2+ ions available to cause a significant rise in [Ca2+]i by Ca2+ influx alone. Therefore, the internal Ca2+ amplification mechanism identified in this study may play an important role in the production of significant Ca2+ signals in the neuronal soma.
In addition to the extensive buffering of Ca2+ in the cytosol and the small number of available extracellular Ca2+ ions, the Ca2+ responses are also limited by the volume-to-surface ratio, which is much larger in the soma than at the synapse, and would increase significantly the relative density of voltage-gated Ca2+ channels that would be required in the soma to generate a sizable Ca2+ response. Similar volume-to-surface limitations also exist for cardiac and skeletal muscle, in which intracellular Ca2+ channels are opened by Ca2+-induced ryanodine receptor opening (Cannell et al., 1995) and by an electromechanical coupling between the dihydropyridine receptor and the ryanodine receptor (Klein et al., 1996). Thus, internal somatic Ca2+ amplification can be used to amplify a short action potential-induced Ca2+ influx at the plasma membrane into a functionally significant Ca2+ response without requiring a large density of voltage-gated Ca2+channels in the soma.
The induction of long-term neuronal plasticity is thought to rely on the control of transcriptional activity and often involves growth factors and other receptor ligands; however, neurons also need a means to regulate gene expression directly as a function of their electrical activity (Ghosh et al., 1994; Deisseroth et al., 1996). Somatic Ca2+ increases are likely to be important for this type of regulation. Ca2+-mediated changes in gene expression occur for Ca2+ increases in the cell body in the concentration range of a few hundred nanomolar to 1 μm, suggesting that the observed Ca2+ increases of 10 nm/action potential become physiologically meaningful if more than ∼20 action potentials are triggered within 3 sec. Three seconds constitutes the time required for Ca2+ pumps to revert Ca2+increases (see Fig. 1A). Comparable numbers of action potentials during such a period have been observed in in vivo recordings from hippocampal neurons (Wiener et al., 1989), suggesting that the Ca2+ amplification mechanism reported here can provide sufficiently large Ca2+ responses in physiologically relevant situations.
Another potential advantage of using intracellular Ca2+amplification is that the cellular response to electrical inputs can be controlled better. Many functions of Ca2+ are thought to be localized by having effector proteins in the direct vicinity of Ca2+ channels (Schweizer et al., 1995). Furthermore, the gating of the known intracellular Ca2+ release channels is highly regulated by phosphorylation and other signaling events. Thus, by relying on intracellular Ca2+ release, the functional response to electrical inputs can be readily shaped by altering the intracellular localization of Ca2+ effectors and regulating the amount of internally released Ca2+.
Footnotes
This work was supported by National Institutes of Health Grants GM-48113 and GM-51457. J.M.J. was a Howard Hughes Medical Institute Medical Student Research Training Fellow. T.M. was supported by a fellowship from the David and Lucile Packard Foundation. We are grateful to Dr. C. Martenson for his work on the neuron cultures and for helpful advice and assistance. Dr. T. Ryan (Stanford University) was instrumental in setting up the neuronal culture. We also acknowledge J. Horne, E. Oancea, and Drs. M. Teruel, F. Schweizer, and J. Williams for support with the experiments and stimulating discussions.
Correspondence should be addressed to Dr. Tobias Meyer, Department of Cell Biology, Nanaline Duke Building, Room 346, Box 3709, Duke University Medical Center, Durham, NC 27710.
REFERENCES
- 1.Augustine GJ, Neher E. Neuronal Ca2+ signalling takes the local route. Curr Opin Neurobiol. 1992;2:302–307. doi: 10.1016/0959-4388(92)90119-6. [DOI] [PubMed] [Google Scholar]
- 2.Basarsky TA, Parpura V, Haydon PG. Hippocampal synaptogenesis in cell culture: developmental time course of synapse formation, calcium influx, and synaptic protein distribution. J Neurosci. 1994;14:6402–6411. doi: 10.1523/JNEUROSCI.14-11-06402.1994. [DOI] [PMC free article] [PubMed] [Google Scholar]
- 3.Bekkers JM, Stevens CF. Excitatory and inhibitory autaptic currents in isolated hippocampal neurons maintained in cell culture. Proc Natl Acad Sci USA. 1991;88:7834–7838. doi: 10.1073/pnas.88.17.7834. [DOI] [PMC free article] [PubMed] [Google Scholar]
- 4.Boland LM, Brown TA, Dingledine R. Gadolinium block of calcium channels: influence of bicarbonate. Brain Res. 1991;563:142–150. doi: 10.1016/0006-8993(91)91527-8. [DOI] [PubMed] [Google Scholar]
- 5.Cannell MB, Cheng H, Lederer WJ. The control of calcium release in heart muscle. Science. 1995;268:1045–1049. doi: 10.1126/science.7754384. [DOI] [PubMed] [Google Scholar]
- 6.Deisseroth K, Bito H, Tsien RW. Signaling from synapse to nucleus: postsynaptic CREB phosphorylation during multiple forms of hippocampal synaptic plasticity. Neuron. 1996;16:89–101. doi: 10.1016/s0896-6273(00)80026-4. [DOI] [PubMed] [Google Scholar]
- 7.Eberhard M, Erne P. Kinetics of calcium binding to Fluo-3 determined by stopped-flow fluorescence. Biochem Biophys Res Commun. 1989;163:309–314. doi: 10.1016/0006-291x(89)92136-0. [DOI] [PubMed] [Google Scholar]
- 8.Frank DA, Greenberg ME. CREB: a mediator of long-term memory from mollusks to mammals. Cell. 1994;79:5–8. doi: 10.1016/0092-8674(94)90394-8. [DOI] [PubMed] [Google Scholar]
- 9.Frankenhaeuser B, Hodgkin AL. The action of calcium on the electrical properties of squid axons. J Physiol. 1957;137:218–244. doi: 10.1113/jphysiol.1957.sp005808. [DOI] [PMC free article] [PubMed] [Google Scholar]
- 10.Ghosh A, Ginty DD, Bading H, Greenberg ME. Calcium regulation of gene expression in neuronal cells. J Neurobiol. 1994;25:294–303. doi: 10.1002/neu.480250309. [DOI] [PubMed] [Google Scholar]
- 11.Hagiwara S, Byerly L. Calcium channel. Annu Rev Neurosci. 1981;4:69–125. doi: 10.1146/annurev.ne.04.030181.000441. [DOI] [PubMed] [Google Scholar]
- 12.Kandel ER, Spencer WA, Brinley FJ., Jr Electrophysiology of hippocampal neurons: sequential invasion and synaptic organization. J Neurophysiol. 1961;24:225–242. doi: 10.1152/jn.1961.24.3.225. [DOI] [PubMed] [Google Scholar]
- 13.Kawa K. Zinc-dependent action potentials in giant neurons of the snail, Euhadra quaestia. J Membr Biol. 1979;49:325–344. doi: 10.1007/BF01868990. [DOI] [PubMed] [Google Scholar]
- 14.Klein MG, Cheng H, Santana LF, Jiang YH, Lederer WJ, Schneider MF. Two mechanisms of quantized calcium release in skeletal muscle. Nature. 1996;379:455–458. doi: 10.1038/379455a0. [DOI] [PubMed] [Google Scholar]
- 15.Llano I, DiPolo R, Marty A. Calcium-induced calcium release in cerebellar Purkinje cells. Neuron. 1994;12:663–673. doi: 10.1016/0896-6273(94)90221-6. [DOI] [PubMed] [Google Scholar]
- 16.Malenka RC. Synaptic plasticity in the hippocampus: LTP and LTD. Cell. 1994;78:535–538. doi: 10.1016/0092-8674(94)90517-7. [DOI] [PubMed] [Google Scholar]
- 17.Malgaroli A. LTP expression: hanging like a yo-yo? Semin Cell Biol. 1994;5:231–241. doi: 10.1006/scel.1994.1029. [DOI] [PubMed] [Google Scholar]
- 18.Muller TH, Partridge LD, Swandulla D. Calcium buffering in bursting Helix pacemaker neurons. Pflügers Arch. 1993;425:499–505. doi: 10.1007/BF00374877. [DOI] [PubMed] [Google Scholar]
- 19.Neher E. Spatial and temporal aspects of Ca changes in secretion control. Biochem Soc Trans. 1993;21:420–423. doi: 10.1042/bst0210420. [DOI] [PubMed] [Google Scholar]
- 20.Nelson MT, Cheng H, Rubart M, Santana LF, Bonev AD, Knot HJ, Lederer WJ. Relaxation of arterial smooth muscle by calcium sparks. Science. 1995;270:633–637. doi: 10.1126/science.270.5236.633. [DOI] [PubMed] [Google Scholar]
- 21.Okamoto H, Takahashi K, Yoshii M. Two components of the calcium current in the egg cell membrane of the tunicate. J Physiol (Lond) 1976;255:527–561. doi: 10.1113/jphysiol.1976.sp011294. [DOI] [PMC free article] [PubMed] [Google Scholar]
- 22.Parker I, Ivorra I. Caffeine inhibits inositol trisphosphate-mediated liberation of intracellular calcium in Xenopus oocytes. J Physiol (Lond) 1991;433:229–240. doi: 10.1113/jphysiol.1991.sp018423. [DOI] [PMC free article] [PubMed] [Google Scholar]
- 23.Peacock JH. Electrophysiology of dissociated hippocampal cultures from fetal mice. Brain Res. 1979;169:247–260. doi: 10.1016/0006-8993(79)91028-x. [DOI] [PubMed] [Google Scholar]
- 24.Ryan TA, Smith SJ. Vessicle pool mobilization during action potential firing at hippocampal synapses. Neuron. 1995;14:983–989. doi: 10.1016/0896-6273(95)90336-4. [DOI] [PubMed] [Google Scholar]
- 25.Schweizer FE, Betz H, Augustine GJ. From vesicle docking to endocytosis: intermediate reactions of exocytosis. Neuron. 1995;14:689–696. doi: 10.1016/0896-6273(95)90213-9. [DOI] [PubMed] [Google Scholar]
- 26.Segal M. Rat hippocampal neurons in culture: responses to electrical and chemical stimuli. J Neurophysiol. 1983;50:1249–1264. doi: 10.1152/jn.1983.50.6.1249. [DOI] [PubMed] [Google Scholar]
- 27.Seymour-Laurent KJ, Barish ME. Inositol 1,4,5-triphosphate and ryanodine receptor distributions and patterns of acetylcholine- and caffeine-induced calcium release in cultured mouse hippocampal neurons. J Neurosci. 1995;15:2592–2608. doi: 10.1523/JNEUROSCI.15-04-02592.1995. [DOI] [PMC free article] [PubMed] [Google Scholar]
- 28.Tse A, Tse FW, Hille B. Calcium homeostasis in identified rat gonadotrophs. J Physiol (Lond) 1994;477:511–525. doi: 10.1113/jphysiol.1994.sp020212. [DOI] [PMC free article] [PubMed] [Google Scholar]
- 29.Wheeler DB, Randall A, Tsien RW. Changes in action potential duration alter reliance of excitatory synaptic transmission on multiple types of Ca2+ channels in rat hippocampus. J Neurosci. 1996;16:2226–2237. doi: 10.1523/JNEUROSCI.16-07-02226.1996. [DOI] [PMC free article] [PubMed] [Google Scholar]
- 30.Wiener SI, Paul CA, Eichenbaum H. Spatial and behavioral correlates of hippocampal neuronal activity. J Neurosci. 1989;9:2737–2763. doi: 10.1523/JNEUROSCI.09-08-02737.1989. [DOI] [PMC free article] [PubMed] [Google Scholar]