

Abstract
During telencephalic development, a boundary develops that restricts cell movement between the dorsal cortical and basal striatal proliferative zones. In this study, the appearance of this boundary and the mechanism by which cell movement is restricted were examined through a number of approaches. The general pattern of neuronal dispersion was examined both with an early neuronal marker and through the focal application of DiI to telencephalic explants. Both methods revealed that, although tangential neuronal dispersion is present throughout much of the telencephalon, it is restricted within the boundary region separating dorsal and ventral telencephalic proliferative zones. To examine the cellular mechanism underlying this boundary restriction, dissociated cells from the striatum were placed within both areas of the boundary, where dispersion is limited, and areas within the cortex, where significant cellular dispersion occurs. Cells placed within the boundary region remain round and extend only thin processes, whereas progenitors placed onto the cortical ventricular zone away from this boundary are able to migrate extensively. This suggests that the boundary inhibits directly the migration of cells. To examine whether the signal inhibiting dispersion within the boundary region acts as a long- or short-range cue, we apposed explants of boundary and nonboundary regions in vitro. Within these explants we found that migration was neither inhibited in nonboundary regions nor induced in boundary regions. This suggests that the boundary between dorsal and ventral telencephalon isolates these respective environments through either a contact-dependent or a short-range diffusible mechanism.
Keywords: boundary regions, cell movement, cellular processes, dispersion, proliferative zones, telencephalon
Within the telencephalon, discrete regions of proliferation and differentiation become evident during development (Bulfone et al., 1993; Puelles and Rubenstein, 1993). Their territories are characterized by their patterns of gene expression (Price et al., 1992; Simeone et al., 1992; Figdor and Stern, 1993;Rubenstein et al., 1994; Bulfone et al., 1995; Shimamura et al., 1995). The most prominent of these proliferative regions are the pallial cortical ventricular zone (CVZ) and the basally positioned lateral ganglionic eminence (LGE, the striatal proliferative zone). They are separated by a boundary that falls along the longitudinal axis and will be referred to henceforth as the L–C boundary (LGE–CVZ). The L–C boundary is demarcated by the transition from the cortical proliferative zone, which resembles an epithelial sheet, to the striatal proliferative zone, which has a pillow-like morphology. In addition, this boundary delimits sharply the expression of a series of regional markers expressed in the cortical proliferative zone (e.g.,Emx1 and Pax6) or the LGE (e.g.,Dlx2 and Gbx2) (Simeone et al., 1992; Bulfone et al., 1993).
These transient developmental structures give rise to markedly different territories in the mature forebrain. Both the gross cytoarchitecture and the single-cell morphology of the cortex and striatum are quite distinct. Whereas the cortex is organized into laminae (Angevine and Sidman, 1961; Boulder, Committee, 1970), in which specific cell types occupy specific layers, the striatum has a nuclear structure and only one predominant neuronal morphology (Smart and Sturrock, 1979). To understand the mechanisms by which these areas maintain such divergent patterns of organization, we focused on examining the boundary region dividing these proliferative territories.
Here we examine restrictions to tangential dispersion within the telencephalic VZ (Walsh and Cepko, 1992; Fishell et al., 1993; Liang and Walsh, 1995; Reid et al., 1995), with particular emphasis on the behavior of cells at the L–C boundary. To study this, we examine the distribution of cells within telencephalic VZ expressing a neuron-specific form of tubulin, identified with the antibody TUJ1 (Lee et al., 1990). Second, to examine the general patterns of cellular dispersion, we apply DiI focally to specific regions in telencephalic explants and examine the patterns of cell dispersion after short-term survival. Both these studies reveal that although considerable dispersion of neurons occurs within the CVZ away from the L–C boundary (Fishell et al., 1993; O’Rourke et al., 1997), little dispersion occurs within the border region. To test the cellular mechanism underlying this restriction, precursor cells from the LGE are transplanted heterotopically onto the CVZ and L–C boundary region of telencephalic explants in vitro. This experiment demonstrates that cells that are competent to migrate will not do so if placed within the L–C boundary. By apposing both boundary and nonboundary regions in vitro, we demonstrate that this restriction occurs through a contact-dependent or short-range diffusible mechanism. Together this work suggests that the integrity of the cortical and striatal proliferative zones is maintained by inhibitory cues within the L–C boundary.
MATERIALS AND METHODS
Preparation of explants. Explants were obtained from embryonic day 15–17 (E15–E17) rat embryos (Charles River, Wilmington, MA; Taconic Laboratories, Germantown, NY). The cerebral hemispheres were opened dorsally via a parasagittal cut. A telencephalic explant containing the medial ganglionic eminence (MGE), LGE, and CVZ was dissected from the rest of the telencephalon and cultured on a small tissue culture insert (Nunc, Naperville, IL, catalog #162243) in serum-free medium (DMEM/F12, N2, B27 supplements, glutamine 2 mm, mito C supplement; Collaborative Research).
Dissociation of cells and preparation of cell aggregates.Cells were obtained from either E16 or E17 rat embryos (Charles River; Sprague Dawley, Indianapolis, IN). The cerebral hemispheres were opened via a parasagittal cut, and an area containing the proliferative zone of the LGE was pinched off. The fragments were incubated for 30 min at 37°C in 1.5 ml of trypsin 0.08%–EDTA 0.02% containing 100 μl of DNase (1 mg/ml). Heat-inactivated FCS (0.5 ml) was added, and fragments were triturated using fire-polished Pasteur pipettes. Dissociated cells were washed, PKH-26-labeled (Sigma, St. Louis, MO; Xynaxis) with a concentration of PKH-26 of 1 μl/ml. The labeling reaction was stopped by washing the cells twice in DMEM containing 10% FBS. The cells were plated at a concentration of 4 × 10⁵ cells per well in serum-free medium.
When aggregates were needed, cells were resuspended in 200 μl of serum-free medium and allowed to reaggregate overnight in uncoated Terassaki wells (Nunc). Aggregates of cells were pooled, washed, and triturated three times in 1 ml of serum-free medium containing DNase. Aggregates or dissociated cells were sprinkled onto explants and allowed to settle for 1 hr, then the extra medium was removed and the explants were incubated at 37°C. Dissociated cell experiments were repeated for 52 explant preparations. For reaggregate experiments, 28 explants were examined.
As a positive control, reaggregates or dissociated PKH-26-labeled-LGE cells were placed either onto the pial (rather than the ventricular) surface of explants or onto poly-d-lysine-coated dishes. In both these cases, almost 100% of cells underwent active migration, as suggested by their elongated migratory profile.
DiI injections into explants. Explants were prepared on tissue culture inserts (Nunc) as described above. For injections, solutions of fixable DiI (Molecular Probes, Eugene, OR) were made up in EtOH (for iontophoresis injections) or in a 1:9 mixture of 11′-dioctadecyl 3,3,3′,3′-tetramethyl indocarbocyanine perchlorate (DiI; Molecular Probes) (5 mg/ml in EtOH) and 0.3 m sucrose (for pressure injections). Iontophoretic injections were made using pulled glass pipettes (20 MΩ resistance in 3 m KCl) using 10 nA current for 10 sec. Pressure injections were performed with an IM6 microinjector (Narishige, Tokyo, Japan) and micromanipulator (Narishige).
Acridine orange staining. Explants were dissected and submerged immediately in a 5 μg/ml solution of acridine orange dissolved in serum-free medium at 37°C for 30 min. After three washes in PBS, the explant was visualized for staining using fluorescent microscopy.
TUJ1 and RC-2 immunohistochemistry. Explants were prepared and cultured onto tissue culture inserts as explained above. Comparison of TUJ1 staining in tissue taken from in vivo preparation and comparably timed explants cultured in vitro demonstrated that the patterns of TUJ1 staining were indistinguishable. They were fixed for 10 min in 4% paraformaldehyde, quenched in methanol 0.3% H2O2, washed in PBS, and blocked for 1 hr in PBS containing 10% NGS and 0.5% Triton X-100. For RC-2 staining, explants were cut into 100 μm sections using a vibratome. Explants were incubated overnight in TUJ1 or RC-2 antibody diluted 1:50, containing PBS, 1% NGS, and 0.5% Triton X-100. Explants were washed three times in PBS and incubated for 1–2 hr with a peroxidase-coupled goat anti-mouse (anti-IgG in the case of TUJ1 and anti-IgM in the case of RC2) antibody (1:100). Explants were washed in PBS, and a DAB reaction was performed.
When a fluorescent secondary antibody was used, fixed explants were incubated for 1 hr in a 10% NGS blocking solution and then transferred to a solution containing 10% NGS and 1:50 TUJ1 antibody. To maintain the PKH labeling in these preparations, detergent was omitted from this procedure. No permeabilization was needed to obtain good TUJ1 staining. FITC goat anti-mouse secondary antibody was used to visualize TUJ1-positive cells.
Explant apposition experiments. Explants were prepared from both boundary and nonboundary regions taken from E17 Sprague Dawley rats. Boundary explants were defined as CVZ territories within 75 μm of the border where the cortical epithelium abruptly thickens and becomes the LGE. Nonboundary explants were defined as CVZ territories >150 μm distant from this same landmark. Taking the explants in this manner excludes the transitional zone where graded numbers of TUJ1-positive cells are seen. In each case, one of the two apposed explants was vitally stained with PKH 26 dye in a manner identical to that described above (except of course that the explants were not dissociated). This labeling procedure resulted in the outer layer of cells in the explants being brightly labeled. Explants were placed in Nunc tissue culture insert and apposed against one another, and the excess media removed. Explants were cultured from 12 to 24 hr, fixed in 4% paraformaldehyde, and stained for TUJ1 immunoreactivity (no Triton was used in these staining procedures). Apposed explants adhered to one another, allowing for easy determination of the apposition point between them. A minimum of 20 explant appositions were examined for each experimental condition discussed.
Microscopy. Both whole-mounted explants and stained sections were visualized using a cooled CCD camera (Princeton Instruments) mounted on an upright microscope (Axioscope, Zeiss). Images were acquired using Metamorph software (Universal Imaging, West Chester, PA). Double-labeling was achieved by digital superposition of pseudocolored black and white images. (See Fig 4D,E for transmitted light images superimposed onto DiI labeling.) The image of the original extent of dye application was taken from images acquired immediately after labeling and transferred digitally to the images of the point of sacrifice.
RESULTS
Marked changes occur in the pattern of tangentially oriented neurons during telencephalic VZ development
We examined the appearance of tangentially oriented neurons within telencephalic VZ regions during the early to midneurogenic period. Migratory cells have been shown to be labeled by TUJ1 (Menezes et al., 1995; O’Rourke et al., 1995), an antibody that recognizes a neuron-specific form of tubulin (Lee et al., 1990). Previous work has demonstrated in individual sections the presence of young migratory neurons within telencephalic VZ regions (Menezes and Luskin, 1994); however, the global distribution of these cells within the entire CVZ has not been determined. To do so, we used flat-mounted explants of telencephalon stained with TUJ1 antibodies. By viewing the ventricular surface, the entire population of tangentially oriented neurons within this region can be visualized simultaneously.
Examination of flat-mounted preparations stained with the TUJ1 antibody at a variety of developmental ages allowed us to infer both the initial appearance of these cells and their distribution in the CVZ. Although small numbers of tangentially oriented neurons within the CVZ were detected as early as E15 in rats, significant numbers of TUJ1 cells were observed only 1 d later (or approximately the midpoint of cortical neurogenesis).
At E16, TUJ1 cells were observed to be distributed widely within the CVZ (Fig.1A,C). The distribution of these neurons appeared not to be preferentially oriented except within the region of the L–C boundary. Here migrating neurons were oriented perpendicular to the boundary (Fig.1B,D; see Fig.4D). Notably, ∼80% of the perpendicularly aligned TUJ1-positive neurons have their leading processes oriented away from the boundary region. In addition, adjacent to the boundary region relatively fewer TUJ1 cells were observed (Fig 1B). It should be noted that we cannot rule out the possibility that some of these perpendicularly oriented neurons are crossing the L–C border from the striatum at this time.
Fig. 1.

TUJ1-positive neurons within the E16 CVZ. A, Region of the CVZ >150 μm from the L–C border, in a flat-mounted preparation (the area is similar to that in Fig. 2D–F, as seen in Fig.2A). Note that large numbers of randomly oriented TUJ1 cells are present within this region at E16. B, Area adjacent to the L–C border, where TUJ1-positive cells are preferentially aligned perpendicular to the border. This photomicrograph is also a flat-mounted preparation (in this case, the area shown is similar to that in Fig.2G,H, as seen in Fig.2A). C, Quantitation of the number of TUJ1 cells within various CVZ regions as a function of distance from the L–C border. Note that fewer TUJ1 cells were observed in regions near the border (0–75) region compared with areas away from this boundary (≥150) (F(2,12) = 10.32; p < 0.05). Also note that at E16, in the 0–75 border region, approximately three times the number of TUJ1-positive cells are observed compared with that seen 1 d later (i.e., E17) within the same region (compare Fig.2J). Data were collected by measuring five 250 μm2 areas (in five different preparations, for each of the zones quantified). D, Orientation of cells relative to the L–C border as a function of distance to from the L–C boundary. In this graph, cells oriented at 0° correspond to cells parallel to the L–C boundary. In contrast, cells oriented at 90° are positioned orthogonal to the L–C boundary. Each pointon this graph represents the orientation of a single neuron relative to the L–C boundary. Note that cells in the 0–75 group are preferentially oriented at 90°, i.e., orthogonal, to the L–C border, compared with 1 d later when they are preferentially oriented at 0°, i.e., parallel, to the L–C boundary (Fig.2J) [F(3,128) = 10.34; where the only significant difference (p < 0.01) is between the orientation of cells in the border region compared with any of the groups farther away). Quantitation was performed as described in C. Scale bars (A–D), 50 μm.
Fig. 4.
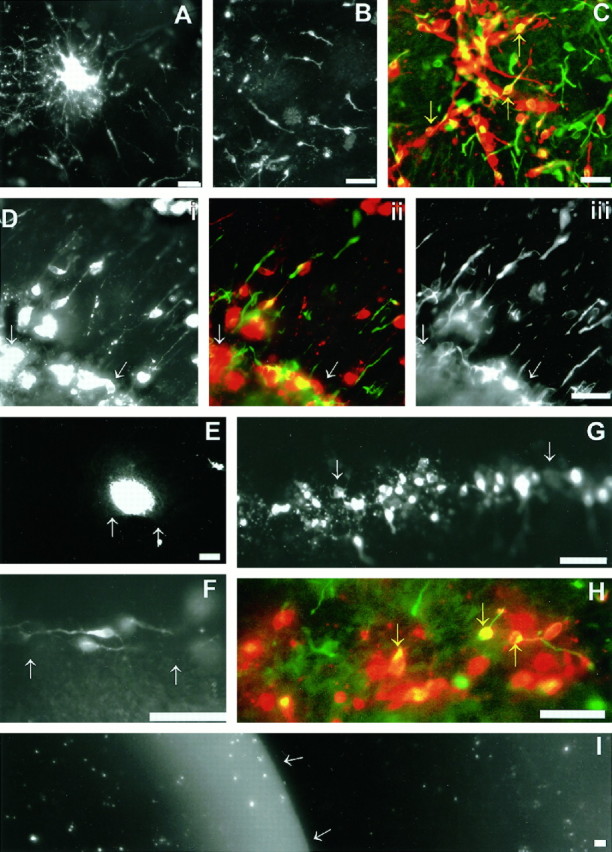
Cell dispersion of reaggregates or dissociated cells placed onto the surface of E16 and E17 telencephalic explants. A–C, Dispersion of reaggregates (A, E17) and dissociated cells (B, E17; C, E16) within the CVZ (the areas shown in these photomicrographs are comparable with the regions shown in Fig. 1D–G).B, The pattern of cell dispersion of dissociated LGE cells placed experimentally onto the CVZ is similar to that seen in TUJ1-stained explants or focal DiI applications. C, Dissociated cells on the CVZ (red) double-labeled for TUJ1 immunoreactivity (yellow ororange) or endogenous TUJ1-positive cells (green). Note that some of the dissociated cells are TUJ1-positive (yellow arrows) and that endogenous cells (green) within the explant are intermixed with transplanted PKH-26-labeled LGE precursors.Di, PKH-26-labeled LGE cells in the region of the L–C boundary of an E16 explant. Dii shows a double exposure of Di and Diii. Diii, TUJ1-stained cells in the same field shown in Di. Note that both cells placed experimentally within the L–C boundary (Di) and endogenous cells within the explant (Diii) are oriented perpendicular to the boundary region (compare this with F–H, in which the same experiment was repeated 1 d later at E17). InE, a cellular reaggregate was placed in close proximity to the L–C boundary of an E17 explant. Unlike cells in areas more distal from the boundary region (see A), cells fail to leave the reaggregate and migrate. In F, when cells were placed adjacent but not within the L–C boundary at E17, they migrate parallel to the boundary. In G and H, dissociated cells were placed experimentally within the “TUJ1-negative” L–C boundary of E17 explants. These cells extend nontapering processes, but do not migrate. H, Similar preparation to that in G, which has been stained for TUJ1. Note the double-labeled cells within the L–C boundary (yellow arrows). The presence of TUJ1 in these cells suggests that they are competent to migrate, but are inhibited from doing so by the L–C boundary. Note, however, that many of the cells shown express TUJ1 more weakly (indicated byorange rather than by yellow) than those placed in a nonboundary region. The white arrows inD–G and I indicate the position of the L–C boundary. I, A freshly isolate explant stained with acridine orange to show the pattern of apoptosis. The CVZ is the darker area to the rightof the white arrows, and the LGE is thelighter area to the left. Although cells undergoing spontaneous cell death are present, they are not preferentially localized to any region of the CVZ or LGE. The areas shown in D–I correspond to the area shown in Figure 2, G and H. Scale bar (A–I), 50 μm.
By E17, tangentially orient TUJ1 cells were still present throughout most of the CVZ, except for in the vicinity of the L–C boundary. The distribution of these cells at this time was graded, such that they were most abundant in areas distant from the L–C boundary and dwindled in number in areas adjacent to it (Fig.2D,J,L). Within 75 μm of the L–C boundary, neurons expressing TUJ1 were almost completely absent (Fig.2G,H,J–L). Furthermore, whereas neurons situated distant from the L–C boundary have no preferential orientation, those situated within 75 μm of the boundary had their cell body and leading processes preferentially aligned parallel with it (Fig. 2K). Given that 24 hr previously, neurons within this region were preferentially oriented perpendicular rather than parallel to the L–C boundary (Fig 1B,D), it appears that this period represents a time when the topographic cues within the L–C boundary are changing rapidly.
Fig. 2.
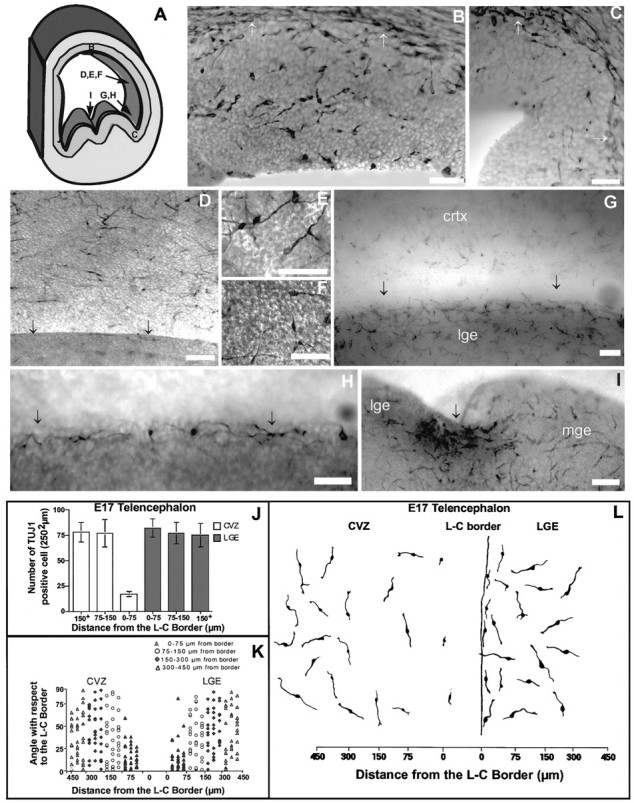
TUJ1-positive neurons within the E17 telencephalon. A, Schematic of a coronal hemisection through the telencephalon. Letters on this schematic indicate the position and orientation of the subsequent photomicrographs (B–I; in addition, Figs. 1A,B, 3A–E, 4A–I refer back to this diagram).B, C, TUJ1-positive neurons in a coronal section of E17 rats (white arrows indicate the division between the VZ and the SVZ). In B, a typical CVZ area ∼150 μm from the L–C boundary is shown. C, Photomicrograph of a coronal section through the L–C boundary region. Note that whereas TUJ1 cells are abundant in B, they are almost completely absent in C.D–G, TUJ1-positive cells within the CVZ of flat-mounted preparations. The stippled appearance of the surface (particularly in F, which is a DIC image) is the VZ surface, which has a cobblestone contour. The arrows at the bottom of D and Gindicate the position of the L–C boundary. Note that in the boundary region, TUJ1 cells are scarce. H, High-power view of the photomicrograph shown in G. I, TUJ1 cells spanning between the LGE and MGE at E17 (the LGE and MGE are marked, and the arrowhead indicates the boundary region between these areas). Note that in this boundary region, no discontinuity in the distribution of TUJ1 cells is seen. The particulate staining in the boundary between these regions is an artifact of overstaining, not a generally observable feature of this boundary. Scale bars (A–I), 50 μm. J, Number of TUJ1 cells relative to the L–C boundary within the LGE and CVZ at E17. Far fewer cells are seen in CVZ areas from 0 to 75 μm from the L–C boundary compared either with E16 (Fig.1C) or with E17 CVZ areas more distal from the boundary (i.e., >75 μm) (F(5,24) = 31.60;p < 0.001). Data were collected as indicated in Figure 1C. K, TUJ1 cells in the CVZ or the LGE are randomly oriented everywhere except in regions adjacent to the L–C boundary. Whereas cells from 0 to 75 μm from the boundary, within both the CVZ and the LGE, are preferentially oriented near 0°, cells in both telencephalic areas farther from the L–C boundary are distributed evenly at all angles between 0 and 90° (F(3,157) = 12.34; p < 0.0001 for CVZ and F(3,156) = 13.20;p < 0.0001 for LGE). Data were quantified as described in Figure 1. As in Figure 1, each point on this graph represents the orientation of a single neuron relative to the L–C boundary. L, Camera lucida drawings of representative TUJ1 cells in both the LGE and the CVZ, in regions adjacent and distant from the L–C boundary.
The presence of TUJ1-positive neurons was not limited to the CVZ. Regions of basal telencephalon, including the LGE and MGE, showed the same patterns of randomly oriented TUJ1 cells. Two differences in the patterns of tangential-oriented neurons within the dorsal versus ventral telencephalon were notable. First, these neuronal populations within the basal telencephalon preceded the appearance of similar cells within the dorsal telencephalon by ∼36 hr (i.e., at ∼E14.5). Second, the boundary region between morphologically defined proliferative zones within ventral telencephalon (i.e., the LGE and the MGE) did not appear to restrict the distribution of tangential-oriented neurons. For instance, TUJ1 cells were observed to span between the LGE and the MGE (Fig. 1I). Hence, all boundary regions within the telencephalon do not restrict cellular dispersion, making the L–C boundary perhaps unique in this aspect.
Examination of focal DiI labeling of telencephalic VZ
To assess the dynamics of tangential dispersion within the CVZ, we focally labeled E17 CVZ with DiI. To do this, we applied DiI to explants in 10 μm dots to a variety of areas within the CVZ both adjacent and distant from the L–C boundary. The results indicated that the TUJ1-positive cells provide an accurate picture of the general patterns of tangential dispersion in the telencephalon.
DiI spots applied to the CVZ in regions distant from the L–C boundary spread out from their initial distribution of ∼10 μm to encompass a 100 μm area of the CVZ within a 12 hr period (Fig.3A–C). In addition, individual cells were seen at distances up to 500 μm from the application site. Notably, dispersing cells were often not oriented orthogonal to the spot of dye application (Fig.3A–C), consistent with our previous work (Fishell et al., 1993), which suggested that dispersing cells often change direction during their movement. When explants were sectioned coronally, such that the migration of cells out into the intermediate zone could be visualized, the expected pattern of radial migration was observed (O’Rourke et al., 1992, 1995).
Fig. 3.

Focal labeling of DiI within explants of the CVZ. DiI was applied either by microinjection or by electrophoresis to the surface of E17 telencephalic explants. Explants were cultured for 12 hr and then fixed and analyzed with conventional fluorescent microscopy.A–C, Cellular dispersion 12 hr after focal DiI application to the CVZ (the areas shown in these photomicrographs are comparable with the regions shown in Fig.1D–G). Note that cells have dispersed considerable distances from the focally applied DiI spot and that these dispersed cells are not aligned orthogonal to the spot, indicating that they change direction as they disperse.D, E, Result of DiI application adjacent and within the L–C boundary region, respectively (the areas shown inD, E correspond to the area shown in Fig.1G,H). The blue outline in D and E represents the original extent of the DiI application. Note the diminished tangential dispersion of neurons in D compared with areas more distal from the L–C boundary (i.e.,A–C). Furthermore, note that inE no cellular dispersion is observed when areas within the L–C boundary are labeled. The apparent migration of cells across the L–C boundary in E is an artifact of the labeling of axonal fascicles that run deep to the ventricular surface. Scale bars (A–D), 50 μm.
In explants, the L–C boundary is morphologically apparent using transmitted light to visualized the thinner CVZ versus the thicker LGE (i.e., the CVZ transmits more light and hence appears brighter than the LGE). Focal applications of DiI in areas near the L–C boundary resulted in proportionally fewer labeled dispersed cells (Fig.3D). Labeling near the L–C border resulted in an elongated patch of labeled cells along the boundary but not across it (Fig.3D). In cases in which DiI was applied to the TUJ1-negative boundary zone, little dispersion of cells was seen and the focally applied DiI remained localized (Fig. 3E).
The L–C boundary inhibits tangential dispersion
We have demonstrated previously that LGE cells are able to integrate back into explanted preparations within 4–12 hr of being put in contact with the VZ surface in vitro. Although many of the cells applied in this way migrate radially into the explant (Fishell, 1995), a substantial proportion also disperse tangentially through the VZ. As such, this procedure provides an effective assay for investigating the topographic cues that guide dispersion in the telencephalic VZ. Although dissociated cortical cells on explants behave similarly to LGE cells (C. Neyt, unpublished observations), we used LGE cells, because, unlike cortex, it is possible to isolate ventricular populations away from the underlying intermediate zone (Fishell, 1995).
To examine whether the L–C boundary is able to influence the pattern of dispersion of heterotopically positioned cells, we placed PKH-26-labeled LGE cells randomly onto the ventricular surface of cortical explants. After 12 hr, preparations were analyzed for the morphology and migration of the LGE cells. To show that cells transplanted onto the surface of telencephalic explants were behaving like those endogenous to the host region, we compared the distribution and morphology of TUJ1 cells within host tissue with that of PKH-26-labeled LGE cells transplanted onto the CVZ. Invariably, transplanted and host cells were seen within the same plane of focus, and the morphology and distribution of these two populations looked identical (Fig.4C,D). This result established that transplanted cells are able to respond to topographic cues that normally guide tangential dispersion in explants.
In both E16 and E17 explants, LGE cells that integrated into cortical areas distant from the L–C boundary extended long leading processes (ranging from 20 to 50 μm) (Fig. 4A–C). That these cells were migrating was demonstrated by placing reaggregates of LGE neurons onto this region (n = 20). LGE cells from these reaggregates migrated out to over an area of the CVZ of up to 200 μm surrounding the reaggregate (Fig.4A). Given that preparations were left for 12 hr before fixation after reaggregates were placed on their surface, it implies that the fastest dispersing neurons migrate at a maximal rate of ∼16.5 μm/hr.
Consistent with both the DiI labeling experiments and the patterns seen in TUJ1-stained cells, in E17 explants >60% of cells placed in the CVZ extended leading processes and have the appearance of actively migrating cells. Interestingly, whereas tangentially oriented neurons are still quite prominent in E17 explants, cells with a migratory profile were significantly fewer in number compared with 1 d earlier (t = 1.577; p < 0.05).
Reflecting changes in the border’s inhibitory function, how LGE cells behaved when placed adjacent to the L–C boundary varied with age. At E16, cells placed in this region (like TUJ1 cells endogenous to this region) aligned perpendicular to the L–C boundary (Fig.4D). The orientation of both transplanted cells and endogenous TUJ1 cells was consistent with these cells undergoing active migration out of the boundary region. Notably, as in the explants stained for TUJ1 immunoreactivity, 80% of the neurons that were perpendicularly aligned in the boundary region have their leading processes oriented away from the boundary region. When these explants were left in culture for periods of 24 hr, their appearance was similar to that seen for the E17 experiments. This result supports the notion that cues in the E16 boundary region actively induce cells to migrate out of this area.
By E17, when TUJ1 cells are only sparsely present within the L–C boundary region, dissociated cells that settled within the L–C boundary region are unable to migrate or assume a migratory profile (Fig. 4G,H). These cells remain rounded and extend thin axonal-like processes (Fig. 4H). To test whether these cells were undergoing apoptosis, we stained freshly isolated explants with acridine orange (Fig. 4I). Although previous authors report that extensive cell death occurs within the VZ (Blaschke et al., 1996), we saw no evidence from our analysis to suggest that this is more prevalent within the L–C boundary.
In cases in which cells or reaggregates were placed adjacent to the boundary region, we observed that cellular dispersion from reaggregates was reduced considerably (Fig. 4E). When dispersion did occur, the migration of these cells was biased toward moving parallel with the boundary (Fig. 4F).
Inhibition to tangential dispersion within the L–C boundary mediated by a short-range diffusible signal or a contact-dependent mechanism
To assess whether inhibition to tangential dispersion within the L–C boundary is mediated by a short- or long-range signal, we apposed cortical explants in vitro from both boundary and nonboundary regions. To ensure isolation of boundary regions where little tangential migration is occurring, we confined boundary explants to areas within 75 μm of the LGE, an area where TUJ1 cells are only sparsely present. Similarly, to ensure that nonboundary regions were areas of active migration, we used explants >150 μm from the LGE. In these experiments, we vitally labeled one of the explants with the dye PKH26 to assess whether cells transited from one explant to the other. These explants were maintained in vitro from 12 to 18 hr and then fixed and stained for the presence of TUJ1-positive neurons.
Formally, the lack of tangentially oriented neurons in the boundary region could result from an inhibitory signal in the boundary region or the presence of a signal (which is absent in boundary regions) in the nonboundary region that induces tangential dispersion. As such, it is of interest to note whether nonboundary tissue induces migration in boundary tissue, as well as whether boundary tissue inhibits migration in nonboundary areas.
We found no evidence that a diffusible inhibitory signal exists in boundary regions or that a diffusible migratory stimulatory signal exists in nonboundary regions (Fig. 5). Regardless of the adjacent presence of the complementary territory, numerous TUJ1-positive cells were present in nonboundary regions and were almost completely absent in boundary regions. A sharp line separating the boundary region (where tangentially oriented neurons were scarce) from the nonboundary region (where neurons were abundant) was always observed (Fig. 5A,B). When PKH-26-labeled cells were placed on explants apposed in this manner, cells that attached to a boundary region remained round and sent out nontapering processes, but did not assume a migratory profile (Fig. 5E). In contrast, cells placed within nonboundary regions behaved identically to those endogenous to the explant (Fig.5F).
Fig. 5.
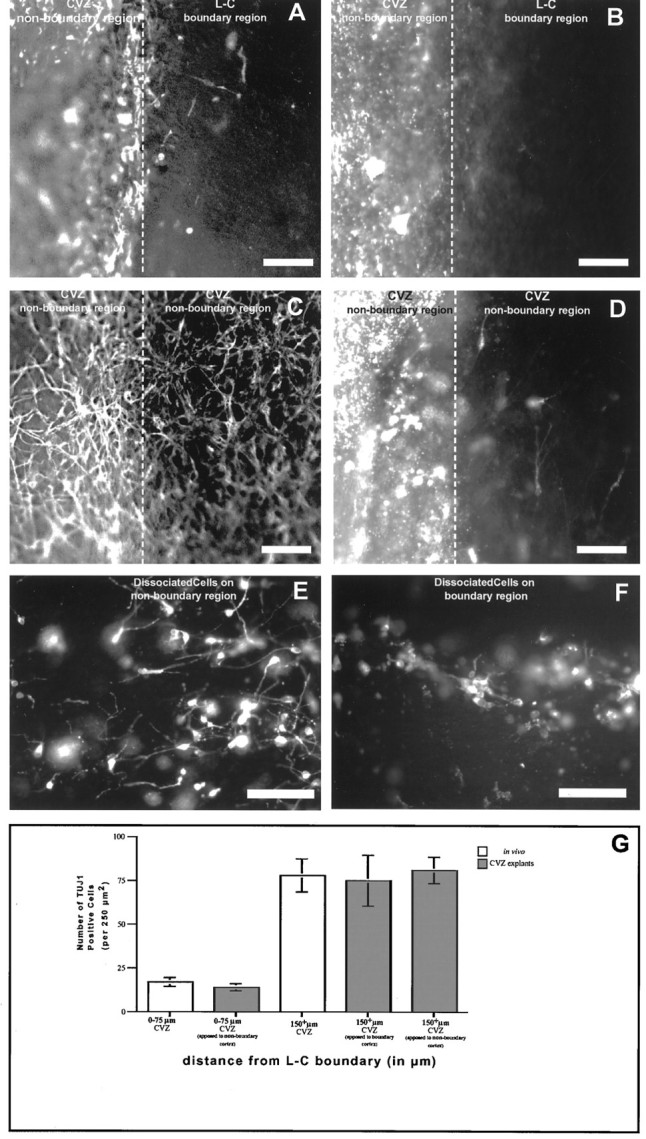
The E17 L–C border restricts tangential migration through a short-range signal. A, B, The apposition of a nonboundary CVZ region (vitally labeled with PKH-26) and L–C boundary region are shown. A shows the pattern of TUJ1 staining, and B shows PKH-26 labeling. After being in culture for 12–18 hr, migration is not observed within the L–C boundary region apposed to a CVZ nonboundary region. Similarly, migration is not diminished in a CVZ nonboundary region apposed to an L–C boundary region. This is indicated both by the absence of TUJ1 cells (A) and by the PKH-26-labeled cells (B) within the L–C boundary region and the continued presence of TUJ1-positive cells within the nonboundary region (A). This result indicates that neither a long-range diffusable signal, which induces tangential migration, exists within the nonboundary region, nor does a long-range diffusable inhibitory signal exist within the nonboundary region, which prevents tangential dispersion. C, D, The control experiment in which the apposition of two nonboundary CVZ regions has been done (one of which is vitally labeled with PKH-26). In this case, TUJ1 cell staining is maintained within both nonboundary explants. In addition, some limited migration of cells has crossed between the two nonboundary explants. The limited amount likely reflects that the damaged edge of the explants artifactually inhibits tangential dispersion. E, F, PKH-26-labeled cells that were placed respectively onto nonboundary (E) and boundary (F) regions of apposed explants. G, Quantitation of the numbers of TUJ1-positive cells in explanted boundary and nonboundary regions after being apposed experimentally. This result supports the notion that the mechanism restricting tangential migration within the L–C boundary acts over very restricted distances. When the number of TUJ1 cells in the boundary region from tissue fixed immediately after isolation is compared with that seen in CVZ boundary regions that were apposed to nonboundary regions, no significant difference is observed. Similarly, nonboundary tissue fixed immediately after isolation does not have significantly different numbers of TUJ1 cells compared with nonboundary explants apposed to either boundary or nonboundary explants. Quantitative analysis entailed examination of TUJ1 cells in five different experimental preparations in each test category. Scale bars (A–F), 50 μm.
Development of the radial glial palisade at the L–C boundary
Given the absence of TUJ1-positive cells in the L–C boundary and our previous observations that this boundary acts to restrict tangential dispersion (Fishell et al., 1993), we were interested in assessing whether this region contains a specialized cellular organization. During the period that tangential dispersion is initiated, it has been demonstrated that bundles of radial glia form a palisade that acts to shepherd newborn cortical cells through the intermediate zone and cortical plate to the ventrolateral region of cortex (Alvarez-Buylla et al., 1988; Bayer et al., 1991; Misson et al., 1991). These radial glia are in the right position to potentially act as a specialized border structure. Previous studies suggest that the glial palisade separating the LGE from the CVZ appears in the period in which we observed that tangential dispersion is initiated (Smart and Sturrock, 1979; Misson et al., 1988; Edwards et al., 1990; De Carlos et al., 1996). Using the radial glia-specific antibody RC2, we confirmed that indeed the development of this palisade correlates with the time at which significant tangential dispersion is initiated. At E15, when the first significant number of TUJ1-positive cells are visible within the telencephalon and when minimal dispersion is occurring (Fishell et al., 1993), the radial glia within the CVZ and LGE are distributed evenly (Fig.6B). Between E15 and E17, the radial glia in the region of the L–C boundary coalesce to form a palisade extending from the L–C boundary to the ventral lateral cortex (Fig. 6C), with the end feet of these glia being positioned within the L–C boundary.
Fig. 6.

Radial glial cells coalesce in the vicinity of the L–C boundary near the time tangential dispersion is initiated.A, Coronal hemisection of the forebrain (compare with Fig. 7, schematic). The stippled boxed area indicates the region shown in B and C.B, Distribution of RC2-positive cells (a radial glial marker) in the region of the L–C boundary before the initiation of tangential dispersion, at E15. C, Distribution of radial glia 2 d later in development (also visualized by RC2 staining). Note that although dense radial glia are present throughout the CVZ and LGE, in the boundary region, these radial glia form a palisade as they extend away from the VZ regions. Although we have no evidence that the radial glia in the boundary region are biochemically distinct from those in adjacent regions of VZ, their position and development correlate exactly with the region of the L–C boundary where tangential dispersion is inhibited. Arrows indicate the position of the radial glial palisade as it extends into the intermediate zone. Scale bars, 100 μm.
DISCUSSION
In this study, we examined the role regional boundaries play in restricting tangential dispersion within telencephalic VZ regions. Previous work suggested that the L–C boundary restricted the movements of cells between the proliferative zones of the dorsal and basal telencephalon (Fishell et al., 1993). Furthermore, heterotopic transplantation of precursor cells across the L–C boundary change their regional phenotype in accordance with their novel position, suggesting that such restriction is necessary to the proper regional specification of the telencephalon (Brustle et al., 1995; Campbell et al., 1995; Fishell, 1995). The present work supports the notion that during normal development, the L–C boundary inhibits the movements of precursors between VZ regions. Recently, examination of theSey (small eye/Pax6 mutant) mutant mice has provided the first genetic evidence that the L–C boundary may play an active role in maintaining regional patterning in telencephalon. InSey mice, a large population ofDlx2-positive cells are ectopically present within the cortex early in development. This suggests that the L–C boundary fails to form normally in these animals (Stoykova et al., 1996). In addition, in these animals, both the LGE and the CVZ are abnormally enlarged, consistent with the idea that failure of formation of the L–C boundary may result in improper telencephalic development.
Two independent studies have suggested that postmitotic striatal cells may migrate into the cerebral cortex during normal development (De Carlos et al., 1996; Anderson et al., 1997). This migration appears to occur not in the ventricular zone, but through migration through the postmitotic striatum into the overlying intermediate zone of the cortex (Fig. 7). Recently, Anderson et al. (1997) have provided evidence that this population represents a specific population of GABA-containing interneurons. This suggests that the production of a cortical cell type actually occurs in the striatum rather than in the cortex. This is consistent with the notion that specific cues exist locally in proliferative zones and that the restriction to migration of cells within the VZ (but not in more differentiated populations) is critical to maintaining appropriate local induction (Lumsden and Gulisano, 1997).
Fig. 7.

Schematic of cell dispersion within the telencephalon. The area demarcated by the dashed linesin the coronal section through telencephalon in the top left of this diagram indicates the region shown in the three-dimensional cut-away drawing. The LGE is indicated inlight yellow in both drawings. The CVZ is indicated ingreen, and the decreased gradient in coloring corresponds with the area within which tangential dispersion within the CVZ is inhibited at E17 (i.e., dark green, total inhibition; lighter green, reduced inhibition). Thedark green area corresponds with the zone of the L–C boundary where TUJ1-stained cells are excluded. The pattern of migration of neural cells within the VZ and through the postmitotic areas of the telencephalon is shown. Arrows within the LGE and CVZ indicate that throughout most of the telencephalon cell, dispersion appears to be unrestricted. The red trailfollowing some of the dispersing cells represents our notion of the typical migratory pattern of dispersing VZ cells. Note that near the L–C boundary, migration of dispersing cells tends to align along the boundary region and that decreased numbers of dispersing cells are seen in this region on the CVZ side of the boundary. Cells that were placed in the region of the L–C boundary of explants (dark green area) remain rounded and are able to extend only short process (see Fig. 4G,H). Cell dispersion occurs at all stages of their migration (O’Rourke et al., 1992). Beginning with tangential dispersion, we suggest that differentiating cells alternate between migration along radial glia and tangential dispersion. Note that a number of lines of recent evidence support the idea that specific populations of striatal cells may migrate to through the intermediate zone to the cerebral cortex. This is indicated by the three circled migrating striatal neurons (green) shown transiting dorsally as indicated. The large red arrows indicate the general pattern of cell migration in various regions of the telencephalon, whereassmaller red lines indicate the trajectory of individual cells. C, Cortex; CP, cortical plate;CVZ, cortical ventricular zone; IZ, intermediate zone; LCS, lateral cortical stream;LGE, lateral ganglionic eminence; MGE, medial ganglionic eminence; SVZ, subventricular zone.
Possible mechanisms of restriction at the L–C border
Three classes of mechanisms could account for the restriction to tangential dispersion at the L–C boundary: (1) the presence of a structural barrier (Snow et al., 1990), 2) the presence of inhibitory cues within the boundary region (Luo, et al., 1993; Keynes and Cook, 1995), and 3) the expression in the boundary of extracellular matrix or homotypic adhesion molecules (Moscona, 1963; Rutishauser and Jessell, 1988; Krushel and van der Kooy, 1993; Gates et al., 1995; Matsunami and Takeichi, 1995; Gotz et al., 1996). We have used in vitroheterotopic transplants to distinguish these mechanisms.
The presence of a glial palisade within the L–C boundary is consistent with the notion that tangential dispersion is constrained physically by this palisade. However, if a structural barrier were responsible for restriction to migration at the L–C boundary, the arrest of tangential dispersion at the boundary should be sharply delineated. However, within the CVZ, the inhibition to tangential dispersion appears graded. This is reflected in the decreasing numbers of tangentially oriented cells within the CVZ near the L–C boundary. Nonetheless, formally it remains possible that decreases in cell dispersion near the L–C border results from higher densities of cells in this region. Presently, we have no data to support or refute this possibility.
The decrease in the number of tangentially oriented neurons in CVZ areas near the L–C boundary is consistent with either diffusible long-range inhibitory cues or local adhesion molecules/short-range diffusible cues inhibiting migration in the L–C boundary region. Our apposition explant suggest the later possibility, that the inhibition to lateral dispersion is mediated by either a short-range diffusible cue or a contact-dependent mechanism.
At present, the molecular nature of the inhibition to tangential migration within the L–C border is unknown. Previous work suggests a number of candidates that should be tested in the future. For instance, work by a number of groups has shown that homotypic adhesion systems are active within the telencephalon throughout much of development (Krushel and van der Kooy, 1993; Gotz et al., 1996). Furthermore, a number of adhesion and extracellular matrix molecules have been reported to have high levels of expression within the L–C boundary. For example, the adhesion molecule tenascin is present in this region (Gates et al., 1995) and has been shown previously to act to inhibit migration (Wehrle-Haller and Chiquet, 1993). Similarly, a recent report has demonstrated that during a similar period in mice development, R-cadherin is present within the L–C border (Matsunami and Takeichi, 1995). In line with our suggestion that the radial glial palisade acts to mediate the inhibitory properties of the L–C boundary, it is possible that they express these or similar molecules. It will be interesting to examine whether targeted mutations of these molecules affect the integrity of the L–C boundary.
The role of tangential dispersion in development
Examination of early neurogenesis in ferret (E29) suggests cell divisions remain coherent during these phases of development (Chenn and McConnell, 1995). Furthermore, in rodents, progenitors within the VZ are joined by gap junctions into cohorts of ≥60 cells during early neurogenesis (LoTurco and Kriegstein, 1991). These observations are consistent with the movements of progenitors being constrained during this period of development. Restriction of tangential dispersion might be important for the establishment of regional identity within the telencephalic neuroectoderm, because prevention of cell dispersion during this period may be necessary to ensure the stability of positional cues (Rakic, 1988; Placzek, et al., 1993; Ericson et al., 1995; Lumsden and Gulisano, 1997).
In contrast, later in telencephalic development, cell dispersion becomes pronounced. The onset of tangential dispersion within proliferative zones correlates with a reduction in the size of the cohorts of cells joined by gap junctions (LoTurco and Kriegstein, 1991). Commencing at E15–E16, our present studies show that tangential dispersion of neurons occurs widely throughout telencephalic proliferative zones, but is restricted at the L–C boundary.
Organization and the role of the L–C border
The L–C boundary, at the time it restricts tangential dispersion, contains a specialized cellular organization. Radial glia within the intermediate zone form a palisade that acts as a preferential pathway for the migration of postmitotic neurons to the lateral cerebral cortex (Austin and Cepko, 1990; Bayer et al., 1991). We show that this radial glial palisade originates in the L–C boundary, raising the possibility that the inhibitory nature of the border results from a special property of these radial glial end feet. We suggest the radial glial palisade serves the dual functions of preventing movement of cells between the LGE and CVZ while also redirecting tangentially dispersing CVZ cells toward the lateral cortical laminae (Fig. 6). Recently, numerous lines of evidence support that striatal cells (albeit a specialized population) are able to migrate into the cerebral cortex through the intermediate zone. As such, it is unlikely that the posited role of the glial pallisade in restricting migration between the VZ regions acts to restrict migration between regional territories in the intermediate zone. Indeed, such migration may be essential for normal patterning.
We suggest the following scenario (Fig. 7). During early development, cells undergo coherent cell division with little cell dispersion. After the earliest born neurons are postmitotic, tangential dispersion commences. Final cell positioning is reached by the competing influences of tangential dispersion, radial migration, and proliferative zone boundary restrictions. Radial glia, by providing a preferential pathway for migration, act to shepherd nascent neurons along specific migratory pathways (Rakic, 1972; Smart and Sturrock, 1979; Alvarez-Buylla et al., 1988; Gasser and Hatten, 1990a,b; Gray and Sanes, 1991; Hatten, 1993; Kornack and Rakic, 1995; Rakic, 1995), whereas tangential movements of cells in the VZ (Fishell et al., 1993;Walsh and Cepko, 1993; O’Rourke et al., 1997), SVZ (Menezes and Luskin, 1994; Doetsch and Alvarez-Buylla, 1996), and intermediate zone (Gadisseux et al., 1989; O’Rourke et al., 1992; De Carlos et al., 1996; Anderson et al., 1997) act to disperse them. We suggest that the L–C boundary plays a critical role during the early specification steps occurring within the proliferative zone, by maintaining the integrity of adjacent telencephalic regions.
Together, this suggests that the L–C boundary serves two functions. First, it isolates neighboring regions, allowing environments to be maintained with distinct local cues. Second, it restricts cellular interactions at the boundary region, permitting newly postmitotic (and perhaps still mitotic) striatal and cortical cells from encountering overlapping sets of instructional cues. Although the present evidence supports only that the L–C boundary acts to restrict cell migration early in the differentiation process, evidence from work in Drosophila and examination of other borders in the CNS (such as the mesencephalic/metencephalic border) argue that borders act as important signaling centers (Bally-Cuif et al., 1992; Vincent and Lawrence, 1994). It will be interesting to test whether in addition to restricting cell movements, the L–C boundary also possesses signaling properties.
Footnotes
This work was supported by Grant NS 32993 from National Institutes of Health. We thank A. Ruiz i Altaba, M. E. Hatten, K. Zimmerman, K. Campbell, A. Schier, P. Rakic, A. Joyner, A. Alvarez-Buylla, W. Talbot, and T. O’Connor for valuable discussions and critical reading of this manuscript; R. Baker for help with the DiI injections; and A. Ruiz i Altaba for help with the summary schematic. We also thank Dr. A. Frankfurter for generously supplying us with TUJ1 antibody and Dr. D. Ellis for advice on the acridine orange staining.
Correspondence should be addressed to Dr. Fishell, Developmental Genetics Program and the Department of Cell Biology, The Skirball Institute of Biomolecular Medicine, New York University Medical Center, 540 First Avenue, New York, NY 10016.
REFERENCES
- 1.Alvarez-Buylla A, Theelen M, Nottebohm F. Mapping of radial glia and of a new cell type in adult canary brain. J Neurosci. 1988;8:2702–2712. doi: 10.1523/JNEUROSCI.08-08-02707.1988. [DOI] [PMC free article] [PubMed] [Google Scholar]
- 2.Anderson SA, Eisenstat DD, Shi L, Rubenstein JLR. Interneuron migration from basal forebrain to neocortex: dependence on Dlx genes. Science. 1997;278:474–476. doi: 10.1126/science.278.5337.474. [DOI] [PubMed] [Google Scholar]
- 3.Angevine JB, Sidman RL. Autoradiographic study of cell migration during histogenesis of cerebral cortex in the mouse. Nature. 1961;192:766–768. doi: 10.1038/192766b0. [DOI] [PubMed] [Google Scholar]
- 4.Austin CP, Cepko CL. Cellular migration patterns in the developing mouse cerebral cortex. Development. 1990;110:713–732. doi: 10.1242/dev.110.3.713. [DOI] [PubMed] [Google Scholar]
- 5.Bally-Cuif L, Alvarado-Mallart RM, Darnell DK, Wassef M. Relationship between Wnt-1 and En-2 expression domains during early development of normal and ectopic met-mesencephalon. Development. 1992;115:999–1009. doi: 10.1242/dev.115.4.999. [DOI] [PubMed] [Google Scholar]
- 6.Bayer SA, Altman J, Russo RJ, Dai XF, Simmons JA. Cell migration in the rat embryonic neocortex. J Comp Neurol. 1991;307:499–516. doi: 10.1002/cne.903070312. [DOI] [PubMed] [Google Scholar]
- 7.Blaschke AJ, Staley K, Chun J. Widespread programmed cell death in proliferative and postmitotic regions of the fetal cerebral cortex. Development. 1996;122:1165–1174. doi: 10.1242/dev.122.4.1165. [DOI] [PubMed] [Google Scholar]
- 8.Boulder Committee. Embryonic vertebrate central nervous system: revised terminology. Anat Rec. 1970;166:257–261. doi: 10.1002/ar.1091660214. [DOI] [PubMed] [Google Scholar]
- 9.Brustle O, Maskos U, McKay RDG. Host-guided migration allows targeted introduction of neurons into the embryonic brain. Neuron. 1995;15:1275–1285. doi: 10.1016/0896-6273(95)90007-1. [DOI] [PubMed] [Google Scholar]
- 10.Bulfone A, Puelles L, Porteus MH, Frohman MA, Martin GR, Rubenstein JLR. Spatially restricted expression of Dlx-1, Dlx-2, (Tes-1), Gbx-2 and Wnt-3 in the embryonic day 12.5 mouse forebrain defines potential transverse and longitudinal segmental boundaries. J Neurosci. 1993;13:3155–3172. doi: 10.1523/JNEUROSCI.13-07-03155.1993. [DOI] [PMC free article] [PubMed] [Google Scholar]
- 11.Bulfone A, Smiga SM, Shimamura K, Peterson A, Puelles L, Rubenstein JLR. T-Brain-1: a homolog of Brachyury whose expression defines molecularly distinct domains within the cerebral cortex. Neuron. 1995;15:63–78. doi: 10.1016/0896-6273(95)90065-9. [DOI] [PubMed] [Google Scholar]
- 12.Campbell K, Olsson M, Bjorklund A. Regional incorporation and site-specific differentiation of striatal precursors transplanted to the embryonic forebrain ventricle. Neuron. 1995;15:1259–1273. doi: 10.1016/0896-6273(95)90006-3. [DOI] [PubMed] [Google Scholar]
- 13.Chenn A, McConnell SK. Cleavage orientation and the asymmetric inheritance of Notch1 immunoreactivity in mammalian neurogenesis. Cell. 1995;82:631–641. doi: 10.1016/0092-8674(95)90035-7. [DOI] [PubMed] [Google Scholar]
- 14.De Carlos JA, Lopez-Mascaraque L, Valverde F. Dynamics of cell migration from the lateral ganglionic eminence in the rat. J Neurosci. 1996;16:6146–6156. doi: 10.1523/JNEUROSCI.16-19-06146.1996. [DOI] [PMC free article] [PubMed] [Google Scholar]
- 15.Doetsch F, Alvarez-Buylla A. Network of tangential pathways for neuronal migration in adult mammalian brain. Proc Natl Acad Sci USA. 1996;93:14895–14900. doi: 10.1073/pnas.93.25.14895. [DOI] [PMC free article] [PubMed] [Google Scholar]
- 16.Edwards MA, Yamamoto M, Caviness VS. Organization of radial glia and related cells in the developing murine CNS. An analysis based upon a new monoclonal antibody marker. Neuroscience. 1990;36:121–144. doi: 10.1016/0306-4522(90)90356-9. [DOI] [PubMed] [Google Scholar]
- 17.Ericson J, Muhr J, Placzek M, Lints T, Jessell TM, Edlund T. Sonic hedgehog induces the differentiation of ventral forebrain neurons: a common signal for ventral patterning with the neural tube. Cell. 1995;81:747–756. doi: 10.1016/0092-8674(95)90536-7. [DOI] [PubMed] [Google Scholar]
- 18.Figdor MC, Stern CD. Segmental organization of embryonic diencephalon. Nature. 1993;363:630–634. doi: 10.1038/363630a0. [DOI] [PubMed] [Google Scholar]
- 19.Fishell G. Neural precursors adopt regional identities in response to local cues. Development. 1995;121:803–812. doi: 10.1242/dev.121.3.803. [DOI] [PubMed] [Google Scholar]
- 20.Fishell G, Mason CA, Hatten ME. Dispersion of neural progenitors within the ventricular zone of the cerebral cortex. Nature. 1993;362:636–638. doi: 10.1038/362636a0. [DOI] [PubMed] [Google Scholar]
- 21.Gadisseux JF, Evrard P, Misson JP, Caviness VS. Dynamic structure of the radial glial fiber system of the developing murine cerebral wall. An immunocytochemical analysis. Brain Res. 1989;50:55–67. doi: 10.1016/0165-3806(89)90126-0. [DOI] [PubMed] [Google Scholar]
- 22.Gasser UE, Hatten ME. Central nervous system neurons migrate on astroglial fibers from heterotypic brain regions in vitro. Proc Natl Acad Sci USA. 1990a;87:4543–4547. doi: 10.1073/pnas.87.12.4543. [DOI] [PMC free article] [PubMed] [Google Scholar]
- 23.Gasser UE, Hatten ME. Neuron-glia interactions of rat hippocampal cells in vitro: glial-guided neuronal migration and neuronal regulation of glial differentiation. J Neurosci. 1990b;10:1276–1285. doi: 10.1523/JNEUROSCI.10-04-01276.1990. [DOI] [PMC free article] [PubMed] [Google Scholar]
- 24.Gates MA, Thomas LB, Howard EM, Laywell ED, Sajin B, Faissner A, Gotz B, Silver J, Steindler DA. Cell and molecular analysis of the developing and adult mouse subventricular zone of the cerebral hemispheres. J Comp Neurol. 1995;361:249–266. doi: 10.1002/cne.903610205. [DOI] [PubMed] [Google Scholar]
- 25.Gotz M, Wizenmann A, Reinhardt S, Lumsden A, Price J. Selective adhesion of cells from different telencephalic regions. Neuron. 1996;16:551–564. doi: 10.1016/s0896-6273(00)80074-4. [DOI] [PubMed] [Google Scholar]
- 26.Gray GE, Sanes JR. Migratory paths and phenotypic choices of clonally related cells in the avian optic tectum. Neuron. 1991;6:211–225. doi: 10.1016/0896-6273(91)90357-6. [DOI] [PubMed] [Google Scholar]
- 27.Hatten ME. The role of migration in central nervous system neuronal development. Curr Opin Neurobiol. 1993;3:38–44. doi: 10.1016/0959-4388(93)90033-u. [DOI] [PubMed] [Google Scholar]
- 28.Keynes R, Cook GM. Axon guidance molecules. Cell. 1995;83:161–169. doi: 10.1016/0092-8674(95)90157-4. [DOI] [PubMed] [Google Scholar]
- 29.Kornack DR, Rakic P. Radial and horizontal deployment of clonally related cells in the primate neocortex: relationship to distinct mitotic lineages. Neuron. 1995;15:311–321. doi: 10.1016/0896-6273(95)90036-5. [DOI] [PubMed] [Google Scholar]
- 30.Krushel L, van der Kooy D. Pattern formation in the developing mammalian forebrain: selective adhesion of early but not late postmitotic cortical and striatal neurons with forebrain reaggregate cultures. Dev Biol. 1993;158:145–162. doi: 10.1006/dbio.1993.1175. [DOI] [PubMed] [Google Scholar]
- 31.Lee MK, Tuttle JB, Rebhun LI, Cleveland DW, Frankfurter A. The expression and posttranslational modification of a neuron-specific beta-tubulin isotype during chick embryogenesis. Cell Motil Cytoskel. 1990;17:118–132. doi: 10.1002/cm.970170207. [DOI] [PubMed] [Google Scholar]
- 32.LoTurco J, Kriegstein AR. Clusters of coupled neuroblasts in embryonic neocortex. Science. 1991;252:563–566. doi: 10.1126/science.1850552. [DOI] [PubMed] [Google Scholar]
- 33.Lumsden A, Gulisano M. Neocortical neurons: where do they come from. Science. 1997;278:402–403. doi: 10.1126/science.278.5337.402. [DOI] [PubMed] [Google Scholar]
- 34.Luo Y, Raible D, Raper JA. Collapsin: a protein in brain that induces the collapse and paralysis of neuronal growth cones. Cell. 1993;75:217–227. doi: 10.1016/0092-8674(93)80064-l. [DOI] [PubMed] [Google Scholar]
- 35.Matsunami H, Takeichi M. Fetal brain subdivisions defined by R- and E-cadherin expressions: evidence for the role of cadherin activity in region-specific, cell–cell adhesion. Dev Biol. 1995;172:466–478. doi: 10.1006/dbio.1995.8029. [DOI] [PubMed] [Google Scholar]
- 36.Menezes JRL, Luskin MB. Expression of neuron-specific tubulin defines a novel population in the proliferative layers of the developing telencephalon. J Neurosci. 1994;14:5399–5416. doi: 10.1523/JNEUROSCI.14-09-05399.1994. [DOI] [PMC free article] [PubMed] [Google Scholar]
- 37.Menezes JRL, Smith CM, Nelson KC, Luskin MB. The division of neuronal progenitor cells during migration in the neonatal mammalian forebrain. Mol Cell Neurosci. 1995;6:487–485. doi: 10.1006/mcne.1995.0002. [DOI] [PubMed] [Google Scholar]
- 38.Misson JP, Edwards MA, Yamamoto M, Caviness VS., Jr Identification of radial glial cells within the developing murine central nervous system: studies based upon a new immunohistochemical marker. Brain Res. 1988;44:95–108. doi: 10.1016/0165-3806(88)90121-6. [DOI] [PubMed] [Google Scholar]
- 39.Misson JP, Austin CP, Takahashi T, Cepko CL, Caviness VS., Jr The alignment of migrating neural cells in relation to the murine neopallial radial glial fiber system. Cereb Cortex. 1991;1:221–229. doi: 10.1093/cercor/1.3.221. [DOI] [PubMed] [Google Scholar]
- 40.Moscona A. Studies on cell aggregation: demonstration of materials with selective cell-binding activity. Proc Natl Acad Sci USA. 1963;49:742–747. doi: 10.1073/pnas.49.5.742. [DOI] [PMC free article] [PubMed] [Google Scholar]
- 41.O’Rourke NA, Dailey ME, Smith SJ, McConnell SK. Diverse migratory pathways in the developing cerebral cortex. Science. 1992;258:299–302. doi: 10.1126/science.1411527. [DOI] [PubMed] [Google Scholar]
- 42.O’Rourke NA, Sullivan DP, Kazowski CE, Jacobs AA, McConnell SK. Tangential migration of neurons in the developing cerebral cortex. Development. 1995;121:2165–2176. doi: 10.1242/dev.121.7.2165. [DOI] [PubMed] [Google Scholar]
- 43.O’Rourke NA, Chenn A, McConnell SK. Postmitotic neurons migrate tangentially in the cortical ventricular zone. Development. 1997;124:997–1005. doi: 10.1242/dev.124.5.997. [DOI] [PubMed] [Google Scholar]
- 44.Placzek M, Jessell TM, Dodd J (1993) Induction of floor plate differentiation by contact-dependent, homeogenetic signals. Development 113[suppl 2]:105–122. [DOI] [PubMed]
- 45.Price M, Lazzaro D, Pohl T, Mattei M-G, Ruther U, Olivo J-C, Duboule D, Di Lauro R. Regional expression of the homeobox gene NKX-2.2 in the developing mammalian forebrain. Neuron. 1992;8:241–255. doi: 10.1016/0896-6273(92)90291-k. [DOI] [PubMed] [Google Scholar]
- 46.Puelles L, Rubenstein JL. Expression patterns of homeobox and other putative regulatory genes in the embryonic mouse forebrain suggest a neuromeric organization. Trends Neurosci. 1993;16:472–479. doi: 10.1016/0166-2236(93)90080-6. [DOI] [PubMed] [Google Scholar]
- 47.Rakic PR. Mode of cell migration to the superficial layers of fetal monkey neocortex. J Comp Neurol. 1972;145:61–84. doi: 10.1002/cne.901450105. [DOI] [PubMed] [Google Scholar]
- 48.Rakic PR. Specification of cerebral cortical areas. Science. 1988;241:170–176. doi: 10.1126/science.3291116. [DOI] [PubMed] [Google Scholar]
- 49.Rakic PR. Radial versus tangential migration of neuronal clones in developing cerebral cortex. Proc Natl Acad Sci USA. 1995;92:11323–11327. doi: 10.1073/pnas.92.25.11323. [DOI] [PMC free article] [PubMed] [Google Scholar]
- 50.Reid CB, Liang I, Walsh C. Systematic widespread clonal organization in cerebral cortex. Neuron. 1995;15:299–310. doi: 10.1016/0896-6273(95)90035-7. [DOI] [PubMed] [Google Scholar]
- 51.Rubenstein JL, Martinez S, Shimamura K, Puelles L. The embryonic vertebrate forebrain: the prosomeric model. Science. 1994;266:578–580. doi: 10.1126/science.7939711. [DOI] [PubMed] [Google Scholar]
- 52.Rutishauser U, Jessell TM. Cell adhesion molecules in vertebrate neural development. Physiol Rev. 1988;68:819–857. doi: 10.1152/physrev.1988.68.3.819. [DOI] [PubMed] [Google Scholar]
- 53.Shimamura K, Hartigan DJ, Martinez S, Puelles L, Rubenstein JL. Longitudinal organization of the anterior neural plate and neural tube. Development. 1995;121:3923–3933. doi: 10.1242/dev.121.12.3923. [DOI] [PubMed] [Google Scholar]
- 54.Simeone A, Acampora D, Gulisano M, Stornaiuolo A, Boncinelli E. Nested expression domains of four homeobox genes in developing rostral brain. Nature. 1992;358:687–690. doi: 10.1038/358687a0. [DOI] [PubMed] [Google Scholar]
- 55.Smart IH, Sturrock RR (1979) The development of the medial and lateral ganglionic eminences. In: Ontogeny of the neostriatum. 23:127–146.
- 56.Snow DM, Steindler DA, Silver J. Molecular and cellular characterization of the glial roof plate of the spinal cord and optic tectum: a possible role for a proteoglycan in the development of an axon barrier. Dev Biol. 1990;138:359–376. doi: 10.1016/0012-1606(90)90203-u. [DOI] [PubMed] [Google Scholar]
- 57.Stoykova A, Fritsch R, Walther C, Gruss P. Forebrain patterning defects in Small eye mutant mice. Development. 1996;122:3453–3465. doi: 10.1242/dev.122.11.3453. [DOI] [PubMed] [Google Scholar]
- 58.Vincent JP, Lawrence PA. Drosophila wingless sustains engrailed expression only in adjoining cells: evidence from mosaic embryos. Cell. 1994;77:909–915. doi: 10.1016/0092-8674(94)90139-2. [DOI] [PubMed] [Google Scholar]
- 59.Walsh C, Cepko CL. Widespread dispersion of neuronal clones across functional regions of the cerebral cortex. Science. 1992;255:434–440. doi: 10.1126/science.1734520. [DOI] [PubMed] [Google Scholar]
- 60.Walsh C, Cepko CL. Clonal dispersion in proliferative layers of developing cerebral cortex. Nature. 1993;362:633–635. doi: 10.1038/362632a0. [DOI] [PubMed] [Google Scholar]
- 61.Wehrle-Haller B, Chiquet M. Dual function of tenascin: simultaneous promotion of neurite growth and inhibition of glial migration. J Cell Sci. 1993;106:597–610. doi: 10.1242/jcs.106.2.597. [DOI] [PubMed] [Google Scholar]