

Abstract
In everyday life we continually need to detect signals against a background of interfering noise (the “cocktail party effect”): a task that is much easier to accomplish using two ears. The binaural masking level difference (BMLD) measures the ability of listeners to use a difference in binaural attributes to segregate sound sources and thus improve their discriminability against interfering noises. By computing the detectability of tones from rate-versus-level functions in the presence of a suprathreshold noise, we previously demonstrated that individual low-frequency delay-sensitive neurons in the inferior colliculus are able to show BMLDs. Here we consider the responses of a population of such neurons when the noise level is held constant (as conventionally in psychophysical paradigms). We have sampled the responses of 121 units in the inferior colliculi of five guinea pigs to identical noise and 500 Hz tones at both ears (NoSo) and to identical noise but with the 500 Hz tone at one ear inverted (NoSπ). The result suggests that the neurons subserving detection of So tones in No (identical noise at the two ears) noise are those neurons with best frequencies (BFs) close to 500 Hz that respond to So tones with an increase in their discharge rate from that attributable to the noise. The detection of the inverted (Sπ) signal is also attributable to neurons with BFs close to 500 Hz. However, among these neurons, the presence of the Sπ tone was indicated by an increased discharge rate in some neurons and by a decreased discharge rate in others.
Keywords: binaural masking level difference, inferior colliculus, detectability index, interaural delay sensitivity, masked threshold, rate level function
When listening with two ears, the ability to detect a target signal in a background of masking noise not only depends on the spectral and temporal characteristics of the target and the masker, as in monaural listening, but also on the interaural differences in the target and the masker. With identical noises and tones at the ears, simply inverting the waveform of the tone at one ear can reduce the detection threshold for that tone dramatically, a phenomenon known as the binaural masking level difference (BMLD) (Hirsh, 1948a; Licklider, 1948). The most pronounced BMLD is obtained when a 500 Hz tone presented binaurally, fully masked by a noise identical at the ears (No), is inverted in one ear. The tone immediately becomes audible, and its level can be decreased by 12–15 dB before it again becomes inaudible (Hirsh, 1948b). The basis of this large psychophysical effect lies in the fact that the interaural phase of low-frequency sounds is processed by brainstem neurons to provide a cue for azimuthal position (e.g., Goldberg and Brown, 1969; Guinan et al., 1972; Yin and Chan, 1990; Spitzer and Semple, 1995). Thus, changes in interaural phase that make the tone more audible are equivalent to shifting the tone away from straight ahead (where the noise is also located). The BMLD therefore provides a measure of our ability to segregate sounds on the basis of their spatial position and, thereby, to improve their detectability in the presence of interfering sounds.
It has been shown that large BMLDs are restricted to low frequencies and are sensitive to interaural phase (Durlach and Colburn, 1978). These characteristics suggest that the generation of the BMLD involves the activity of low-frequency neurons in the brainstem, which are sensitive to interaural delay (Goldberg and Brown, 1969; Guinan et al., 1972; Yin and Kuwada, 1984; Yin and Chan, 1990; Spitzer and Semple, 1995). In a recent neurophysiological study (Jiang et al., 1997), we have demonstrated that, using the most common BMLD stimuli (500 Hz tones in noise) and signal detection methods, individual delay-sensitive low-frequency neurons show BMLDs, and the masked threshold may be indicated by either an increase or decrease in their discharge rate from that attributable to the noise alone. We also found that the neurons showing the largest BMLD are not necessarily those with the lowest signal-to-noise (S/N) ratio and thus are unlikely to contribute to detection at the masked threshold. However, in that study, the noise level was variable and was set relative to the noise threshold of each neuron. This made comparisons of the S/N ratio between neurons difficult, so that it was not possible to determine the contribution of any one neuron to the threshold detection task.
To investigate the contribution of single neurons to detection at the masked threshold, and to allow generalization of responses to other standard binaural configurations, we have examined a relatively large number of inferior colliculi (IC) units from small number of experiments using 500 Hz tones (zero or π phase) masked by identical noise at a fixed level in the two ears.
MATERIALS AND METHODS
Many of the detailed methods have been described previously (Jiang et al., 1997). The recordings described in this paper were made from the inferior colliculi of five pigmented guinea pigs weighing between 300 and 400 gm. The animals were premedicated with atropine sulfate (0.06 mg, s.c.) and anesthetized with an intraperitoneal injection of urethane (1.3 gm/kg in 20% solution). Further analgesia was obtained with phenoperidine (1 mg/kg, i.m.). Supplementary doses of phenoperidine (0.5–1 mg/kg, i.m.) were given on indication provided by the pedal withdrawal reflex. All animals were tracheotomized, and core temperature was maintained at 37°C with a heating blanket. The animal was placed inside a sound-attenuating room in a stereotaxic frame with hollow plastic speculae replacing the ear bars. Pressure equalization within the middle ear was achieved by a narrow polythene tube sealed into a small hole in the bulla on each side. The cochlear condition was assessed by measuring thresholds of the cochlear action potential (CAP) to a series of short tones (0.5, 1, 2, 4, 5, 7, 10, 15, 20, and 30 kHz) in the left ear at intervals throughout the experiment, using a silver wire electrode on the round window (Palmer et al., 1986). There are two causes of raised CAP thresholds that we commonly encounter: fluid buildup in the bulla, which is promoted by the presence of the round window electrode, and systemic cochlear deterioration. Monitoring only the left ear allowed us to assess systemic and hence bilateral effects, and we made the not unreasonable assumption that in the absence of the wire electrode, fluid buildup in the right bulla would not be a serious problem.
A craniotomy was performed on the right side, extending 2–3 mm rostral and caudal of the interaural axis and 3–4 mm lateral from midline. Recordings were made with stereotaxically placed tungsten-in-glass microelectrodes (Bullock et al., 1988) advanced by a piezoelectric motor (Burleigh Inchworm IW-700/710) into the inferior colliculus through the intact cortex.
The stimuli were delivered through two sealed acoustic systems identical on each side. Each system consisted of a 12.7 mm condenser earphone (Brüel and Kjaer 4134), coupled to a damped 4-mm-diameter probe tube, which fitted into the speculum. The output was calibrated a few millimeters from the tympanic membrane using a Brüel and Kjaer 4134 microphone fitted with a calibrated 1 mm probe tube. The sound system response on each side was flat to within ±5 dB from 100 to 10,000 Hz, and the left and right systems were matched to within ±2 dB over this range.
The stimuli used in this study were tones and noises presented to the two ears. The noise used was digitally synthesized “frozen” noise with a bandwidth of 50 Hz–5 kHz and output at a sampling rate of 50 kHz via a digital–analog converter (TDT QDA2) and a waveform reconstruction filter (Kemo VBF33; cutoff slope, 135 dB/octave from 5 kHz). The same frozen noise sample was used for all units. Interaural delays of the noise were introduced by varying the time of onset of the noise to one ear during synthesis. Tonal stimuli were either from a Hewlett Packard 3325A waveform synthesizer or digitally synthesized and output from a digital analog converter (TDT QDA2) and a waveform reconstruction filter (Kemo VBF33; cutoff, slope 135 dB/octave from 5 kHz).
Single neurons were isolated using 50 msec tone and/or noise bursts as search stimuli. The extracellularly recorded neural action potentials were amplified (×1000), filtered (155–1800 Hz), converted to logic pulses by an amplitude discriminator, and timed with 10 μsec resolution (CED 1401 plus). The lowest binaural threshold to interaurally in-phase tones and the frequency at which it was obtained [the best frequency (BF)] were determined audiovisually.
The following analyses were performed in the present study.
Noise delay functions. Noise delay functions (NDFs) were measured by presenting the noise with interaural time disparities over a range equal to three times the period of the BF of the neuron, in 52 equal delay steps, starting from ipsilateral leading. The duration of the stimulus was 333 msec, with three repetitions giving 1 sec stimulation time at each delay. The noise level was arbitrarily chosen at 7–15 dB above No noise threshold at which a reasonable No-driven response and a well tuned noise delay function could be obtained. The interaural time delay (ITD) corresponding to the maximum discharge rate is denoted as the noise best delay (NBD). In some cases, the NDFs had two or more large peaks situated at large positive and negative delays with a trough at zero delay. In these cases, the NBD was designated as the delay of the largest peak close to zero delay, in the range of contralateral leading ITDs.
Masked rate level functions. Masked rate level functions (MRLFs) were obtained by measuring tone rate level functions in the presence of a noise masker at the fixed level of 23 dB SPL/ . Tone rate level functions were generated by presenting tones (50 msec duration; rise–fall time, 1 msec) and noise (5 kHz bandwidth) simultaneously gated and varying the level of the tone pseudorandomly over a maximum range of 100 dB in 1 dB steps. Possible order effects were minimized by ensuring that each stimulus was never >50 dB weaker than the one preceding it. The number of spikes elicited by each tone was counted, and the average MRLF was computed from 10 presentations at each level at 5/sec. The frequency of the tone used was 500 Hz either interaurally in phase (So) or out of phase (Sπ).
Determining the masked threshold from the MRLFs. To determine the masked threshold for a tone from the MRLF, we used an analysis technique derived from signal detection theory (Green and Swets, 1966). Such techniques have already been widely used in the analysis of the responses of auditory nerve fibers (e.g., Delgutte, 1987; Winslow and Sachs, 1987; Viemeister, 1988; Rice et al., 1995). However, here we use a modification of these methods, because the classic detectability index (d′) metric assumes that the responses of the neurons are normally distributed with equal variances, an assumption that does not necessary hold for the discharge characteristic of auditory nerve fibers (Teich and Khanna, 1985; Young and Barta, 1986) or, for that matter, other neurons in the auditory pathway. Accordingly, we used a modified version of d′, the standard separation (D), described by Sakitt (1973). This index gives a simple interpretation of discrimination that is independent of any assumptions about the underlying distributions. The calculation of D is described in the following equation:
| Equation 1 |
where R(n + s) andR(n) are, respectively, means for the distribution of the response to the signal-plus-noise masker and to the noise masker alone, and SD(n) andSD(n + s) are the SDs of the respective response distributions. Random rating would produceD = 0, and perfect discrimination would produce an infinite D. For our purposes, the masked threshold for a tone in noise was defined as the lowest level at which D had an absolute value of 1.0, and a positive BMLD is defined where the masked threshold for Sπ tones is lower than that for So tones.
RESULTS
To investigate the contribution of single neurons to signal detection under the most commonly used binaural masking situation, NoSo and NoSπ with signal at 500 Hz, we took the following measures to reduce the interanimal discrepancies: (1) We used a small number of animals (five guinea pigs) that have a similar body weight ranging from 318–394 gm (mean ± SD, 353.2 ± 27.2 gm). The CAP thresholds for 1000 Hz tone bursts was similar across the five animals (±5 dB) and was monitored at intervals throughout each experiment. (2) We recorded from as many units as possible in each single animal. A total number of 121 units were recorded, and the numbers of units taken in each animal were 22, 29, 11, 32, and 26, respectively. We used physiological criteria (short latency, crisp nonhabituating, often tonic responses, and delay sensitivity) to ensure that recordings were made in the central nucleus of the inferior colliculus (ICC) and confirmed the location of the recording site to within ICC by histological reconstruction of the position of electrolytic lesions made in the last recording sites. If the BF of any unit was <2500 Hz, it was included in the analysis.
The thresholds of the units and their relationship to the masking noise level
The BF of the 121 units ranged from 100 to 2330 Hz, and Figure1A shows their distribution. The majority (78.5%, 95 of 121) of units had BFs between 200 and 1000 Hz. Figure 1B compares BF tone-evoked (filled circles) and noise-evoked (open circles) thresholds. Tone and noise thresholds were measured binaurally with zero interaural delay (So and No). Both thresholds are expressed in decibels SPL with noise threshold expressed as noise spectral density (Jiang et al., 1997). Three major features are apparent. First, thresholds for both tones and noise decreased with increasing BF, as expected from the audiogram of the guinea pig. Second, at any frequency, the thresholds of different neurons are scattered within a ±10 dB range, with some units having extremely high thresholds for tone and/or noise. Third, there is a consistent separation between tone and noise thresholds across frequency.
Fig. 1.

A, Histogram of the BF distribution of 121 units. B, Threshold levels for binaurally presented BF signals and No noise. C, Difference between No level and noise threshold plotted against the BF of the units.D, Histogram showing the level of the No noise with respect to noise threshold for the 121 units.
In this study, when the binaural configurations NoSo or NoSπ were used, the noise level was set at a fixed value of 23 dB SPL/ , regardless of the No threshold of the single unit. Figure 1C plots the difference between the masking noise level and the No threshold against the BF of each unit. The majority of units had No thresholds below the level of the noise masker, as indicated by a positive value in Figure 1C. Only 9% of units had their No threshold ≥3 dB above the noise-masker level (Fig.1D), and most of these units had BFs <300 Hz. Thus, the majority of neurons were activated by the level of No noise presented.
The response characteristics to NoSo and NoSπ
An example of the analyses for a single neuron, with a BF of 950 Hz, is shown in Figure 2. The neuron responded best to noise (NBD; Fig. 2A) and to 500 Hz tones (Fig. 2B) when the interaural delay was close to zero. When driven with identical noises at each ear (zero interaural delay, No), this unit showed very different responses to increasing levels of the 500 Hz tone, as can be seen in its MRLFs in Figure 2, C and D. In response to 500 Hz tones with identical phase (So), the discharge rate increased as the tone level was increased, once a threshold level was exceeded. In contrast, when the phase of the 500 Hz tone in one ear was inverted (Sπ), the discharge rate decreased steadily as the tone level was increased beyond a threshold value and then increased again at higher tone levels. For this unit the first indication of the presence of the 500 Hz tone was, therefore, an increased discharge rate for So signals and a decrease for Sπ signals.
Fig. 2.

Complete profile of responses of a single inferior colliculus neuron. A, Noise delay function.B, Interaural phase difference histogram for 500 Hz tones measured using binaural beats (Kuwada et al., 1979).C, Masked rate-versus-level function for NoSo.D, Masked rate-versus-level function for NoSπ. The binaural configurations are linked to the delay functions inA and B by arrows.
The masked threshold at 500 Hz was estimated by applying the standard separation D metric to the MRLFs. Figure3 shows examples of two units. The full MRLFs to So and Sπ 500 Hz tones are illustrated in Figure 3,A and B. The unit in Figure 3A showed an increase in discharge rate for So and a decrease followed by an increase for Sπ as the level of the tones were increased. The unit in Figure 3B showed increases in discharge for both So and Sπ tones. Figure 3, C and D, shows the standard separation (D) as a function of tone level, and thearrows indicate the tone levels at which a value of ±1.0 was obtained. These “masked thresholds” are also indicated byarrows in Figure 3, A and B, and are plotted in the insets. These insets show that, despite the differences in their rate level functions, a BMLD was measurable for each of these units, and that in both cases the Sπ tones were detectable at a lower sound level than So tones.
Fig. 3.

Use of the standard separation analysis to determine the masked thresholds for two inferior colliculus neurons (A, B). Rate-versus-level functions are shown for So (filled circles) and Sπ (open squares) 500 Hz tones in the presence of noise in the same phase (No) at the two ears. The discharge rates over the first 10 dB of the rate-versus-level function were used to estimate the mean and SD of the discharge rates attributable to the noise alone. The standard separation values are plotted for each 1 dB step in tone level in (C, D). The criterion of a D value of 1.0 was used to determine the minimum sound level at which a response to the tone (either an increase or a decrease in the discharge rate) could be detected (i.e., the masked threshold). The masked thresholds are shown by the arrows in C andD, and these are replotted in the insetsof A and B.
As illustrated in Figure 3, we have divided MRLFs into two groups, based on whether increases or decreases in discharge rate were first observed as the tone level was increased. Type P MRLFs showed an increase in discharge rate as the tone level was increased and gave aPositive D value of 1 at masked threshold (Fig. 3, MRLF for NoSo in A, MRLFs in B). Type N MRLFs showed a reduction in discharge rate as tone level was increased and gave a Negative D value of −1 (Fig. 3A, MRLF for NoSπ). This classification is independent of whether the signal was So or Sπ; in other words, in different units we have found that the presence of the tone was indicated by discharge rate increases for both So and Sπ (type P/type P), decreases for both (type N/type N), decreases for So and increases for Sπ (type P/type N), or decreases for Sπ and increases for So (type N/type P). In the present study, for NoSo, 61.2% of units showed type P MRLF, 28.9% showed type N MRLF, and 9.9% of units showed no significant increase or decrease in the discharge rate from those evoked by noise alone even at highest signal level. In contrast to NoSo, for NoSπ, the type P, type N, and unchanged MRLFs accounted for 36.4, 57.9, and 5.8% of the total number of units, respectively. We have previously demonstrated that the type of MRLF is entirely consistent with the delay sensitivity of the neuron (Jiang et al., 1997).
Masked threshold for NoSo and NoSπ
Figure 4A shows the masked thresholds for So and Sπ tones obtained from 121 single units in five guinea pigs. Two features are clear from this plot: (1) the lowest masked thresholds for both So and Sπ 500 Hz tones were obtained in the frequency region at ∼500 Hz; and (2) the Sπ masked thresholds (open squares) were generally lower than the So masked thresholds (filled circles). To emphasize this latter point, we have averaged separately the masked thresholds for the So and Sπ populations and plotted these averages in Figure4B. On average, Sπ masked thresholds were 5.5 dB lower than So masked thresholds. However, in any detection task subjects presumably respond at the lowest signal level that evokes a detectable change in the neural output. In the BMLD task, the lowest estimate of the masked threshold will be provided by the neurons at ∼500 Hz. We have, therefore, averaged the masked thresholds for So and Sπ from the 300–800 Hz region (Fig. 4A, dashed lines) and plotted them in Figure 4C. These masked thresholds are somewhat lower than those obtained by averaging the whole population, but the Sπ threshold remained lower than the So threshold (by 6.6 dB).
Fig. 4.

Masked thresholds for So and Sπ 500 Hz tones in No noise as a function of the neuron BF. A, Masked thresholds across a population of low-frequency inferior colliculus neurons pooled from five guinea pigs for 500 Hz tones in So (filled circles) and Sπ (open squares) configurations in the presence of a fixed level (23 dB SPL/ ) of No noise. The dashed lines indicate the region from 300–800 Hz centered around the tone frequency of 500 Hz, which is marked by an arrow. B, The average of all of the masked thresholds across this population is plotted for So (filled circles) and for Sπ (open squares). The difference between these values is significant at the p < 0.001 level by Student’st test. C, The average of the masked thresholds from the frequency range 300–800 Hz, indicated by thedashed lines in A, is plotted for So (filled circles) and for Sπ (open squares). The difference between these values is significant at the p < 0.001 level by Student’s ttest.
The relationship between the type of MRLF and the masked threshold is shown in Figure 5. The relative proportions of units giving type P, type N, and unchanged MRLFs are shown by the histogram of Figure 5A. The average masked thresholds for So and Sπ tones among units yielding type P and type N MRLFs are plotted in Figure 5B. Taking first the responses to the So tones shown by the black bars and dots, units that demonstrated a type P MRLF led to a lower average masked threshold (65 dB SPL) than did those yielding type N MRLF (69 dB SPL). The average masked threshold for Sπ signals (white barsand squares), among units yielding type P MRLF, is only 1 dB lower (64 dB SPL) than for the lowest So masked threshold. The average masked threshold for 500 Hz Sπ tones, among those units yielding a type N MRLF (60 dB SPL), is the lowest of all conditions.
Fig. 5.
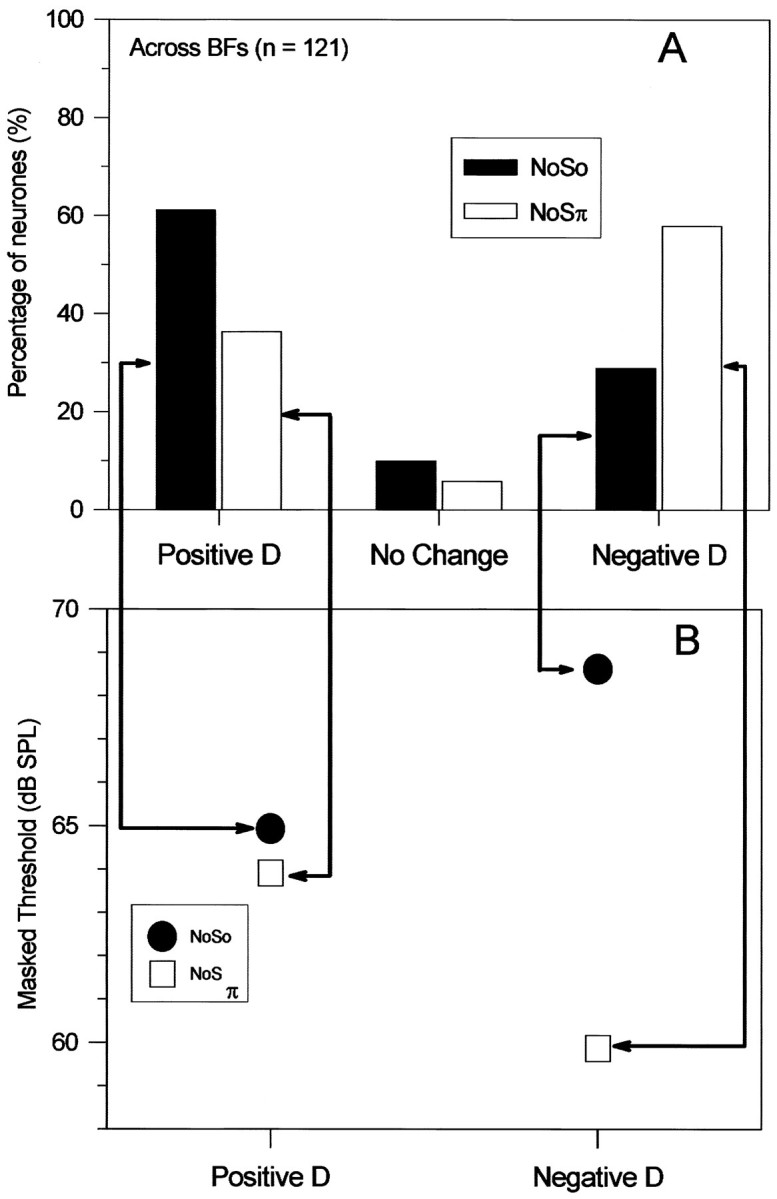
Proportions of neurons showing increases or decreases in discharge rate at masked threshold and their average masked thresholds. A, Histogram of the number of units in our population that yielded positive (type P) or negative (type N)D values at the masked threshold in response to So (filled bars) or Sπ (open bars) 500 Hz tones. B, Averages of the masked thresholds for So (filled circles) and Sπ (open squares) tones computed separately for units yielding positive and negative D values, as indicated by thearrows from the histogram bars to the corresponding masked thresholds.
Detecting the So and Sπ under the masking conditions
Although the averaged masked threshold for each binaural condition and the magnitude and direction of the BMLD are indicative of the encoding ability of IC neurons for NoSo and NoSπ, it is obvious that those units with high masked threshold for one of the two configurations will not contribute to the signal detection of the configuration concerned. Instead, for a fixed level of masking noise, the relative masked thresholds of the units would be more indicative of their contribution to the detection of the tonal signal. The units with the lowest masked thresholds presumably mediate the detection of the tone. However, the S/N ratio at which guinea pigs can detect the tones masked by a noise is unknown. Thus, we have arbitrarily taken the S/N ratio at which 5–8% of neurons were responding to the signals as a likely indication of the behavioral masked threshold.
Figure 6 plots the Dvalues of 121 units against their BFs for NoSo (Fig.6A) and NoSπ (Fig. 6B). In each case, the signal level was 50 dB SPL. The S/N ratio within the frequency channel at 500 Hz is 0 dB, calculated according to the effective bandwidth of 200 Hz with a center frequency at 500 Hz (guinea pig data; Evans et al., 1992), or 37 dB by merely taking the difference between the tone level and the noise spectral density at 500 Hz. For NoSo, 6.6% units (8 of 121) showed significant changes in their discharge rate, as illustrated by their D values (≥1). Two features are noteworthy: (1) all of the significant changes were attributable to increases in discharge rate from those evoked by the No noise alone, i.e., units with type P MRLFs for NoSo; and (2) the BFs of the units that showed significant changes in their discharge rate were close to 500 Hz (the signal frequency). For the same S/N ratio, the response of same group units to NoSπ is shown in Figure6B. In contrast to NoSo, more units (14%) showed a significant change in their discharge rate, and among them, half showed an increase (D ≥ 1, type P MRLF) and half showed a decrease (D ≤ −1, type N MRLF) in their discharge rate. If we assume that this S/N ratio is close to the threshold for NoSo, Figure 6 would be consistent with the psychophysical paradigm in which the signal becomes detectable again when the phase of the signal at one ear is inverted. In Figure 6B, the BFs of units that showed significant changes in their discharge rate are also close to 500 Hz.
Fig. 6.

Population profiles of detectability. Here we have taken two arbitrary signal-to-noise ratios, which are likely to provide an indication of the activity in the IC when signals are close to the behavioral threshold for the guinea pig. The standard separationD is plotted against BFs for 121 units for NoSo and NoSπ for within-channel S/N ratios of 0 (A,B) and −5 dB (C, D) (see Materials and Methods for details).
In Figure 6, C and D, the signal level was 5 dB lower than in Figure 6, A and B (i.e., 45 dB SPL) to give a within-channel S/N ratio of −5 dB. For NoSo, only two units had D values slightly >1 (Fig. 6C). For NoSπ, 8.3% of units (10 of 121) still showed the significant change in their discharge rate. Interestingly, both increase in discharge rate (five units) and decrease in discharge rate (five units) were observed.
Relationship between signal detection and delay sensitivity
In the discussion of our previous study (Jiang et al., 1997), we suggested that the detection of So and Sπ signals may be attributed to different units, and the role of individual neurons in a specific detection task (NoSo or NoSπ) was related to their delay sensitivity. However, because in that study we optimized the noise level to obtain data from each and every unit, we were unable to make definitive statements about the relative contribution of units to detection for the So and Sπ signals. Here by the use of a single noise level we are able to assess properly the contribution of each unit to detection.
As illustrated in Figure 6, for an S/N ratio of 0 dB, when Sπ tones were presented, 17 units (14%) showed significant changes (increase or decrease) in the discharge rate evoked by the No noise alone. At this same tone level eight units increased their No evoked discharge when presented with So signals. Of the eight units that increased discharge to So signals, only two of these were also among the 10 units responding to Sπ with a decrease, and three were among those units responding to Sπ with an increase in discharge. This result indicates that few of the units that respond to low-level Sπ signals also contribute to So signal detection.
At a within-channel S/N ratio of −5 dB, the three units still responding to the Sπ signal with increases in their discharge rate did not respond to So signals (even at 0 S/N ratio). Two units that responded to both the So and Sπ signals at a within-channel S/N ratio of 0 dB were still among the six units showing significant decreases in discharge rate to low levels of Sπ signal. This is attributable to the fact that both units had a low masked threshold for the Sπ signal, although one of them showed only a small BMLD.
We demonstrated in our earlier paper (Jiang et al., 1997), that the response of an individual neuron to BMLD signals was consistent with their delay sensitivity. Here we are able to extend this result to show that the contribution of a neuron to detection in BMLD tasks is also consistent with their delay sensitivity. Figure7 shows the masked thresholds for NoSo and NoSπ plotted against the NBD for those units, showing significant changes in their discharge rate at 0 dB S/N ratio. The different response characteristics are indicated by different symbols. Each unit provides a pair of symbols and is marked by a number. Three features can be observed: (1) although the units with type P response at low So signal levels (filled round symbols on or below dashed line) had widely distributed NBDs [from 180 μsec (unit 6) to 2300 μsec (unit 14)], most of their NBDs were within 650 μsec; (2) the units with type P response to low Sπ signal levels (open round symbols on or below dashed line) had relatively long NBDs (from 600 μsec to 2300 μsec); units 12 and 13 showed large, positive BMLDs and responded to Sπ signal at a within-channel S/N ratio of −5 dB but did not respond to So signal at a within-channel S/N ratio of 0 dB; and (3) the units with type N responses to low Sπ signal levels (open squares on or below dashed line) had relatively short NBDs (from 0 to 200 μsec). Many of these units had a type P–type N response to NoSo and NoSπ and a large, positive BMLD (units 1–4 and 8). Two units showed significant changes for both NoSo and NoSπ (units 6 and 7), and each had a small, positive BMLD.
Fig. 7.

Masked thresholds for NoSo and NoSπ plotted against the NBD for those units in Figure 6 with significant changes in their discharge rate. Thresholds for NoSo and NoSπ for a single unit are indicated by the same number.Dashed line, S/N ratio = 0 dB; dotted line, S/N ratio = −5 dB.
DISCUSSION
Generality of results
We set out to determine the contribution of single IC neurons to the detection of 500 Hz tones masked by identical noise at the two ears (No). The results suggest that (1) the neurons involved in both So and Sπ threshold detections were those with their BFs close to 500 Hz, the signal frequency; (2) detection of the So signal and Sπ signals is largely attributable to different populations of units; (3) detection of So signals was mainly by those units with a type P response and with a relatively short best delay (NBD within 650 μsec); and (4) Sπ signals were detected by two groups of units: units with a type P response and a relatively long best delay (NBD > 600 μsec) and units with a type N response and a relatively short best delay (NBD < 400 μsec).
Even restricting the analyses to the bare minimum, we needed to pool across animals to obtain sufficient data to make the points about the ensemble response. The alternative approach is to measure the responses of each individual unit extensively. This we reported in earlier studies (McAlpine et al., 1996; Jiang et al., 1997), in which we were able to measure the responses to different levels of noise masker, to different noise interaural configurations, and to different tone frequencies. The data from both the present population study and the earlier single-neuron studies are consistent in linking responses to the sensitivities of individual neurons, and thus it seems likely that the present data should provide a basis for predicting the responses to other binaural configurations.
The implications of these results for current theories of binaural processing in the higher central auditory system are discussed below.
Comparison with models of the BMLD and previous physiological studies
One major class of models that describe the processes underlying the BMLD consists of equalizing the amplitude of the waveforms at the two ears and then performing a differencing operation. This results in a cancellation of the components identical at the two ears, leaving the nonidentical components (Durlach, 1963). Although this approach accounts for many of the properties of the BMLD, it is not firmly anchored in the known physiology. A more physiological approach involves filtering the waveforms at each ear into a series of frequency channels based on psychophysical measures of auditory filters (Stern and Colburn, 1978). The outputs of the channels at the same frequency from the two ears are then cross-correlated (replicating the action of coincidence detectors known to exist in the brainstem). The second dimension of the model is the interaural delay. The signal is detected as a change in the correlation in any frequency channel at any point along the delay axis. For a wide-band noise presented binaurally, the cross-correlation model produces the largest response at zero interaural delay across all the frequency channels. The addition of 500 Hz tones presented in identical phase at the masked threshold produces a small increase around zero interaural delay in the 500 Hz channel. Adding a low-level So signal does not disrupt the interaural phase difference established by No noise; rather, the signal is detected as an increased correlation in the signal frequency channel. In contrast, an additional Sπ signal causes variations in the interaural phase differences established by the No noise. This variation in interaural phase difference results in a desynchronization and thus a reduction in the correlation attributable to the No noise, as indicated by a decrease in the output at approximately zero interaural delay and an increase in the output at interaural delays of ∼1000 μsec (half of the signal period). In this model, the BMLD results from an asymmetry in the effects of the So and Sπ signals. Because the Sπ signals have a larger effect in reducing the correlated activity than the So signal has in increasing the correlation, it is more detectable. Note that the BMLD results from computations within a single frequency channel at the signal frequency.
To relate the model to the physiological measurements, the internal delay axis could be regarded as an array of binaural delay-sensitive neurons with different best interaural delays (Yin et al., 1987). The increase or decrease in the output of the cross-correlation model predicts increases or decreases in the discharge rate, caused by the addition of the signal.
The predictions made by the model are qualitatively consistent with our current data. Both the cross-correlation model and our data have shown that the detection at threshold is restricted to a single frequency region: the units with BFs of <250 and >800 Hz did not contribute to the detection of 500 Hz signals. For some of these low-BF units the noise was below threshold (Fig. 1). Our data also show that the So signal was detected by IC units with a type P response, equivalent to an increase in the number of coincidences, as predicted by the cross-correlation model. Both type P and type N responses were observed for NoSπ; neurons giving type N responses had NBDs close to zero, whereas those giving type P responses had relatively long NBDs (Fig.7). This is equivalent to the model prediction of a decrease in the number of coincidences around zero interaural delay and an increase at longer delays at the masked threshold for NoSπ.
There have been surprisingly few studies of the neural basis for the BMLD. Neither Langford (1984) at the medial superior olive nor Caird et al. (1989) at the IC provided convincing evidence for differential responses to the So and Sπ tones in No noise, although both provided indications that the unit responses were linked to their delay sensitivities and that Sπ tones could decrease the noise evoked discharge. Later studies (Caird et al., 1991; McAlpine et al., 1996) using methods to estimate No masked thresholds for So and Sπ did indicate binaural unmasking in single-unit responses, but the methods were flawed and did not generalize well to tones other than at BF. Finally, Jiang et al. (1997), using the same signal detection approach as we have used in the present study, provided good evidence of binaural unmasking that was entirely consistent with the unit delay sensitivity and was evident for signals not at the BF (i.e., 500 Hz tones). This latter study suggested that different populations of neurons contributed to detection of So and Sπ tones, but was not appropriately designed to directly test this hypothesis.
In that study, although we were able to demonstrate the magnitude, direction, and value of the masked threshold for single units, we were not able to show unequivocally the role of each single unit in signal detection. However, the results did show that the lowest S/N ratio for detectability of So was shown by units with best delays close to zero, and the threshold was indicated by an increase in discharge rate from that to the No noise. For Sπ, the lowest S/N ratios among type P responses corresponded to those neurons with relatively long NBDs, whereas, for type N responses, the lowest S/N ratios were among those neurons with NBDs close to zero. We predicted that units that showed large BMLDs would only be involved in signal detection for the configuration for which its masked threshold was lowest. This prediction is supported by the current study. The only units that were involved in both So and Sπ detection were those that showed small-magnitude BMLDs (Fig. 7, units 6 and 7), although the direction was still consistent with the psychophysics.
Possible physiological mechanisms for detecting signals masked by noise and the basis of the BMLD
In the computational models of the BMLD (as described above) detection of either So or Sπ tones in No noise requires only a significant alteration in the response anywhere in the ensemble of units with different delay sensitivities and best frequencies. The Sπ signals generate a larger change than equal level So signals and thus are more detectable. Our data indicate that the alterations in neural discharge necessary for such a detection mechanism do occur.
However, a second possibility, also consistent with the present data, is that the reduction in the discharge rate of the majority of neurons to Sπ signals and the increased activity of the relatively fewer neurons act in concert to enhance detection. The effective contrast in neuronal activation between these two populations contributes to the Sπ signal audibility. The relatively small population of neurons that produce an increased discharge would have more salience against a background of neuronal activation that is lower than that evoked by the noise alone; i.e., the internal S/N ratio is higher. For So signals the vast majority of neurons show an increase in discharge rate with increasing signal level, which becomes detectable when the discharge rate is increased significantly above the noise-evoked rate; i.e., the internal S/N ratio is smaller than for Sπ signals.
Footnotes
Correspondence should be addressed to Alan Palmer, Medical Research Council Institute of Hearing Research, University of Nottingham, University Park, Nottingham NG7 2RD, UK.
Dr. Jiang’s present address: Department of Otorhinolaryngology, Derby Royal Infirmary, Derby DE1 2QY, UK.
REFERENCES
- 1.Bullock D, Palmer AR, Rees A. A compact and easy to use tungsten-in-glass microelectrode manufacturing workstation. Med Biol Eng Comput. 1988;26:669–672. doi: 10.1007/BF02447511. [DOI] [PubMed] [Google Scholar]
- 2.Caird D, Pillman F, Klinke R. Responses of single cells in the cat inferior colliculus to binaural difference signals. Hear Res. 1989;43:1–24. doi: 10.1016/0378-5955(89)90055-5. [DOI] [PubMed] [Google Scholar]
- 3.Caird DM, Palmer AR, Rees A. Binaural masking level difference effects in single units of the guinea pig inferior colliculus. Hear Res. 1991;57:91–106. doi: 10.1016/0378-5955(91)90078-n. [DOI] [PubMed] [Google Scholar]
- 4.Delgutte B. Peripheral processing of speech information: implication from a physiological study of intensity discrimination. In: Schouten MEH, editor. The psychophysics of speech perception. Nijhoff; Dordrecht: 1987. pp. 333–353. [Google Scholar]
- 5.Durlach NI. Equalization and cancellation theory of binaural masking-level differences. J Acoust Soc Am. 1963;35:1206–1218. [Google Scholar]
- 6.Durlach NI, Colburn HS. Binaural phenomena. In: Carterette EC, Friedman MP, editors. Handbook of perception, IV, Hearing. Academic; New York: 1978. pp. 365–466. [Google Scholar]
- 7.Evans EF, Pratt SR, Spencer H, Cooper NP. Comparisons of physiological and behavioural properties: auditory frequency selectivity. Adv Biosci. 1992;83:159–169. [Google Scholar]
- 8.Goldberg JM, Brown PB. Response of binaural neurons of dog superior olivary complex to dichotic tonal stimuli: some physiological mechanisms of sound localization. J Neurophysiol. 1969;32:613–636. doi: 10.1152/jn.1969.32.4.613. [DOI] [PubMed] [Google Scholar]
- 9.Green DM, Swets JA. Signal detection theory and psychophysics. Krieger; New York: 1966. [Google Scholar]
- 10.Guinan JJ, Guinan SS, Norris BE. Single auditory units in the superior olivary complex I. Responses to sounds and classifications based on physiological properties. Int J Neurosci. 1972;4:101–120. [Google Scholar]
- 11.Hirsh IJ. The influence of interaural phase on interaural summation and inhibition. J Acoust Soc Am. 1948a;20:536–544. [Google Scholar]
- 12.Hirsh IJ. Binaural summation and interaural inhibition as a function of the noise level of the masking noise. Am J Psychol. 1984b;56:205–213. [PubMed] [Google Scholar]
- 13.Jiang D, McAlpine D, Palmer AR. Responses of neurones in inferior colliculus to binaural masking level differences stimuli measured by rate-versus-level functions. J Neurophysiol. 1997;77:3085–3106. doi: 10.1152/jn.1997.77.6.3085. [DOI] [PubMed] [Google Scholar]
- 14.Kuwada S, Yin TCT, Wickesberg RE. Response of cat inferior colliculus neurons to binaural beat stimuli: possible mechanisms for sound localization. Science. 1979;206:586–588. doi: 10.1126/science.493964. [DOI] [PubMed] [Google Scholar]
- 15.Langford TL. Responses elicited from medial superior olivary neurone by stimuli associated with binaural masking and unmasking. Hear Res. 1984;15:39–50. doi: 10.1016/0378-5955(84)90223-5. [DOI] [PubMed] [Google Scholar]
- 16.Licklider JCR. The influence of interaural phase relations upon the masking of speech by white noise. J Acoust Soc Am. 1948;20:150–159. [Google Scholar]
- 17.McAlpine D, Jiang D, Palmer AR. Binaural masking level differences in the inferior colliculus. J Acoust Soc Am. 1996;100:490–503. doi: 10.1121/1.415862. [DOI] [PubMed] [Google Scholar]
- 18.Palmer AR, Winter IM, Darwin CJ. The representation of steady-state vowel sounds in the temporal discharge patterns of the guinea-pig cochlear nerve and primarylike cochlear nucleus neurones. J Acoust Soc Am. 1986;79:100–113. doi: 10.1121/1.393633. [DOI] [PubMed] [Google Scholar]
- 19.Rice J, Young ED, Spirou G. Auditory-nerve encoding of pinna-based spectral cues: Rate representation of high-frequency stimuli. J Acoust Soc Am. 1995;97:1764–1776. doi: 10.1121/1.412053. [DOI] [PubMed] [Google Scholar]
- 20.Sakitt B. Indices of discriminability. Nature. 1973;241:133–134. doi: 10.1038/241133a0. [DOI] [PubMed] [Google Scholar]
- 21.Spitzer MW, Semple MN. Neurons sensitive to interaural phase disparity in gerbil superior olive: diverse monaural and temporal response properties. J Neurophysiol. 1995;73:1668–1690. doi: 10.1152/jn.1995.73.4.1668. [DOI] [PubMed] [Google Scholar]
- 22.Stern RM, Jr, Colburn SH. Theory of binaural interaction based on auditory-nerve data. IV. A model for subjective lateral position. J Acoust Soc Am. 1978;64:127–140. doi: 10.1121/1.381978. [DOI] [PubMed] [Google Scholar]
- 23.Teich M, Khanna SM. Pulse-number distribution for the neural spike train in the cat’s auditory nerve. J Acoust Soc Am. 1985;77:1110–1128. doi: 10.1121/1.392176. [DOI] [PubMed] [Google Scholar]
- 24.Viemeister NF. Intensity coding and the dynamic range problem. Hear Res. 1988;34:267–274. doi: 10.1016/0378-5955(88)90007-x. [DOI] [PubMed] [Google Scholar]
- 25.Winslow RL, Sachs MB. Effect of electrical stimulation on the crossed olivocochlear bundle on auditory nerve response to tones in noise. J Neurophysiol. 1987;57:1002–1021. doi: 10.1152/jn.1987.57.4.1002. [DOI] [PubMed] [Google Scholar]
- 26.Yin TCT, Chan JCK. Interaural time sensitivity in medial superior olive of cat. J Neurophysiol. 1990;64:465–488. doi: 10.1152/jn.1990.64.2.465. [DOI] [PubMed] [Google Scholar]
- 27.Yin TCT, Kuwada S. Neuronal mechanisms of binaural interaction. In: Edelman GM, Gall WE, Cowan WM, editors. Dynamic aspects of neocortical function. Wiley; New York: 1984. pp. 263–313. [Google Scholar]
- 28.Yin TCT, Chan JCK, Carney LH. Effects of interaural time delays of noise stimuli on low-frequency cells in the cat’s inferior colliculus. III. Evidence for cross-correlation. J Neurophysiol. 1987;58:562–583. doi: 10.1152/jn.1987.58.3.562. [DOI] [PubMed] [Google Scholar]
- 29.Young ED, Barta PE. Rate responses of auditory nerve fibers to tones in noise near masked threshold. J Acoust Soc Am. 1986b;79:426–442. doi: 10.1121/1.393530. [DOI] [PubMed] [Google Scholar]