

Abstract
Ischemia-induced cell damage studies have revealed a complex mechanism that is thought to involve glutamate excitotoxicity, intracellular calcium increase, and free radical production. We provide direct evidence that free radical generation occurs in rat CA1 pyramidal neurons of organotypic slices subjected to a hypoxic–hypoglycemic insult. The production of free radicals is temporally correlated with intracellular calcium elevation, as measured by injection of fluo-3 in individual pyramidal cells, using patch electrodes. Free radical production (measured as changes in the fluorescence emission of dihydrorhodamine 123) peaked during reoxygenation and paralleled rising intracellular calcium. Electrophysiological whole-cell recordings revealed membrane potential depolarization and decreased input resistance during the ischemic insult. Glutamate receptor blockade resulted in decreased free radical production and markedly diminished intracellular calcium accumulation, and prevented neuronal depolarization and input resistance decrease during the ischemic episode. These results provide evidence for a direct involvement of glutamate in oxidative damage resulting from ischemic episodes.
Keywords: organotypic slices, free radicals, calcium, ischemia, glutamate transmission, whole-cell recordings
Numerous experimental observations have led to the hypothesis that ischemia-induced neuronal damage results from a chain of pathological events that involve glutamate excitotoxicity, increase in intracellular calcium ([Ca2+]i), and oxidative strees (free radical formation) during reoxygenation (Cao et al., 1988; Choi, 1990; Floyd, 1990; Pellegrini-Giampietro et al., 1990; Martin et al., 1994; Hall et al., 1995; Duffy and MacVicar 1996). The pathological chain of events is thought to start with mostly NMDA receptor-mediated calcium influx that triggers various mechanisms, such as activation of proteases, phospholipases, and free radical formation (Young, 1992;Lipton and Rosenberg 1994). However, glutamate-induced increase in [Ca2+]i was found to benontoxic in conditions preventing free radical generation (Dubinsky et al., 1995,; Patel et al., 1996), suggesting an essential role for free radicals in calcium-mediated neuronal death. In turn, free radicals promote further calcium accumulation, mitochondrial calcium uptake and release, and membrane damage in a pathological feedback cycle (Richter, 1993; Richter et al., 1996). Several experiments indicate that these events might converge, causing irreversible mitochondrial free radical-induced dysfunction leading to cell death (Crompton et al., 1987; Zhang and Piantadosi, 1992; Takeyama et al., 1993; Ankarcrona et al., 1995; Bindokas and Miller, 1995; Dugan et al., 1995; Nieminen et al., 1995; Schinder et al., 1996; White and Reynolds 1996).
Despite great interest, direct evidence of free radical production in neurons during ischemia and its relation to glutamatergic transmission has never been presented because of the lack of adequate techniques for assessing this phenomenon in vivo. The methods used to detect free radical production have been indirect, measuring mostly protein and lipid peroxidation, enzymatic activities, and ratio of reduced to oxidized glutathione in brain superfusates or homogenized membrane preparations (Watson et al., 1984; Oliver et al., 1990; Zhang and Piantadosi, 1992; Hall et al 1995; Hyslop et al., 1995).
A complete understanding of the relation between oxidative stress, glutamate neurotransmission, and intracellular calcium levels requires the use of an in vitro model that resembles and has characteristics similar to the neuronal circuitry found in vivo. An ideal system to probe the collective action of neuronal networks is the organotypic slice culture. These cultures offer several advantages over dissociated cultures in that they keep the three-dimensional organization of the neuronal circuitry and functional characteristics similar to those found in vivo (Zimmer and Gahwiler, 1984; Stoppini et al., 1991). Also, organotypic brain slices can be loaded with fluorescence indicators much more easily than acutely prepared slices.
Using hippocampal organotypic slices cultures, we sought to investigate (1) whether free radicals are generated in the hippocampal CA1 area during and after hypoxia–hypoglycemia, (2) whether there is a change in [Ca2+]i levels correlating with free radical production and with ischemia-associated electrophysiological characteristics of pyramidal neurons; and (3) the role of glutamate transmission during the anoxic insult in free radical production and intracellular calcium levels. We used changes in dihydrorhodamine 123 (DHR123) fluorescence to assess free radical production caused by hypoxia–hypoglycemia in organotypic hippocampal slices. Alterations in [Ca2+]i were evaluated by changes in fluorescence emission of the calcium indicator fluo-3 injected into individual pyramidal neurons using the patch-clamp method, which also allowed us to correlate biophysical membrane parameters (membrane potential and input resistance) with free radical production and calcium levels during and after the ischemic insult.
MATERIALS AND METHODS
Preparation of organotypic slice cultures and solutions.Techniques for culturing embryonic brain slices were a modification of those used by Stoppini et al. (1991). The brains of 7-d-old Wistar rats were aseptically removed and immersed in ice-cold dissecting medium [50% Minimal Essential Media (MEM) with no bicarbonate, 50% calcium and magnesium-free HBSS, 7.5 mmd-glucose, 20 mm HEPES, pH 7.15]. Hippocampi were dissected and then sectioned coronally at 400 μm thickness with a mechanical tissue chopper. The slices were separated and transferred to sterile, porous (0.4 μm) membrane units (Millicell-CM, Millipore). The units were placed into 6-well trays with 1 ml of culturing medium in each dish (50% MEM with Earle’s salts and l-glutamine, 25% HBSS, 25% horse serum with 6.5 mg/l d-glucose, 20 mm HEPES, and 50 U/ml streptomycin–penicillin, pH 7.2). Cultures were kept at 36–37°C in 5% CO2 and fed three times a week by 50% medium exchange. The experiments were carried out after 7–9 d in vitro.
For data acquisition, slices were transferred to a superfusion chamber maintained at 37°C (Model PDMI-2, Medical Systems Corp.). The superfusion solution [artificial cerebrospinal fluid (ACSF)] contained (in mm): NaCl 125, KCl 2.5, NaH2PO4 1.25, MgSO4 2, CaCl2 2, NaHCO3 25, glucose 10, pH 7.4, when aerated with 95% O2/5% CO2. Osmolarity was 300 ± 5 mOsm. Hypoxia–hypoglycemia was initiated by superfusing slices (flow rate 4–5 ml/min) with glucose-free ACSF aerated with 95% N2/5% CO2(deoxygenated); sucrose (10 mm) was added to the solution to maintain osmolarity. Glucose-free deoxygenated ACSF was applied for 8 min. We monitored the time course of oxygen level in the perfusion chamber using an oxygen probe (ISO2 Oxygen Meter, World Precision Instruments). Hypoxic conditions were achieved 1.5–2.0 min after the onset of perfusion with deoxygenated and glucose-free ACSF. It took a similar time to return to normoxic conditions superfusing with normal ACSF. When needed, the NMDA receptor blocker d-2 amino-5-phosphonopentanoic acid (d-AP-5) and the non-NMDA glutamate receptor blocker 6-cyano-7-nitroquinoxaline-2,3-dione (CNQX) (Tocris Cookson) were added to the ACSF at the concentrations indicated in the text. For whole-cell recordings, the internal solution in the patch recording electrode contained (in mm): potassium gluconate 150, HEPES, 10, Mg-ATP 2, KCl 5, pH 7.2, adjusted with KOH, osmolarity 265 ± 5 mOsm.
Electrophysiological recordings and fluorescence measurements.Neuronal recordings were performed using the current-clamp whole-cell configuration of the patch-clamp technique (Hamill et al., 1981). Patch pipettes were pulled from borosilicate capillary tubing (World Precision Instruments). Electrodes had tip resistances ranging from 4 to 6 MΩ when filled with internal solution. The resistance to ground of the whole-cell seal was 2–8 GΩ before breakthrough. Only neurons with resting potential more hyperpolarized than −50 mV and able to fire action potentials were used for all the experiments described. Neuronal responses were recorded using an Axoclamp 2A amplifier. Signals were filtered at 1 kHz, digitized at 88 kHz, and stored on video tape using a digital data recorder VR-10 (Instrutech Corp.) for later playback and analysis. PCLAMP software (Axon Instruments) was used for analysis of membrane potential and input resistances; these were measured from the linear part of the current–voltage plot.
Intracellular calcium levels were measured using the calcium indicator fluo-3 (see below for loading details). Changes in fluorescence emission were monitored by a digital CCD camera (SenSys, Photometrics), and images were stored and analyzed using the Axon Imaging Workbench (Axon Instruments). A fluorescein filter (450/490 nm) was used to visualize fluo-3 emission. Fluorescence measurements were not calibrated for absolute changes in calcium because fluo-3 is a nonratiometric indicator. Free radical generation was followed by the conversion of nonfluorescent DHR123 to fluorescent rhodamine123 (RH123) (Henderson and Chappell, 1993) using a rhodamine filter (510–560/590 nm). Images were collected and analyzed as described above. All images were taken through a 40× water immersion objective (Olympus, numerical aperture 0.7), with a relatively long working distance that allowed us to maneuver patching electrodes in the visual field. Neutral density filters were used to reduce photobleaching. Electrodes filled with ACSF were used to clear the surface of the slices in the visual field, by gentle blowing. Infrared images were acquired by our CCD camera by placing an infrared filter in the light path. Micrographs were printed on a Kodak SV6500 video printer.
For statistical tests of significance, the Student’s t test was used unless specified otherwise. Values throughout the paper are mean ± SD.
Loading of slices with fluorescent dyes and injection of fluo-3.Stock solution of DHR123 (Molecular Probes) was prepared in dimethylsulfoxide (DMSO) under nitrogen at 15 mmconcentration, aliquoted, and stored at −80°C. The slices were loaded with 15 μm DHR123 for 30 min at 37°C; 50 μl of DHR-containing medium was added on the surface of the membranes and allowed to drip through, so that uniform staining of the slice might be achieved. Cultures were then rinsed in ACSF for 10–15 min in the recording chamber. Only slices that had a stable background fluorescence were used for the experiments, which occurred in approximately 30% of the loadings. Although most of the cultured slices were loaded (at the end of the experiments we bathed slices in ACSF containing hydrogen peroxide to test for proper loading), we were not succesful in loading acutely prepared slices from 10- to 15-d-old animals (n = 11). For RH123 experiments, cultured slices were loaded with RH123 (10 μm) (Molecular Probes) for 4 h as detailed above, and rinsed for at least 30 min. When needed, the vital dye SYTOX (Molecular Probes) at 2.5 μmconcentration was added to the perfusing ACSF and applied at the end of the experiments for 15–20 min at a rate of 4–5 ml/min.
For intracellular calcium measurements, individual neurons were patched under infrared illumination and dialyzed with an internal solution containing 10 μm fluo-3 (pentapotassium salt, Molecular Probes). Only cells that showed a resting and stable level of fluorescence were used for experiments (28 of 48 fillings). The dye was allowed to dialyze into the cell for 5–10 min before the start of the image acquisition, which was performed as described above.
RESULTS
Dihydrorhodamine oxidation during hypoxia–hypoglycemia and reoxygenation
Hippocampal organotypic slice cultures were loaded with the nonfluorescent dye DHR123 (15 μm) as detailed in Materials and Methods. The fluorescence emission of CA1 pyramidal cells was examined before, during, and after perfusion with glucose-free deoxygenated ACSF aerated with 95% N2/5% CO2. Monitoring of the oxygen level in the perfusion chamber containing the brain slice (see Materials and Methods) revealed that complete hypoxic conditions were achieved 1.5 min after the onset of perfusion with oxygen and glucose-free ACSF. The hypoxic–hypoglycemic insult was applied for 8 min.
The CA1 pyramidal layer was first localized by infrared microscopy (Figs. 1, 4, and 7), and then DHR123 oxidation to fluorescent RH123 was followed using a rhodamine filter. DHR123 has been shown to be oxidized primarily by superoxide and hydrogen peroxide (Henderson and Chappell 1993). In slices not subjected to the hypoxic–hypoglycemic insult, background DHR123 fluorescence was stable or slightly decreased during the period of observation (Fig. 2A). At the end of the experiments, we perfused slices with hydrogen peroxide (3 mm) as a control for adequate loading, which caused a large increase in fluorescence in all slices. Fluorescence emission increased in 12 of 13 slices during reoxygenation after the 8 min ischemic episode (Figs. 1, 2, and 6). We followed individual cells (identified with infrared light) of the CA1 layer in each slice (see Table 2). The increase in fluorescence, reflecting DHR123 oxidation, was synchronous in all cells, but its magnitude was variable from cell to cell, the average increase being 30.2 ± 22% (n = 115). Cells in the alveus (presumably interneurons and glial cells) had fluorescence increases similar to those of cells in the pyramidal cell layer. The time course of DHR123 oxidation can be inspected in Figures 2 and 6. In general, fluorescence emission was variable during the hypoxic–hypoglycemic episode (see Table 2). Thus, increase in free radical production during hypoxia–hypoglycemia is not as consistent as during reoxygenation. DHR123 oxidation was prominent during reoxygenation in the majority of cells (see Table 2), and two or three fluorescence peaks could be identified: the first 12.4 ± 1.6 min after the onset of reoxygenation (n = 105 cells in 13 of 15 slices), the second at 20.6 ± 2 min (n = 92 cells in 7 of 13 slices), and the third at 37.1 ± 2.7 min (n = 53 cells in 2 of 2 slices). Most fluorescence signal was seen in cell bodies. We also injected DHR123 into two individual pyramidal neurons using patch electrodes: the fluorescence emission parallelled that of the loaded slices, increasing during the insult and reoxygenation. In control condition before hypoxia–hypoglycemia there were no obvious effects of the injected dye on the electrophysiological characteristics of these neurons (see below).
Fig. 1.

DHR123 oxidation to RH123 in the CA1 area of organotypic hippocampal slices subjected to a hypoxic–hypoglycemic episode. Slices were loaded for 25–30 min with DHR123 (15 μm). A, Infrared image of the CA1 layer.B, Pseudocolor micrograph showing background fluorescence emission before the ischemic insult. C, Fluorescence during hypoxic–hypoglycemic episode. D, Fluorescence emission during reoxygenation (25 min). Fluorescence increased in 12 of 13 slices after the anoxic episode. Scale bar (shown in B): 20 μm.Pseudocolor bar indicates arbitrary fluorescence units, which also applies to Figures 4 and 7.
Fig. 4.

Fluo-3 emission of a CA1 pyramidal neuron during and after hypoxia–hypoglycemia. A, Infrared image showing the pyramidal cell patched with an electrode containing the calcium indicator fluo-3 (10 μm). B, Resting fluorescence signal before the anoxic insult. Scale bar, 25 μm.C, Fluorescence emission increases slightly during hypoxia–hypoglycemia (4–6 min). D, Fluorescence increased continuously during reoxygenation (10 min). E, The cell nucleus is prominently fluorescent 25 min after the hypoxic insult.Graph on the bottom right represents excursion ofVm for this cell, which followed the typical pattern (Table 1): depolarizing during the hypoxic–hypoglycemic insult (H-H), rebound hyperpolarization in the first minutes of reoxygenation, and irreversible depolarization starting 12 min after the insult and continuing until the end of the recording period.
Fig. 7.

DHR123 oxidation to RH123 in the CA1 area subjected to a hypoxic–hypoglycemic episode in the presence of glutamate receptor blockers. CNQX (10 μm) andd-AP5 (50 μm) were applied throughout the experiment. Slices were loaded with DHR123 as explained before.A, Infrared image of the CA1 layer. One neuron was patched (center of image) to monitor biophysical characteristics, as detailed in the text and in Figure 3. B, Background fluorescence emission before the ischemic insult. Scale bar, 30 μm.C, Fluorescence during hypoxic–hypoglycemic episode.D, Emission 15–16 min during reperfusion. Fluorescence emission in the presence of glutamate blockers did not increase in most of the cells of six slices (78.5%; n = 208 cells).
Fig. 2.

Time course of DHR123 oxidation to fluorescent RH123 during hypoxia–hypoglycemia and reoxygenation. A, Organotypic hippocampal slice cultures were loaded with DHR123 (15 μm), and its oxidation to RH123 was followed in individual cells of the CA1 pyramidal cell layer during hypoxia–hypoglycemia (H/H) and reperfusion with normal oxygenated ACSF. Images were collected every minute. White circles represent the average of 30 cells from two slices in control condition, without anoxic episode. Black squaresrepresent the average of 30 cells from two slices subjected to hypoxia–hypoglycemia for 8 min. The low level background fluorescence (Fig. 1B) was taken as 100% (baseline). There was an increase in fluorescence emission during the first 4–6 min of the hypoxic insult and during reoxygenation. Notice the fluorescence peak during reperfusion, at 11 minutes after the hypoxic–hypoglycemic episode. B, Average fluorescence emission of 40 cells from two slices exposed to the glutamate receptor blockers CNQX (10 μm) and d-AP-5 (50 μm) during and after the anoxic insult. Fluorescence signal decreased in all slices tested under these conditions (see text), and only a few cells showed an increase of fluorescence during reoxygenation (Table2).
Fig. 6.

Comparison between DHR123 oxidation (A) and fluo-3 fluorescence emission (B) during and after hypoxia–hypoglycemia (H/H). Graph in A represents the average of 10 cells in one slice, whereas the fluorescence signal of a pyramidal neuron in another slice filled with fluo-3 via a patch electrode is shown in B. This neuron fired action potentials at low frequency (2.5 Hz) during H/H, which normally resulted in no [Ca2+]i elevations. The first and second major fluorescence elevations (arrows) occurred at 12 and 21 min during reoxygenation in A, and at 11 and 20 min in B.
Table 2.
DHR123 oxidation to RH123 during hypoxia–hypoglycemia and reoxygenation in CA1 cells
| n | ↑ F | ↓ F | Stable | CNQX/AP-5 | ||||
|---|---|---|---|---|---|---|---|---|
| n | ↑ F | ↓ F | Stable | |||||
| H/H 2–4 min | 200 | 27% | 0% | 73% | 210 | 0.9% | 30.9% | 68.1% |
| H/H 4–8 min | 183 | 30.6% | 66.7% | 2.7% | 209 | 0.4% | 94.7% | 4.8% |
| Reoxygenation | 208 | 81.7% | 3.4% | 14.9% | 200 | 21.5% | 45.5% | 33% |
RH123 fluorescence was measured in individual pyramidal cells of the CA1 layer during a hypoxic–hypoglycemic (H/H) episode of 8 min and reoxygenation. ↑ F and ↓ F indicate increase or decrease in fluorescence, respectively. First and fifth columns (n) indicate the number of cells. Most cells had a stable level of fluorescence emission during the first half of the anoxic insult (first row), and either decreased or increased during the second half (second row). Fluorescence increased in the majority of cells during reoxygenation (third row). Glutamate receptor blockers (see text) in general caused a decrease in DHR123 oxidation at all stages (columns 5–8), as shown by the low percentage of cells whose fluorescence increased (sixth column).
To follow the biophysical characteristics of neurons during the ischemic insult and the period of reoxygenation, we used the whole-cell configuration of the patch-clamp method to record intrinsic membrane properties. Table 1 and Figure3 summarize changes in neuronal input resistances (RN) and membrane potentials (Vm). Briefly, neurons depolarized during the first 4 min of hypoxia–hypoglycemia (15 of 19 cells) (Fig.3A), the average Vm in control was − 55.8 ± 2.5 mV (n = 13), and −48.5 ± 4.9 mV (n = 14) during the anoxic episode (p < 0.0005). Vmrepolarized during the last 2 min of the insult and during the onset of reoxygenation (10 of 19 cells) (Fig. 3A and graph in Fig.4). RN decreased initially during hypoxia–hypoglycemia (13 of 19) (Fig. 3B), and in some (nine neurons) there was a rebound toward the end of the insult and beginning of reoxygenation, increasingRN. These changes in intrinsic membrane parameters are consistent with others reported in recordings from acute hippocampal slices (Krnjevic and Leblond, 1989). Neurons started to depolarize irreversibly 8–12 min after the onset of reoxygenation (e.g., graph in Fig. 4); this time point correlates with the first peak of DHR123 fluorescence (12.4 ± 1.6 min). By the end of the recordings, usually 40–50 min after the anoxic insult, theVm of most neurons was in the range of −20 to −30 mV, the average depolarization being 24.7 ± 9.3 mV (n = 7). In two neurons loaded with DHR123 via patch electrodes, intrinsic membrane parameters followed similar patterns as those recorded from neurons not loaded via patch pipette; membrane potential depolarized by 2.1 ± 0.8 mV (from −55.4 ± 1.3 mV) during the anoxic episode and repolarized by 2.35 ± 1.6 mV at the start of the reperfusion. Input resistance decreased during the insult to a value 72 ± 9% of the original (85 ± 0.6 MΩ) and increased in one cell (23.9% increase with respect to the value during the ischemic episode) at the beginning of reoxygenation.
Table 1.
Changes in intrinsic membrane properties of CA1 pyramidal neurons during hypoxia–hypoglycemia (H-H) and reoxygenation
| H-H 2–4 min | Reoxygenation 2–4 min | |
|---|---|---|
| RN (n = 19 cells) | Decrease in 13 (24.3 ± 11%) | Decrease in 3 (33.8 ± 3%) |
| Increase in 1 (18%) | Increase in 9 (18 ± 8%) | |
| Vm(n = 19 cells) | Depolarize in 15 (7.9 ± 5.3 mV) | Depolarize in 3 (6.2 ± 5 mV) |
| Hyperpolarize in 0 | Hyperpolarize in 10 (3.9 ± 3.6 mV) |
Whole-cell patch-clamp recordings were performed from identified pyramidal neurons (infrared microscopy). During the initial minutes of H-H (2–4 min), input resistances (RN) decreased and membrane potentials (Vm) depolarized in most of the cells. Numbers in parentheses represent percentage decrease or increase in RN and mean depolarization or hyperpolarization of the Vm(in mV). Values are mean ± SD. During the first few minutes of reoxygenation, most neurons showed a rebound response, increasingRN and hyperpolarizing theVm. See Figure 3 and text for details.
Fig. 3.

Changes in intrinsic membrane properties of CA1 pyramidal neurons during hypoxia–hypoglycemia and at the start of reoxygenation (2–4 min). A, Whole-cell recordings from visually identified pyramidal neurons revealed that membrane potential (Vm) depolarized during the hypoxic–hypoglycemic episode (H-H, black bars) as compared with control values (n = 14). Shown in the plot are mean (±SD) values of the depolarization from controlVm monitored in individual neurons (n = 14). In the presence of glutamate receptor blockers (CNQX, 10 μm, and d-AP-5, 50 μm), the depolarization induced by the insult was not statistically significant compared with control values (n = 7) (see text for details). The difference between the mean depolarization with and without blockers is statistically significant (asterisk indicates significance level;p < 0.05). Vm repolarized in most neurons (Table 1) at the start of the reoxygenation (RE, white bars) without drugs; comparison between mean values with and without blockers is not significant (p < 0.4).B, Input resistance (RN) decreased during the first 4–6 min of hypoxia–hypoglycemia (n = 14; p < 0.025) in most of the neurons (for details, see Table 1) and increased in the first 2–4 min of reoxygenation (p < 0.05 compared with control; n = 9). When glutamate transmission was blocked, RN values during the insult and subsequent reperfusion were not significantly different from those of control (n = 6; p < 0.4).
When DHR123 is oxidized and becomes RH123, it is taken up by healthy mitochondria because of their very hyperpolarized potential (160 mV more negative than the cytoplasm), and it is released in the cytoplasm if the mitochondrial potential depolarizes, which causes the fluorescence signal to become weaker, probably because of dilution, and eventually disappear (Duchen and Biscoe, 1992; Nieminen et al., 1995;Yang et al., 1997). This phenomenon could explain the decrease of fluorescence in the DHR123 experiments at different time points (Figs.2A, 6A). Hence, as a control experiment, we loaded six slices directly with RH123 (10 μm) and found that the fluorescence signal decreased in all slices during hypoxia–hypoglycemia and was stable (n = 2) or continued decreasing (n = 4) during reperfusion with oxygenated glucose-containing ACSF. This suggests that the mitochondrial potential depolarizes during the ischemic episode.
Intracellular calcium levels increase during reoxygenation and parallel increases in DHR123 oxidation
Rises in [Ca2+]i after excitotoxic insults have been linked to free radical production. Significant increases in [Ca2+]i have been reported in glial cells and in dissociated neurons during ischemic episodes (Duffy and MacVicar, 1996), as well as after intense glutamate receptor activation (Michaels and Rothman, 1990; Tymianski et al., 1993). We assessed the changes in [Ca2+]i in individual CA1 pyramidal neurons filled with the calcium indicator fluo-3 (10 μm), using the patch-clamp technique. At the same time, whole-cell recordings allowed us to follow the viability of neurons during and after the hypoxic–hypoglycemic challenge. The neuron was first patched in the visual field under infrared light (Fig. 4A), and the dye was allowed to dialyze for 10–15 min. Fluo-3 fluorescence increased during reoxygenation in five of seven cells (Figs. 4, 5, and6); the average increase was 6.7 ± 2.6% relative to the baseline value before the anoxic episode. In control experiments, fluorescence was monitored for an equivalent time in neurons that were not subjected to the challenge, and in these cases (n = 4), fluorescence emission tended to decrease (Fig. 5A), probably because of photobleaching and dye extrusion.
Fig. 5.
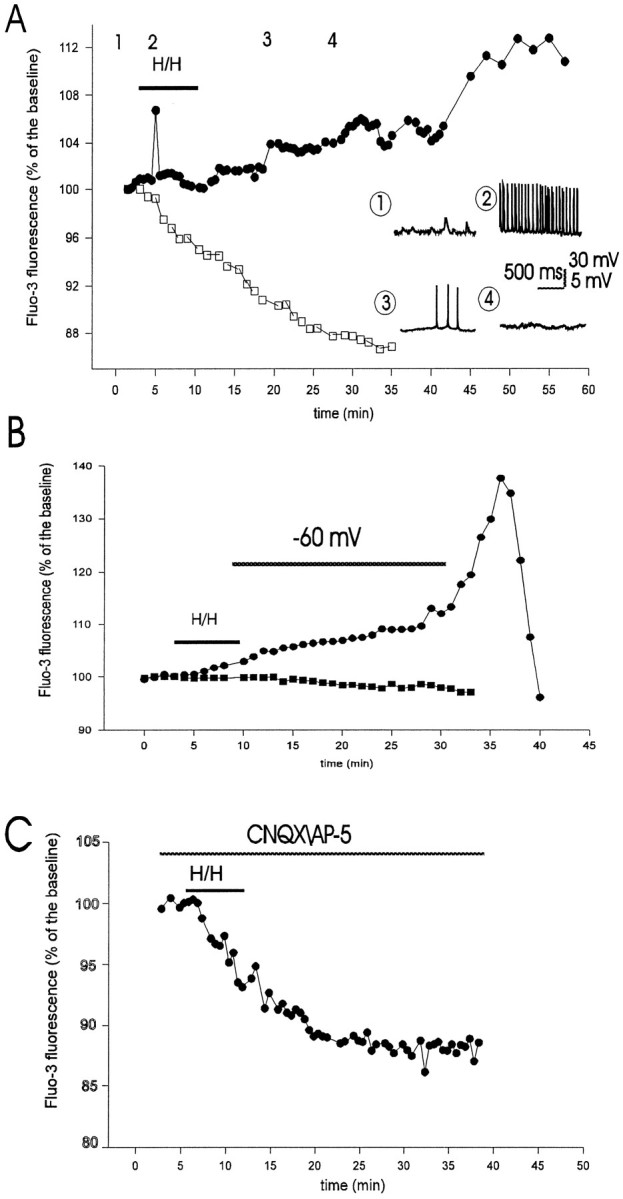
Time course of intracellular calcium ([Ca2+]i) accumulation measured by fluo-3 fluorescence emission in CA1 pyramidal neurons during and after hypoxia–hypoglycemia. A, Fluo-3 was injected into individual pyramidal cells in the visual field using patch electrodes, as in Figure 4. Images were collected every 30 sec. White squares represent control fluo-3 signal in a pyramidal cell not subjected to hypoxia–hypoglycemia (H/H). Black circles represent fluo-3 emission in another pyramidal neuron during the H/H episode and subsequent reoxygenation with normal ACSF. Increase in fluorescence during H/H was associated with a few seconds of intense action potential firing, as shown in the inset(point 2). Insets show whole-cell recordings from this neuron at four time points. Initially (point 1), the cell did not fire and received postsynaptic potentials; theVm at this point was −58 mV. H/H-induced depolarization caused spike firing (point 2; spike frequency was 15 Hz; Vm = −51 mV); neurons with lower spike frequencies did not present a rise in fluo-3 signal (Fig. 6B). After 15–16 min in normal oxygenated ACSF, the neuron depolarized (V = −46 mV; point 3), but firing was greatly decreased (0.8 Hz); after 22–23 min it stopped firing completely (point 4; Vm = −38 mV). The increase in fluo-3 emission was not uniform during reoxygenation.B, Circles represent the fluo-3 emission of a neuron whoseVm was held at −60 mV by constant injection of hyperpolarizing current. Two of six neurons under these conditions showed an increase in fluorescence signal during reoxygenation. The hyperpolarizing holding current was −0.15 nA initially, −0.22 nA after 10 min, and −1.9 nA at 22 min during reoxygenation, at which time the voltage clamp was removed, which resulted in a large calcium influx. Squaresshow the fluorescence signal of another voltage-clamped neuron that did not present elevation in [Ca2+]i; the clamp in this cell was maintained throughout the time of recording. C, Blocking of glutamate transmission with CNQX (10 μm) andd-AP5 (50 μm) abolished fluorescence increase during H/H and reoxygenation. The fluorescence signal in these cells (n = 7) was similar to those in control as shown inA (white squares).
The increase in [Ca2+]i during reoxygenation was evident not only in the cell body but also along the dendrites (Fig. 4); in particular, cell nuclei showed the strongest increase in fluo-3 fluorescence. The time course of calcium rise is shown for two neurons in Figures 5A and6B. [Ca2+]iincreased in the majority of neurons during the ischemic challenge (7 of 12), the average increase being 6.1 ± 3% of control. In 2 of 12 neurons, fluo-3 fluorescence decreased slightly (Fig.6B), and in 3 of 12 neurons the fluorescence remained stable during the insult. The rise in [Ca2+]i during hypoxia–hypoglycemia was associated with intense neuronal firing (as shown in Fig.5A, spike frequency was 15 Hz) brought about by depolarization. In the other four neurons that fired action potentials at low frequencies, there was no rise in fluorescence signal (see for example Fig. 6B; this cell fired at 2.5 Hz).
The rise in [Ca2+]i during reperfusion was not uniform, but presented irregular steps, was not associated with neuronal firing. Three time points could be identified that showed a pronounced rise in fluo-3 signal: the first occurred at 12.3 ± 0.67 min after the onset of reoxygenation in five of seven neurons, the second at 20.6 ± 0.8 min (five of seven cells), and the third at 36.8 ± 3.9 min, which could be identified in four neurons. Interestingly, a comparison with DHR123 fluorescence peaks mentioned before shows a significant temporal correspondence: 12.4 ± 1.6, 20.6 ± 2, and 37.1 ± 2.7 min: these times were not statistically different from those of the calcium signal (p < 0.25). [Ca2+]i decreased abruptly toward the end of the recordings, after 40–50 min reoxygenation (Figs.5B, 6B), which coincided with the loss of DHR123 signal in some slices (Fig. 2A). At this point we stained slices (n = 4) with the vital dye SYTOX (2.5 μm) and found that only a very small number of cells were stained (two to four for a field of 0.04 mm2), indicating that cells still retained membrane integrity.
As mentioned before, irreversible neuronal depolarization started around 10–12 min during reperfusion (Fig. 4), which suggests that part of the calcium influx could be mediated by voltage-activated calcium channels. Hence, we assessed the effects of clampingVm at a hyperpolarized level on fluo-3 fluorescence emission during reoxygenation. Examples of changes in [Ca2+]i in two neurons theVm of which was kept at resting level by constant injection of hyperpolarizing current are shown in Figure5B. Of six neurons that were voltage-clamped near the resting membrane potential, two (33.3%) showed a rise in fluo-3 signal, the average increase being 5.25 ± 3.8% of control, which is not significant when compared with increases without voltage clamp (6.7 ± 2.6%; p < 0.4). Fluo-3 emission did not change in the other four neurons. When it was not possible to hold the clamp because of current leakage, [Ca2+]i increased abruptly. These observations suggest that at least part of the calcium influx may occur via voltage-gated calcium channels.
Glutamate receptor blockade reduces free radical generation and intracellular calcium accumulation
It is widely accepted that glutamate receptor overactivation promotes rises in [Ca2+]i and free radicals, which results in delayed neuronal death (Rothman, 1984; Choi et al., 1988; Michaels and Rothman, 1990; for review, see Coyle and Puttfarcken, 1993; Patel et al., 1996). However, it remains unknown whether ischemia-induced free radical overproduction depends critically on glutamatergic transmission. Hence, we asked what effects the blockade of glutamate transmission could have on DHR123 fluorescence and calcium accumulation during and after hypoxia–hypoglycemia.
The non-NMDA glutamate receptor blocker CNQX (10 μm) and the specific NMDA blocker d-AP-5 (50 μm) were bath-applied during the ischemic episode and the period of reperfusion. Whole-cell recordings showed the complete abolition of spontaneous EPSPs seen in individual neurons 2–3 min after application of the blockers (data not shown). DHR123 oxidation decreased significantly during reperfusion in all slices tested (n = 6), as shown in Figures 2B and7. Only 21.5% (43 of 200 cells) of cells in the CA1 layer showed increased fluorescence, compared with 81.7% without blockers (Table 2). The average increase of those 43 cells was 8.6 ± 3.2% of control baseline, which is significantly lower than the average increase without glutamate blockers (30.2 ± 22.6%; p < 0.0005). Interestingly, the peak of DHR123 oxidation in the presence of blockers occurred 13.3 ± 1.8 min after the onset of reoxygenation in the 43 cells that exhibited increased fluorescence, which is temporally correlated with the first increase in DHR123 oxidation with intact glutamate transmission (12.4 ± 1.6 min). Similarly, the number of cells that presented an increase in DHR123 fluorescence during the hypoxic–hypoglycemic insult in the presence of CNQX and d-AP-5 (0.9%) (Table2) was much lower than when these blockers were omitted (27%).
[Ca2+]i accumulation was greatly reduced in the presence of glutamate receptor blockers during the insult and reperfusion (Fig. 5C): only one neuron of eight had a rise in fluo-3 signal during reoxygenation (6% increase), which occurred 11 min after the onset of reperfusion, and in 4 of 10 neurons there was a [Ca2+]i increase during hypoxia–hypoglycemia. The average fluo-3 signal rise during the insult in those four cells was 2.8 ± 0.9% of baseline level (before the challenge), which is significantly lower than the rise during the hypoxic episode with intact glutamate transmission (6.1 ± 3%;p < 0.05). Increased fluo-3 signal during hypoxia–hypoglycemia was associated, as before, with neuronal firing: of six neurons that fired action potentials, four showed an elevation in [Ca2+]i. It is worth noting that unlike what happened with intact glutamate transmission, intrinsic membrane properties (RN andVm) of neurons recorded during the hypoxic episode were not significantly different from those before the challenge (Fig. 3). Vm before the insult was −54.1 ± 5.5 mV (n = 7) and −52.1 ± 5.2 mV during hypoxia–hypoglycemia (n = 7; p< 0.25). These observations suggest an important role of glutamate receptor activation in hypoxia–hypoglycemia-induced membrane potential depolarization and decreased input resistance.
DISCUSSION
The precise mechanisms of ischemia-induced irreversible cellular damage remain unknown. Recent observations suggest an interplay among three major mechanisms: glutamate excitotoxicity, rises in [Ca2+]i, and free radical generation (Choi, 1990; Zhang and Piantadosi, 1992; Lafon-Cazal et al., 1993; Lipton and Rosenberg, 1994; Martin et al., 1994; Bindokas and Miller, 1995; Dugan et al., 1995; Hall et al., 1995; Newell et al., 1995; Schinder et al., 1996; White and Reynolds 1996). Despite the fact that oxidative damage seems to play an essential role in ischemic injury, direct evidence of free radical generation during ischemia in neurons has never been presented. Free radical overproduction during ischemia-reperfusion has been indicated by data obtained in vivo only (Cino and Del Maestro, 1989; Zhang and Piantadosi 1992;Hall et al., 1995), even though other experiments did not detect evidence for free radical involvement in ischemic injury (Folbergrova et al., 1993; Lundgren et al, 1991). Although some of these experiments show an increase in peroxidation of membrane lipids and proteins and changes in ratios of oxidized and reduced glutathione (Watson et al., 1984; Oliver et al., 1990), they do not prove that free radicals are generated in individual neurons, because the samples are usually whole brain tissue and cortical superfusates (Zini et al., 1992; Phillis and Sen, 1993; Hyslop et al., 1995). In this work, we have taken advantage of the fact that organotypic slice cultures maintain intact neuronal circuitry and cells have properties similar to those found in vivo (Zimmer and Gahwiler, 1984; Stoppini et al 1991) to examine three main questions: (1) whether free radicals are generated in pyramidal neurons during and after hypoxia–hypoglycemia, (2) whether there is a change in [Ca2+]i in that period, and (3) whether glutamate transmission plays any role in free radical generation or intracellular calcium accumulation.
Our observations provide direct evidence that free radicals are generated in CA1 pyramidal neurons in response to a hypoxic–hypoglycemic episode and that reperfusion with oxygenated ACSF promotes a larger and more consistant increase in free radical production. Because the oxidation of DHR123 to RH123 is an irreversible process, the decreases in fluorescence signal after prolonged increases throughout the experiment (Figs. 2, 6) seemed paradoxical. However, this is explained by the dynamics of RH123 distribution in the cell. It has been observed that RH123 is internalized in mitochondria because of their hyperpolarized potential and released on depolarization, which causes the fluorescence signal to become fainter because of dilution (Duchen and Biscoe, 1992; Henderson and Chappell, 1993; Nieminen et al., 1995; Yang et al, 1997). Hence, the fluorescence emission we detected in these experiments could reflect an interaction between DHR123 oxidation by free radical generation and redistribution of RH123 into hyperpolarized mitochondria and out of depolarized mitochondria. Although it was not our purpose to determine mitochondrial dysfunction, we stained some slices directly with RH123 as a control for possible changes in fluorescence in the DHR123 experiments. In all slices, the fluorescence signal of RH123-loaded slices decreased during the hypoxic–hypoglycemic episode, and in most of them four of six during reperfusion. These observations suggest that mitochondria depolarize during this period, probably after the neuronal depolarization caused by the insult. The precise origin of free radical production can not be determined from our experiments. We speculate that the possible site of free radical generation are the mitochondria, as proposed by others (Cino and Del Maestro, 1989; Zhang and Piantadosi, 1992; Richter, 1993;Dykens, 1994; Dugan et al., 1995; Reynolds and Hastings, 1995).
The observation that pyramidal neurons filled with the calcium indicator fluo-3 showed an increase in [Ca2+]i during reoxygenation and that there was a significant temporal correspondence with DHR123 fluorescence provides evidence that cellular calcium handling is closely related to neuronal free radical generation. Increases in fluo-3 emission during hypoxia–hypoglycemia were usually associated with neuronal spike generation (Fig. 5A), whereas increased fluorescence during reperfusion with oxygenated ACSF occurred with little or no spike firing. This could indicate that part of the cytoplasmic calcium may come from internal stores, reversal of the Na/Ca exchanger (Barzilai and Rahaminoff, 1987), voltage-activated calcium channels, or nonspecific holes in the membrane (Phillis and Nicholson, 1978). The increased [Ca2+]i during the insult could be responsible in part for the hyperpolarization of the neuronal potential observed toward the end of the insult and beginning of the reoxygenation, by activating calcium-activated potassium conductances (Krnjevic and Leblond, 1989). We did not investigate the source of this calcium influx, but there is experimental evidence that in vitro ischemia promoted intracellular calcium release in glial cells (Duffy and MacVicar, 1996). Because we observed a continuous neuronal depolarization starting 10–12 min after the ischemic insult, we assessed the contribution of this depolarization to calcium accumulation by holding Vm close to resting levels. A rise in fluo-3 emission was still evident in 33% of voltage-clamped neurons, which suggests that at least part of the cytoplasmic calcium accumulation may be attributable to other sources as detailed above. For example, glutamate-induced calcium influx may further augment calcium release from mitochondria, as was suggested by several experiments in cultured neurons (Kiedrowski and Costa, 1995;White and Reynolds, 1996). The mitochondrial calcium uptake and release has been termed calcium “cycling” (Richter, 1993). The high calcium load and oxidative stress that occur during hypoxia–hypoglycemia have been proposed to cause the collapse of mitochondrial potential and impairment of mitochondrial ability to retain calcium (Richter et al., 1996). The irregularly increasing fluo-3 emission during reoxygenation is suggestive of patterns attributed to mitochondrial calcium sequestration and release as observed in DRG neurons (Werth and Thayer, 1994). More experiments will be needed to understand how mitochondrial function relates to [Ca2+]i during ischemia.
Finally, we present evidence for a direct connection between glutamate neurotransmission, rises in [Ca2+]i, and free radical generation during and after hypoxia–hypoglycemia. Blockade of NMDA and non-NMDA glutamate receptors resulted in a significant decrease of DHR123 oxidation and [Ca2+]iaccumulation, with no significant changes in Vmand RN during the anoxic challenge. Although these results may suggest that neuronal depolarization and free radical formation are related, to investigate a possible causal relationship is beyond the scope of the present study. Other experiments performing pharmacological manipulations of potassium conductances, for example, will be required before a clear causal relation between the two processes is established. It should be noted that our hypoxic insult and reoxygenation may not represent what is encountered during in vivo conditions, in which neurons are supplied oxygen via hemoglobin.
In summary, our data provide a link between several mechanisms thought to cause irreversible neuronal damage in ischemia, such as the loss of CA1 neurons in organotypic slices subjected to oxygen and glucose deprivation reported by Newell et al., (1995). We propose the following set of events: the initial depolarization and spike-firing caused by hypoxia–hypoglycemia releases glutamate, which promotes further depolarization, [Ca2+]iaccumulation, and free radical generation, and possibly an impairment of mitochondrial function. A precise understanding of the interplay of these mechanisms can lead to the development of pharmacological strategies to prevent neurodegeneration.
Footnotes
This work was supported by the Medical Research Council of Canada (MRC), the Bloorview Epilepsy Programme, and the Neurosciences Network.
Correspondence should be addressed to Jose Luis Perez Velazquez, Playfair Neuroscience Unit, McL 12-413, Toronto Western Hospital, 399 Bathurst Street, Toronto, Ontario M5T 2S8, Canada.
REFERENCES
- 1.Ankarcrona M, Dybpukt JM, Bonfoco E, Zhivotovsky B, Orrenius S, Lipton SA, Nicotera P. Glutamate-induced neuronal death: a succession of necrosis or apoptosis depending on mitochondrial function. Neuron. 1995;15:961–973. doi: 10.1016/0896-6273(95)90186-8. [DOI] [PubMed] [Google Scholar]
- 2.Barzilai A, Rahaminoff H. Stoichiometry of the sodium-calcium exchanger in nerve terminals. Biochemistry. 1987;26:6113–6118. doi: 10.1021/bi00393a025. [DOI] [PubMed] [Google Scholar]
- 3.Bindokas VP, Miller RJ. Excitotoxic degeneration is initiated at non-random sites in cultured rat cerebellar neurons. J Neurosci. 1995;15:6999–7010. doi: 10.1523/JNEUROSCI.15-11-06999.1995. [DOI] [PMC free article] [PubMed] [Google Scholar]
- 4.Cao W, Carney JM, Duchen A, Floyd RA, Chevion M. Oxygen free radical involvement in ischemia and reperfusion injury to brain. Neurosci Lett. 1988;88:233–238. doi: 10.1016/0304-3940(88)90132-2. [DOI] [PubMed] [Google Scholar]
- 5.Choi D. Cerebral hypoxia: some new approaches and unanswered questions. J Neurosci. 1990;10:2493–2501. doi: 10.1523/JNEUROSCI.10-08-02493.1990. [DOI] [PMC free article] [PubMed] [Google Scholar]
- 6.Choi D, Koh J, Peters S. Pharmacology of glutamate neurotoxicity in cortical cell culture. J Neurosci. 1988;8:185–196. doi: 10.1523/JNEUROSCI.08-01-00185.1988. [DOI] [PMC free article] [PubMed] [Google Scholar]
- 7.Cino M, Del Maestro RF. Generation of hydrogen peroxide by brain mitochondria: the effect of reoxygenation following postdecapitative ischemia. Arch Biochem Biophys. 1989;269:623–638. doi: 10.1016/0003-9861(89)90148-3. [DOI] [PubMed] [Google Scholar]
- 8.Coyle JT, Puttfarcken P. Oxidative stress, glutamate, and neurodegenerative disorders. Science. 1993;262:689–695. doi: 10.1126/science.7901908. [DOI] [PubMed] [Google Scholar]
- 9.Crompton M, Costi A, Hayat L. Evidence for the presence of a reversible calcium-dependent pore activated by oxidative stress in heart mitochondria. Biochem J. 1987;245:915–918. doi: 10.1042/bj2450915. [DOI] [PMC free article] [PubMed] [Google Scholar]
- 10.Dubinsky JM, Kristal BS, Elizondo-Fournier M. An obligate role for oxygen in the early stages of glutamate-induced, delayed neuronal death. J Neurosci. 1995;15:7071–7078. doi: 10.1523/JNEUROSCI.15-11-07071.1995. [DOI] [PMC free article] [PubMed] [Google Scholar]
- 11.Duchen MR, Biscoe TJ. Relative mitochondrial membrane potential and [Ca2+]i in type I cells isolated from the rabbit carotid body. J Physiol (Lond) 1992;450:33–61. doi: 10.1113/jphysiol.1992.sp019115. [DOI] [PMC free article] [PubMed] [Google Scholar]
- 12.Duffy S, MacVicar BA. In vitro ischemia promotes calcium influx and intracellular calcium release in hippocampal astrocytes. J Neurosci. 1996;16:71–81. doi: 10.1523/JNEUROSCI.16-01-00071.1996. [DOI] [PMC free article] [PubMed] [Google Scholar]
- 13.Dugan LL, Sensi SL, Canzoniero LMT, Handran SD, Rothman SM, Lin TS, Goldberg MP, Choi DW. Mitochondrial production of reactive oxygen species in cortical neurons following exposure to NMDA. J Neurosci. 1995;15:6377–6388. doi: 10.1523/JNEUROSCI.15-10-06377.1995. [DOI] [PMC free article] [PubMed] [Google Scholar]
- 14.Dykens JA. Isolated cerebral and cerebellar mitochondria produce free radicals when exposed to elevated Ca2+ and Na+: implications for neurodegeneration. J Neurochem. 1994;63:584–586. doi: 10.1046/j.1471-4159.1994.63020584.x. [DOI] [PubMed] [Google Scholar]
- 15.Floyd RA. Role of oxygen free radicals in carcinogenesis and rat brain ischemia. FASEB J. 1990;4:2587–2597. [PubMed] [Google Scholar]
- 16.Folbergrova J, Kiyota Y, Pahlmark K, Memezawa H, Smith ML, Siesjo BK. Does ischemia with reperfusion lead to oxidative damage to proteins in the brain? J Cereb Blood Flow Metab. 1993;13:145–152. doi: 10.1038/jcbfm.1993.17. [DOI] [PubMed] [Google Scholar]
- 17.Hall NC, Carney JM, Cheng MS, Butterfield DA. Ischemia-reperfusion induced changes in membrane proteins and lipids of gerbil cortical synaptosomes. Neuroscience. 1995;64:81–89. doi: 10.1016/0306-4522(94)00385-i. [DOI] [PubMed] [Google Scholar]
- 18.Hamill OP, Marty A, Neher A, Sakmann B, Sigworth FJ. Improved patch-clamp techniques for high resolution recording from cells and cell-free membrane patches. Pflügers Arch. 1981;391:85–10010. doi: 10.1007/BF00656997. [DOI] [PubMed] [Google Scholar]
- 19.Henderson LM, Chappell JB. Dihydrorhodamine123: a fluorescent probe for superoxide generation. Eur J Biochem. 1993;217:973–908. doi: 10.1111/j.1432-1033.1993.tb18328.x. [DOI] [PubMed] [Google Scholar]
- 20.Hyslop PA, Zhang Z, Pearson DV, Phebus LA. Measurement of striatal H2O2 by microdialisis following global forebrain ischemia and reperfusion in the rat: correlation of cytotoxic potential of H2O2 in vitro. Brain Res. 1995;671:181–186. doi: 10.1016/0006-8993(94)01291-o. [DOI] [PubMed] [Google Scholar]
- 21.Kiedrowski L, Costa E. Glutamate induced destabilization of intracellular calcium concentration homeostasis in cultured cerebellar granule cells: role of mitochondria in calcium buffering. Mol Pharmacol. 1995;47:140–147. [PubMed] [Google Scholar]
- 22.Krnjevic K, Leblond J. Changes in membrane currents of hippocampal neurons evoked by brief anoxia. J Neurophysiol. 1989;62:15–30. doi: 10.1152/jn.1989.62.1.15. [DOI] [PubMed] [Google Scholar]
- 23.Lafon-Cazal M, Pletrl S, Culcasi M, Boeckart J. NMDA-dependent superoxide production and neurotoxicity. Nature. 1993;364:535–537. doi: 10.1038/364535a0. [DOI] [PubMed] [Google Scholar]
- 24.Lipton SA, Rosenberg PA. Excitatory amino acids as a final common pathway for neurologic disorders. New Engl J Med. 1994;330:613–622. doi: 10.1056/NEJM199403033300907. [DOI] [PubMed] [Google Scholar]
- 25.Lundgren J, Zhang H, Agardh CD, Smith Maj-Lis, Evans P, Halliwell B, Siesjo BK. Acidosis-induced ischemic brain damage: are free radicals involved? J Cereb Blood Flow Metab. 1991;11:587–596. doi: 10.1038/jcbfm.1991.108. [DOI] [PubMed] [Google Scholar]
- 26.Martin RL, Lloyd HGE, Cowan AI. The early events of oxygen and glucose deprivation: setting the scene for neuronal death? Trends Neurosci. 1994;17:251–257. doi: 10.1016/0166-2236(94)90008-6. [DOI] [PubMed] [Google Scholar]
- 27.Michaels RL, Rothman SM. Glutamate neurotoxicity in vitro: antagonist pharmacology and intracellular calcium concentrations. J Neurosci. 1990;10:283–292. doi: 10.1523/JNEUROSCI.10-01-00283.1990. [DOI] [PMC free article] [PubMed] [Google Scholar]
- 28.Newell DW, Barth A, Papermaster V, Malouf AT. Glutamate and non-glutamate receptor mediated toxicity caused by oxygen and glucose deprivation in organotypic hippocampal cultures. J Neurosci. 1995;15:7702–7711. doi: 10.1523/JNEUROSCI.15-11-07702.1995. [DOI] [PMC free article] [PubMed] [Google Scholar]
- 29.Nieminen AL, Saylor AK, Tesfai SA, Herman B, Lemasters JJ. Contribution of the mitochondrial permeability transition to lethal injury after exposure of hepatocytes to t-butylhydroperoxide. Biochem J. 1995;307:99–106. doi: 10.1042/bj3070099. [DOI] [PMC free article] [PubMed] [Google Scholar]
- 30.Oliver CN, Starke-Reed PE, Stadtman ER, Liu GJ, Carney JM, Floyd RA. Oxidative damage to brain proteins, loss of glutamine synthetase activity and production of free radicals during ischemia-reperfusion-induced injury to gerbil brain. Proc Natl Acad Sci USA. 1990;87:5144–5147. doi: 10.1073/pnas.87.13.5144. [DOI] [PMC free article] [PubMed] [Google Scholar]
- 31.Patel M, Day BJ, Crapo JD, Fridovich I, McNamara JO. Requirement for superoxide in excitotoxic cell death. Neuron. 1996;16:345–355. doi: 10.1016/s0896-6273(00)80052-5. [DOI] [PubMed] [Google Scholar]
- 32.Pellegrini-Giampietro DE, Cherici G, Alesiani M, Carla V, Moroni F. Excitatory amino acid release and free radical formation may cooperate in the genesis of ischemia-induced neuronal damage. J Neurosci. 1990;10:1035–1041. doi: 10.1523/JNEUROSCI.10-03-01035.1990. [DOI] [PMC free article] [PubMed] [Google Scholar]
- 33.Phillips JM, Nicholson C. Tetra-alkyl ammonium ions as probes of brain cell microenvironment. Soc Neurosci Abstr. 1978;4:236. [Google Scholar]
- 34.Phillis JW, Sen S. Oxypurinol attenuates hydroxyl radical production during ischemia/reperfusion injury of the rat cerebral cortex: an ESR study. Brain Res. 1993;628:309–312. doi: 10.1016/0006-8993(93)90970-x. [DOI] [PubMed] [Google Scholar]
- 35.Reynolds IJ, Hastings TG. Glutamate induces the production of reactive oxygen species in cultured forebrain neurons following NMDA receptor activation. J Neurosci. 1995;15:3318–3327. doi: 10.1523/JNEUROSCI.15-05-03318.1995. [DOI] [PMC free article] [PubMed] [Google Scholar]
- 36.Richter C. Pro-oxidants and mitochondrial calcium: their relationship to apoptosis and oncogenesis. FEBS Lett. 1993;325:104–107. doi: 10.1016/0014-5793(93)81423-w. [DOI] [PubMed] [Google Scholar]
- 37.Richter C, Schweizer M, Cossarizza A, Franceschi C. Control of apoptosis by the cellular ATP level. FEBS Lett. 1996;378:107–110. doi: 10.1016/0014-5793(95)01431-4. [DOI] [PubMed] [Google Scholar]
- 38.Rothman SM. Synaptic release of excitatory amino acid neurotransmitter mediates anoxic neuronal death. J Neurosci. 1984;4:1884–1891. doi: 10.1523/JNEUROSCI.04-07-01884.1984. [DOI] [PMC free article] [PubMed] [Google Scholar]
- 39.Schinder AF, Olson EC, Spitzer NC, Montal M. Mitochondrial dysfunction is a primary event in glutamate neurotoxicity. J Neurosci. 1996;16:6125–6133. doi: 10.1523/JNEUROSCI.16-19-06125.1996. [DOI] [PMC free article] [PubMed] [Google Scholar]
- 40.Stoppini L, Buchs L-A, Muller D. A simple method for organo-typic cultures of nervous tissue. J Neurosci Methods. 1991;37:173–182. doi: 10.1016/0165-0270(91)90128-m. [DOI] [PubMed] [Google Scholar]
- 41.Takeyama N, Matsuo N, Tanaka T. Oxidative damage to mitochondria is mediated by the calcium-dependent inner membrane permeability transition. Biochem J. 1993;294:719–725. doi: 10.1042/bj2940719. [DOI] [PMC free article] [PubMed] [Google Scholar]
- 42.Tymianski M, Charlton MP, Carlen PL, Tator CH. Source specificity of early calcium neurotoxicity in cultured embryonic spinal neurons. J Neurosci. 1993;13:2085–2104. doi: 10.1523/JNEUROSCI.13-05-02085.1993. [DOI] [PMC free article] [PubMed] [Google Scholar]
- 43.Watson BD, Busto R, Goldberg WJ, Santisto M, Yoshida S, Ginsberg MD. Lipid peroxidation in vivo induced by reversible global ischemia in rat brain. J Neurochem. 1984;42:268–274. doi: 10.1111/j.1471-4159.1984.tb09728.x. [DOI] [PubMed] [Google Scholar]
- 44.Werth JL, Thayer SA. Mitochondria buffer physiological calcium loads in cultured dorsal root ganglion neurons. J Neurosci. 1994;14:348–356. doi: 10.1523/JNEUROSCI.14-01-00348.1994. [DOI] [PMC free article] [PubMed] [Google Scholar]
- 45.White RJ, Reynolds IJ. Mitochondrial depolarization in glutamate-stimulated neurons: an early signal specific to excitotoxin exposure. J Neurosci. 1996;16:5688–5697. doi: 10.1523/JNEUROSCI.16-18-05688.1996. [DOI] [PMC free article] [PubMed] [Google Scholar]
- 46.Yang J, Liu X, Bhalla K, Kim CN, Ibrado AM, Cai J, Peng TI, Jones DP, Wang X. Prevention of apoptosis by Bcl-2: release of cytochrome c from mitochondria blocked. Science. 1997;275:1129–1132. doi: 10.1126/science.275.5303.1129. [DOI] [PubMed] [Google Scholar]
- 47.Young W. Role of calcium in central nervous system injuries. J Neurotrauma. 1992;9:S9–S25. [PubMed] [Google Scholar]
- 48.Zhang J, Piantadosi CA. Mitochondrial oxidative stress after carbon monoxide hypoxia in the rat brain. J Clin Invest. 1992;90:1193–1199. doi: 10.1172/JCI115980. [DOI] [PMC free article] [PubMed] [Google Scholar]
- 49.Zimmer J, Gahwiler BH. Cellular and connective organization of slice cultures of the rat hippocampus and fascia dentata. J Comp Neurol. 1984;228:432–446. doi: 10.1002/cne.902280310. [DOI] [PubMed] [Google Scholar]
- 50.Zini I, Tomasi A, Grimaldi R, Vannini V, Agnati LF. Detection of free radicals during brain ischemia and reperfusion by spin trapping and microdialysis. Neurosci Lett. 1992;138:279–282. doi: 10.1016/0304-3940(92)90933-x. [DOI] [PubMed] [Google Scholar]