

Abstract
The present study tested the hypothesis that the cytokine tumor necrosis factor-α (TNF-α) is an important CNS mediator of the hypothalamo-pituitary-adrenal (HPA) axis response to local inflammation in the rat. Recombinant murine TNF-α administered directly into the cerebroventricles of normal rats produced a dose-dependent increase in plasma adrenocorticotropin (ACTH) concentration. Local inflammation induced by the intramuscular injection of turpentine (50 μl/100 gm body weight) also produced an increase in plasma ACTH, peaking at 160–200 pg/ml at 7.5 hr after injection (compared with 10–30 pg/ml in controls). Intracerebroventricular pretreatment with either 5 μl of anti-TNF-α antiserum or 1–50 μg of soluble TNF receptor construct (rhTNFR:Fc) reduced the peak of the ACTH response to local inflammation by 62–72%. In contrast, intravenous treatment with the same doses of anti-TNF-α or rhTNFR:Fc had no significant effect on the ACTH response to local inflammation. Although these data indicated an action of TNF-α specifically within the brain, no increase in brain TNF-α protein (measured by bioassay) or mRNA (assessed using either in situ hybridization histochemical or semi-quantitative RT-PCR procedures) was demonstrable during the onset or peak of HPA activation produced by local inflammation. Furthermore, increased passage of TNF-α from blood to brain seems unlikely, because inflammation did not affect plasma TNF-α biological activity. Collectively these data demonstrate that TNF-α action within the brain is critical to the elaboration of the HPA axis response to local inflammation in the rat, but they indicate that increases in cerebral TNF-α synthesis are not a necessary accompaniment.
Keywords: tumor necrosis factor-α, corticotropin-releasing factor, local inflammation, adrenocorticotropin, CNS, intraventricular
Acute or chronic inflammation produces a sequelae of hematological, neurological, autonomic, and neuroendocrine responses that are collectively known as the acute phase response (APR). Critical to the development of the APR are the synthesis, secretion, and action of cytokines, a family of polypeptides originally described as intercellular mediators within the immune system (Blalock, 1989;Dinarello and Wolff, 1993; Besedovsky and del Rey, 1996). Indeed, administration of either interleukin-1 (IL-1), IL-6, or tumor necrosis factor-α (TNF-α) to normal healthy laboratory animals or to human volunteers mimics many aspects of the APR, including activation of the hypothalamo-pituitary-adrenal (HPA) axis (Turnbull and Rivier, 1995;Besedovsky and del Rey, 1996).
The influence of recombinant cytokines on HPA activity and their mechanism(s) of action have been studied extensively. The primary mechanism by which increased blood or brain cytokine concentrations elicit activation of the HPA axis is at the level of hypothalamic corticotropin-releasing factor (CRF) release (Turnbull and Rivier, 1995, 1996b). Indeed, IL-1, IL-6, or TNF-α increases hypothalamic secretion of CRF in vitro and in vivo, and passive immunoneutralization of CRF inhibits the elevation in plasma ACTH concentrations produced by each of these three cytokines (Berkenbosch et al., 1987; Sapolsky et al., 1987; Uehara et al., 1987;Naitoh et al., 1988; Tsagarakis et al., 1989; Bernardini et al., 1990;Navarra et al., 1991; Watanobe et al., 1991; Watanobe and Takebe, 1992). In contrast, the participation of endogenouscytokines in inflammation-induced activation of the HPA axis has been less well studied and largely restricted to the study of ACTH responses to systemic administration of the bacterial cell wall product endotoxin [or lipopolysaccharide (LPS)] (Tilders et al., 1994). Such work has indicated that inhibition of the action of either TNF-α, IL-1, or IL-6 reduces or prevents the rise in plasma ACTH levels in response to systemic LPS (Rivier et al., 1989; Kakucska et al., 1993; Perlstein et al., 1993; Schotanus et al., 1993; Ebisui et al., 1994); however, the site(s) of production or action of cytokines that influence HPA activity during inflammation is unclear.
Tissue undergoing inflammation undoubtedly contains markedly elevated levels of TNF-α, IL-1, and IL-6. The synthesis and secretion of TNF-α seems to be a proximal event in the cytokine cascade, because its concentration rises more rapidly than that of either IL-1 or IL-6, and inhibition of its action during inflammatory events abrogates many of the ensuing responses, including the production of IL-1 and IL-6 (Fong et al., 1989; Le Contel et al., 1990; Creasey et al., 1991;DeForge and Remick, 1991; Zanetti et al., 1992; Cooper et al., 1994a;Givalois et al., 1994). Furthermore, plasma concentrations of one or more of these cytokines may also be elevated, depending on the nature, site, intensity, and duration of the inflammatory insult (Turnbull and Rivier, 1995).
Recent reports of elevated cytokine synthesis within the CNS in response to peripheral injection of LPS identify an additional possible mechanism by which cytokines generated in response to peripheral inflammation may influence the activity of the HPA axis (Schobitz et al., 1994; Hopkins and Rothwell, 1995; Turnbull and Rivier, 1995;Besedovsky and del Rey, 1996). This is a particularly attractive hypothesis, because the activation of the HPA axis in response to either recombinant cytokines or inflammatory insults depends on the synthesis and secretion of hypothalamic CRF. Cytokine expression within the CNS has been reported in astrocytes, microglia, neurons, brain endothelial cells, and ependymal cells (Schobitz et al., 1994; Hopkins and Rothwell, 1995). Consistent with a neuromodulatory role for IL-1, IL-6, and TNF-α within the CNS, their receptors have discrete neuroanatomical distributions (Schobitz et al., 1994; Hopkins and Rothwell, 1995; Turnbull and Rivier, 1995; Besedovsky and del Rey, 1996; Rothwell et al., 1996). As in the periphery, a CNS cytokine cascade seems likely (Romero et al., 1993; Norris et al., 1994).
The present study sought to determine the role of cytokines within the brain in the mediation of the HPA axis response to a peripheral, discrete tissue inflammation in the rat (Turnbull et al., 1994;Turnbull and Rivier, 1996a). Because of the proximal nature of TNF-α in the generation of cytokines and subsequent responses, our study focused on this cytokine.
MATERIALS AND METHODS
Reagents. Anti-TNF-α antiserum was produced by immunization of rabbits with recombinant murine TNF-α and was kindly donated by Dr. S. L. Kunkel (Department of Pathology, University of Michigan). This antiserum recognizes both recombinant and natural murine TNF-α and displays high cross-reactivity with rat TNF-α, but it does not cross-react with recombinant IL-1α or IL-1β (Chensue et al., 1988; and our own data) or block lymphotoxin (TNF-β) (Long et al., 1990). Furthermore, it binds and neutralizes the biological effects of rat TNF-α, both in vitro and in vivo(Chensue et al., 1988; Colletti et al., 1990; Long et al., 1990; Remick et al., 1990), and large systemic doses (0.3–1.0 ml of neat serum) to rats inhibit pulmonary edema produced by hepatic ischemia/reperfusion injury (Colletti et al., 1990), elevations in plasma IL-6 and fever in response to local inflammation (Cooper et al., 1994a), and they exacerbate LPS-induced fever (Long et al., 1990). In the present study, rats were passively immunized with either 5 μl of neat or 500 μl of 1:100 anti-TNF-α, with similar volumes of neat or diluted normal rabbit serum (NRS) (Colorado Serum, Denver, CO) used as control injections.
A dimeric soluble TNF receptor (p80) was prepared by linkage of the cDNA encoding the soluble (extracellular) portion of p80 with a DNA fragment encoding the Fc region of human IgG1 (Mohler et al., 1993). The resulting soluble receptor construct (rhTNFR:Fc) has been demonstrated to inhibit the actions of TNF-α both in vivoand in vitro (Peppel et al., 1991; Mohler et al., 1993;Wooley et al., 1993) and was kindly provided by Dr. M. B. Widmer (Immunex, Seattle, WA). rhTNFR:Fc was diluted in sterile PBS containing 0.1% BSA.
Recombinant murine (rm) TNF-α [code: 88/532 (First International Standard)] was obtained from the National Institute for Biological Standards and Control (NIBSC, South Mimms, UK) and used as a standard in the analysis of TNF-α bioactivity. rmTNF-α (activity = 7 × 10⁷ IU/mg protein) obtained from R & D Systems (Minneapolis, MN) was used for in vivo experiments. LPS (Escherichia coli serotype O26:B6; code L3755, lot 20H4025) was purchased from Sigma (St. Louis, MO) and dissolved in PBS.
Animals. Male Sprague Dawley rats (initial body weight 170–240 gm) were purchased from Harlan Sprague Dawley Laboratories (Indianapolis, IN) and housed in animal facilities (ambient temperature 22°C) adjacent to experimental rooms. They were maintained on a 12 hr light/dark cycle (lights on at 6 A.M.) and provided rat chow (Harlan-Teklad, Madison, WI) and water ad libitum. All procedures described were approved by The Salk Institute Animal Use and Care Committee.
Surgical preparation and intracerebroventricular treatment.Rats were equipped with intravenous catheters 48 hr before experimentation, as described previously (Turnbull and Rivier, 1996a). In a number of the experiments, animals received injections directly into the cerebroventricles via indwelling guide cannulae, which were implanted 7–9 d before intravenous cannulation, as described (Turnbull and Rivier, 1996c). Intracerebroventricular treatments (5 μl) were administered via a connecting injection needle (Plastics One), which extended 1 mm beyond the tip of the guide cannula, and injections were performed over a period of 60 sec. Passive immunoneutralization of cerebral TNF-α by intracerebroventricular infusion of 5 μl anti-TNF-α antiserum was performed the day before (i.e., 16 hr before) induction of local inflammation, a pretreatment regime that results in extensive tissue penetration of antibodies (Thomas et al., 1991; Doyle et al., 1992; Van der Zee et al., 1992, 1995) and avoids possible stress-induced hormone secretion caused by the intracerebral injection of immune serum. Soluble TNF receptor construct was administered immediately before induction of inflammation, as reported by others (Fan et al., 1996; Galasso et al., 1996). After completion of experiments, animals were killed, and 5 μl of india ink was injected via the intracerebroventricular assembly. Only data from animals that showed a distribution of ink throughout the ventricular system (i.e., third, fourth, and lateral ventricles and cerebral aqueduct) were included in subsequent analyses.
Induction of local inflammation and electrofootshocks.Sterile local inflammation was induced in the hindlimb by intramuscular injection of 50 μl of turpentine/100 gm body weight into the left thigh muscles (Turnbull et al., 1994; Turnbull and Rivier, 1996a). This produced a pronounced swelling of the limb that was evident ∼3–4 hr after injection. Control animals received a similar injection of 0.9% sterile saline, which produced no visible degree of swelling.
Electrofootshocks were applied to conscious, unrestrained rats using a footshock chamber of dimensions 30 cm wide × 26 cm deep × 26 cm high. One shock of 1 mA amplitude and 1 sec duration was applied every 3 min for a total of 45 min.
Sample collection and preparation. Blood samples were collected from undisturbed rats as described previously (Turnbull and Rivier, 1996a). For experiments in which repeated measurements were made, a maximum of 0.4 ml blood/sample was drawn on up to four occasions. Each time a blood sample was drawn, 0.2–0.3 ml of sterile, heparinized saline was injected to replace the volume of fluid lost. This paradigm permits at least five consecutive blood samples to be withdrawn without overt effects on HPA activity (Turnbull and Rivier, 1996a,c). Furthermore, the plasma ACTH response to turpentine is similar in rats sampled via intravenous cannulae and in surgically naive rats sampled from trunk blood after decapitation (Turnbull and Rivier, 1996a). After collection, each blood sample was divided into two chilled tubes: one containing EDTA (for measurement of ACTH) and the other containing preservative-free, sterile heparin (for measurement of TNF-α). Samples were centrifuged, and plasma was aliquoted and stored at −20°C (for ACTH) or −70°C (for TNF-α).
Determination of TNF-α bioactivity in specific, dissected brain regions was performed using the supernatants of tissue homogenates obtained by mincing and homogenizing (20 strokes of a dounce) brain tissue in assay medium, excluding fetal bovine serum (200 μl/hypothalamus, 250 μl/hippocampus, and 2 ml/cerebral cortex). Homogenates were spun at 16,000 g on a bench-top microfuge for 15 min, and the supernatant was decanted and stored at −70°C until assay. Total protein content of the supernatants was determined by a Bio-Rad protein assay (Bio-Rad Laboratories, Richmond, CA), based on the micro-Lowry method.
ACTH assay. Plasma ACTH concentrations were determined using a two-site immunoradiometric assay (Allegro, Nichols Institute, San Juan Capistrano, CA), as described previously (Rivier and Shen, 1994). Assay sensitivity was 5 pg/ml, and coefficients of variation at concentrations of 32 and 307 pg/ml were 1.9% and 2.4% within, and 18.2% and 15.7% between assays, respectively.
Analysis of TNF-α bioactivity. Biological activity of TNF-α was determined by comparing the cytotoxicity of samples to L929 cells with that of the rmTNF-α international standard (code: 88/532). L929 cells were cultured (7.5% CO2/92.5% 02, 37°C, 100% humidity) in RPMI-1640 media (Cellgro, Herndon, VA) containing 5% fetal bovine serum (Gemini BioProducts, Calabasas, CA), 2 mml-glutamine (Sigma), 50 μm2-β-mercaptoethanol (Sigma), and 50 U penicillin and 50 μg streptomycin/ml (Sigma) in 15-cm-diameter tissue culture dishes (Becton Dickinson, Cockeysville, MD). Confluent cells were removed using ∼15 ml of trypsin EDTA solution (IX, Sigma) and gentle agitation. Cells were washed and resuspended in media containing 0.5 μg/ml mitomycin C (Sigma). One hundred microliters of cells were then plated in standard 96-well microtiter plates (Costar Corporation, Cambridge, MA) at a concentration of 2 × 10⁵ cells/ml, and cultured overnight. Cells were then incubated with serially diluted (1:2 to 1:3) standard or samples for ∼24 hr. Media was removed from the cells by inverting the plates, and cell survival was determined colorimetrically using the tetrazolium salt MTT [3-(4,5-dimethylthiazol-2-yl)-2,5-diphenyl tetrazolium bromide (Sigma)]. One hundred microliters of MTT (1 mg/ml in PBS) were added to each well, and the plates were wrapped in foil and incubated at 37°C. After 4 hr, the tetrazolium salt precipitate was dissolved by adding 150 μl of 0.04 m HCl-2-propanol to each well. After an overnight incubation (room temperature) in the dark, the plates were read on a microplate reader (MR700, Dynatech Laboratories, Chantilly, VA) at 570 nm test wavelength and 640 nm reference wavelength. Concentrations of unknown samples were determined by measuring the displacement of their dilution curves from the standard, expressed as international units. All samples were assayed in either duplicate or triplicate (on separate plates), and each plate contained an internal control (plasma from an animal injected with 1 mg/kg LPS, which had previously been diluted 1:100). All samples from a single experiment were determined in the same assay, with the detection limits of the assay varying between 1 and 70 IU/ml.
In situ hybridization histochemistry. Animals were anesthetized deeply with an intraperitoneal injection of 35% chloral hydrate and perfused via the ascending aorta with saline followed by cold 4% paraformaldehyde in 0.1 m borate buffer, pH 9.5. Brains were post-fixed for 3–4 hr and then transferred to 10% sucrose/4% paraformaldehyde/0.1 m borate buffer overnight at 4°C. Frozen 30 μm sections were cut by a Histoslide microtome, collected in cryoprotectant (0.05 m sodium phosphate buffer, 30% ethylene glycol, 20% glycerol), and stored at −20°C until histochemical analysis.
Before hybridization, tissue sections were mounted onto gelatin and poly-l-lysine-coated slides, air-dried, and stored under a vacuum overnight. The slides were washed initially in a PBS/0.1% Brij 35 detergent buffer, pH 7.4. They then were treated with 5 μg/ml of proteinase K (EM Science, Gibbstown, NJ) in 0.1 m Tris, pH 8.0, 50 mm EDTA/0.1% Brij for 20 min at 37°C. The tissue was fixed for 5 min in 4% paraformaldehyde/diethylpyrocarbonate, acetylated with 0.25% acetic anhydride in 0.1 mtriethanolamine/0.1% Brij, pH 8.0, for 10 min, soaked in methanol for 5 min, and air-dried. The slides were treated in prehybridization mixture (50% formamide, 2× SSC, 1 mm EDTA, 1 mm Tris, pH 7.3, 1× Denhardt’s solution, 0.1 mg/ml yeast tRNA, 5% dextran sulfate) for 30 min at 37°C and then air-dried for ∼5 min, before hybridization.
TNF-α and IL-1β riboprobes were produced and quantitated using digoxigenin (dig) nucleic acid production and detection kits (Boehringer Mannheim, Indianapolis, IN), as described (Meltzer et al., 1997). To produce probe templates, an aliquot of first-strand amplification was added to a PCR reaction containing sense or antisense primers with a T7 RNA polymerase sequence. Primers for TNF-α (5′-TAATACGACTCACTATAGGGAGATACTGAACTTCGGGGTGATTGGTCC, 3′ - TAATACGACTCACTATAGGGAGACAGCCTTGTCCCTTGAAGAGAACC) and IL-β (5′-TAATACGACTCACTATAGGGAGACCTTGTGCAAGTGTCTGAAGCAG, 3′-TAATACGACTCACTATAGGGAGACTTCAAAGATGAAGGAAAAGAAGGTGC) were custom-designed and obtained from Biocan (Mississauga, Ontario, Canada). PCR product was then in vitro-transcribed using T7 RNA polymerase with dig-uridine triphosphate present. Dig-labeled TNF-α or IL-1β riboprobe (1 ng/ml) in prehybridization mixture was applied to each slide and then coverslipped. The slides were incubated at 95°C for 5 min and then allowed to hybridize overnight at 50°C.
The coverslips were removed by gentle soaking in 2× SSC/0.1% Brij and then treated with 20 mg/ml RNase A (Sigma) in the 2× SSC/0.1% Brij buffer for 30 min at 37°C. The slides were washed consecutively in 1× SSC/0.1% Brij, 0.1× SSC/0.1% Brij, and 2× SSC/Brij buffer, washed in a 10 mm sodium phosphate/0.1% Brij buffer, and then blocked for 1 hr in a 1% Boehringer block solution dissolved in 0.1 m maleic acid, 0.15 m NaCl/0.1% Brij. The slides were air-dried for ∼5 min and then incubated with a sheep anti-dig alkaline phosphatase-conjugated antibody (1:250; Boehringer Mannheim) under coverslips overnight at 4°C.
The following morning, the coverslips were removed by gentle soaking in the 10 mm sodium phosphate/Brij buffer. The slides were air-dried for ∼5 min and then developed in the detection solution (10% polyvinyl alcohol, 1 mm levamisole, 0.46 mm NBT, 0.43 mm 5-bromo-4-chloro-3-indoyl phosphate in 50 mm MgCl2/100 mmTris in 100 mm NaCl, pH 9.3). The slides were coverslipped and incubated overnight at 30°C.
The color reaction was stopped when the desired intensity was reached by soaking the coverslips off using 10 mm Tris, pH 8.0/1 mm EDTA buffer. The sections were coverslipped in glycerol gel (50% glycerol, 7.5% gelatin, 0.1% sodium azide in water) and examined microscopically.
Semi-quantitative RT-PCR (SQ-PCR). The expression of mRNA for TNF-α, IL-1β, and IL-6 in specific brain regions, as well as the pituitary and blood pellets from control animals and rats subjected to local inflammation, was analyzed by SQ-PCR. Hypothalami, hippocampus, and cerebral cortex were dissected rapidly, and whole pituitary was removed quickly after decapitation. These samples were frozen in liquid nitrogen and stored at −70°C until analysis. Trunk blood was collected, and blood cell pellets were obtained by centrifugation at 4°C for 10 min and stored at −70°C.
RNA extraction was performed using the TRIzol reagent (Life Technologies, Gaithersburg, MD). Tissues were homogenized in 1 ml TRIzol/50–100 mg of tissue with a Polytron homogenizer for 10 sec at maximal speed. Chloroform was added at 1:5 of the initial volume of TRIzol. Samples were incubated at room temperature for 15 min and then centrifuged at 12,000 g for 10 min at 4°C. After precipitation of the upper aqueous phase with isopropanol for 45 min, the pellet was washed with 75% ethanol, dried briefly, and dissolved in RNase-free water. The purity and amounts of the RNA obtained were checked by measuring the optical density at 260 and 280 nm.
Total RNAs were reverse-transcribed using a commercial kit (Superscript II RT kit, Life Technologies). Three micrograms of total RNA were incubated at 70°C for 10 min with 1 μl of oligo dT12–18 (0.5 μg/μl) and water to a final volume of 12 μl, and subsequently kept on ice for 1 min. Four microliters of 5× synthesis buffer (100 mm Tris-HCl, pH 8.4, 250 mm KCl, 12.5 mm MgCl2, 0.5 mg/ml BSA), 1 μl of 10 mm dNTP mix, 2 μl of 0.1 m DTT, and 1 μl of Superscript II reverse transcriptase were added to the mixture and incubated at room temperature for 10 min. The tubes were transferred to 42°C for 60 min. The reaction was terminated by incubating the samples at 70°C for 15 min.
IL-1β, IL-6, and TNF-α cDNAs were quantified from 200 ng of reverse-transcribed RNA by co-amplification with 100 fg of a multispecific internal control (pRat6) by PCR, as described previously (Bouaboula et al., 1992; Pitossi et al., 1997). pRat6 carries priming sites for several rat cytokines and house-keeping genes, including IL-1β, IL-6, TNF-α, and β-microglobulin (Pitossi and Besedovsky, 1996). The sequences of the primers used were as follows: for IL-1β, sense: TCCATGAGCTTTGTACAAGG, and antisense: GGTGCTGATGTA CCAGTTGG; for IL-6, sense: TGTTCTCAGGGAGATCCTGG, and antisense: TCCAGGTAGAAACGGAACTC; for TNF-α, sense: AAATGGGCTCCCTCTCATCA, and antisense: AGCCTTGTCCCTTGAAGAGA; for β2-microglobulin, sense: ATCTTTCTGGTGCTTGTCTC, and antisense: AGTGTGAGCCAGGATGTAGT. The ratio obtained after 30 cycles of amplification between the amounts of cDNA and pRat6 represents the relative abundance of a distinct cDNA in a sample. β-2 microglobulin concentration in each reverse-transcribed sample was determined to check the reverse-transcribed efficiency and the accuracy of the determination of the RNA concentration. For this purpose, 1/60 of each reverse-transcribed product was spiked with 0.100 pg of pRat6 and amplified for 30 cycles in the presence of 0.2 μl32P-α dCTP and β-2 microglobulin specific primers. In addition, an amount of RNA, similar to that of brain samples, from the spleen of either control rats or rats treated 2 hr earlier with LPS (2 mg/kg, i.p.) was used as a positive control.
Data presentation and statistical analyses. The data are presented as mean ± SEM, and the number of subjects in each experimental group is indicated in the figure legends. Statistical analyses of repeated ACTH measurements was performed using ANOVA with repeated measures, followed by least squared means difference analysis as a post hoc test, as appropriate. All other statistical analyses were performed using an unpaired Student’s t test. A two-tailed probability of <5% (i.e. p < 0.05) was considered statistically significant.
RESULTS
Intracerebroventricular rmTNF-α elevates plasma ACTH concentrations
Immediately before the intracerebroventricular injection of either vehicle (PBS containing 0.01% BSA) or rm TNF-α (1.75–28 × 103 IU), there were no significant differences in plasma ACTH concentrations (15–78 pg/ml) between the different groups studied. After intracerebroventricular injection of only the vehicle (at 12 P.M.), plasma ACTH values remained constant for 60 min but rose slightly between 120 and 240 min (to a maximum of 70 ± 7 pg/ml). Figure 1 shows that intracerebroventricular injection of rm TNF-α significantly affected plasma ACTH concentrations (F(3,18) = 3.288; p < 0.05), with the elevations produced by 7 × 10³ and 28 × 103 IU doses achieving statistical significance (p < 0.05, least squared means). The increase in plasma ACTH values produced by intracerebroventricular TNF-α was rapid (within 30 min), dose-dependent (30 min: 1.75 × 10³ IU, 180 ± 68 pg/ml; 7 × 10³ IU, 284 ± 56 pg/ml; 28 × 103 IU, 445 ± 162 pg/ml), and prolonged (duration 3–4 hr).
Fig. 1.

Effect of rm TNF-α (1.75–28 × 103 IU) infused intracerebro-ventricularly into the lateral cerebroventricles on plasma ACTH concentrations in rats. Statistical analyses showed that there was a significant overall interaction between treatments (F(3,18) = 3.28; p = 0.045), and that both 7 × 10³ IU (p = 0.032) and 28 × 103 IU (p = 0.007) doses produced significant elevations in plasma ACTH concentrations (least squared means). n = 5–7 subjects per experimental group.
Inhibition of TNF-α action within the brain diminishes the rise in plasma ACTH concentrations due to local inflammation produced by turpentine but not produced by electrofootshock
Turpentine or saline was injected intramuscularly at 8 A.M. As reported previously (Turnbull and Rivier, 1996a), plasma ACTH concentrations in saline-injected animals rose from 5–10 pg/ml at 11 A.M. to 35–70 pg/ml at 5 P.M., as lights-out approached (6 P.M.). Plasma ACTH concentrations in rats injected intramuscularly with saline were unaffected by treatment either intracerebroventricularly or intravenously with either anti-TNF-α or rhTNFR:Fc (Figs.2, 3, 4).
Fig. 2.
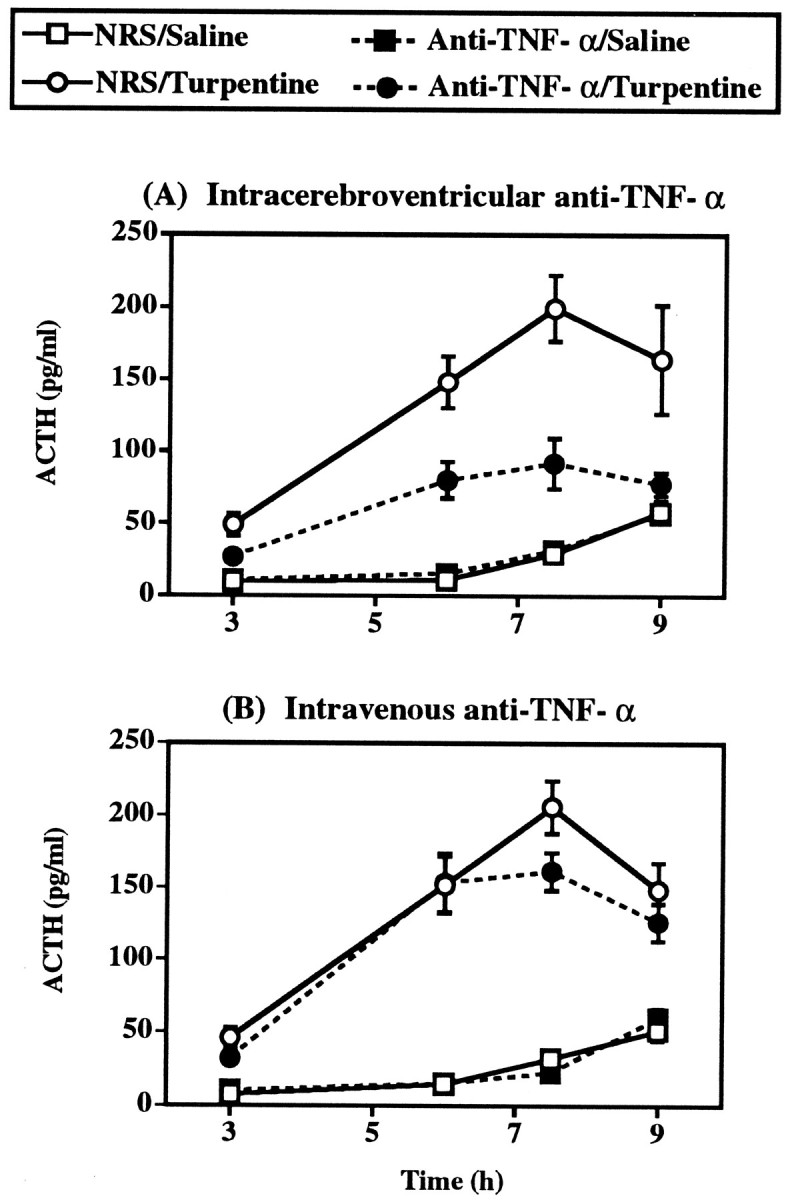
Effect of pretreatment 16 hr before with either (A) 5 μl of neat anti-TNF-α intracerebroventricularly or (B) 500 μl of 1:100 anti-TNF-α intravenously on the ACTH response to local inflammation induced by 50 μl turpentine/100 gm body weight intramuscularly. Control treatments were intracerebroventricular or intravenous normal rabbit serum (NRS) plus intramuscular saline. Statistical analysis showed that turpentine injection and intracerebroventricular treatment with anti-TNF-α significantly interacted (F(1,35) = 16.65; p < 0.001; ANOVA with repeated measures), whereas turpentine and intravenous anti-TNF-α did not significantly interact (F(1,70) = 1.57; p = 0.214; ANOVA with repeated measures). n = 9–20 subjects per experimental group.
Fig. 3.
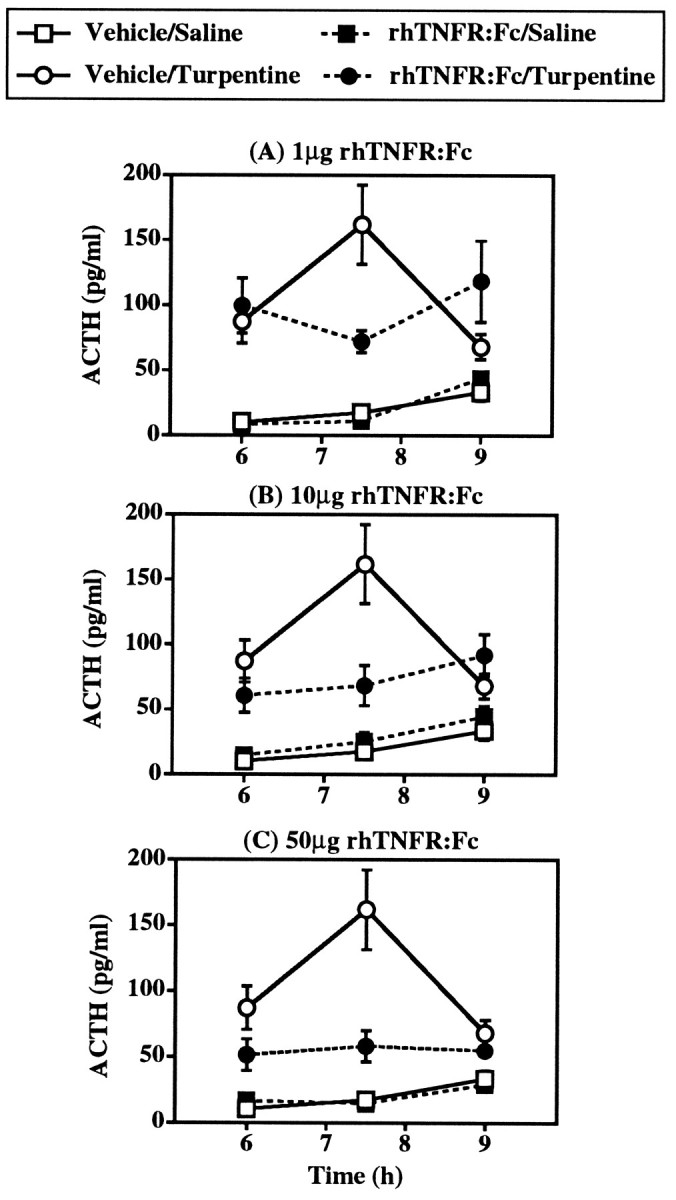
Effect of intracerebroventricular pretreatment with 1–50 μg rhTNFR:Fc on the ACTH response to local inflammation induced by 50 μl turpentine/100 gm body weight (intramuscular). Control treatments were PBS (intracerebroventricular) plus saline (intramuscular). The effects of all three doses were tested in one experiment, but for the sake of clarity the effects of each dose are illustrated separately and compared with the one vehicle/saline group and one vehicle/turpentine group present in this study. Statistical analysis showed that turpentine injection and intracerebroventricular treatment with rhTNFR:Fc significantly interacted (F(3,63) = 5.14; p = 0.003; ANOVA with repeated measures). n = 7–10 subjects per experimental group.
Fig. 4.
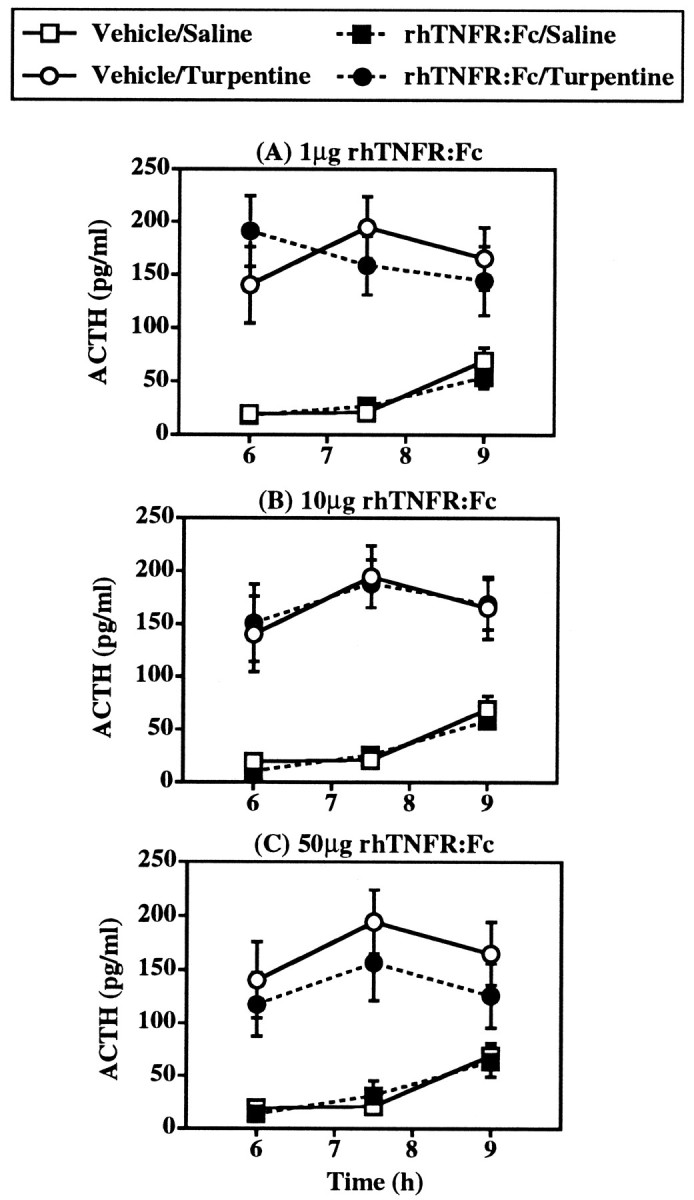
Effect of intravenous pretreatment with 1–50 μg rhTNFR:Fc on the ACTH response to local inflammation induced by 50 μl turpentine/100 gm body weight (intramuscular). Control treatments were PBS (intravenous) plus saline (intramuscular). The effects of all three doses were tested in one experiment, but for the sake of clarity the effects of each dose are illustrated separately and compared with the one vehicle/saline group and one vehicle/turpentine group present in this study. Statistical analysis showed that turpentine injection and intravenous treatment with rhTNFR:Fc did not significantly interact (F(3,59) = 0.43; p = 0.730; ANOVA with repeated measures). n = 8–9 subjects per experimental group.
A significant elevation in plasma ACTH concentrations was observed in all groups of rats subjected to local inflammation induced by the intramuscular injection of turpentine (p < 0.001 in each experiment; ANOVA with repeated measures) (Figs. 2, 3, 4). As in our earlier study (Turnbull and Rivier, 1996a), plasma ACTH concentrations were only slightly elevated 3 hr after turpentine injection (45–50 pg/ml vs 5–10 pg/ml in saline-injected controls) (Fig. 2). Thereafter, plasma ACTH concentrations rose to a peak at 7.5 hr. The plasma ACTH response to turpentine was unaffected by the control treatments with serum, as indicated by the similar peak ACTH responses in animals pretreated with NRS intracerebroventricularly (200 ± 23 pg/ml), NRS intravenously (203 ± 19 pg/ml), PBS intracerebroventricularly (162 ± 20 pg/ml), and PBS intravenously (195 ± 29 pg/ml).
In animals pretreated intracerebroventricularly with 5 μl of anti-TNF-α 16 hr before, the elevation in plasma ACTH concentration produced by local inflammation induced by turpentine was reduced markedly (Fig. 2). The plasma ACTH responses to turpentine in intracerebroventricular NRS- and anti-TNF-α-treated animals were of similar temporal profiles, but the magnitude of ACTH response in intracerebroventricular anti-TNF-α rats was approximately two-thirds smaller (Table 1), and there was a significant interaction between turpentine and intracerebroventricular treatments (F(1,35) = 16.65; p < 0.001; ANOVA with repeated measures). In contrast, intravenous pretreatment with 5 μl anti-TNF-α in 0.5 ml had no statistically significant impact on the ACTH response to turpentine (F(1,70) = 1.57; p = 0.214; ANOVA with repeated measures) (Fig. 2).
Table 1.
Percentage inhibition of the peak ACTH response to local inflammation and electrofootshock stress produced by either anti-TNF-α or rhTNFR:Fc
| Intravenous route | Intracerebroventricular route | |
|---|---|---|
| Local inflammation | ||
| Immunoneutralization | ||
| Anti-TNF-α | 25 ± 8 | 64 ± 101-165 |
| Soluble receptor construct | ||
| 1 μg rhTNFR:Fc | 29 ± 19 | 62 ± 6ns |
| 10 μg rhTNFR:Fc | 4 ± 13 | 65 ± 111-160 |
| 50 μg rhTNFR:Fc | 22 ± 20 | 72 ± 8* |
| Footshock stress | ||
| Immunoneutralization | ||
| Anti-TNF-α | Not done | −1 ± 14ns |
Values represent the mean ± SEM of the % inhibition of the peak ACTH response to local inflammation induced by either turpentine (7.5 h) or electrofootshock (30 min); 100% response was calculated as the difference between the mean plasma ACTH concentrations observed in control, unstimulated rats and those in NRS- or PBS-pretreated turpentine or NRS-pretreated electrofootshock rats, as appropriate. The ACTH “response” in individual, treated (anti-TNF-α or rhTNFR:Fc) rats was then similarly calculated, and the % inhibition was determined for each animal. ns, Not significant;
p < 0.05,
F1-160: p < 0.01,
F1-165: p < 0.001 versus respective intravenous treatment (unpaired Student’s t test).
As with anti-TNF-α pretreatment, inhibition of TNF-α action by intracerebroventricular injection of rhTNFR:Fc dramatically reduced the ACTH response to local inflammation (Fig. 3). Intracerebroventricular administration of 1–50 μg rhTNFR:Fc immediately before turpentine produced a significant interaction between intracerebroventricular and turpentine treatments (F(3,63) = 5.14; p = 0.003; ANOVA with repeated measures). The extent of inhibition of the ACTH response at 7.5 hr after turpentine produced by intracerebroventricular rhTNFR:Fc was similar at the three doses used (62–72% reduction) and was equal to that afforded by intracerebroventricular anti-TNF-α (64% reduction) (Table 1). The effects of intracerebroventricular rhTNFR:Fc on the plasma ACTH response to turpentine, however, seemed to be dose-dependent at 6 and 9 hr, with lower doses of rhTNFR:Fc producing even higher ACTH concentrations than those in turpentine-treated controls at 9 hr (PBS: 68 ± 7 pg/ml; rhTNFR:Fc: 50 μg: 55 ± 3 pg/ml; 10 μg: 92 ± 12 pg/ml; 1 μg: 118 ± 27 pg/ml). In contrast to intracerebroventricular treatment, intravenous treatment with identical doses of rhTNFR:Fc had no statistically significant effect on the plasma ACTH response to turpentine (F(3,59)= 0.43; p = 0.730; ANOVA with repeated measures) (Fig. 4).
Unlike inhibition of TNF-α action within the brain of animals subjected to local inflammation, intracerebroventricular pretreatment 16 hr before with 5 μl of anti-TNF-α had no significant impact on the rise in plasma ACTH caused by electrofootshock (F(1,22) = 0.06; p = 0.815; ANOVA with repeated measures) (Fig. 5). Similar peak plasma ACTH concentrations were observed in NRS- (668 ± 57 pg/ml) and anti-TNF-α- (673 ± 91 pg/ml) treated rats 30 min after the onset of footshocks.
Fig. 5.

Effect of pretreatment 16 hr before with either 5 μl of neat anti-TNF-α intracerebroventricularly on the ACTH response to electrofootshock (1 mA, 1 sec duration, 1 shock/3 min). Control treatment was NRS (intracerebroventricular). Statistical analysis showed that footshock treatment and intracerebroventricular treatment with anti-TNF-α did not significantly interact (F(1,22) = 0.06; p = 0.815; ANOVA with repeated measures). n = 11–13 subjects per experimental group.
Plasma TNF-α bioactive protein is not affected measurably by local inflammation produced by turpentine
In intravenously cannulated control rats, plasma TNF-α-like bioactivity was low (below 300 IU/ml) but detectable in four of five animals (Table 2). Incubation of these same plasma samples with a 1:100 dilution of NRS slightly increased the magnitude of TNF-α-like activity detected in each sample. When plasma samples were incubated with a 1:100 dilution of anti-TNF-α, however, all TNF-α-like activity was lost (Table 2), indicating that the cytotoxicity observed in the plasma of control rats was attributable to authentic TNF-α.
Table 2.
TNF-α (IU/ml)-like activity in cannulated, untreated (control) rats
| Rat | Plasma alone | Plasma + NRS (1:100) | Plasma + anti-TNF-α (1:100) |
|---|---|---|---|
| 1 | 291 | 356 | <38 |
| 2 | 134 | 193 | <38 |
| 3 | 206 | 243 | <45 |
| 4 | 90 | 180 | <63 |
| 5 | <63 | 89 | <63 |
Blood samples were collected from individual rats 48 h after insertion of jugular venous catheters, and plasma samples were incubated with L929 cells to determine TNF-α-like activity. Samples were incubated in the assay, either alone or in the presence of a 1:100 dilution of either normal rabbit serum (NRS) or rabbit anti-TNF-α. Results are expressed as international units per milliliter (IU/ml).
In a separate series of experiments, plasma TNF-α bioactivity in rats treated with either saline (intramuscularly), turpentine (intramuscularly), or LPS (intravenously) was compared (Table3). Similar plasma TNF-α bioactivity was observed in saline- (153–319 IU/ml) and turpentine-injected rats (193–312 IU/ml) 0–7 hr after treatment, but LPS produced a transient (1–2 hr) and extremely marked increase (peak 21,324 IU/ml) in plasma TNF-α bioactivity (Table 3).
Table 3.
TNF-α (IU/ml)-like activity in the plasma of saline-, turpentine-, or LPS-treated rats
| Time (hr) | Saline (i.m.) | Turpentine (i.m.) | LPS (i.v.) |
|---|---|---|---|
| 0 | 153 ± 45 | 243 ± 45 | 302 ± 102 |
| 1 | 239 ± 62 | 298 ± 91 | 21,324 ± 8345 |
| 2 | – | 213 ± 60 | 6125 ± 1021 |
| 3 | 319 ± 71 | 193 ± 35 | 939 ± 129 |
| 4 | – | 300 ± 89 | – |
| 5 | 267 ± 32 | 218 ± 56 | – |
| 6 | – | 312 ± 82 | – |
| 7 | 299 ± 76 | 278 ± 56 | – |
Rats were injected with either 50 μl/100 gm of either saline or turpentine (i.m.) or 5 μg/kg LPS (i.v.). n = 3–5 per experimental group. i.m., Intramuscular; i.v., intravenous.
Local inflammation produced by turpentine does not elicit measurable increases in brain TNF-α bioactivity or mRNA
Results from the previous two series of experiments indicated that TNF-α mediates the ACTH response to turpentine-induced local inflammation by an action within the CNS, and that there is no apparent rise in TNF-α levels in peripheral blood. This suggests that the likely site of production of TNF-α that produces the HPA axis response to local inflammation is within the brain itself.
To determine whether TNF-α protein could be detected in brains, TNF-α-like activity in the supernatants of brain homogenates was measured, using methods similar to those that have previously proved successful for the detection of TNF-α, IL-1, and IL-6 bioactivity/immunoreactivity (Fontana et al., 1984; Hagan et al., 1993;Taupin et al., 1993; Quan et al., 1996; and our own unpublished data). In initial experiments, individual hypothalami from control, untreated rats were placed in Eppendorf tubes, and 250 μl of tissue culture media containing 0, 30, or 900 IU of TNF-α was added. The hypothalami were homogenized as described, and supernatants were assayed for TNF-α-like activity. No TNF-α-like activity was measurable in supernatants of hypothalami homogenized in the absence of recombinant TNF-α. Recovery of “spiked” TNF-α was 73% at 30 IU/hypothalamus and 99% at 900 IU/hypothalamus. In additional experiments, TNF-α bioactivity was undetectable in the supernatants of hypothalamic, hippocampal, and cortical homogenates of control animals, but was markedly elevated in all three regions after intracerebroventricular injection of 1 μg LPS (Table4); however, TNF-α-like activity of supernatants of the homogenates from these brain regions of rats 5–8 hr after turpentine remained undetectable (Table 4).
Table 4.
TNF-α activity (IU/mg protein) in specific brain regions in control, turpentine-, and LPS-treated rats
| Control | LPS (1 μg, i.c.v.) 1 hr | LPS (1 μg, i.c.v.) 3 hr | Turpentine 5, 6.5, 8 hr | |
|---|---|---|---|---|
| Hypothalamus | Not detectable | 63.5 ± 9.8 | 23.2 ± 3.7 | Not detectable |
| (1.7–2.4) | (0.2–2.7) | |||
| Hippocampus | Not detectable | 39.3 ± 8.0 | 79.1 ± 23.7 | Not detectable |
| (0.9–1.4) | (0.6–4.8) | |||
| Cerebral cortex | Not detectable | 11.0 ± 0.8 | 25.5 ± 2.5 | Not detectable |
| (1.8–4.0) | (0.7–3.4) |
Rats remained either untreated (control) or were injected either intramuscularly with 50 μl/100 gm turpentine or intra-cerebroventricularly (i.c.v.) with LPS (1 μg/rat). Rats were killed either 1 or 3 hr after LPS or 5, 6.5, or 8 hr after turpentine; brain regions were dissected and homogenized, and TNF-α activity of the resulting supernatants was determined. Values in parentheses are the range of detection limits for each sample.n = 3–4 per group.
In situ hybridization analysis with dig-labeled TNF-α riboprobes yielded no consistently detectable signal in any region in the brains of control rats, using either antisense or sense probes. With antisense probes, a marked hybridization signal of TNF-α mRNA was detected in the hippocampal region of rats injected with LPS (100 ng, i.c.v.) 3 hr earlier (Fig. 6). This signal was not apparent with sense probes (data not shown). As in control animals, there was no consistent TNF-α mRNA hybridization signal with either antisense or sense riboprobes in the brains of rats subjected to local inflammation by injection of turpentine, either 5 hr (data not shown) or 7.5 hr earlier (Fig. 6). A similar pattern of no signal in either control or turpentine-injected animals and a strong hybridization signal in the hippocampus of rats injected with LPS 3 hr earlier was observed using IL-1β dig-labeled riboprobes (data not shown).
Fig. 6.

Nonradioactive in situhybridization histochemical analysis of TNF-α mRNA expression in the hippocampus of rats injected with either vehicle (left), 3 hr after LPS (100 ng, i.c.v.) (center), or 7.5 hr after 50 μl turpentine/100 gm body weight (right).Top panels at 90× magnification and bottom panels at 225× magnification. cc, Corpus callosum. These are data from single representative animals of experiments comprising four subjects per experimental group. No TNF-α mRNA hybridization signal was noted in any other brain regions in any treatment group.
SQ-PCR analysis was performed on RNA extracted from several brain regions (hypothalamus, hippocampus, and cortex), the pituitary, and blood cell pellets. To determine the contribution of contaminating blood cells to the signals obtained in the experimental brain samples, serial 1:10 dilutions of cDNAs from peripheral blood of the corresponding experimental animals were amplified. The last dilution tested contained cDNA derived from 3 ng of total RNA and represents 10 times any possible contribution of blood cells to the cytokine signal (Pitossi et al., 1997). This last dilution showed no detectable blood-borne signal for all cytokines tested (data not shown). Figure7 shows a representative ethidium bromide-stained agarose gel comparing TNF-α mRNA in the various experimental samples, and Figure 8 shows mean ± SEM for the ratios of the detection of cytokine mRNA (TNF-α, IL-1β, and IL-6) to that of the internal standard (pRat6). SQ-PCR indicated detectable levels of TNF-α mRNA in all samples examined, with the relative abundance compared with internal control being pituitary > blood > cortex > hypothalamus > hippocampus. Positive control samples from rat spleen showed an 18-fold increase in TNF-α mRNA levels 2 hr after LPS treatment, compared with controls; however, injection of turpentine 7.5 hr earlier produced no effect on TNF-α mRNA levels in any of the regions tested (hypothalamus, hippocampus, cortex, pituitary, or blood) (Figs. 7, 8). Similarly IL-1β and IL-6 mRNA levels were unchanged by turpentine treatment (Fig. 8).
Fig. 7.

Detection of TNF-α transcripts by SQ-PCR. Ethidium bromide-stained agarose gel showing the different amplicons, which are indicated by arrows [competitive fragment (c.f.): 480 basepair (bp); TNF-α amplicon: 248 bp]. Lane 1: cortex control; lane 2: cortex after turpentine treatment (turp); lane 3: hypothalamus control; lane 4: hypothalamus turp; lane5: hippocampus control; lane 6: hippocampus turp; lane 7: pituitary control; lane8: pituitary turp; lane 9: blood control; lane 10: blood turp; lane 11: no reverse transcriptase added to the RT-PCR; lane 12: no cDNA added to the PCR; lane 13: spleen control; lane14: spleen from rat given LPS (1 mg/kg, i.p.); lane15: 500 molecules of the (pRat6);M: 100 bp ladder molecular weight marker.
Fig. 8.
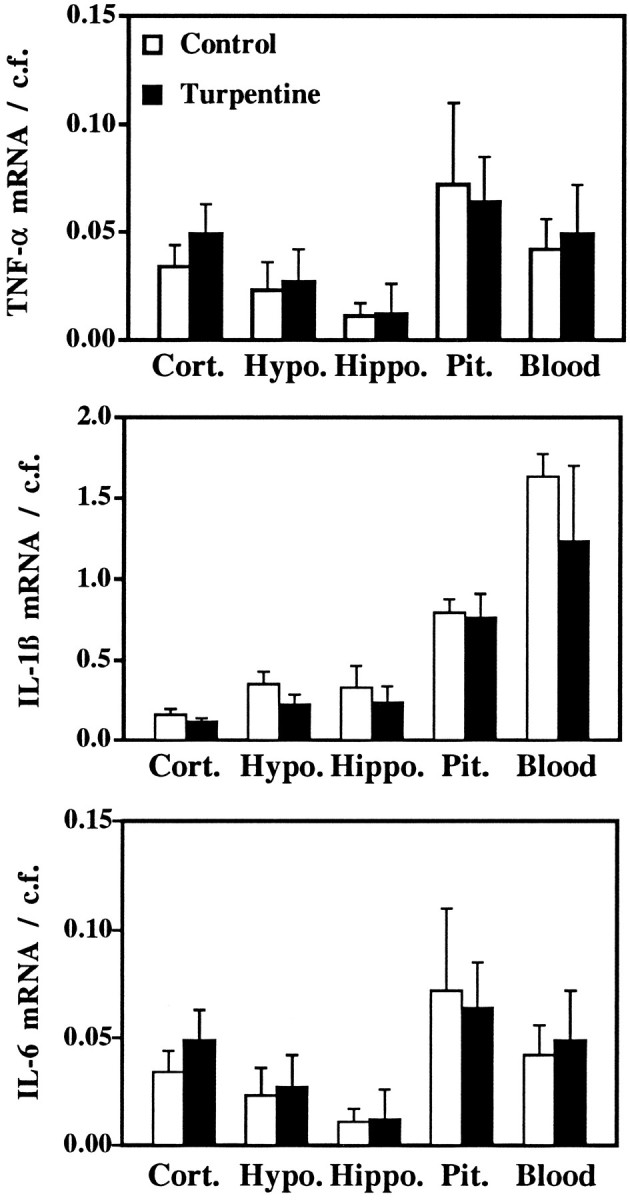
Mean ± SEM of the relative abundance of cytokine transcript (TNF-α, top; IL-1β,middle; IL-6, bottom) compared with the competitive fragment (pRat6). Statistical analyses (unpaired Student’s t test) indicated no significant differences between control and turpentine-treated rats for any transcript in any region examined. Samples from spleen indicated marked increases in cytokine transcripts after treatment with LPS (2 hr after 1 mg/kg, i.p.), compared with control, untreated rats. TNF-α: control 0.63 ± 0.10, LPS 33.47 ± 11.09; IL-1β: control 2.89 ± 0.44, LPS 52.86 ± 12.34; IL-6 0.24 ± 0.08, LPS 22.35 ± 3.84). n = 3 subjects per experimental group.
DISCUSSION
The present work demonstrates that TNF-α plays a major role within the CNS in activating the HPA axis during acute local inflammation in rats. Injection of recombinant TNF-α into the cerebroventricles of otherwise normal, healthy animals produced a rapid, marked, and sustained elevation in plasma ACTH concentrations. During acute local inflammation, the consequent elevations in plasma ACTH concentrations were reduced markedly by inhibition of TNF-α action specifically within the brain, either by intracerebral passive immunoneutralization or by previous intracerebral treatment with a soluble receptor construct that binds and inhibits the actions of TNF-α (Peppel et al., 1991; Mohler et al., 1993; Wooley et al., 1993).
The profound increases in plasma ACTH concentrations produced by intracerebral TNF-α observed here are in marked contrast to previous studies. Sharp et al. (1989) and van der Meer et al. (1996) reported that human TNF-α administered either into the lateral cerebroventricle or directly into the median eminence has no effect on plasma ACTH levels. Conversely, these authors (Sharp et al., 1989; van de Meer et al., 1996), as well as others (Bernardini et al., 1990;Besedovsky et al., 1991; Watanobe and Takebe, 1992; Sharp and Matta, 1993), have reported marked ACTH secretagogue activity of human TNF-α when administered intravenously. The apparent difference between the effects of intracerebral mouse and human TNF-α on plasma ACTH concentration may reflect the differing pharmacological profiles of the two identified TNF receptors, TNF-R1 and TNF-R2. Murine TNF-R1 has high affinity for either mouse or human TNF-α, whereas at murine TNF-R2 only mouse TNF-α is effective (Lewis et al., 1991; Heller et al., 1992; Mackay et al., 1994). Should the same pharmacology be true at rat TNF-α receptors, as has been suggested (Stefferl et al., 1996), then the increase in plasma ACTH concentrations induced by intracerebral mouse but not human TNF-α indicates that TNF-R2 is the major receptor isoform involved in cerebral TNF-α modulation of HPA activity.
Our work also clearly indicates an important role ofendogenous cerebral TNF-α in regulating the response of the HPA axis to local inflammation. Inflammation was induced by the intramuscular injection of turpentine, which produces an initial transient (1–2 hr after injection) series of physiological responses (elevation in body temperature, hypermetabolism, activation of the HPA axis) attributable to nociceptive afferent inputs (Cooper and Rothwell, 1991; Turnbull et al., 1994; Turnbull and Rivier, 1996a). This is followed by a full-blown APR that commences at ∼3–4 hr, lasts for at least 24 hr, and is mediated, at least in part, by a number of cytokines, e.g., IL-1, IL-6, and TNF-α (Oldenburg et al., 1993;Cooper et al., 1994a; Kopf et al., 1994; Turnbull et al., 1994; Zheng et al., 1995; Turnbull and Rivier, 1996a). Here we demonstrate that inhibition of TNF-α action specifically within the brain markedly reduces the ACTH response that is apparent 3.0–7.5 hr after turpentine administration. In contrast, the ACTH response to mild electrofootshocks was unaffected by intracerebroventricular anti-TNF-α, indicating that inhibition of TNF-α action within the brain does not affect the responsiveness of HPA axis nonspecifically. Interestingly, the reductions in plasma ACTH concentration at 7.5 hr after turpentine produced by either anti-TNF-α or the three different doses of rhTNFR:Fc were similar (62–72% inhibition), suggesting that this is a maximal inhibition and, by inference, that there is a small component of the ACTH response that is independent of TNF-α acting within the brain. Although anti-TNF-α treatment produced inhibition of the ACTH response to local inflammation at all time points measured (3–9 hr), the effects of rhTNFR:Fc, particularly at 9 hr, seemed to be dose-dependent. The slight exacerbation of the ACTH response at this time, which was apparent with the smallest dose (1 μg), is consistent with previous reports demonstrating that at low doses rhTNFR:Fc acts as a TNF-α carrier, resulting in enhanced rather than inhibited responses to TNF-α once its binding capacity has been exceeded (Mohler et al., 1993). Intravenous administration of similar doses of either antiserum or rhTNFR:Fc had no significant effect on plasma ACTH levels during local inflammation, although it cannot be excluded that higher doses of either of these TNF-α inhibitors may have an impact. Indeed peripheral administration of larger doses (80-fold) of the same anti-TNF-α antiserum markedly attenuate the fever, hypermetabolism, and elevations in plasma IL-6 concentration produced by turpentine (Cooper et al., 1994a). Whether or not complete inhibition of TNF-α action within the periphery significantly influences the HPA response to local inflammation, the present work clearly indicates that TNF-α acting within the CNS is an important, although probably not the sole, factor in the elaboration of elevated HPA activity caused by local inflammation.
The present study also sought to determine the site (periphery or brain) of production of cerebral TNF-α that influenced HPA activity during local inflammation. We considered two possibilities: (1) that TNF-α was generated in the periphery at the site of the inflammatory insult and gained access to the CNS via circulation in blood and subsequent transport across the blood–brain barrier (Gutierrez et al., 1993), and (2) that TNF-α production within the CNS was elevated during the inflammatory insult, as has been demonstrated during endotoxemia (Gatti and Bartfai, 1993; Breder et al., 1994; Laye et al., 1994; Liu et al., 1996; Pitossi et al., 1997).
Numerous studies have demonstrated that TNF-α concentrations are markedly elevated at the site of local inflammation in rodents (e.g.,Ford et al., 1989; Ferrandiz and Foster, 1991; Karalis et al., 1991;Smith-Oliver et al., 1993; Sekut et al., 1994); however, the relationship between tissue and circulating levels of TNF-α is controversial (Franks et al., 1991; Remick, 1991; Tracey and Cerami, 1992; Sekut et al., 1994). Although we found detectable levels of bioactive TNF-α in the plasma of control intravenously cannulated rats, there was no change in its concentration during acute local inflammation over the time course that we showed to be relevant to the cerebral TNF-α-mediated increases in HPA activity. This is consistent with a number of studies that have demonstrated marked elevations in inflamed tissue levels of TNF-α but no alteration in its blood concentration (Ford et al., 1989; Cooper et al., 1994a; Sekut et al., 1994). Taken together with the observation of only limited transport of TNF-α from blood to brain (Gutierrez et al., 1993), these data indicate that the effects we observed of inhibition of TNF-α action within the CNS are unlikely to be attributable to inhibition of TNF-α of peripheral origin.
In response to the peripheral administration of LPS, the CNS expresses elevated levels of TNF-α mRNA (Gatti and Bartfai, 1993; Breder et al., 1994; Laye et al., 1994; Liu et al., 1996; Pitossi et al., 1997), as well as other inflammation-related cytokines such as IL-1 and IL-6 (Ban et al., 1992; van Dam et al., 1992, 1995; Gatti and Bartfai, 1993;Muramami et al., 1993; Laye et al., 1994, 1995; Quan et al., 1994;Buttini and Boddeke, 1995; Gabellec et al., 1995; Pitossi et al., 1997). Thus it has been proposed that the changes in CNS function (e.g., fever, sickness, behavior, activation of the HPA axis) during endotoxemia may be attributable to the influence of cytokines generated within the CNS (Kakucska et al., 1993; Klir et al., 1993; Roth et al., 1993; Hopkins and Rothwell, 1995; Laye et al., 1995; Rothwell and Hopkins, 1995). The present study, however, suggests that previous findings of increased cerebral cytokine expression during endotoxemia cannot necessarily be extended to include all peripheral inflammatory insults. Acute local inflammation induced by turpentine did not result in detectable increases in TNF-α protein in either hypothalamus, hippocampus, or cerebral cortex over the time course of study (5–8 hr after turpentine injection). Furthermore, TNF-α mRNA could not be detected in any brain region 5 or 7.5 hr after turpentine by using nonradioactive in situ hybridization procedures. That these approaches were able to detect elevations in TNF-α synthesis in brain was demonstrated by the increases observed after cerebral administration of LPS. Even with use of the exquisitely sensitive technique of SQ-PCR [which detects as little as 1 molecule of cytokine mRNA per 10 cells (Pitossi et al., 1997)], no change in TNF-α mRNA was demonstrable even at the peak of the HPA axis response to turpentine. Similarly, no changes in either IL-1β mRNA by in situ hybridization or IL-1β or IL-6 mRNAs by SQ-PCR were apparent. It remains possible that we were unable to detect small elevations in cerebral cytokine synthesis in very localized subregions of the CNS. Furthermore, increases in cerebral cytokine synthesis may occur at times other than those adopted in the present study. But since the regions of the brain (hypothalamus, hippocampus, cortex) and pituitary sampled by the most sensitive technique (SQ-PCR) are those most implicated in the regulation of neuroendocrine functions, and many of the APRs (e.g., fever, hypermetabolism, HPA activation) to local inflammation induced by turpentine peak at ∼8 hr (Cooper and Rothwell, 1991; Cooper et al., 1994a; Turnbull et al., 1994; Turnbull and Rivier, 1996a), we believe it highly unlikely that elevated cytokine synthesis within the CNS contributes to the ensuing APRs. In particular, the markedly suppressive effects of inhibition of TNF-α action within the brain that we demonstrate here seem not to be caused by elevated TNF-α synthesis within the brain.
The apparent paradox of no change in brain levels of TNF-α but a key physiological role of TNF-α within the brain in response to acute inflammation indicates that basal cerebral synthesis of TNF-α is sufficient to produce, or at least contribute to, the elevated HPA activity. Although absolute levels of TNF-α protein or mRNA were not altered measurably, elevated release of preexisting TNF-α from either neurons or more likely from astrocytes or glial cells might be sufficient to account for the activation of the HPA axis that is apparent during acute local inflammation. Indeed, immunocytochemical evidence indicates that TNF-α protein is distributed discretely in the mouse CNS, particularly in areas involved in autonomic and endocrine regulation, including the hypothalamus, amygdala, and bed nucleus of the stria terminalis (Breder et al., 1993). Whether a similar distribution is apparent in the rat CNS is not known, although clearly the levels of TNF-α protein are below the detection limits of the methodology used in the present work (L929 bioassay of brain homogenates). Alternatively, TNF-α may play a permissive or synergistic role in the regulation of HPA activity during acute local inflammation. Recent studies demonstrating that neutralization of cytokine action in brain reduces the fever response to prostaglandin E2 (PGE2) (Fernandez-Alonso et al., 1996) suggest a permissive action of cytokines within the brain in response to PGs. Because local inflammation induced by turpentine produces marked increases in brain concentrations of PGE2 (Cooper et al., 1994b), and the accompanying HPA axis response is completely reversed by the cyclo-oxygenase inhibitor ibuprofen (Turnbull and Rivier, 1996a), it seems plausible that TNF-α signaling within the brain is necessary for the full expression of the HPA-activating effects of PGE2.
Footnotes
This work was supported by National Institutes of Health Grant DK26741 (C.R.) and the Foundation for Research (FFR). C.R. is an FFR Investigator. We are grateful to Dr. Steve Kunkel (University of Michigan) and Dr. Tony Troutt (Immunex Corporation, Seattle, WA) for their generous gifts of reagents.
Correspondence should be addressed to Catherine Rivier, The Clayton Foundation Laboratories for Peptide Biology, The Salk Institute, 10010 North Torrey Pines Road, La Jolla, CA 92037.
REFERENCES
- 1.Ban EM, Haour F, Lenstra R. Brain interleukin-1 gene expression induced by peripheral lipopolysaccharide administration. Cytokine. 1992;4:48–54. doi: 10.1016/1043-4666(92)90036-q. [DOI] [PubMed] [Google Scholar]
- 2.Berkenbosch F, Van Oers J, del Rey A, Tilders F, Besedovsky H. Corticotropin-releasing factor-producing neurons in the rat activated by interleukin-1. Science. 1987;238:524–526. doi: 10.1126/science.2443979. [DOI] [PubMed] [Google Scholar]
- 3.Bernardini R, Kamilaris TC, Calogero AE, Johnson EO, Gomez MT, Gold PW, Chrousos GP. Interactions between tumor necrosis factor-α, hypothalamic corticotropin-releasing hormone, and adrenocorticotropin secretion in the rat. Endocrinology. 1990;126:2876–2881. doi: 10.1210/endo-126-6-2876. [DOI] [PubMed] [Google Scholar]
- 4.Besedovsky HO, del Rey A. Immune-neuroendocrine interactions: facts and hypotheses. Endocr Rev. 1996;17:64–102. doi: 10.1210/edrv-17-1-64. [DOI] [PubMed] [Google Scholar]
- 5.Besedovsky HO, del Rey A, Klusman I, Furukawa H, Arditi GM, Kabiersch A. Cytokines as modulators of the hypothalamus-pituitary-adrenal axis. J Steroid Biochem Mol Biol. 1991;40:613–618. doi: 10.1016/0960-0760(91)90284-c. [DOI] [PubMed] [Google Scholar]
- 6.Blalock JE. A molecular basis for bidirectional communication between the immune and neuroendocrine systems. Physiol Rev. 1989;69:1–32. doi: 10.1152/physrev.1989.69.1.1. [DOI] [PubMed] [Google Scholar]
- 7.Bouaboula M, Legoux P, Pessegue B, Delpech B, Dumont X, Piechaczyk M, Casellas P, Shire D. Standardization of mRNA titration using polymerase chain reaction method involving co-amplification with a multi-specific internal control. J Biol Chem. 1992;267:21830–21838. [PubMed] [Google Scholar]
- 8.Breder CD, Tsujimoto M, Terano Y, Scott DW, Saper CB. Distribution and characterization of tumor necrosis factor-α-like immunoreactivity in the murine central nervous system. J Comp Neurol. 1993;337:543–567. doi: 10.1002/cne.903370403. [DOI] [PubMed] [Google Scholar]
- 9.Breder CD, Hazuka C, Ghayur T, Klug C, Huginin M, Yasuda K, Teng M, Saper CB. Regional distribution of tumor necrosis factor α expression in the mouse brain after systemic lipopolysaccharide administration. Proc Natl Acad Sci USA. 1994;91:11393–11397. doi: 10.1073/pnas.91.24.11393. [DOI] [PMC free article] [PubMed] [Google Scholar]
- 10.Buttini M, Boddeke H. Peripheral lipopolysaccharide stimulation induces interleukin-1β messenger RNA in rat brain microglial cells. Neuroscience. 1995;65:523–530. doi: 10.1016/0306-4522(94)00525-a. [DOI] [PubMed] [Google Scholar]
- 11.Chensue SW, Remick DG, Smyr-Forsch C, Beals TF, Kunkel SL. Immunohistochemical demonstration of cytoplasmic and membrane-associated tumor necrosis factor in murine macrophages. Am J Pathol. 1988;133:564–572. [PMC free article] [PubMed] [Google Scholar]
- 12.Colletti LM, Remick DG, Burtch GD, Kunkel SL, Strieter RM, Campbell DA. Role of tumor necrosis factor-α in the pathophysiologic alterations after hepatic ischemia/reperfusion injury in the rat. J Clin Invest. 1990;85:1936–1943. doi: 10.1172/JCI114656. [DOI] [PMC free article] [PubMed] [Google Scholar]
- 13.Cooper AL, Rothwell NJ. Mechanisms of early and late hypermetabolism and fever after localized tissue injury in rats. Am J Physiol. 1991;261:E698–E708. doi: 10.1152/ajpendo.1991.261.6.E698. [DOI] [PubMed] [Google Scholar]
- 14.Cooper AL, Brouwer S, Turnbull AV, Luheshi GN, Hopkins SJ, Kunkel SL, Rothwell NJ. Tumor necrosis factor-alpha and fever after peripheral inflammation in the rat. Am J Physiol. 1994a;267:R1431–R1436. doi: 10.1152/ajpregu.1994.267.6.R1431. [DOI] [PubMed] [Google Scholar]
- 15.Cooper AL, Turnbull AV, Hopkins SJ, Rothwell NJ. Dietary n-3 fatty acids inhibit fever induced by inflammation in the rat. Mediat Inflamm. 1994b;3:353–357. doi: 10.1155/S0962935194000499. [DOI] [PMC free article] [PubMed] [Google Scholar]
- 16.Creasey AA, Stevens P, Kenney J, Alison AC, Warren K, Catlett R, Hinshaw L, Taylor F. Endotoxin and cytokine profile in plasma of baboons challenged with lethal and sublethal Escherichia coli. Circ Shock. 1991;33:84–91. [PubMed] [Google Scholar]
- 17.DeForge LE, Remick DG. Kinetics of TNF, IL-6 and IL-8 gene expression in LPS-stimulated human whole blood. Biochem Biophys Res Commun. 1991;174:18–24. doi: 10.1016/0006-291x(91)90478-p. [DOI] [PubMed] [Google Scholar]
- 18.Dinarello CA, Wolff SM. The role of interleukin-1 in disease. N Engl J Med. 1993;328:106–113. doi: 10.1056/NEJM199301143280207. [DOI] [PubMed] [Google Scholar]
- 19.Doyle E, Nolan PM, Bell R, Regan CM. Intraventricular infusions of anti-neural cell adhesion molecules in a discrete posttraining period impair consolidation of a passive avoidance response in the rat. J Neurochem. 1992;59:1570–1573. doi: 10.1111/j.1471-4159.1992.tb08477.x. [DOI] [PubMed] [Google Scholar]
- 20.Ebisui O, Fukata J, Murakami N, Kobayashi H, Segawa H, Muro S, Hanaoka I, Naito Y, Masui Y, Ohmoto Y, Imura H, Nakao K. Effect of IL-1 receptor antagonist and antiserum to TNF-α on LPS-induced plasma ACTH and corticosterone in rats. Am J Physiol. 1994;266:E986–E992. doi: 10.1152/ajpendo.1994.266.6.E986. [DOI] [PubMed] [Google Scholar]
- 21.Fan L, Knoblach SM, Yakovlev AG, Faden AI. Involvement of tumor necrosis factor-alpha in the pathophysiology of experimental brain injury. Soc Neurosci Abstr. 1996;2:465.14. [Google Scholar]
- 22.Fernandez-Alonso A, Benamar K, Sanchibrian M, Lopez-Valupuesta FJ, Minano FJ. Role of interleukin-1β, interleukin-6 and macrophage inflammatory protein-1β in prostaglandin E2-induced hyperthermia in rats. Life Sci. 1996;59:PL185–190. doi: 10.1016/0024-3205(96)00410-9. [DOI] [PubMed] [Google Scholar]
- 23.Ferrandiz ML, Foster SJ. Tumor necrosis factor production in a rat airpouch model of inflammation: role of eicosanoids. Agents Actions. 1991;32:289–294. doi: 10.1007/BF01980888. [DOI] [PubMed] [Google Scholar]
- 24.Fong Y, Tracey KJ, Moldawer LL, Hesse DG, Manogue KB, Kenney JS, Lee AT, Kuo GC, Allison AC, Lowry SF, Cerami A. Antibodies to cachectin/tumor necrosis factor reduce interleukin-1 beta and interleukin-6 appearance during lethal bacteremia. J Exp Med. 1989;170:1627–1633. doi: 10.1084/jem.170.5.1627. [DOI] [PMC free article] [PubMed] [Google Scholar]
- 25.Fontana A, Weber E, Dayer J-M. Synthesis of interleukin-1/endogenous pyrogen in the brain of endotoxin-treated mice: a step in fever induction? J Immunol. 1984;133:1696–1698. [PubMed] [Google Scholar]
- 26.Ford HR, Hoffman RA, Wing EJ, Magee DM, McIntyre L, Simmons RL. Characterization of wound cytokines in the sponge matrix model. Arch Surg. 1989;124:1422–1428. doi: 10.1001/archsurg.1989.01410120068014. [DOI] [PubMed] [Google Scholar]
- 27.Franks AK, Kujawa KI, Yaffe LJ. Experimental elimination of tumor necrosis factor in low dose endotoxin models has variable effects on survival. Infect Immun. 1991;59:2609–2614. doi: 10.1128/iai.59.8.2609-2614.1991. [DOI] [PMC free article] [PubMed] [Google Scholar]
- 28.Gabellec M-M, Griffais R, Fillion G, Haour F. Expression of interleukin 1α, interleukin 1β and interleukin 1 receptor antagonist mRNA in mouse brain: regulation by bacterial lipopolysaccharide (LPS) treatment. Mol Brain Res. 1995;31:122–130. doi: 10.1016/0169-328x(95)00042-q. [DOI] [PubMed] [Google Scholar]
- 29.Galasso JM, Wang P, Martin D, Silverstein FS. Inhibition of tumor necrosis factor-α (TNF-α) attenuates NMDA-induced striatal neurotoxicity in perinatal rats. Soc Neurosci Abstr. 1996;1:318.5. [Google Scholar]
- 30.Gatti S, Bartfai T. Induction of tumor necrosis factor-alpha mRNA in the brain after peripheral endotoxin treatment: comparison with interleukin-1 family and interleukin-6. Brain Res. 1993;624:291–294. doi: 10.1016/0006-8993(93)90090-a. [DOI] [PubMed] [Google Scholar]
- 31.Givalois L, Dornand J, Mekaouche M, Solier MD, Bristow AF, Ixart G, Siaud I, Assenmacher I, Barbanel G. Temporal cascade of plasma level surges in ACTH, corticosterone, and cytokines in endotoxin-challenged rats. Am J Physiol. 1994;267:R164–R170. doi: 10.1152/ajpregu.1994.267.1.R164. [DOI] [PubMed] [Google Scholar]
- 32.Gutierrez EG, Banks WA, Kastin AJ. Murine tumor necrosis factor alpha is transported from blood to brain in the mouse. J Neuroimmunol. 1993;47:169–176. doi: 10.1016/0165-5728(93)90027-v. [DOI] [PubMed] [Google Scholar]
- 33.Hagan P, Poole S, Bristow AF. Endotoxin-stimulated production of rat hypothalamic interleukin-1β in vivo and in vitro, measured by specific immunoradiometric assay. J Mol Endocrinol. 1993;11:31–36. doi: 10.1677/jme.0.0110031. [DOI] [PubMed] [Google Scholar]
- 34.Heller RA, Song K, Fan N, Chang DJ. The p70 tumor necrosis factor receptor mediates cytotoxicity. Cell. 1992;70:47–56. doi: 10.1016/0092-8674(92)90532-h. [DOI] [PubMed] [Google Scholar]
- 35.Hopkins SJ, Rothwell NJ. Cytokines and the nervous system. I. Expression and regulation. Trends Neurosci. 1995;18:83–88. [PubMed] [Google Scholar]
- 36.Kakucska I, Qi Y, Clark BD, Lechan RM. Endotoxin-induced corticotropin-releasing hormone gene expression in the hypothalamic paraventricular nucleus is mediated centrally by interleukin-1. Endocrinology. 1993;133:815–821. doi: 10.1210/endo.133.2.8344218. [DOI] [PubMed] [Google Scholar]
- 37.Karalis K, Sano H, Redwine J, Listwak S, Wilder RL, Chrousos GP. Autocrine or paracrine inflammatory actions of corticotropin-releasing hormone in vivo. Science. 1991;254:421–423. doi: 10.1126/science.1925600. [DOI] [PubMed] [Google Scholar]
- 38.Klir JJ, Roth J, Szelenyi Z, McClellan JL, Kluger MJ. Role of hypothalamic interleukin-6 and tumor necrosis factor-α in LPS fever in rat. Am J Physiol. 1993;265:R512–R517. doi: 10.1152/ajpregu.1993.265.3.R512. [DOI] [PubMed] [Google Scholar]
- 39.Kopf M, Baumann H, Freer G, Freudenberg M, Lamers M, Kishimoto T, Zingernagel R, Bluethmann H, Kohler G. Impaired immune and acute-phase responses in interleukin-6 deficient mice. Nature. 1994;368:339–342. doi: 10.1038/368339a0. [DOI] [PubMed] [Google Scholar]
- 40.Laye S, Parnet P, Goujon E, Dantzer R. Peripheral administration of lipopolysaccharide induces the expression of cytokine transcripts in the brain and pituitaries of mice. Mol Brain Res. 1994;27:157–162. doi: 10.1016/0169-328x(94)90197-x. [DOI] [PubMed] [Google Scholar]
- 41.Laye S, Bluthe RM, Kent S, Combe C, Medina C, Parnet P, Kelley K, Dantzer R. Subdiaphragmatic vagotomy blocks induction of IL-1 beta mRNA in mice brain in response to peripheral LPS. Am J Physiol. 1995;37:R1327–R1331. doi: 10.1152/ajpregu.1995.268.5.R1327. [DOI] [PubMed] [Google Scholar]
- 42.Le Contel C, Vinit MA, Parant FJ, Parant MA. Differential priming for endotoxin-induced circulating cytokine production by tumor necrosis factor and interleukin-1β. Cytokine. 1990;2:375–380. doi: 10.1016/1043-4666(90)90068-5. [DOI] [PubMed] [Google Scholar]
- 43.Lewis M, Tartaglia LA, Lee A, Bennet GL, Rice GC, Wong GHW, Chen EY, Goeddel DV. Cloning and expression of cDNAs for two distinct murine tumor necrosis factor receptors demonstrate one receptor is species specific. Proc Natl Acad Sci USA. 1991;88:2830–2834. doi: 10.1073/pnas.88.7.2830. [DOI] [PMC free article] [PubMed] [Google Scholar]
- 44.Liu L, Kita T, Tanaka N, Kinoshita Y. The expression of tumor necrosis factor in the hypothalamus after treatment with lipopolysaccharide. Int J Exp Pathol. 1996;77:37–44. doi: 10.1046/j.1365-2613.1996.961099.x. [DOI] [PMC free article] [PubMed] [Google Scholar]
- 45.Long NC, Kunkel SL, Vander AJ, Kluger MJ. Antiserum against TNF enhances LPS fever in the rat. Am J Physiol. 1990;258:R332–R337. doi: 10.1152/ajpregu.1990.258.2.R332. [DOI] [PubMed] [Google Scholar]
- 46.Mackay F, Rothe J, Bluethmann H, Loetscher H, Lesslauer W. Differential responses of fibroblasts from wild-type and TNF-R55-deficient mice to mouse and human TNF-α activation. J Immunol. 1994;153:5274–5284. [PubMed] [Google Scholar]
- 47.Meltzer JC, Sanders V, Grim PC, Stern E, Rivier C, Lee S, Rennie SL, Gietz RD, Hole A, Watson PH, Greenberg AH, Nance DM (1997) Detection of cytokine mRNA in rat spleen and brain by in situ hybridization with digoxigenin-labelled riboprobes. J Histochem Cytochem, in press. [DOI] [PubMed]
- 48.Mohler KM, Torrance DS, Smith CA, Goodwin RG, Stremler KE, Fung VP, Madani H, Widmer MB. Soluble tumor necrosis factor (TNF) receptors are effective therapeutic agents in lethal endotoxemia and function simultaneously as both TNF carriers and TNF antagonists. J Immunol. 1993;151:1548–1561. [PubMed] [Google Scholar]
- 49.Muramami N, Fukata J, Tsukada T, Kobayashi H, Ebisui O, Segawa H, Muro S, Imura H, Nakao K. Bacterial lipopolysaccharide-induced expression of interleukin-6 messenger ribonucleic acid in the rat hypothalamus, pituitary, adrenal gland, and spleen. Endocrinology. 1993;133:2574–2578. doi: 10.1210/endo.133.6.8243280. [DOI] [PubMed] [Google Scholar]
- 50.Naitoh Y, Fukata J, Tominaga T, Nakai Y, Tamai S, Mori K, Imura H. Interleukin-6 stimulates the secretion of adrenocorticotropic hormone in conscious, freely moving rats. Biochem Biophys Res Commun. 1988;155:1459–1463. doi: 10.1016/s0006-291x(88)81305-6. [DOI] [PubMed] [Google Scholar]
- 51.Navarra P, Tsagarakis S, Faria M, Rees LH, Besser GM, Grossman AB. Interleukins-1 and -6 stimulate the release of corticotropin-releasing hormone-41 from rat hypothalamus in vitro via the eicosanoid cyclooxygenase pathway. Endocrinology. 1991;128:37–44. doi: 10.1210/endo-128-1-37. [DOI] [PubMed] [Google Scholar]
- 52.Norris JG, Tang L, Sparacio SM, Benveniste E. Signal transduction pathways mediating astrocyte IL-6 induction by IL-1 beta and tumor necrosis factor. J Immunol. 1994;152:841–850. [PubMed] [Google Scholar]
- 53.Oldenburg HSA, Rogy MA, Lazarus DD, Van Zee KJ, Keeler BP, Chizzonite RA, Lowry SF, Moldawer LL. Cachexia and the acute-phase protein response in inflammation are regulated by interleukin-6. Eur J Immunol. 1993;23:1889–1894. doi: 10.1002/eji.1830230824. [DOI] [PubMed] [Google Scholar]
- 54.Peppel P, Crawford D, Beutler B. A tumor necrosis factor (TNF) receptor-IgG heavy chain chimeric protein as a bivalent antagonist of TNF activity. J Exp Med. 1991;174:1483–1489. doi: 10.1084/jem.174.6.1483. [DOI] [PMC free article] [PubMed] [Google Scholar]
- 55.Perlstein RS, Whitnall MH, Abrams JS, Moughey EH, Neta R. Synergistic roles of interleukin-6, interleukin-1, and tumor necrosis factor in the adrenocorticotropin response to bacterial lipopolysaccharide in vivo. Endocrinology. 1993;132:946–952. doi: 10.1210/endo.132.3.8382602. [DOI] [PubMed] [Google Scholar]
- 56.Pitossi FJ, Besedovsky HO. A multispecific internal control (pRat6) for the analysis of rat cytokine mRNA levels by quantitative RT-PCR. Eur Cytokine Netw. 1996;7:377–379. [PubMed] [Google Scholar]
- 57.Pitossi F, del Rey A, Kabiersch A, Besedovsky H (1997) Induction of cytokine transcripts in the CNS and pituitary following peripheral administration of endotoxin to mice. J Neurosci Res, in press. [DOI] [PubMed]
- 58.Quan N, Sundar SK, Weiss JM. Induction of interleukin-1 in various brain regions after peripheral and central injections of lipopolysaccharide. J Neuroimmunol. 1994;49:125–134. doi: 10.1016/0165-5728(94)90188-0. [DOI] [PubMed] [Google Scholar]
- 59.Quan N, Zhang Z, Emery M, Lai E, Bonsall R, Kalyanaraman VS, Weiss JM. In vivo induction of interleukin-1 bioactivity in brain tissue after intracerebral infusion of native gp120 and gp160. Neuroimmunomodulation. 1996;3:56–61. doi: 10.1159/000097227. [DOI] [PubMed] [Google Scholar]
- 60.Remick DG. Significance of in vivo detection of tumor necrosis factor. Lab Invest. 1991;65:259–261. [PubMed] [Google Scholar]
- 61.Remick DG, Strieter R, Eskandari MK, Nguyen DT, Genord MA, Raiford CL, Kunkel SL. Role of tumor necrosis factor-α in lipopolysaccharide-induced pathologic alterations. Am J Pathol. 1990;136:49–60. [PMC free article] [PubMed] [Google Scholar]
- 62.Rivier C, Shen GH. In the rat, endogenous nitric oxide modulates the response of the hypothalamo-pituitary-adrenal axis to interleukin-1β, vasopressin, and oxytocin. J Neurosci. 1994;14:1985–1993. doi: 10.1523/JNEUROSCI.14-04-01985.1994. [DOI] [PMC free article] [PubMed] [Google Scholar]
- 63.Rivier C, Chizzonite R, Vale W. In the mouse, the activation of the hypothalamic-pituitary-adrenal axis by a lipopolysaccharide (endotoxin) is mediated through interleukin-1. Endocrinology. 1989;125:2800–2805. doi: 10.1210/endo-125-6-2800. [DOI] [PubMed] [Google Scholar]
- 64.Romero LI, Schettini G, Lechan RM, Dinarello CA, Reichlin S. Bacterial lipopolysaccharide induction of IL-6 in rat telencephalic cells is mediated in part by IL-1. Neuroendocrinology. 1993;57:892–897. doi: 10.1159/000126450. [DOI] [PubMed] [Google Scholar]
- 65.Roth J, Conn CA, Kluger MJ, Zeisberger E. Kinetics of systemic and intrahypothalamic IL-6 and tumor necrosis factor during endotoxin fever in guinea pigs. Am J Physiol. 1993;265:R653–R658. doi: 10.1152/ajpregu.1993.265.3.R653. [DOI] [PubMed] [Google Scholar]
- 66.Rothwell NJ, Hopkins SJ. Cytokines and the central nervous system II: actions and mechanism of action. Trends Neurosci. 1995;18:130–136. doi: 10.1016/0166-2236(95)93890-a. [DOI] [PubMed] [Google Scholar]
- 67.Rothwell NJ, Luheshi G, Toulmond S. Cytokines and their receptors in the central nervous system: physiology, pharmacology, and pathology. Pharmacol Ther. 1996;69:85–95. doi: 10.1016/0163-7258(95)02033-0. [DOI] [PubMed] [Google Scholar]
- 68.Sapolsky R, Rivier C, Yamamoto G, Plotsky P, Vale W. Interleukin-1 stimulates the secretion of hypothalamic corticotropin-releasing factor. Science. 1987;238:522–524. doi: 10.1126/science.2821621. [DOI] [PubMed] [Google Scholar]
- 69.Schobitz B, de Kloet ER, Holsboer F. Gene expression and function of interleukin 1, interleukin 6 and tumor necrosis factor in the brain. Prog Neurobiol. 1994;44:397–432. doi: 10.1016/0301-0082(94)90034-5. [DOI] [PubMed] [Google Scholar]
- 70.Schotanus K, Tilders FJ, Berkenbosch F. Human recombinant interleukin-1 receptor antagonist prevents adrenocorticotropin, but not interleukin-6 responses to bacterial endotoxin. Endocrinology. 1993;133:2461–2468. doi: 10.1210/endo.133.6.8243265. [DOI] [PubMed] [Google Scholar]
- 71.Sekut L, Menius JA, Brackeen MF, Connolly KM. Evaluation of the significance of elevated levels of systemic and localized tumor necrosis factor in different animal models of inflammation. J Lab Clin Med. 1994;124:813–820. [PubMed] [Google Scholar]
- 72.Sharp BM, Matta SG. Prostaglandins mediate the adrenocorticotropin response to tumor necrosis factor in rats. Endocrinology. 1993;132:269–274. doi: 10.1210/endo.132.1.8380377. [DOI] [PubMed] [Google Scholar]
- 73.Sharp BM, Matta SG, Peterson PK, Newton R, Chao C, McAllen K. Tumor necrosis factor-α is a potent ACTH secretagogue: comparison with interleukin-1β. Endocrinology. 1989;124:3131–3133. doi: 10.1210/endo-124-6-3131. [DOI] [PubMed] [Google Scholar]
- 74.Smith-Oliver T, Noel LS, Stimpson SA, Yarnall DP, Connolly KM. Elevated levels of TNF in the joints of adjuvant arthritic rats. Cytokine. 1993;5:298–305. doi: 10.1016/1043-4666(93)90060-i. [DOI] [PubMed] [Google Scholar]
- 75.Stefferl A, Hopkins SJ, Rothwell NJ, Luheshi GN. The role of TNF-α in fever: opposing actions of human and murine TNF-α and interactions with IL-1β in the rat. Br J Pharmacol. 1996;118:1919–1924. doi: 10.1111/j.1476-5381.1996.tb15625.x. [DOI] [PMC free article] [PubMed] [Google Scholar]
- 76.Taupin V, Toulmond S, Serrano A, Benavides J, Zavala F. Increase in IL-6, IL-1 and TNF levels in rat brain following traumatic lesion. Influence of pre- and post-traumatic treatment with Ro5 4864: a peripheral-type (p site) benzodiazepine ligand. J Neuroimmunol. 1993;42:177–186. doi: 10.1016/0165-5728(93)90008-m. [DOI] [PubMed] [Google Scholar]
- 77.Thomas LB, Book AA, Schweitzer JB. Immunohistochemical detection of a monoclonal antibody directed against the NGF receptor in basal forebrain neurons following intraventricular injection. J Neurosci Res. 1991;37:37–45. doi: 10.1016/0165-0270(91)90019-v. [DOI] [PubMed] [Google Scholar]
- 78.Tilders FJH, De Rijk RH, Van Dam A-M, Vincent VA, Schotanus K, Persoons JHA. Activation of the hypothalamus-pituitary-adrenal axis by bacterial endotoxins: routes and intermediate signals. Psychoneuroendocrinology. 1994;19:209–232. doi: 10.1016/0306-4530(94)90010-8. [DOI] [PubMed] [Google Scholar]
- 79.Tracey KJ, Cerami A. Tumor necrosis factor and regulation of metabolism in infection: role of systemic versus tissue levels. Proc Soc Exp Biol Med. 1992;200:233–239. doi: 10.3181/00379727-200-43426. [DOI] [PubMed] [Google Scholar]
- 80.Tsagarakis S, Gillies G, Rees LH, Besser M, Grossman A. Interleukin-1 directly stimulates the release of corticotrophin releasing factor from rat hypothalamus. Neuroendocrinology. 1989;49:98–101. doi: 10.1159/000125096. [DOI] [PubMed] [Google Scholar]
- 81.Turnbull AV, Rivier C. Regulation of the HPA axis by cytokines. Brain Behav Immun. 1995;9:253–275. doi: 10.1006/brbi.1995.1026. [DOI] [PubMed] [Google Scholar]
- 82.Turnbull AV, Rivier C. Corticotropin-releasing factor, vasopressin and prostaglandins mediate, and nitric oxide restrains, the HPA axis response to acute local inflammation in the rat. Endocrinology. 1996a;137:455–463. doi: 10.1210/endo.137.2.8593789. [DOI] [PubMed] [Google Scholar]
- 83.Turnbull AV, Rivier C. Cytokines within the neuroendocrine system. Curr Opinion Endocrinol Diabetes. 1996b;3:149–156. [Google Scholar]
- 84.Turnbull AV, Rivier C. Selective inhibitors of nitric oxide synthase (NOS) implicate a constitutive isoform of NOS in the regulation of interleukin-1-induced ACTH secretion in rats. Endocrine. 1996c;5:135–145. doi: 10.1007/BF02738698. [DOI] [PubMed] [Google Scholar]
- 85.Turnbull AV, Dow RC, Hopkins SJ, White A, Fink G, Rothwell NJ. Mechanism of the activation of the pituitary-adrenal axis by tissue injury in the rat. Psychoneuroendocrinology. 1994;19:165–178. doi: 10.1016/0306-4530(94)90006-x. [DOI] [PubMed] [Google Scholar]
- 86.Uehara A, Gottschall PE, Dahl RR, Arimura A. Interleukin-1 stimulates ACTH release by an indirect action which requires endogenous corticotropin-releasing factor. Endocrinology. 1987;121:1580–1582. doi: 10.1210/endo-121-4-1580. [DOI] [PubMed] [Google Scholar]
- 87.van Dam A-M, Brouns M, Louisse S, Berkenbosch F. Appearance of interleukin-1 in macrophages and in ramified microglia in the brain of endotoxin-treated rats: a pathway for the induction of non-specific symptoms of sickness? Brain Res. 1992;588:291–296. doi: 10.1016/0006-8993(92)91588-6. [DOI] [PubMed] [Google Scholar]
- 88.van Dam A-M, Bauer J, Tilders FJH, Berkenbosch F. Endotoxin-induced appearance of immunoreactive interleukin-1β in ramified microglia in rat brain: a light and electron microscopic study. Neuroscience. 1995;65:815–826. doi: 10.1016/0306-4522(94)00549-k. [DOI] [PubMed] [Google Scholar]
- 89.van de Meer MJM, Sweep CGJ, Rijnkels CEM, Pesman GJ, Tilders FJH, Kloppenborg PWC, Hermus ARMM. Acute stimulation of the hypothalamic-pituitary-adrenal axis by IL-1β, TNFα and IL-6: a dose response study. J Endocrinol Invest. 1996;19:175–182. doi: 10.1007/BF03349862. [DOI] [PubMed] [Google Scholar]
- 90.Van der Zee CEEM, Fawcett J, Diamond J. Antibody to NGF inhibits collateral sprouting of septohippocampal fibers following entorhinal cortex lesion in adult rats. J Comp Neurol. 1992;326:91–100. doi: 10.1002/cne.903260108. [DOI] [PubMed] [Google Scholar]
- 91.Van der Zee CEEM, Lourenssen S, Stanisz J, Diamond J. NGF deprivation of adult rat brain results in cholinergic hypofunction and selective impairments in spatial learning. Eur J Neurosci. 1995;7:160–168. doi: 10.1111/j.1460-9568.1995.tb01030.x. [DOI] [PubMed] [Google Scholar]
- 92.Watanobe H, Takebe K. Intravenous administration of tumor necrosis factor-α stimulates corticotropin-releasing hormone secretion in the push-pull cannulated median eminence of freely moving rats. Neuropeptides. 1992;22:81–84. doi: 10.1016/0143-4179(92)90058-5. [DOI] [PubMed] [Google Scholar]
- 93.Watanobe H, Sasaki S, Takebe K. Evidence that intravenous administration of interleukin-1 stimulates corticotropin releasing hormone secretion in the median eminence of freely moving rats: estimation by push pull perfusion. Neurosci Lett. 1991;133:7–10. doi: 10.1016/0304-3940(91)90044-t. [DOI] [PubMed] [Google Scholar]
- 94.Wooley PH, Dutcher J, Widmer MB, Gillis S. Influence of a recombinant human soluble tumor necrosis factor receptor FC fusion protein on Type II collagen-induced arthritis in mice. J Immunol. 1993;151:6602–6607. [PubMed] [Google Scholar]
- 95.Zanetti G, Heumann D, Gerain J, Kohler J, Abbet P, Barras C, Lucas R, Glauser M-P, Baumgartner J-D. Cytokine production after intravenous or peritoneal gram-negative bacterial challenge in mice. J Immunol. 1992;148:1890–1897. [PubMed] [Google Scholar]
- 96.Zheng H, Fletcher D, Kozak W, Jiang M, Hofman KJ, Conn CA, Soszynski D, Grabiec C, Trumbauer ME, Shaw A, Kostura MJ, Stevens K, Rosen H, North RJ, Chen HY, Tocci MJ, Kluger MJ, Van der Ploeg LHT. Resistance to fever induction and impaired acute-phase response in interleukin-1β-deficient mice. Immunity. 1995;3:9–19. doi: 10.1016/1074-7613(95)90154-x. [DOI] [PubMed] [Google Scholar]