

Abstract
We describe a new technique permitting the mapping of neural connections in the living human brain. The method combines two well established tools of brain research: transcranial magnetic stimulation (TMS) and positron emission tomography (PET). We use TMS to stimulate directly a selected cortical area while simultaneously measuring changes in brain activity, indexed by cerebral blood flow (CBF), with PET. The exact location of the stimulation site is achieved by means of frameless stereotaxy. In the first study using this technique, we found significant positive correlations between CBF and the number of TMS pulse trains at the stimulation site, namely the left frontal eye field (FEF) and, most importantly, in the visual cortex of the superior parietal and medial parieto-occipital regions. The pattern of these distal effects was consistent with the known anatomic connectivity of the monkey FEF. We suggest that the combined TMS/PET technique offers an objective tool for assessing the state of functional connectivity without requiring the subject to engage in any specific behavior.
Keywords: TMS, PET, FEF, CBF, saccades, connectivity, visual cortex
We know a great deal about neural connectivity in the brains of nonhuman primates but little about connectivity in humans because of the limited repertoire of suitable anatomic techniques (Mesulam, 1979). Functional techniques based on the correlational analysis of electroencephalographic (Gevins et al., 1979, 1981, 1989;Thatcher et al., 1986; Tucker et al., 1986) or cerebral blood flow (CBF; Alexander and Moeler, 1984; Friston, 1994; McIntosh and Gonzalez-Lima, 1994; Strother et al., 1995; Friston et al., 1996; Paus et al., 1996) data are indirect and may not show actual neural connectivity. The correlational studies suffer a major limitation in that the engagement of a subject in performing a task confounds the data being acquired: the observed “coactivations” may reflect relationships between different components of behavior rather than connectivity. Here we describe a novel technique that allows an assessment of neural connectivity to be made directly, without requiring the subject to engage in any specific behavior. The technique is based on the concurrent use of transcranial magnetic stimulation, TMS (Barker et al., 1985; Hallett and Cohen, 1989; Maccabee et al., 1991; Cracco et al., 1993) and positron emission tomography, PET. The key principle is that of measuring the effect of a focal TMS-induced electrical stimulation of one region on activity, indexed by changes in CBF, elsewhere in the brain. It is interesting to note that a technique based on tracing the spread of experimentally induced seizures, namely the strychnine neuronography, was used to study neural pathways in nonhuman primates before the advent of modern anatomic track-tracing techniques (Dusser de Barenne and McCulloch, 1936; Bailey et al., 1943, 1944; Petr et al., 1949; Pribram and MacLean, 1953).
In previous studies with single-photon emission tomography or functional magnetic resonance imaging (fMRI), a suprathreshold transcranial magnetic (Shaffran et al., 1989; Dressler et al., 1990) or electric (Brandt et al., 1996) stimulation was shown to increase brain perfusion in the cortex under the coil or electrode, respectively.Shaffran et al. (1989) also observed increased perfusion in the cerebellum during TMS of the primary motor cortex. Furthermore, several authors have combined TMS and electroencephalography (EEG) to explore transcallosal (Cracco et al., 1989) and cerebello-frontal (Amassian et al., 1992) connections. The TMS/PET approach described here has an advantage over that based on EEG in that it allows us (1) to localize with great precision the TMS-related change in CBF, and (2) to detect such changes equally well in cortical and subcortical structures. It also allows for an immediate integration of the connectivity data into the ever-growing database of blood flow activation studies.
In this study we stimulated a cortical region involved in the control of eye movements, namely the frontal eye field (FEF). This choice was motivated by several factors, including (1) the location of the FEF on the lateral convexity of the cerebral hemispheres and, therefore, accessibility to the coil-generated magnetic field; (2) the knowledge of an averaged, i.e., probabilistic, location of the FEF in the human brain (Paus, 1996); and (3) the knowledge of the anatomic connectivity of the FEF in the monkey (Huerta et al., 1987; Leichnetz and Goldberg, 1988; Schall et al., 1995). The results obtained in six healthy volunteers confirmed the feasibility of our approach in that changes in CBF were observed in several parts of the visual cortex, far remote from the stimulation site, during TMS of the FEF.
MATERIALS AND METHODS
Experimental design. In six healthy volunteers, a figure-eight TMS coil was positioned over the left FEF, and CBF was measured in six 60 sec 15O–H2O scans acquired with the CTI/Siemens HR+ tomograph. During the scans the subjects kept their eyes closed, and white noise [80 dB sound pressure level (SPL)] was played through insert earphones to mask the coil-generated clicks. Eye movements were recorded with electro-oculography. It should be pointed out, however, that we did not expect to evoke any eye movements in this experiment, because several previous investigators failed to trigger eye movements by TMS of the frontal cortex even when high-stimulation intensities were used (cf.Muri et al., 1991; Wessel et al., 1991). To allow for a correlational analysis of CBF data, we delivered a different number of TMS pulse trains in the six scans, namely 5, 10, 15, 20, 25, and 30 pulse trains per scan. The order of scans was randomized.
Subjects. Four female and two male subjects volunteered in the study after giving written informed consent [age, 28 ± 6.5 (mean ± SD) years]. All subjects but one were right-handed. Following the safety guidelines for the use of a rapid rate TMS in normal volunteers (Pascual-Leone et al., 1993), we screened the subjects for a history of neurological disorders, in particular a personal and family history of epilepsy. The study was approved by the Research and Ethics Committee of the Montreal Neurological Institute and Hospital.
Transcranial magnetic stimulation (TMS). The Cadwell high-speed magnetic stimulator and the Cadwell figure-eight coil (Corticoil, see inset of Fig. 1) were used to produce a focal stimulation of the cerebral cortex through the skull by rapid switching of a strong (∼1.5 T) magnetic field in the coil (Cohen et al., 1990; Maccabee et al., 1990). The duration of a single TMS pulse was 200 μsec; the pulses were delivered in five-pulse trains of 400 msec duration each (between-pulse interval, 100 msec; i.e., the stimulation frequency of 10 Hz). A different number of pulse trains was delivered in six 60 sec scans, namely 5, 10, 15, 20, 25, and 30 pulse trains. The shortest between-train interval was 1500 msec. The intensity of stimulation was set at 70% of the maximum output of the stimulator. For the figure-eight coil used in this study, the estimated volume of stimulated tissue was 20 × 20 × 10 mm, with the point of maximum stimulation being under the central junction of the two round coils (Cohen et al., 1990; Maccabee et al., 1990; Wassermann et al., 1996).
Fig. 1.
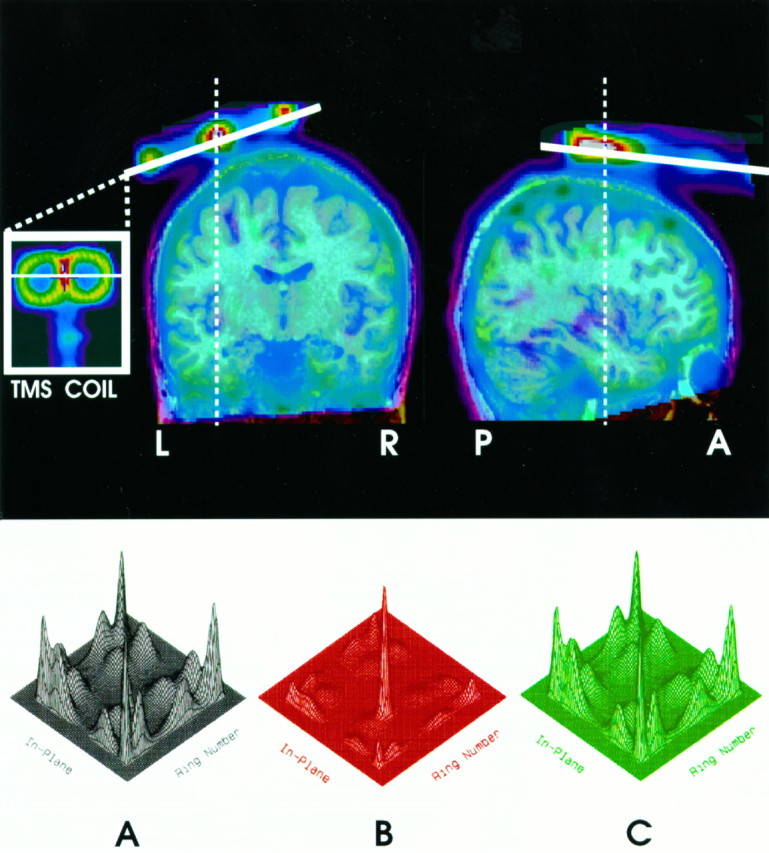
The top of the figure shows a coronal (left) and a sagittal (right) section through a transmission scan obtained in one subject, superimposed on an MR image of the same subject. The TMS coil can be seen in the inset. Note the figure-eight shape of the coil. The bottom of the figure contains three-dimensional plots of the crystal identification matrix obtained in the absence of magnetic field (A), during magnetic stimulation (B), and during the same magnetic stimulation but with metal shields placed between the coil and the photo multipliers (C). Note a serious distortion of the matrix during unshielded exposure to the pulse magnetic field (B).
Location of the target region and positioning of the TMS coil.To target the same area in all of our subjects, we developed a new procedure that takes advantage of the standardized stereotaxic space ofTalairach and Tournoux (1988) and frameless stereotaxy (Peters et al., 1996). First, a magnetic resonance (MR) image of the subject’s brain is acquired and transformed into the standardized stereotaxic space with an automatic feature-detection algorithm (Collins et al., 1994); the MR images (160 contiguous 1-mm-thick sagittal slices) were obtained from a Philips Gyroscan ACS-II (1.5 T). Second, an average, probabilistic location of the FEF in the stereotaxic space is derived through a meta-analysis of previous oculomotor blood flow activation studies (see below). Third, this location, defined by X,Y, and Z coordinates, is transformed to the subject’s brain coordinate (“native”) space with an inverse version of the native-to-stereotaxic transformation matrix. This procedure allows us to determine where the target region is located in a given subject and, therefore, where to aim the coil during the experiment. The final step requires us to position the coil over this location, now marked on the MR image. This is achieved with the aid of frameless stereotaxy: with the subject lying on the couch in the scanner, the subject’s head is registered with the MR image and the coil is placed over the target location. Accurate positional and angular placement of the coil is achieved by interfacing it to the computer-linked probe of the frameless stereotaxy unit (Viewing Wand, ISG Technologies, Mississauga, Ontario, Canada). In this manner the investigator can view the coil movement relative to the subject’s MR image (Fig. 2). When this location is reached, the coil is locked in place and the PET session begins.
Fig. 2.
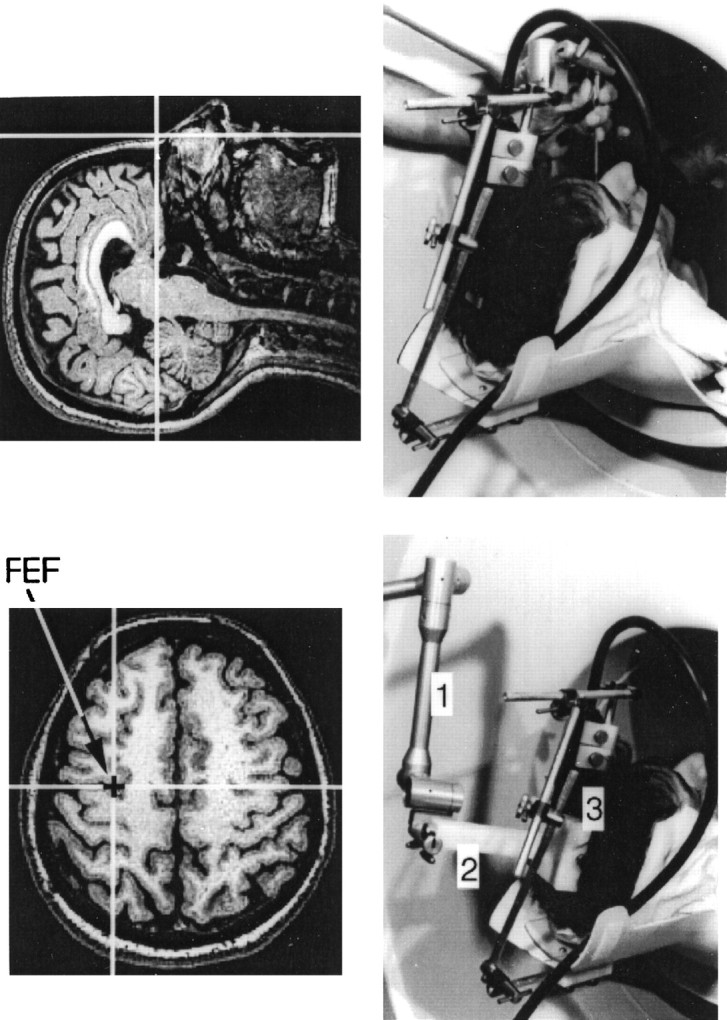
The top of the figure shows the process of registering the subject’s head with the corresponding MR image. A computer-linked probe is touching the bridge of the nose (right); the matching location is highlighted by a cross hair on the MR image (left). The bottomof the figure shows a location targeted by TMS in this study, i.e., the left frontal eye field, FEF (left), and the probe–coil interface used to position the coil over this location (right). 1, Arm of the frameless-stereotaxy unit; 2, probe inside the interface; 3, coil inside the interface.
The average location of the left FEF in the standardized stereotaxic space (i.e., X = −32, Y = −2,Z = 46) was derived from nine previous blood flow activation studies of oculomotor control, with a total of 62 subjects contributing to the database (Paus, 1996). The figure-eight coil was positioned over this location so that its anterior–posterior axis was parallel to the interhemispheric fissure, the handle of the coil was pointing in the anterior direction (i.e., toward the nose), and the plane of the coil was tangential to the skull (see Fig. 1,top).
PET: effect of magnetic field on photo multipliers.Although the coil-generated field lasts only for 200 μsec and falls off quickly with distance, it still could affect photo multipliers and the related electronic circuits housed in the gantry of the scanner. We have, therefore, tested possible effects of magnetic field on data acquisition in a single detector assembly. For this purpose we used a single-detector assembly from a Scanditronix PC-2048 PET scanner (Evans et al., 1991). The figure eight coil was positioned 19 cm from the photo multipliers. Data were acquired for a period of 10 sec, during which time the Cadwell stimulator was either off or on. Stimulation parameters were set at a 10 sec continuous train of pulses, delivered at 10-Hz frequency and with the intensity of 40% of the maximum output of the stimulator. We also tested the effect of positioning metal sheets with high magnetic-shielding properties (made by Magnetic Shield Corporation) between the single-detector assembly and the coil.
PET: acquisition and analysis of CBF data. In the actual study, PET scans were obtained with a CTI/Siemens HR+63-slice tomograph operated in a three-dimensional acquisition mode. The distribution of CBF was measured during a 60 sec scan by means of the 15O-labeled H2O bolus method (Raichle et al., 1983). In each scan 10 mCi of 15O-labeled H2O was injected in the left antecubital vein. No arterial blood samples were acquired in this study. Because a linear relationship exists between the activity counts and CBF (Herscovitch et al., 1983), the count values can be used in the absence of the arterial blood samples as close approximations of CBF values. The CBF images were reconstructed with a 14 mm Hanning filter, normalized for differences in global CBF (henceforth “normalized CBF”), coregistered with the individual MRIs (Woods et al., 1993), and transformed into stereotaxic space (Talairach and Tournoux, 1988) by means of an automated feature-matching algorithm (Collins et al., 1994).
To protect the photo multipliers in the PET detectors from the effects of the coil-generated magnetic field, we formed an insert consisting of four layers of 0.5-mm-thick mu-metal in a cylinder, the outer diameter of which matched the inner diameter of the scanner’s patient port, namely 63 cm. These sheets are of uniform density and therefore do not cause any artifacts in the images. They do, however, cause increased attenuation and result in a 22% loss in coincidence counts when inserted. A blank transmission scan was performed with the magnetic shielding in place before the subject was scanned. Without this scan, the subject’s head would appear 22% denser, and this would compromise both the scatter and attenuation correction.
Once the subject and the coil assembly had been positioned in the scanner, a 10 min transmission scan was performed. The transmission data were used to correct for attenuation of gamma rays caused by all the objects in the scanner, including the coil, the coil mount, and the metal sheets. The transmission scan also permits verification of the final position of the coil relative to the acquired PET and MR images (see Fig. 1, top).
To assess the significance of the relationship between the number of TMS pulse trains and normalized CBF (i.e., their linear regression), we calculated a number-of-trains regression map. All of the following calculations were performed for each of the three-dimensional volume elements (voxels) constituting a volume. The data set consisted of normalized CBF obtained in six subjects, scanned six times each during the TMS, yielding a total of 36 CBF volumes. The effect of TMS rate on CBF was assessed by means of an ANCOVA (Sokal and Rohlf, 1981), with subjects as a main effect and the number of pulse trains administered during the scan as a covariate. The subject effect was removed, and the parameter of interest was the slope of the effect of the number of pulse trains on normalized CBF. An estimate of the slope,βS, and its standard deviation,s, were obtained by a least-squares fit of the model (ANCOVA) at each voxel. In total, 36 values of the covariate were used, corresponding to the 36 volumes in the data set. The degrees of freedom (df) of the estimate of the standard deviation (s) were increased from 29 (36 - 6 - 1) by pooling s across all voxels, and this replaced a voxel s in the denominator of thet statistic, t =βS/pooled s, so that its distribution was normal. The resulting t statistic map tested whether, at a given voxel, the slope of the regression was significantly different from zero; the presence of a significant peak was tested by a method based on three-dimensional Gaussian random-field theory, which corrects for the multiple comparisons involved in searching across a volume (Worsley et al., 1992). Values equal to or exceeding a criterion of t = 3.5 were considered significant (p < 0.0004, two-tailed, uncorrected), yielding a false positive rate of 0.58 in 555 resolution elements (each of which has dimensions 14 × 14 × 14 mm), if the brain volume is 1500.00 ccm.
RESULTS
Effects of magnetic field on photo multipliers
Figure 1 (bottom, A–C) shows 16 peaks corresponding to the 4 × 4 crystal array in the detector block. Despite the fact that the duty cycle of the magnetic field was only 0.2%, this field caused a serious distortion in the crystal identification matrix. The extent of the distortion indicated that the field-related effects went beyond the 200 μsec pulse. These distortions can be prevented, however, by placing three well grounded sheets of metal with high magnetic-shielding properties between the coil and the detector (see Fig. 1, bottom, C).
Behavioral effects of TMS
No eye movements were elicited by the stimulation, nor did the subjects report any visual or other sensations during the scans. They could feel “tapping” of the coil on the scalp and, in varying degrees, could hear the clicks. Two subjects noticed differences in the number of pulse trains delivered in different scans.
Effects of TMS on regional CBF
Figure 3 and Table 1 summarize the main findings obtained by correlating, on a voxel-by-voxel basis, normalized CBF with the number of TMS pulse trains. A significant positive correlation between CBF and the number of pulse trains was observed in the target region, i.e., the left FEF. Furthermore, positive covariations also were observed in several areas of the visual cortex, namely in the left medial parieto-occipital (PO) cortex and in the left and right superior parietal cortex. In addition, a positive correlation was found in the right supplementary eye field (SEF) located on the medial wall of the frontal lobe.
Fig. 3.
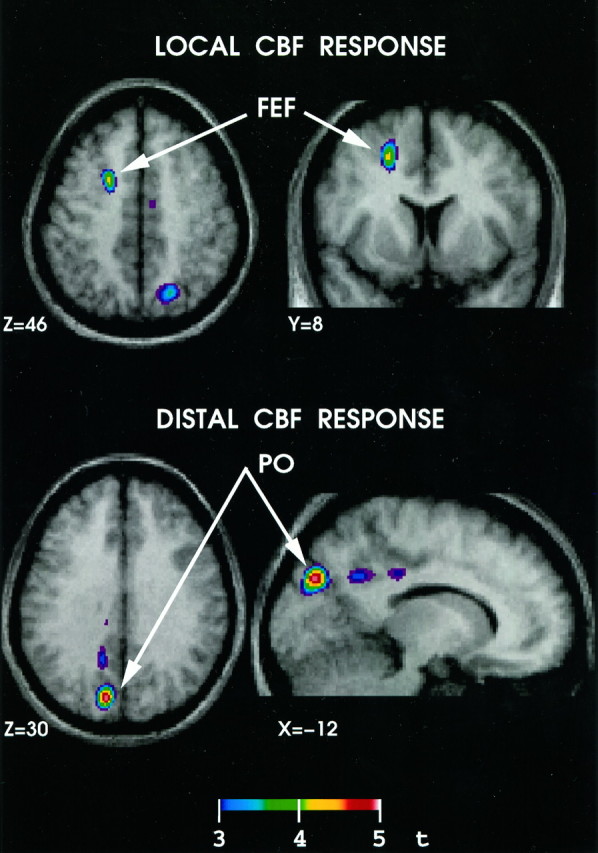
Brain regions that showed significant (t > 3.5) correlations between CBF and the number of TMS pulse trains. The top of the figure shows a significant correlation in the vicinity of the frontal eye field (FEF), i.e., in the stimulated area. Thebottom of the figure shows one of the cortical regions that most likely was activated through the spread of electrical stimulation from the FEF, namely the parieto-occipital (PO) cortex of the ipsilateral hemisphere. A similar region is known to be connected anatomically with the FEF in the monkey (Schall et al., 1995).
Table 1.
Brain regions with significant positive covariations between normalized CBF and the number of TMS pulse-trains
| REGION | X | Y | Z | t |
|---|---|---|---|---|
| Left FEF | −20 | 6 | 47 | 4.3 |
| Left cuneus (PO) | −12 | −80 | 30 | 5.0 |
| Left superior parietal | −36 | −61 | 65 | 4.2 |
| Right superior parietal | 21 | −69 | 50 | 3.6 |
| Right SEF | 8 | −5 | 54 | 4.3 |
DISCUSSION
The results of our study demonstrate the feasibility of the combined TMS/PET approach for revealing neural connectivity in the living human brain. In the ensuing discussion first we shall address the issue of locating and targeting a cortical region for a TMS/PET experiment. Then we will compare our findings with those of previous blood flow activation studies of oculomotor control and with the results of anatomic tracing studies performed by others in the monkey.
Locating and targeting the cortical region-of-interest
In this study we used frameless stereotaxy to aim the coil at the probabilistic location of the left FEF. In each subject the likelihood of the FEF being included in the stimulated volume depends on the following three factors: first, the size of the brain volume stimulated by the Cadwell Corticoil, which was estimated to be approximately 20 × 20 × 10 mm. The strength of the stimulation field drops to 50% of the peak at ∼10 mm from the peak. Second, the accuracy of the frameless stereotaxy guiding the coil, which was evaluated by Zinreich et al. (1993) to vary between ± 2–4 mm. Third, the accuracy of the probabilistic approach in localizing the individual’s FEF. The latter factor is influenced by the extent of interindividual and interstudy differences in the FEF location. On the basis of the data obtained in one of our previous studies of oculomotor control (Paus et al., 1995), we calculated the 95% confidence intervals for the X, Y, and Zcoordinates of the left FEF. The coordinates were obtained in nine individual subjects by subtracting CBF obtained in a baseline scan (no eye movements) from that obtained during the execution of large horizontal saccades in darkness. The confidence intervals were −46 to −52 mm (X), −2 to −9 mm (Y), and 48 to 54 mm (Z). Thus, the extent of interindividual variability was limited by a sphere with a 6 mm diameter. The extent of interstudy variability in the location of the left FEF, based on the results of nine studies performed in four different institutions, was of a similar magnitude (see Table 4 inPaus, 1996). This range of interindividual and interstudy variability indeed supports the rationale of the current approach of PET activations studies, namely that of using standardized stereotaxic space and blurred images to register homologous functional units across individuals. Thus, considering the extent of the stimulated volume, the estimated 6 mm error of the probabilistic approach is unlikely to introduce significant noise in a given TMS/PET study. Nevertheless, it is conceivable that future improvements of the focality of TMS or the design of a particular TMS/PET experiment would justify going beyond the probabilistic approach and identifying the location of a region-of-interest in each individual subject. For example, fMRI, or the actual effects of TMS on a specific behavior, can be used to guide the positioning of the coil in a subsequent TMS/PET study.
Connectivity of the human FEF
In this study TMS with the coil positioned over the probabilistic FEF elicited not only local changes in the cortex under the coil, but, most importantly, changes in CBF in several cortical regions far removed from the stimulation site. Although the TMS-induced electric field excites neurons and/or their axons located within the stimulated volume in both orthodromic and antidromic directions, the distal changes in CBF most likely would reflect the former, because mainly the orthodromic stimulation leads to changes in synaptic activity (Wong and Moss, 1992). The pattern of the distal effects of the stimulation is consistent with the results of previous blood flow activation studies of oculomotor control. For example, we previously observed increases in CBF in the left superior parietal cortex during the execution of visually guided eye movements (Paus et al., 1993); these increases were located within 5–10 mm of those observed in this study. Similarly, the correlation peak found in the right SEF is located just 6 mm ventral and 2 mm caudal to those observed in our studies of oculomotor control (Paus et al., 1993). The previous studies involved an execution of 30–50 saccadic eye movements per scan. As previously mentioned, no TMS-related eye movements were detected in the present study. Thus, the observed distal CBF changes should be attributed solely to the spread of activation from the stimulation site along known anatomic pathways. Such pathways are well known in the monkey brain. In a recent investigation Schall et al. (1995) described anatomic connections between the medial portion of the monkey FEF and several areas of the dorsal visual stream, including those in the posterior part of the superior parietal cortex and in the medial parieto-occipital cortex (PO). In the present study a comparable set of visual areas was activated by TMS of the left FEF. This degree of consistency between the anatomic tracing studies of the monkey FEF and the present TMS/PET study of the human FEF validates this approach to the study of neural connectivity in the human cerebral cortex. Nevertheless, further investigations are needed to explore several technical issues, including the effects of coil orientation, stimulus intensity, and current direction on the pattern of distal CBF changes. For example, it has been shown that the tangential and radial coil orientations, relative to the subject’s head, over the frontal cortex elicit electromyographic responses consistent with preferential activation of cortico-cortical (I-wave) and cortico-spinal (D-wave) pathways, respectively (Maccabee et al., 1991). Given the tangential orientation used in the present study, our finding of CBF changes in the distal cortical areas and the lack of such changes in subcortical structures is consistent with the Maccabee et al. (1991) results. It remains to be seen whether different stimulation protocols preferentially would activate ipsi- and contralateral cortico-cortical pathways, respectively, or cortico-subcortical connections, such as those known to link the FEF with the ipsilateral thalamus and superior colliculus. Furthermore, it should be kept in mind that blood flow changes in small subcortical structures, such as the individual thalamic nuclei and the superior colliculus, are difficult to detect even when the subject is moving his eyes.
Summary and conclusions
Overall, our findings confirm that (1) TMS induces focal changes in brain activity that, in turn, lead to changes in regional CBF, and (2) such changes can be observed not only at the stimulation site but, most importantly, in regions presumably connected with this site. We believe that the combined TMS/PET technique opens up important new avenues for in vivo studies of neural connectivity in the human brain. Besides the mapping of neural connectivity of the cerebral cortex in healthy volunteers, it also has potential in clinical studies of various neurological and psychiatric disorders for which it is crucial to evaluate the state of functional connectivity independent of the sensory, motor, and cognitive abilities of the patient. For example, the TMS/PET mapping of fronto-cortical connectivity in patients with schizophrenia may confirm or put to question the presumed abnormalities of functional connectivity in this disorder (Friston and Frith, 1995). The effectiveness and neural mechanisms of treatment interventions, such as rehabilitative training in stroke victims, also would be evaluated more effectively if the behavior targeted by the intervention, such as the extent of residual movement, is not part of the imaging protocol. Thus, the combined TMS/PET approach offers an objective tool for assessing the state of functional connectivity in the living human brain independent of possible behavioral confounds.
Footnotes
This work was supported by the McDonnell-Pew Program in Cognitive Neuroscience and the Medical Research Council (Canada) Special Project SP-30. Dr. Jech’s stay at the Montreal Neurological Institute (MNI) was funded by the Granting Agency of the Czech Republic (GACR 0376) and the Czech Ministry of Health (IGA MZ 35-71-31 and IGA MZ 35-72-3). We thank the Cadwell laboratories for providing us with the high-speed magnetic stimulator and for the technical advice of their engineer Mike Vance. We also thank Bryan Hynes and Mike Mazza from the MNI/Hospital for building the coil–probe assembly, Regina Visca for her assistance with various aspects of the project, and the staff of the McConnell Brain Imaging Center for their highly professional assistance in data acquisition and preprocessing. We also thank Drs. Brenda Milner and Robert Zatorre for comments on this manuscript.
Correspondence should be addressed to Dr. Tomáš Paus, Montreal Neurological Institute, 3801 University, Montreal, Quebec, Canada H3A 2B4.
REFERENCES
- 1.Alexander GE, Moeler JR. Application of the scaled subprofile model to functional imaging in neuropsychiatric disorders: a principal component approach to modelling brain function in disease. Hum Brain Mapp. 1994;2:79–94. [Google Scholar]
- 2.Amassian VE, Cracco RQ, Maccabee PJ, Cracco JB. Cerebello-frontal cortical projections in humans studied with the magnetic coil. Electroencephalogr Clin Neurophysiol. 1992;85:265–272. doi: 10.1016/0168-5597(92)90115-r. [DOI] [PubMed] [Google Scholar]
- 3.Bailey P, von Bonin G, Garol HE, McCulloch WS. Long association fibers in cerebral hemispheres of monkey and chimpanzee. J Neurophysiol. 1943;6:129–134. [Google Scholar]
- 4.Bailey P, von Bonin G, Davis EW, Garol HW, McCulloch WS. Further observations on associational pathways in the brain of Macaca mulatta. J Neuropathol Exp Neurol. 1944;3:413–415. [Google Scholar]
- 5.Barker AT, Freeston IL, Jalinous R, Jarratt JA. A. Noninvasive stimulation of motor pathways within the brain using time-varying magnetic fields. Electroencephalogr Clin Neurophysiol. 1985;61:S245–S246. [Google Scholar]
- 6.Brandt SA, Davis TL, Obrig H, Meyer BU, Belliveau JW, Rosen BR, Villringer A. Functional magnetic resonance imaging shows localized brain activation during serial transcranial stimulation in man. NeuroReport. 1996;7:734–736. doi: 10.1097/00001756-199602290-00013. [DOI] [PubMed] [Google Scholar]
- 7.Cohen LG, Roth BJ, Nilsson J, Dang N, Panizza M, Bandinelli S, Friauf W, Hallett M. Effects of coil design on delivery of focal magnetic stimulation. Technical considerations. Electroencephalogr Clin Neurophysiol. 1990;75:350–357. doi: 10.1016/0013-4694(90)90113-x. [DOI] [PubMed] [Google Scholar]
- 8.Collins DL, Neelin P, Peters TM, Evans AC. Automatic 3D intersubject registration of MR volumetric data in standardized Talairach space. J Comput Assist Tomogr. 1994;18:192–205. [PubMed] [Google Scholar]
- 9.Cracco RQ, Amassian VE, Maccabee PJ, Cracco JB. Comparison of human transcallosal responses evoked by magnetic coil and electrical stimulation. Electroencephalogr Clin Neurophysiol. 1989;74:417–424. doi: 10.1016/0168-5597(89)90030-0. [DOI] [PubMed] [Google Scholar]
- 10.Cracco RQ, Amassian VE, Maccabee PJ, Cracco JB, Rudell A, Eberle L. Insights into cerebral function revealed by magnetic coil stimulation. Adv Neurol. 1993;63:43–50. [PubMed] [Google Scholar]
- 11.Dressler D, Voth E, Feldmann M, Benecke R. Safety aspects of transcranial brain stimulation in man tested by single photon emission-computed tomography. Neurosci Lett. 1990;119:153–155. doi: 10.1016/0304-3940(90)90821-p. [DOI] [PubMed] [Google Scholar]
- 12.Dusser de Barenne JG, McCulloch WS. Functional boundaries in the sensori-motor cortex of the monkey. Proc Soc Exp Biol Med. 1936;35:329–331. [Google Scholar]
- 13.Evans AC, Thompson CJ, Marrett S, Meyer E, Mazza M. Performance evaluation of the PC-2048: a new 15-slice encoded-crystal PET scanner for neurological studies. IEEE Trans Med Imag. 1991;10:90–98. doi: 10.1109/42.75615. [DOI] [PubMed] [Google Scholar]
- 14.Friston KJ. Functional and effective connectivity in neuroimaging: a synthesis. Hum Brain Mapp. 1994;2:56–78. [Google Scholar]
- 15.Friston KJ, Frith CD. Schizophrenia: a disconnection syndrome? Clin Neurosci. 1995;3:89–97. [PubMed] [Google Scholar]
- 16.Friston KJ, Frith CD, Fletcher P, Liddle PF, Frackowiak RS. Functional topography: multidimensional scaling and functional connectivity in the brain. Cereb Cortex. 1996;6:156–164. doi: 10.1093/cercor/6.2.156. [DOI] [PubMed] [Google Scholar]
- 17.Gevins A, Zeitlin GM, Yingling CD, Doyle JC, Dedon MF, Schaffer RE, Roumasset JT, Yeager CL. EEG patterns during cognitive tasks. I. Methodology and analysis of complex behaviors. Electroencephalogr Clin Neurophysiol. 1979;47:693–703. doi: 10.1016/0013-4694(79)90296-7. [DOI] [PubMed] [Google Scholar]
- 18.Gevins A, Doyle JC, Cuttilo BA, Schaffer RE, Tannehill RS, Ghannam JH, Gilcrease VA, Yeager CL. Electrical potentials in human brain during cognition: a new method reveals dynamic patterns of correlation. Science. 1981;213:918–922. doi: 10.1126/science.7256287. [DOI] [PubMed] [Google Scholar]
- 19.Gevins A, Bressler SL, Morgan NH, Cutillo BA, White RM, Greer DS, Illes J. Event-related covariances during a bimanual visuomotor task. I. Methods and analysis of stimulus- and response-locked data. Electroencephalogr Clin Neurophysiol. 1989;74:58–75. doi: 10.1016/0168-5597(89)90052-x. [DOI] [PubMed] [Google Scholar]
- 20.Hallett M, Cohen LG. Magnetism. A new method for stimulation of nerve and brain [clinical conference]. JAMA. 1989;262:538–541. doi: 10.1001/jama.262.4.538. [DOI] [PubMed] [Google Scholar]
- 21.Herscovitch P, Markham J, Raichle ME. Brain blood flow measured with intravenous H2(15)O. I. Theory and error analysis. J Nucl Med. 1983;24:782–789. [PubMed] [Google Scholar]
- 22.Huerta MF, Krubitzer LA, Kaas JH. Frontal eye field as defined by intracortical microstimulation in squirrel monkeys, owl monkeys, and macaque monkeys. II. Cortical connections. J Comp Neurol. 1987;265:332–361. doi: 10.1002/cne.902650304. [DOI] [PubMed] [Google Scholar]
- 23.Leichnetz GR, Goldberg ME. Higher centers concerned with eye movement and visual attention: cerebral cortex and thalamus. In: Buttner-Ennever JA, editor. Neuroanatomy of the oculomotor system. Elsevier; New York: 1988. pp. 365–429. [PubMed] [Google Scholar]
- 24.Maccabee PJ, Eberle L, Amassian VE, Cracco RQ, Rudell A, Jayachandra M. Spatial distribution of the electric field induced in volume by round and figure 8 magnetic coils: relevance to activation of sensory nerve fibers. Electroencephalogr Clin Neurophysiol. 1990;76:131–141. doi: 10.1016/0013-4694(90)90211-2. [DOI] [PubMed] [Google Scholar]
- 25.Maccabee PJ, Amassian VE, Cracco RQ, Cracco JB, Eberle L, Rudell A. Stimulation of the human nervous system using the magnetic coil. Clin Neurophysiol. 1991;8:38–55. doi: 10.1097/00004691-199101000-00006. [DOI] [PubMed] [Google Scholar]
- 26.McIntosh AR, Gonzalez-Lima F. Structural equation modelling and its application to network analysis in functional brain imaging. Hum Brain Mapp. 1994;2:2–22. [Google Scholar]
- 27.Mesulam M-M. Tracing neural connections of human brain with selective silver impregnation. Observations on geniculocalcarine, spinothalamic, and entorhinal pathways. Arch Neurol. 1979;36:814–818. doi: 10.1001/archneur.1979.00500490028004. [DOI] [PubMed] [Google Scholar]
- 28.Muri RM, Hess CW, Meienberg O. Transcranial stimulation of the human frontal eye field by magnetic pulses. Exp Brain Res. 1991;86:219–223. doi: 10.1007/BF00231057. [DOI] [PubMed] [Google Scholar]
- 29.Pascual-Leone A, Houser CM, Reese K, Shotland LI, Grafman J, Sato S, Valls-Sole J, Brasil-Neto JP, Wassermann EM, Cohen LG, Hallett M. Safety of rapid-rate transcranial magnetic stimulation in normal volunteers. Electroencephalogr Clin Neurophysiol. 1993;89:120–130. doi: 10.1016/0168-5597(93)90094-6. [DOI] [PubMed] [Google Scholar]
- 30.Paus T. Location and function of the human frontal eye field: a selective review. Neuropsychologia. 1996;34:475–483. doi: 10.1016/0028-3932(95)00134-4. [DOI] [PubMed] [Google Scholar]
- 31.Paus T, Petrides M, Evans AC, Meyer E. Role of the human anterior cingulate cortex in the control of oculomotor, manual, and speech responses: a positron emission tomography study. J Neurophysiol. 1993;70:453–469. doi: 10.1152/jn.1993.70.2.453. [DOI] [PubMed] [Google Scholar]
- 32.Paus T, Marrett S, Worsley KJ, Evans AC. Extra-retinal modulation of cerebral blood flow in the human visual cortex: implications for saccadic suppression. J Neurophysiol. 1995;74:2179–2183. doi: 10.1152/jn.1995.74.5.2179. [DOI] [PubMed] [Google Scholar]
- 33.Paus T, Marrett S, Worsley KJ, Evans AC. Imaging motor-to-sensory discharges in the human brain: an experimental tool for the assessment of functional connectivity. NeuroImage. 1996;4:78–86. doi: 10.1006/nimg.1996.0031. [DOI] [PubMed] [Google Scholar]
- 34.Peters T, Davey B, Munger P, Comeau R, Evans A, Olivier A. Three-dimensional multimodal image-guidance for neurosurgery. IEEE Trans Med Imag. 1996;15:121–128. doi: 10.1109/42.491414. [DOI] [PubMed] [Google Scholar]
- 35.Petr P, Holden LB, Jirout J. The efferent intercortical connections of the superficial cortex of the temporal lobe (Macaca mulatta). J Neuropathol Exp Neurol. 1949;8:100–103. doi: 10.1097/00005072-194901000-00009. [DOI] [PubMed] [Google Scholar]
- 36.Pribram KH, MacLean PD. Neuronographic analysis of medial and basal cerebral cortex. II. Monkey. J Neurophysiol. 1953;16:324–340. doi: 10.1152/jn.1953.16.3.324. [DOI] [PubMed] [Google Scholar]
- 37.Raichle ME, Martin WRW, Herscovitch P, Mintun MA, Markham J. Brain blood flow measured with intravenous H15O. II. Implementation and validation. J Nucl Med. 1983;24:790–798. [PubMed] [Google Scholar]
- 38.Schall JD, Morel A, King DJ, Bullier J. Topography of visual cortex connections with frontal eye field in macaque: convergence and segregation of processing streams. J Neurosci. 1995;15:4464–4487. doi: 10.1523/JNEUROSCI.15-06-04464.1995. [DOI] [PMC free article] [PubMed] [Google Scholar]
- 39.Shaffran B, Maccabee PJ, Amassian VE, Cracco RQ, Strashun A, Vaquer R, Singman R. Spectamine imaging of cerebral blood flow during voluntary movement and focal stimulation of motor cortex with magnetic coil. Soc Neurosci Abstr. 1989;15:789. [Google Scholar]
- 40.Sokal RR, Rohlf FJ. Biometry, 3rd Ed. Freeman; San Francisco: 1981. [Google Scholar]
- 41.Strother SC, Kanno I, Rottenberg DA. Principal component analysis, variance partitioning, and “functional connectivity.”. J Cereb Blood Flow Metab. 1995;15:353–360. doi: 10.1038/jcbfm.1995.44. [DOI] [PubMed] [Google Scholar]
- 42.Talairach J, Tournoux P. Co-planar stereotactic atlas of the human brain: 3-dimensional proportional system: an approach to cerebral imaging. Verlag; Stuttgart: 1988. [Google Scholar]
- 43.Thatcher RW, Krause PJ, Hrybyk M. Cortico-cortical associations and EEG coherence: a two-compartmental model. Electroencephalogr Clin Neurophysiol. 1986;64:123–143. doi: 10.1016/0013-4694(86)90107-0. [DOI] [PubMed] [Google Scholar]
- 44.Tucker DM, Roth DL, Bair TB. Functional connections among cortical regions: topography of EEG coherence. Electroencephalogr Clin Neurophysiol. 1986;63:242–250. doi: 10.1016/0013-4694(86)90092-1. [DOI] [PubMed] [Google Scholar]
- 45.Wassermann EM, Wang B, Zeffiro TA, Sadato N, Pascual-Leone A, Toro C, Hallett M. Locating the motor cortex on the MRI with transcranial magnetic stimulation and PET. NeuroImage. 1996;3:1–9. doi: 10.1006/nimg.1996.0001. [DOI] [PubMed] [Google Scholar]
- 46.Wessel K, Kompf D, Klostermann W, Moser A. Lack of oculomotor response after transcranial magnetic stimulation. NeuroOphthalmology. 1991;11:199–208. [Google Scholar]
- 47.Wong M, Moss RL. Modulation of single-unit activity in the rat amygdala by neurotransmitters, estrogen priming, and synaptic inputs from the hypothalamus and midbrain. Synapse. 1992;10:94–120. doi: 10.1002/syn.890100203. [DOI] [PubMed] [Google Scholar]
- 48.Woods RP, Mazziotta JC, Cherry SR. MRI-PET registration with automated algorithm. J Comput Assist Tomogr. 1993;17:536–546. doi: 10.1097/00004728-199307000-00004. [DOI] [PubMed] [Google Scholar]
- 49.Worsley KJ, Evans AC, Marrett S, Neelin P. Determining the number of statistically significant areas of activation in subtracted activation studies from PET. J Cereb Blood Flow Metab. 1992;12:900–918. doi: 10.1038/jcbfm.1992.127. [DOI] [PubMed] [Google Scholar]
- 50.Zinreich SJ, Tebo S, Long DM, Brem H, Mattox D, Loury ME, Vander Volk C, Kotch W, Kennedy DW, Bryan RN. Frameless stereotactic integration of CT imaging data. Radiology. 1993;188:735–742. doi: 10.1148/radiology.188.3.8351341. [DOI] [PubMed] [Google Scholar]