

Abstract
This study examined the contributions of passive and active membrane properties to the temporal selectivities of electrosensory neurons in vivo. The intracellular responses to time-varying (2–30 Hz) electrosensory stimulation and current injection of 27 neurons in the midbrain of the weakly electric fishEigenmannia were recorded. Each neuron was filled with biocytin to reveal its anatomy.
Neurons were divided into two biophysically distinct groups based on their frequency-dependent responses to sinusoidal current injection over the range 2–30 Hz. Fourteen neurons showed low-pass filtering, with a maximum decline in the amplitude of voltage responses of >2.6 dB (X = 4.30 dB, s = 1.10 dB) to sinusoidal current injection. These neurons also showed low-pass filtering of electrosensory information but with larger maximum declines in postsynaptic potential amplitude (X = 9.53 dB, s = 3.34 dB; n = 10). These neurons had broad dendritic arbors and relatively spiny dendrites. Five neurons showed all-pass filtering, having maximum decline in the amplitude of voltage responses of <2.0 dB (X = 1.16 dB,s = 0.61 dB). For electrosensory stimuli, however, these neurons showed low-, band-, or high-pass filtering. These neurons had small dendritic arbors and few or no spines.
Voltage-dependent “active” conductances were revealed in eight neurons by using several levels of current clamp. In four of these neurons, the duration of the voltage-dependent conductances decreased in concert with the period of the electrosensory stimulus, whereas in the other four neurons the duration of the voltage-dependent conductances was relatively short (<30 msec) and nearly constant across sensory stimulation frequencies. These conductances enhanced the temporal filtering properties of neurons.
Keywords: Eigenmannia, whole-cell patch, sensory processing, dendritic spines, torus semicircularis, neural codes
A fundamental issue for understanding the neural control of behavior is how neurons transform information. Extracellular recordings have identified many transformations that are important in the processing of sensory information and translation to motor commands. The mechanisms underlying these transformations, however, are poorly understood. Potential substrates of transformation include the passive electrical properties of a neuron, the types and distribution of channels and conductances in a neuron, and the properties of the network in which the neuron participates. Intracellular recordings, although technically difficult in vivo, are required for studying these mechanisms. This study explores the mechanisms underlying temporal selectivity using patch-type pipettes to obtain “whole-cell” recordings (Rose and Fortune, 1996) from neuronsin vivo.
The dorsal torus semicircularis of the electric fishEigenmannia is particularly well suited for studying the mechanisms of sensory transformations. The afferent codes, the transformation of these codes by toral neurons into new codes, and many of the details of the neural network are well known (for review, seeHeiligenberg, 1991). The sensory codes of tuberous electrosensory neurons and their afferents from the electrosensory lateral line lobe (ELL) have been studied extensively with regard to their role in a behavior, the jamming avoidance response (JAR). In the JAR a fish adjusts the frequency of its electric organ discharge (EOD) to avoid detrimental interference from EODs of neighboring fish. When two fish of similar EOD frequencies approach, the combination of their EODs produces amplitude and phase modulations that can interfere with both animals’ ability to electrolocate (Matsubara and Heiligenberg, 1978). Modulations (“beat rates”) of 3–8 Hz are most detrimental to electrolocation and elicit the largest JARs (Bullock et al., 1972;Heiligenberg et al., 1978; Partridge et al., 1981; Bastian and Yuthas, 1984), whereas beat rates of >20 Hz do not impair electrolocation. During a JAR the fish with the lower initial EOD frequency lowers its frequency while the other fish raises its frequency, thereby increasing the beat rate to values that have little effect on electrolocation.
Tuberous p-type primary afferents code the beat rate in the periodicity of their discharges for rates up to at least 40 Hz. Most neurons in the dorsal torus, however, have low-pass or band-pass filtering characteristics, responding best to beat rates below 8 Hz; other neurons show all- or high-pass filtering characteristics (Fig.1). These filtering characteristics are correlated with the density of dendritic spines (Rose and Call, 1993). Ampullary neurons in the torus, a parallel electrosensory system inEigenmannia, have similar frequency filtering properties (Fortune and Rose, 1997). Interestingly, the ampullary afferents from the ELL use the same temporal code as the tuberous system (Fig. 1).
Fig. 1.

Schematic diagram of the ascending electrosensory system. The ampullary and tuberous systems have parallel projections. Ampullary and P-type tuberous afferents project into the ELL. They form synapses on two types of neurons, basilar pyramidal neurons and granule cells (filled ovals). The granule cells, which are inhibitory neurons, project onto nonbasilar pyramidal neurons. The responses of basilar and nonbasilar neurons are ∼180° out of phase with respect to the stimulus: these are known as E and I units, respectively. The pyramidal neurons project into various laminae in the torus semicircularis. On the bottom left corner is an ampullary stimulus of frequencies from ∼2–20 Hz. On the bottom right is a tuberous stimulus with corresponding AM (beat) rates. The spike traces above each stimulus are example extracellular responses of neurons; lower traces correspond to the firing pattern of primary afferents. A majority of neurons in the ELL have broad-band responses that are nearly constant within this range of stimulus frequencies or beat rates. There are neurons, especially tuberous I units in the centromedial region of the ELL, that have low-pass responses to sensory stimuli (Shumway, 1989). Ampullary and tuberous neurons in the dorsal five layers of the torus have low-, high-, all-, or band-pass (not shown) responses.
In this paper we first examine the relationship between the passive electrical filtering of neurons and their dendritic architecture. Second, we examine the relationship between passive electrical filtering and the filtering of sensory information. Finally, we describe voltage-dependent conductances that enhance the sensory-filtering properties of some neurons.
MATERIALS AND METHODS
Experimental procedures were similar to those used in earlier investigations of the torus (Heiligenberg and Rose, 1985; Rose and Call, 1993; Fortune and Rose, 1997). The techniques used to obtain whole-cell recordings are described in detail by Rose and Fortune (1996). Whole-cell intracellular recordings were made from 27 neurons in the dorsal five layers of the torus of 20 fish.
Patch pipettes were constructed from borosilicate or aluminosilicate capillary glass (A-M systems 5960; 1 mm outer diameter, 0.58 mm inner diameter, A-M systems 5810; 1 mm outer diameter and 0.75 mm inner diameter, respectively) using a Flaming-Brown type puller (model P-97; Sutter Instruments, Novato, CA). Electrodes were pulled to resistances between 10 and 30 MΩ. Electrode tips were back-filled with 1.5% w/v biocytin (Molecular Probes, Eugene, OR). The biocytin solution, pH 7.4, was 290 mOsm and contained (values in mm) 100 potassium acetate or potassium gluconate, 2 KCl, 1 MgCl2, 5 EGTA, 10 HEPES, 20 KOH, and 43 biocytin. Biocytin was replaced by mannitol in the solution used to fill pipette shanks. A second set of solutions had 10 mm KCl and 92 mm potassium acetate—no differences were apparent between recordings with each of these solutions.
Electrodes were mounted in a Plexiglas holder with a pressure port. This port allowed the application of pressure pulses (40–80 msec, 40 psi) from a Picospritzer (General Valve, Fairfield, NJ) or the manual application of suction or pressure from a 30 cc syringe. The electrode was advanced in 1.5 μm steps (Burleigh microdrive; Fishers, NY) through the dorsal five layers of the torus. Responses were amplified by an electrometer (model 767, World Precision Instruments, Sarasota, FL) and stored on videotape at 40 kHz with 16-bit resolution (model 3000, Vetter Instruments, Rebersburg, PA).
Fish, ∼1 year old, of the genus Eigenmannia were used. For experiments, a fish’s EOD was measured and then attenuated (∼1000-fold) by intramuscular injection of Flaxedil (4 μg/gm fish). Additional injections of Flaxedil were made during the experiment as necessary to maintain the attenuation of the EOD. The fish’s EOD was replaced by a sinusoidal mimic (S1), which was delivered through electrodes placed at the tail and in the mouth. The amplitude and frequency of the S1 were adjusted to approximate the fish’s EOD before the injection of Flaxedil. Additional electrosensory stimuli were delivered through an array of carbon electrodes that surrounded the fish (Fig. 2).
Fig. 2.

Schematic diagram of the stimulation apparatus. A sinusoidal mimic of the fish’s electric organ discharge (S1) is presented through electrodes placed in the mouth and at the tail. Sinusoidal jamming signals (S2) near the frequency of the S1 can be presented through pairs of carbon electrodes surrounding the fish. The S2 also can be added electronically to the S1 signal. The addition of anS2 produces amplitude modulations (beats) that are detected by tuberous P-type receptors. Low-frequency ampullary stimuli can be presented through any pair of electrodes.
At the conclusion of the experiment, not more than 4 hr after the first neuron was filled, animals were deeply anesthetized by the flow of 2% w/v urethane across the gills. Animals were perfused transcardially with saline–heparin solution, followed by 4% w/v paraformaldehyde in 0.2 m phosphate buffer, pH 7.4. All animal husbandry, anesthesia, and surgical procedures were performed under guidelines established by the Society for Neuroscience.
After perfusion, the brain was removed and stored at 4°C overnight in the paraformaldehyde solution. Sections 100 μm thick were cut on a vibratome and reacted using an avidin–biotin peroxidase kit (Vector Laboratories, Burlingame, CA). 3,3′-Diaminobenzidine (Sigma, St. Louis, MO) was the chromagen. Sections were dehydrated, cleared in xylenes, mounted on slides, and coverslipped.
Stimuli. The search stimulus was designed to elicit responses from both ampullary and tuberous neurons in the torus. The ampullary component of the search stimulus was a linear frequency sweep (2–30 Hz, 10 sec duration, 1–2 mV/cm at the fish’s head) that was added to the S1 and presented through the electrodes in the mouth and at the tail. The tuberous component (S2) was a sine wave 4 Hz higher than the S1 frequency that was delivered through one pair of the array of carbon electrodes surrounding the fish. The addition of the S2 generated broad-field amplitude modulations at a frequency equal to the difference in frequencies of the S1 and S2; the modulation frequency is known as the “beat rate.” Both the ampullary and tuberous components were presented simultaneously.
Once an extracellular recording was established, the best stimulus (ampullary or tuberous) and stimulus orientation were determined. For most neurons changes in the orientation of the stimulus resulted in quantitative changes in the spike rate and the amplitude of postsynaptic potentials (PSPs). For each neuron the stimulus orientation was chosen to elicit the strongest and most consistent response from the neuron.
To compare the “passive” electrical filtering properties of a neuron to its temporal filtering of sensory information, we presented stimuli with similar temporal structure both directly to the neuron (intracellular injection of current via the electrode, “current scan”) and to the neuron via the intact sensory system (“sensory scan”). The current scan was a negative-going 0.1 nA peak to peak sinusoidal current sweep from ∼2 to 30 Hz delivered through the recording electrode at the soma. The current scan was added to the DC holding current. The frequency sweep was linear and had a duration of 10 sec. Sensory scans stimulated either the tuberous or ampullary systems. Sensory scans were temporally identical to the current scan: a linear frequency sweep with a duration of 10 sec. To activate the tuberous system, the frequency of the S2 was swept linearly from 2 Hz greater than the S1 to 30 Hz above the S1, which produced beat rates of 2–30 Hz. To activate the ampullary system, we replaced the S1 by a linear frequency sweep from 2–30 Hz. Square wave −0.1 nA magnitude pulses were used to determine the input resistances for each neuron.
Recording procedures and data analysis. The electrode was advanced through the tissue in 1.5 μm steps while a small amount of positive pressure was maintained. Neurons were detected by an abrupt increase in resistance and the appearance of spikes and/or ripples in the recording trace (Rose and Fortune, 1996). Light suction and approximately −0.2 nA DC were applied to achieve seal resistances of ≈400 MΩ or greater (X = 663 MΩ, s= 425 MΩ; n = 26); three neurons had initial seals of <400 MΩ. In those cases in which an extracellular recording was established, responses to the sensory scans were recorded. After recording the extracellular response, the membrane patch was ruptured by manually applying negative current to the electrode while maintaining the suction.
Access resistance, which includes the patch and electrode resistances, was generally <15% of the seal resistance (X = 12%,s = 10%; n = 22). When possible, negative current was used to reduce the access resistance to values in the tens of megaohms. If the access resistance was not reduced sufficiently, to values <100 MΩ, the determination of the passive electrical filtering properties and input resistance of the neuron was not possible, even in cases with good seals (>1 GΩ) (see Discussion).
Recordings were made at several levels of holding current: levels at which all spiking was removed, intermediate levels, and with almost none or no current. At each level several sensory scans were presented, followed by current scans and current pulses. If voltage-dependent conductances were observed, recordings were made at holding currents near the threshold for the voltage-dependent “active” conductances. At several times during a recording, all stimuli were removed, and the holding current was turned off to determine the resting potential. Neurons were filled with biocytin by applying 1–2 nA of positive DC for 1–3 min.
The temporal filtering profiles of neurons were determined by Fourier analysis of several 500 msec segments of the intracellular responses to both current and sensory scans. Spikes, when present, were clipped, or, in some cases, low-pass filtering (153 Hz corner frequency) was used before analysis; both procedures were done with a signal analysis software package (Signal V3.0, Engineering Design, Belmont, MA). The presence of spikes increased the measurements of PSP amplitude by <1 dB; nonetheless, spikes were removed. The peak of the power spectrum near the stimulus frequency was used as a measure of the amplitude of stimulus-related PSPs at that frequency. In repeated measures of PSP amplitude using this methodology, we found that the values varied by less than ±0.5 dB; each value represents an average of the responses to several stimulus cycles. For sinusoidal current injection data, the voltage drop attributable to the access resistance (electrode and patch resistances) was subtracted from the total voltages recorded. Access resistance was measured as the first exponential component in the voltage response to square wave current injection. This value was subtracted from the individual voltage values for particular stimulation rates. Decibel values were computed using the corrected PSP amplitudes.
RESULTS
Relations between biophysics and morphology
Of the 18 neurons that were labeled well, 12 had stimulus-related EPSPs that increased in amplitude when the cell was hyperpolarized by injection of negative current (Fig. 3). That is, the amplitude of these EPSPs increased in accordance with the greater driving force that was imposed; no evidence of active (voltage-dependent) conductances other than those associated with spike generation was observed.
Fig. 3.
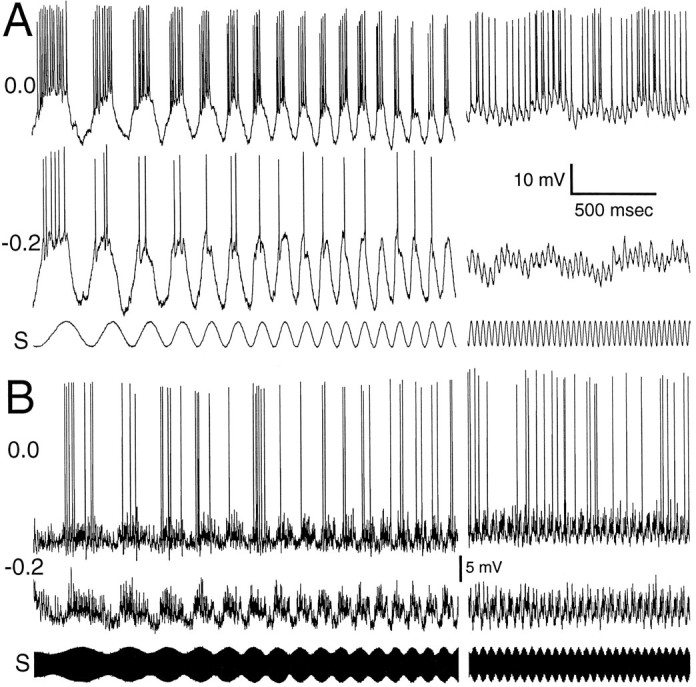
Recordings from neurons with no evidence of voltage-dependent conductances other than those associated with spike generation. A, Low-pass ampullary neuron with smooth, quasi-sinusoidal PSPs. Shown are two time-aligned intracellular traces at different holding currents and the stimulus (S). The holding current, in nano amps, is shown on the left. Two sections, low and high frequency, of the ampullary scan are shown.B, Tuberous neuron with fast, “noisy” stimulus-related PSPs. The format is similar to A. The differences in PSP shapes shown here and in subsequent figures is not related to whether the neuron is ampullary or tuberous. There are both ampullary and tuberous examples of each physiological type of neuron shown in this paper.
The structure of stimulus-related EPSPs varied considerably among this group of neurons. As seen in earlier studies (Rose and Call, 1993;Fortune and Rose, 1997), the sinusoidal nature of the sensory stimuli was reflected nicely in the smooth fluctuations of the membrane potential (Fig. 3A) of spiny neurons, but not for aspiny neurons (Fig. 3B). Instead, aspiny neurons exhibited PSPs that had very fast time courses (Fortune and Rose, 1997), and the temporal density of these PSPs fluctuated in accordance with the periodicity of the stimulus. In some low-pass neurons the minimum membrane potential showed an offset of a few millivolts in response to high frequency (or fast beat rate) stimulation relative to low frequency (or low beat rate) stimulation (Fig. 3A).
While hyperpolarizing each neuron to eliminate spiking, sinusoidal current (2–30 Hz) was injected to determine its passive electrical filtering properties. On the basis of these results, neurons fell into two groups. For neurons of the first group, voltage responses to injection of sinusoidal current declined by at least 2.6 dB (X = 4.30 dB, s = 1.10;n = 14) over the range 2–30 Hz; the voltage drop across the access resistance (electrode and patch) was subtracted. The mean resting potential of these neurons was −58 mV (s= 11; n = 13), and the mean input resistance was 138 MΩ (s = 28; n = 8). Seven of these neurons were labeled well: three type-a (pyramidal) neurons from lamina IV and V, two lamina IV type-e (giant) cells, one lamina V type-b neuron, and a lamina IV type-a (octopus) cell (Fig. 4,A–D, respectively). The giant cell had dendrites with very short, thick spines and no long, thin spines (Fig.4B). This giant cell also had very thick dendrites (∼3 μm diameter). All of these types are classified as spiny neurons (Carr and Maler, 1985). In response to sensory stimulation (either the frequency of a sinusoidal signal or beat rate was varied from 2 to 30 Hz), all neurons in this group showed low-pass characteristics (filled symbols, Fig. 4). The frequency-dependent falloff to sensory stimulation, however, was always greater than the falloff measured from injection of sinusoidal current (difference X = 4.94 dB, s = 3.61 dB;n = 10). The passive electrical properties of these neurons thus seem to account only partially for their temporal selectivity to sensory stimuli.
Fig. 4.

Morphology and physiology of spiny neuron types. Graphs on the left show relative amplitude of voltage responses to sinusoidal current injected at the soma (open circles) and of PSPs in response to electrosensory stimulation(filled squares). The sensory stimulus was either a frequency-modulated sine wave (2–30 Hz) or a signal in which the beat rate was varied from 2 to 30 Hz. The anatomy of each of these neurons is shown at the right. A, Lamina IV pyramidal neuron. Inset shows data from two other pyramidal neurons in laminae IV and V. B, Lamina IV, type-e neuron (giant). This neuron had many short, thick spines. The inset shows data from another giant neuron (voltage response to sensory stimulation not shown). C, Lamina V, type-b neuron. D, Lamina IV, octopus neuron.
For neurons of the second group (Fig. 5), the amplitude of voltage fluctuations in response to sinusoidal current injection declined <2.0 dB (X = 1.16 dB, s = 0.61; n = 5) over the range of 2–30 Hz. This frequency-dependent attenuation was significantly less than that measured for the former group (p < 0.01, approximate t test). The mean resting potential and input resistance of these neurons were −51 mV (s = 9;n = 5) and 117 MΩ (s = 26;n = 5), respectively. These values were not significantly different (approximate t test,p = 0.01) from the values obtained from neurons of the former group. This group consisted of two type-c neurons of lamina V, two type-b neurons of lamina III, and a single type-a neuron of lamina II. All three cell types are classified from Golgi studies (Carr and Maler, 1985) as aspiny neurons. In response to sensory stimuli, one neuron showed low-pass characteristics, another was band-pass, and the rest were high- or all-pass.
Fig. 5.

Morphology and physiology of aspiny neuron types. Graphs on the left show relative amplitude of voltage responses to sinusoidal current injected at the soma (open circles) and to sensory stimulation (filled squares), as in Figure 4. The anatomy of each of these neurons is shown at theright. A, Lamina V, type-c neuron. This neuron had a low-pass response to the sensory stimulus. Inset shows another lamina V type-c neuron; this one has a high-pass response to the sensory stimulus. B, Lamina III, type-b neuron. This neuron had a high-pass response to the sensory stimulus.Inset shows data from two more examples of this type of neuron. One of these neurons had a band-pass response to sensory stimulation. Voltage responses to sensory stimulation were not available for the other neuron. C, Lamina II, type-a neuron. This neuron was an all-pass filter for both current injection and sensory stimuli.
The neurons presented thus far showed PSPs that increased in amplitude when the holding potential of the neuron was made more negative, that is, there was little evidence of active (voltage-dependent) conductances beyond that associated with spike generation. In the following section, we will present evidence that some neurons in this region of the brain possess active conductances that can enhance the temporal selectivities of these cells.
Neurons with active (voltage-dependent) conductances
Eight neurons were recorded that showed active conductances beyond those associated with spike generation, that is, hyperpolarization of these neurons by injection of a constant negative current resulted in a decrease in the amplitude of stimulus-related EPSPs. An example of this phenomenon is shown in Figure 6A. At normal resting potential (−70 mV), this neuron produced EPSPs of ∼15 mV in response to sensory stimulation. These EPSPs were bimodal at low frequencies, and the second peak generally failed to give rise to a spike. The latter observation suggests that spikes contributed little to the overall amplitude of these PSPs. The duration of these PSPs decreased in concert with the period of the stimulus. Current-clamping this neuron at −0.2 nA resulted in a marked decrease in the size of PSPs. When this current clamp was increased further to −0.4 nA, PSP size increased, in accordance with the increased driving force imposed, but failed to reach amplitudes seen near resting potential.
Fig. 6.
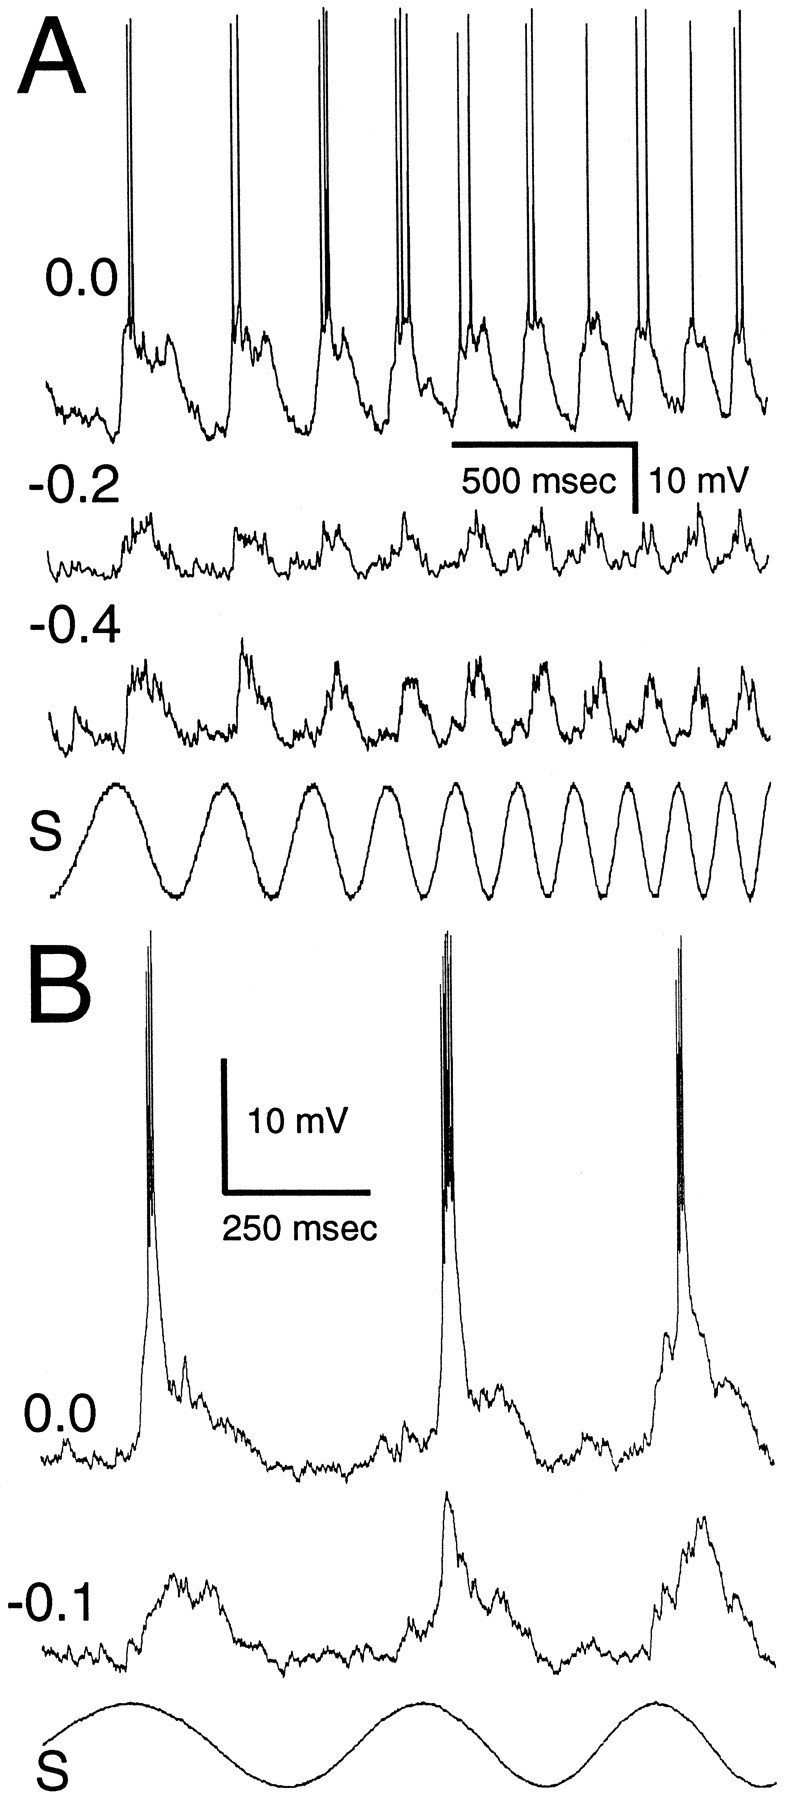
Recordings from neurons with evidence of voltage-dependent conductances other than those associated with spike generation. A, Neuron with a “variable-duration” voltage-dependent conductance. Shown are three time-aligned intracellular traces at different holding currents (in nanoamps) and the stimulus (S). At 0.0 nA holding current, the active conductance is present and matches the duration of the stimulus. The active conductance is not present at −0.2 and −0.4 nA holding current. B, Neuron with a “constant-duration” voltage-dependent conductance. At 0.0 nA holding current, the voltage-dependent conductance is present but has a duration that is relatively constant across stimulation frequencies. The voltage-dependent conductance largely is removed by −0.1 nA holding current.
A second type of active conductance is shown in Figure6B. For this neuron sensory stimulation at rest (membrane potential = −55 mV) elicited a depolarization of ∼15 mV that gave rise to a burst of spikes. Unlike the neuron shown in Figure 6A, the time course of this depolarization was short (∼18 msec in duration at half-maximal amplitude) and could be seen riding on top of a depolarization that followed the time course of the stimulus. Current-clamping this neuron at −0.1 nA almost completely eliminated this large, short-duration component; a small active component, not giving rise to spikes, can be seen on the second stimulus cycle. Figure 7 shows further evidence that these large depolarizations do not result simply from active conductances responsible for spike generation. These recordings were made from another neuron while using holding currents of −0.4 and −0.8 nA. At −0.4 nA the sensory stimulus elicited large PSPs that on occasion failed to give rise to spikes (third cycle) or continued to increase in amplitude after generating a single spike (first cycle). With a holding current of −0.8 nA, the active component could be seen for approximately one-half of the stimulus cycles; the remaining stimulus cycles elicited PSPs similar to those observed for neurons without active conductances.
Fig. 7.

Neuron with a constant-duration voltage-dependent PSP. At −0.4 nA holding current the depolarization from this voltage-dependent conductance appears in each stimulus cycle. In the third cycle the voltage-dependent component is present, but no spikes were generated. At −0.8 nA holding current the voltage-dependent component is present in one-half of the cycles; other cycles reveal the underlying stimulus-related PSP. Additional recordings of this neuron are shown in Figure 9B.
Thus two general classes of active conductances can be distinguished, one in which the duration of the resultant depolarization decreases as the stimulus frequency is increased (Fig. 6A) and the other in which the duration of the depolarization stays nearly constant (Figs. 6B, 7). Figure 8 shows this relation for the eight neurons that exhibited active conductances. Both types of active conductances also could be elicited by sinusoidal current injection into the soma. There were no specific morphological features that distinguished neurons with active conductances from those without these conductances. In the next section we show that these two classes of active conductances play different roles in shaping the temporal selectivities of toral neurons.
Fig. 8.

Duration of PSPs consisting of voltage-dependent and -independent components in relation to stimulation frequency. For each neuron with a voltage-dependent conductance, the width in milliseconds of the EPSP was measured at one-half of its maximum amplitude at several stimulation frequencies. Filled diamonds indicate neurons with variable-duration voltage-dependent conductances, and open diamonds indicate neurons with constant-duration voltage-dependent conductances.
Roles of active conductances in temporal filtering
The roles that active conductances play in shaping the temporal selectivities of neurons are displayed in Figures9 and 10. Figure 9A shows recordings from a low-pass neuron that has an active conductance of the variable duration type. In this case the contribution of the active conductance to the depolarization of the neuron can be seen at a holding current of −0.4 nA and is removed at −0.8 nA. From the difference between these two traces, it can be seen that the active conductance is responsible for augmenting the responses of this cell to the low temporal frequencies in the stimulus. This enhancement is quantified in Figure10A. Figure 10Bshows a second case wherein an active conductance of the variable duration type enhanced the low-pass temporal filtering properties of the neuron. In contrast, Figure 9B shows recordings from a neuron that had an active conductance of short and constant time course. The underlying PSPs, seen best at −0.8 nA holding current, are only slightly larger in amplitude at high temporal frequencies than at low frequencies, but the active component gives rise to a strong high-pass response (Fig. 10D). One neuron was recorded that responded best to temporal frequencies of ∼12 Hz (Fig.10C). This neuron showed an active conductance of the short, constant duration type that amplified the selectivity of this neuron to this range of temporal frequencies. For the remaining neurons that exhibited active conductances, we were unable to eliminate completely the contribution of these conductances to their responses to sensory stimulation. These data, therefore, are not presented in Figure 10. Nevertheless, these recordings support the general conclusion reached from this figure, namely that the dynamics of active conductances function to augment the underlying temporal selectivities of toral neurons.
Fig. 9.

Recordings from neurons with voltage-dependent conductances. A, Neuron with a variable-duration voltage-dependent conductance that enhances the low-pass filtering. B, Neuron with a constant-duration voltage-dependent conductance that enhances the high-pass filtering.
Fig. 10.
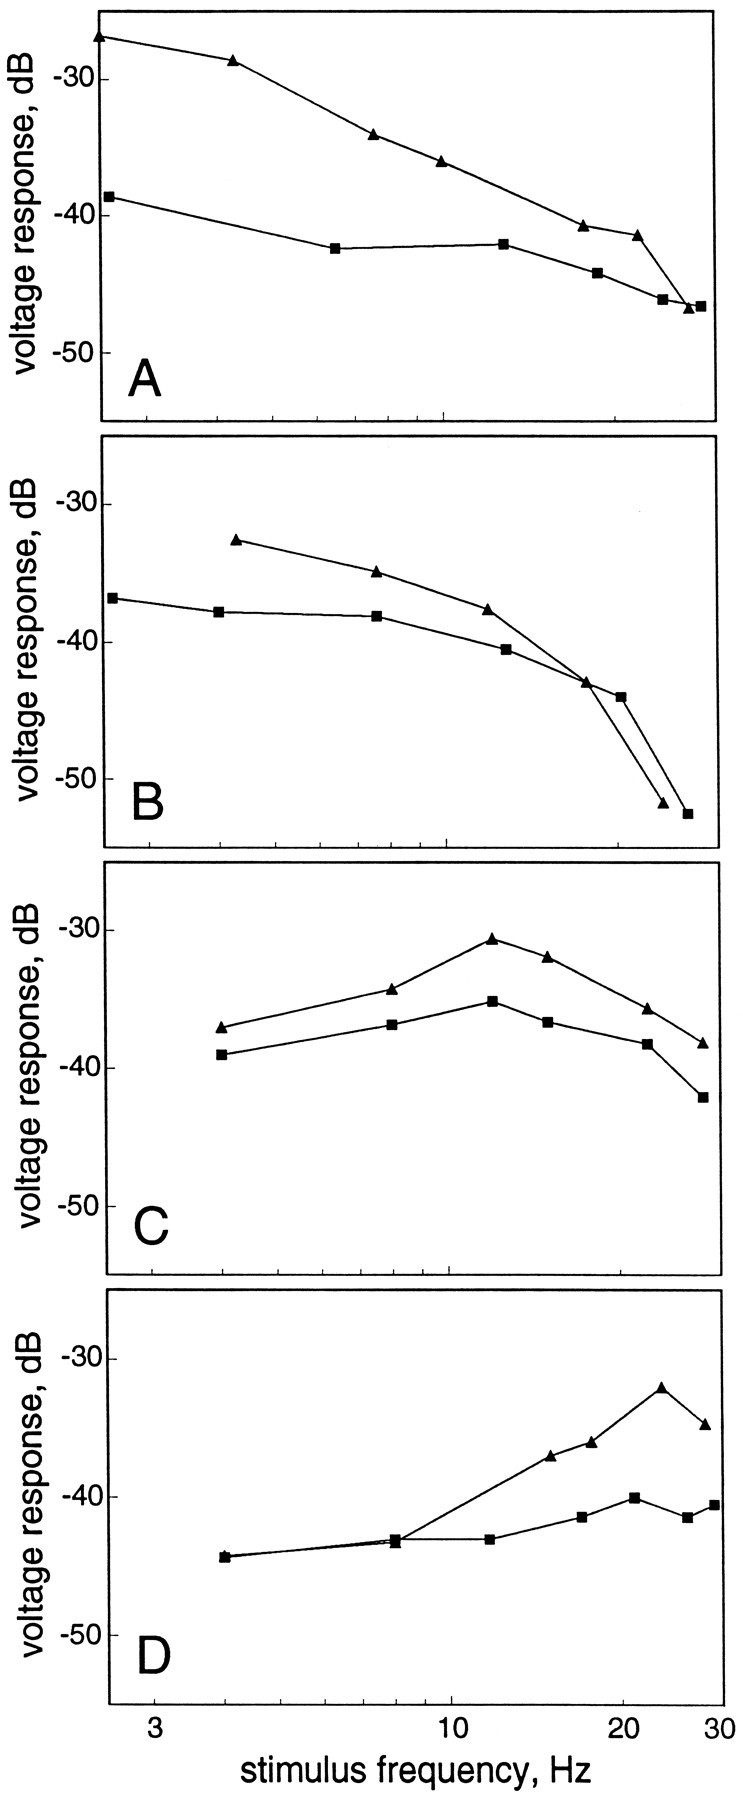
Roles of voltage-dependent conductances in temporal processing. Graphs show relative amplitude of voltage responses to sensory stimulation at holding currents in which the active conductance was present (triangles) and at levels of holding current in which the active conductance was eliminated(squares). A and B are data from neurons with variable-duration active conductances; in these two cases the low-pass characteristics of each neuron were enhanced.C and D are data from neurons with constant-duration active conductances.C, The active conductance enhanced the underlying band-pass filtering of this neuron. D, The active conductance enhanced the high-pass characteristics of this neuron.
DISCUSSION
Primary electrosensory afferents in Eigenmannia code the temporal structure of low-frequency sinusoids (ampullary electroreceptors) or amplitude modulations (tuberous receptors) in the periodicity of the modulation of their spike rates; mean spike rate is rather independent of the frequency of sinusoidal signals or amplitude modulation (AM) rates to at least 40 Hz (see Zakon, 1986). Most neurons in the torus, however, show strongest responses to low-frequency sinusoids or AM rates of 3–8 Hz. A primary goal of this study was to elucidate the mechanisms that underlie this transformation. The hypotheseses that passive electrical filtering and active conductances contribute to this filtering were tested.
The voltage responses of neurons to sinusoidal current injection were correlated to anatomical features: neurons with all-pass frequency–response functions had small dendritic arborizations with few or no spines, whereas those neurons with low-pass frequency response functions had large dendritic arborizations with many spines. Each neuron that had low-pass responses to sinusoidal current injection also had low-pass responses to electrosensory stimuli. On average, the frequency-dependent decline in PSP amplitude in response to sensory stimuli was ∼5 dB greater than the falloff of voltage responses to sinusoidal current injection. With one exception, neurons with all-pass responses to sinusoidal current injection responded to sensory stimulation in an all-pass or high-pass fashion. Eight neurons had voltage-dependent conductances in addition to those associated with spike production. Hyperpolarization by current injection could eliminate these conductances, revealing an underlying stimulus-related PSP that was similar to those seen in neurons without active conductances. The time courses of these conductances are correlated with the underlying passive filtering properties of the neurons and augment their temporal selectivities.
Such transformations of temporal codes are used in other sensory systems and are necessary for many behaviors in perhaps all animal species (Rose, 1986). For example, in humans, hearing perception requires low-pass filtering of amplitude modulations within each frequency band (Zwicker and Feldtkeller, 1967; von Helmholtz, 1868); this filtering occurs in the CNS (see Wilson, 1992). Also, in visual cortex of macaque monkeys, neurons show low- and band-pass temporal filtering for moving sine wave gratings (Foster et al., 1985). As a final example, the vestibulo-ocular response found in many vertebrates requires amplification of temporal information at the highest frequencies within the range 0.1–10 Hz (Keller, 1978). The range of frequencies of temporal codes that are transformed in each of these systems overlaps or is identical to the range that is transformed in the torus of Eigenmannia, and thus it is possible that these systems use similar mechanisms for temporal filtering.
Biophysical properties
The biophysical properties of the membrane, that is, the membrane resistivity and capacitance, influence the temporal filtering characteristics of a neuron. Typically, the biophysical properties of whole neurons are assessed by measuring the voltage response to injection of current pulses at the soma. These data are used to estimate the input resistance and time constant or constants of the neuron. Using this method, we did not find differences among the input resistances of the various neuron types. Despite this, the frequency–response functions for sinusoidal current injection were correlated to the anatomy of the neurons. These data imply that the specific membrane resistivity of the smaller, less spiny neurons may be lower.
The mean input resistance of the neurons recorded in this study was 140 MΩ (range 70–170 MΩ). These values are similar to input resistances measured by using similar whole-cell patch recording techniques for visual cortex neurons (50–200 MΩ; Ferster and Jagadeesh, 1992). With the use of sharp electrodes, however, input resistances measured for CNS neurons are typically ∼50–70 MΩ (de la Peña and Geijo-Barrientos, 1996). In some cases, much higher input resistances are measured with the whole-cell patch method (i.e., >500 MΩ; Hestrin and Armstrong, 1996). Staley et al. (1992), using conventional sharp electrode and whole-cell patch methods in the same slice preparation, found that measured input resistances were three times greater in whole-cell than sharp electrode recordings. It is probable, therefore, that the input resistances of CNS neurons often are underestimated in recordings with sharp electrodes, presumably because of current shunting. Input resistances often may be overestimated in whole-cell patch recordings because of large access resistances. Clearly, the influence of the recording technique and the type of electrode on the measurements of input resistances requires further study.
Discrepancy between biophysical properties and sensory physiology
The frequency response of toral neurons, as measured by injection of current into the soma, was insufficient for fully understanding their temporal filtering properties for sensory stimuli. For large, spiny neurons the magnitude of passive electrical filtering, as measured by sinusoidal current injection, was not predictive of the magnitude of electrosensory filtering. In all cases, neurons showed stronger low-pass filtering for sensory input than for current injection. This may be attributable, in part, to the differences in the locations of the current source. The currents elicited by sensory stimulation were generated by conductances distributed on the dendritic arborization, whereas current injection through the electrode occurred directly at the soma. The differences also could arise from the types and distribution of afferents to the neuron. For instance, the afferents may have low-pass filtering properties that are enhanced further by the passive biophysical filtering of the neuron. Indeed, some tuberous afferents from the centromedial map of the ELL have low-pass filtering characteristics (Shumway, 1989). Alternatively, descending inputs or local networks indirectly could modulate the activity of toral neurons, providing the substrate for adaptation. Adaptation could, therefore, contribute to low-pass temporal filtering. Such descending networks exist, but these seem to control overall spike rate and not temporal filtering (Bastian, 1986).
Neurons with flat frequency response characteristics to current injection showed low-, band-, or high-pass filtering to electrosensory stimuli. The capability of small neurons to follow high temporal frequencies is likely a consequence of the smaller dendritic arborization and paucity of spines. The factors that determine the wide variety of responses to sensory stimulation seen in these neurons are still unclear; however, adaptation is a likely candidate.
Role of active conductances in temporal filtering
How do active conductances contribute to the sensory filtering properties of neurons? In Calliphora, Haag and Borst (1996) identified neurons with a fast inward sodium current that responded better to rapid temporal frequencies of sensory stimulation than neurons without the current. This voltage-dependent sodium current was shown to overcome the passive low-pass properties of the neuron. Similarly, active conductances seem to increase gain at high frequency stimulation in the medial vestibular nucleus of the chick (Gallus domesticus; du Lac and Lisberger, 1995). When neurons were hyperpolarized below their firing threshold and sinusoidal current was injected, the neurons showed low-pass filtering properties. However, in the absence of hyperpolarizing current, the neurons showed broad-band or slightly high-pass frequency response. This transformation is mediated by active membrane conductances. These voltage-dependent conductances therefore seem to increase gain at high frequency stimulation to overcome the passive low-pass filtering membrane characteristics of the neuron (du Lac and Lisberger, 1995).
Our results in Eigenmannia suggest a different role for active conductances. Rather than mediating a transformation from temporal low-pass to high-pass, the active conductances of toral neurons seem to amplify their underlying temporal selectivities. When hyperpolarized to eliminate the active conductance, neurons showed filtering of sensory information similar to that seen for neurons without active conductances. For neurons with variable duration PSPs, the active conductance enhanced the low-pass filtering characteristics (e.g., Fig. 8). For neurons with constant-duration PSPs, the active conductance enhanced the underlying high- or band-pass temporal selectivity (Fig. 10).
These transformations, mediated by voltage-dependent “active” conductances, may play a role in the dynamic regulation of the filtering properties of a neuron. Natural manipulation of the resting potential around the activation voltage of the active conductance may allow a neuron to alter dramatically its filtering properties. Another role of such active conductances may be to increase the reliability of eliciting action potentials. This could be particularly important in the detection and discrimination of courtship signals (Metzner and Heiligenberg, 1991). During courtship and some agonistic behaviorsEigenmannia produce “chirps,” which are short (10s of milliseconds) interruptions of the EOD (Hagedorn and Heiligenberg, 1985) (our personal observations). These interruptions briefly stimulate both the tuberous and ampullary systems. Preliminary evidence demonstrates that at least some tuberous and ampullary neurons with active conductances respond strongly to interruptions of the S1. Active conductances may be a general mechanism for encoding occasionally occurring brief stimuli.
Footnotes
This work was supported by National Science Foundation Grants IBN-9421039, IBN-91156789, and National Institutes of Health Fellowship 1-F32 NS 09779-01. We thank Candace Hisatake for histological assistance and presentation of anatomical data.
Correspondence should be addressed to Dr. Eric S. Fortune, Department of Biology, University of Utah, 201 South Biology Building, Salt Lake City, UT 84112.
REFERENCES
- 1.Bastian J. Gain control in the electrosensory system mediated by descending inputs to the electrosensory lateral line lobe. J Neurosci. 1986;6:553–562. doi: 10.1523/JNEUROSCI.06-02-00553.1986. [DOI] [PMC free article] [PubMed] [Google Scholar]
- 2.Bastian J, Yuthas J. The jamming avoidance response of Eigenmannia: properties of a diencephalic link between sensory processing and motor output. J Comp Physiol [A] 1984;154:895–908. [Google Scholar]
- 3.Bullock TH, Hamstra RH, Scheich H. The jamming avoidance response of high frequency electric fish. I. General features. J Comp Physiol [A] 1972;77:1–22. [Google Scholar]
- 4.Carr CE, Maler L. A Golgi study of the cell types of the dorsal torus semicircularis of the electric fish Eigenmannia: functional and morphological diversity in the midbrain. J Comp Neurol. 1985;235:207–240. doi: 10.1002/cne.902350206. [DOI] [PubMed] [Google Scholar]
- 5.de la Peña E, Geijo-Barrientos E. Laminar localization, morphology, and physiological properties of pyramidal neurons that have the low-threshold calcium current in the guinea pig medial frontal cortex. J Neurosci. 1996;16:5301–5311. doi: 10.1523/JNEUROSCI.16-17-05301.1996. [DOI] [PMC free article] [PubMed] [Google Scholar]
- 6.du Lac S, Lisberger SG. Cellular processing of temporal information in medial vestibular neurons. J Neurosci. 1995;15:8000–8010. doi: 10.1523/JNEUROSCI.15-12-08000.1995. [DOI] [PMC free article] [PubMed] [Google Scholar]
- 7.Ferster D, Jagadeesh B. EPSP–IPSP interactions in cat visual cortex studied with in vivo whole-cell patch recording. J Neurosci. 1992;12:1262–1274. doi: 10.1523/JNEUROSCI.12-04-01262.1992. [DOI] [PMC free article] [PubMed] [Google Scholar]
- 8.Fortune ES, Rose GJ (1997) Temporal filtering properties of ampullary electrosensory neurons in the torus semicircularis ofEigenmannia: evolutionary and computational implications. Brain Behav Evol, in press. [DOI] [PubMed]
- 9.Foster KH, Gaska JP, Nagler M, Pollen DA. Spatial and temporal frequency selectivity of neurones in visual cortical area V1 and V2 of the macaque monkey. J Physiol (Lond) 1985;365:331–363. doi: 10.1113/jphysiol.1985.sp015776. [DOI] [PMC free article] [PubMed] [Google Scholar]
- 10.Haag J, Borst A. Amplification of high-frequency synaptic inputs by active dendritic membrane processes. Nature. 1996;379:639–641. [Google Scholar]
- 11.Hagedorn M, Heiligenberg W. Court and spark: electric signals in the courtship and mating of gymnotid fish. Anim Behav. 1985;33:254–265. [Google Scholar]
- 12.Heiligenberg W. Neural nets in electric fish. MIT; Cambridge: 1991. [Google Scholar]
- 13.Heiligenberg W, Rose GJ. Phase and amplitude computations in the midbrain of an electric fish: intracellular studies of neurons participating in the jamming avoidance response of Eigenmannia. J Neurosci. 1985;5:515–531. doi: 10.1523/JNEUROSCI.05-02-00515.1985. [DOI] [PMC free article] [PubMed] [Google Scholar]
- 14.Heiligenberg W, Baker C, Matsubara J. The jamming avoidance response in Eigenmannia revisited: the structure of a neural democracy. J Comp Physiol [A] 1978;127:267–286. [Google Scholar]
- 15.Hestrin S, Armstrong WE. Morphology and physiology of cortical neurons in layer I. J Neurosci. 1996;16:5290–5300. doi: 10.1523/JNEUROSCI.16-17-05290.1996. [DOI] [PMC free article] [PubMed] [Google Scholar]
- 16.Keller EL. Gain of the vestibulo-ocular reflex in monkey at high rotational frequencies. Vision Res. 1978;18:311–315. doi: 10.1016/0042-6989(78)90165-7. [DOI] [PubMed] [Google Scholar]
- 17.Matsubara J, Heiligenberg W. How well do electric fish electrolocate under jamming? J Comp Physiol [A] 1978;149:339–351. [Google Scholar]
- 18.Metzner W, Heiligenberg W. The coding of signals in the electric communication of the gymnotiform fish Eigenmannia: from electroreceptors to neurons in the torus semicircularis of the midbrain. J Comp Physiol [A] 1991;169:135–150. doi: 10.1007/BF00215861. [DOI] [PubMed] [Google Scholar]
- 19.Partridge BL, Heiligenberg W, Matsubara J. The neural basis for a sensory filter in the jamming avoidance response: no grandmother cells in sight. J Comp Physiol [A] 1981;145:153–168. [Google Scholar]
- 20.Rose GJ. A temporal-processing mechanism for all species? Brain Behav Evol. 1986;28:134–144. doi: 10.1159/000118698. [DOI] [PubMed] [Google Scholar]
- 21.Rose GJ, Call SJ. Temporal filtering properties of neurons in the midbrain of an electric fish: implications for the function of dendritic spines. J Neurosci. 1993;13:1178–1189. doi: 10.1523/JNEUROSCI.13-03-01178.1993. [DOI] [PMC free article] [PubMed] [Google Scholar]
- 22.Rose GJ, Fortune ES. New techniques for making whole-cell recordings from CNS neurons in vivo. Neurosci Res. 1996;26:89–94. doi: 10.1016/0168-0102(96)01074-7. [DOI] [PubMed] [Google Scholar]
- 23.Shumway C. Multiple electrosensory maps in the medulla of weakly electric gymnotiform fish. I. Physiological differences. J Neurosci. 1989;9:4388–4399. doi: 10.1523/JNEUROSCI.09-12-04388.1989. [DOI] [PMC free article] [PubMed] [Google Scholar]
- 24.Staley KJ, Otis TS, Mody I. Membrane properties of dentate gyrus cells: comparison of sharp microelectrode and whole-cell recordings. J Neurophysiol. 1992;67:1346–1358. doi: 10.1152/jn.1992.67.5.1346. [DOI] [PubMed] [Google Scholar]
- 25.von Helmholtz H. Theorie physiologique de la musique fondee sue l’etude des sensations auditves, 1st Ed (Gueroult G, translator). Masson; Paris: 1868. [Google Scholar]
- 26.Wilson BS. Cochlear mechanics. In: Cazals Y, Demany L, Horner K, editors. Auditory physiology and perception. Pergamon; New York: 1992. pp. 71–84. [Google Scholar]
- 27.Zakon HH. The electroreceptive periphery. In: Bullock TH, Heiligenberg W, editors. Electroreception. Wiley; New York: 1986. pp. 103–156. [Google Scholar]
- 28.Zwicker E, Feldtkeller R. Das ohr als Nachrichtenempfanger. Hirzel; Stuttgart, Germany: 1967. [Google Scholar]