

Abstract
The physiological and molecular features of nonpyramidal cells were investigated in acute slices of sensory-motor cortex using whole-cell recordings combined with single-cell RT-PCR to detect simultaneously the mRNAs of three calcium binding proteins (calbindin D28k, parvalbumin, and calretinin) and four neuropeptides (neuropeptide Y, vasoactive intestinal polypeptide, somatostatin, and cholecystokinin). In the 97 neurons analyzed, all expressed mRNAs of at least one calcium binding protein, and the majority (n = 73) contained mRNAs of at least one neuropeptide. Three groups of nonpyramidal cells were defined according to their firing pattern. (1) Fast spiking cells (n = 34) displayed tonic discharges of fast action potentials with no accommodation. They expressed parvalbumin (n = 30) and/or calbindin (n = 19) mRNAs, and half of them also contained transcripts of at least one of the four neuropeptides. (2) Regular spiking nonpyramidal cells (n = 48) displayed a firing behavior characterized by a marked accommodation and presented a large diversity of expression patterns of the seven biochemical markers. (3) Finally, a small population of vertically oriented bipolar cells, termed irregular spiking cells (n = 15), fired bursts of action potentials at an irregular frequency. They consistently co-expressed calretinin and vasoactive intestinal polypeptide. Additional investigations of these cells showed that they also co-expressed glutamic acid decarboxylase and choline acetyl transferase. Our results indicate that neocortical nonpyramidal neurons display a large diversity in their firing properties and biochemical patterns of co-expression and that both characteristics could be correlated to define discrete subpopulations.
Keywords: interneurons, neocortex, calbindin D28k, parvalbumin, calretinin, neuropeptide Y, vasoactive intestinal polypeptide, somatostatin, cholecystokinin, glutamic acid decarboxylase, choline acetyl transferase, single-cell RT-PCR, bipolar cell, fast spiking cell
Neurons of the mammalian neocortex are classified as pyramidal cells or nonpyramidal cells according to their morphology. Pyramidal cells accumulate glutamate (Baughman and Gilbert, 1981) and are the main excitatory cortical neurons. Most of them discharge action potentials with a marked frequency accommodation and are termed regular spiking (RS) (for review, see Connors and Gutnick, 1990). On the other hand, most nonpyramidal cells express glutamic acid decarboxylase (GAD) and are believed to be inhibitory interneurons (Houser et al., 1983). On the basis of initial studies, nonpyramidal cells were called fast spiking (FS) cells, because they showed a high discharge frequency without accommodation (McCormick et al., 1985; for review, see Connors and Gutnick, 1990). Recent studies, however, have revealed that nonpyramidal cells display a great diversity of intrinsic firing properties and can show frequency accommodation (Kawaguchi and Kubota, 1993, 1996; Kawaguchi, 1995).
Two histochemical classifications of nonpyramidal cells have been based on the existence of nonpyramidal cell biochemical markers. The differential expression of three calcium binding proteins (CaBPs) [calbindin D28k (CB), parvalbumin (PV), and calretinin (CR)] defines three groups of nonpyramidal cells with partial overlaps (Celio, 1986,1990; Hendry et al., 1989; Jacobowitz and Winsky, 1991; Van Brederode et al., 1991; Baimbridge et al., 1992; Rogers, 1992; Kubota et al., 1994). Similarly, the expression of four neuropeptides [neuropeptide Y (NPY), vasoactive intestinal polypeptide (VIP), somatostatin (SS), and cholecystokinin (CCK)] also defines partially overlapping groups (Hendry et al., 1984; Morrison et al., 1984; Somogyi et al., 1984;Demeulemeester et al., 1988; Rogers, 1992; Kubota et al., 1994). The difficulty of performing multiple immunostaining, however, makes it difficult to evaluate the extent of the overlap between groups in each classification and to match precisely the two classifications.
Correlations have been established between the firing properties and the expression of some of the above markers by combining whole-cell patch-clamp recordings of nonpyramidal cells with intracellular labeling and immunochemistry (Kawaguchi and Kubota, 1993, 1996;Kawaguchi, 1995). Here we investigated this question by combining electrophysiological whole-cell recordings in acute slices of rat sensory-motor cortex with the simultaneous detection by single-cell reverse transcription (RT)-PCR (Lambolez et al., 1992) of the mRNA encoding the seven markers. This technique offered the possibility of detecting any combination of these markers co-expressed in the same cell. Our results show that cortical nonpyramidal neurons differ largely in their firing properties and in their biochemical patterns of co-expression but also that discrete subpopulations could be defined by the correlation of both characteristics.
MATERIALS AND METHODS
Slice preparation. Young Wistar rats (16–22 postnatal days old) were deeply anesthetized with ketamine (65 mg/kg) and xylazin (14 mg/kg) and then decapitated. Parasagittal sections (300 μm thick) of cerebral frontal cortex or cerebellum were prepared as described (Lambolez et al., 1996).
Whole-cell recordings. For recordings, slices were transferred in a chamber perfused at 1–2 ml/min with artificial cerebrospinal fluid containing (in mm): 121 NaCl, 2.5 KCl, 1.25 NaH2PO4, 2 CaCl2, 1 MgCl2, 26 NaHCO3, 20 glucose, and 5 pyruvate, bubbled with a mixture of 95% O2/5% CO2. Patch pipettes (3–5 MΩ) pulled from borosilicate glass were filled with 8 μl of autoclaved RT-PCR internal solution containing (in mm): 144 potassium gluconate, 3 MgCl2, 0.2 EGTA, 10 HEPES, pH 7.2 (285/295 mOsm). Whole-cell recordings were made from neocortical cells identified using infrared videomicroscopy with Nomarsky optics (Stuart et al., 1993). Whole-cell recordings in current-clamp and voltage-clamp modes were performed at room temperature (20–25°C) using patch-clamp amplifier (Axopatch 200A, Axon Instruments, Foster City, CA). Resting membrane potential was measured just after passing in whole-cell configuration, and only cells with a resting membrane potential more hyperpolarized than −50 mV were analyzed. All membrane potentials were corrected for junction potential (−11 mV). The membrane potential was then usually adjusted to −71 mV by continuous current injection. Action potential discharges were recorded using the I-clamp fast mode of the amplifier. Digitized data were analyzed using Acquis1 software (Gerard Sadoc, Centre National de la Recherche Scientifique, Gif-sur-Yvette, France).
Cytoplasm harvest and RT. At the end of the recording, the content of the cell (including the nucleus in some instances) was aspirated in the recording pipette under visual control by application of a gentle negative pressure in the pipette. Harvesting was interrupted as soon as the seal was lost. The contents of the pipette was then expelled into a test tube, and RT was performed in a final volume of 10 μl as described (Lambolez et al., 1992).
Multiplex PCR. The two steps of multiplex PCR were performed essentially as described (Ruano et al., 1995) using the following set of primers (from 5′ to 3′, position 1 being the first base of the initiation codon):
CB (accession number M27839): sense, AGGCACGAAAGAAGGCTGGAT (position 134); antisense, TCCCACACATTTTGATTCCCTG (544)
PV (accession number M12725): sense, AAGAGTGCGGATGATGTGAAGA (115); antisense, ATTGTTTCTCCAGCATTTTCCAG (480)
CR (accession number X66974): sense, CTGGAGAAGGCAAGGAAAGGT (142); antisense, AGGTTCATCATAGGGACGGTTG (429)
NPY (accession number M15880): sense, GCCCAGAGCAGAGCACCC (−45); antisense, CAAGTTTCATTTCCCATCACCA (292)
VIP (accession number X02341): sense, TGCCTTAGCGGAGAATGACA (167); antisense, CCTCACTGCTCCTCTTCCCA (434)
SS (accession number K02248): sense, ATCGTCCTGGCTTTGGGC (43); antisense, GCCTCATCTCGTCCTGCTCA (231)
CCK (accession number K01259): sense, CGCACTGCTAGCCCGATACA (174); antisense, TTTCTCATTCCGCCTCCTCC (373)
The resulting cDNA of CB, PV, CR, NPY, VIP, SS, and CCK contained in the 10 μl RT reaction was first amplified simultaneously.Taq polymerase (2.5 U) (Perkin-Elmer-Cetus, Emeryville, CA) and 10 pmol of each of the fourteen primers were added in the buffer supplied by the manufacturer (final volume 100 μl), and 20 cycles (94°C, 30 sec; 56°C, 30 sec; 72°C, 35 sec) of PCR were run. The products of the first amplification were then purified using GlassMAX spin cartridges (BRL, Bethesda, MD). Second rounds of PCR were then performed using 1 μl of the purified first PCR product as template. In this second round, each marker was amplified individually using its specific primer pair by performing 35 PCR cycles (as described above). Ten microliters of each individual PCR reaction were then run on 1.5% agarose gel stained with ethidium bromide, using Φx174 digested byHaeIII as molecular weight marker [with bands of 1353, 1078, 872, 603, 310, 281, 271, 234, 194, 118, and 72 base pair (bp)]. The predicted sizes of the PCR products were (in bp) 432 (CB), 388 (PV), 309 (CR), 359 (NPY), 287 (VIP), 209 (SS), and 216 (CCK). Genomic DNA amplifications, which sometimes occurred when the nucleus was harvested, could be easily differentiated from cDNA amplification by a size criterion. Indeed, for each primer pair, the sense and antisense primers were positioned on two different exons. For CB, PV, and CR in which the genomic sequence was not known, 40 cycles of PCR were performed using 100 ng of rat genomic DNA as template and a single specific primer pair. In all cases, the size of the genomic DNA amplification product was larger than that obtained from cDNA (not shown).
Another RT-multiplex PCR (mPCR) was designed to analyze irregular spiking (IS) cells by probing for the expression of CR, VIP, choline acetyl transferase (ChAT), and GAD 65 and 67. As described above, the procedure included an RT step followed by two rounds of PCR amplification. The set of primers used for the detection of CR and VIP mRNAs was the same as those described above. For the detection of ChAT, GAD65, and GAD67 mRNAs, the following set of primers was used (from 5′ to 3′):
ChAT (Brice et al., 1989): sense, AAAAGGCTCCCCAAAAGATG (position 14); antisense, TTCAGCCAGTATTCAGAGACCC (position 254)
GAD65 (accession number M72422, as described in Bochet et al., 1994): sense, TCTTTTCTCCTGGTGGTGCC (position 713); antisense, CCCCAAGCAGCATCCACAT (position 1085)
GAD67 (accession number M76177): sense, TACGGGGTTCGCACAGGTC (position 713); antisense, CCCCA AGCAGCATCCACAT (position 1159)
The same antisense primer was used for the amplification of GAD65 and GAD67. The primer had one mismatch with the sequence of the GAD67, as indicated by the underlined base.
For the first round of amplification, 20 cycles (94°C, 30 sec; 60°C, 30 sec; 72°C, 35 sec) of PCR were performed on 10 μl of RT reaction, by mixing 10 pmol of the nine primers specific for CR, VIP, ChAT, GAD65, and GAD67. The resulting products were then used as template for the five second PCR rounds that individually amplified CR, VIP, ChAT, GAD65, and GAD67. These PCR products were analyzed on 1.5% agarose gel. The predicted sizes (in bp) of the PCR products were 309 (CR), 287 (VIP), 262 (ChAT), 391 (GAD65), and 600 (GAD67).
Southern blot analysis. The CB, PV, CR, NPY, VIP, SS, CCK, ChAT, GAD65, and GAD67 PCR-generated fragments obtained for each cell were transferred onto Hybond N+ (Amersham, Arlington Heights, IL) after agarose gel electrophoresis. The Southern blots were hybridized with the following specific 32P-labeled oligoprobes: CB, CAGTGGCTTCATAGAAACGGAGGA (position 342); PV, TCTCCACTCTGGTGGCCGAAAG (position 308); CR, GGCAGAGCTGGCGCAGATCC (position 255); NPY, TGGCAAGAGATCCAGCCCTGAG (position 195); VIP, GGCAAACGAATCAGCAGTAG (position 300); SS, CACCGGGAAACAGGAACTGGC (position 126); CCK, GGTCCGCAAAGCTCCCTCTG (position 204); ChAT, CATTGTGAAGCGGTTTGGGGCC (position 168); GAD65, GCCTTGGGGATCGGAACAGACAGCG (position 871, as described in Bochet et al., 1994); and GAD67, TAAAGAAGGCTGGGGCTGCG (position 1063).
RNA isolation. Total RNA was prepared from fresh neocortex of 15-d-old rats as described (Chomczynski and Sacchi, 1987).
Intracellular labeling by biocytin injection. For intracellular labeling, 2 mg/ml of biocytin (Sigma, St. Louis, MO) was added to the autoclaved RT-PCR internal solution, and the pH was readjusted to 7.2 with KOH. Whole-cell recordings were then performed as described. After the cytoplasm was harvested, the patch pipette was gently withdrawn to favor the closure of the cell membrane. The slice containing the biocytin-injected cell was then fixed overnight in 4% paraformaldehyde in PBS at 4°C and rinsed in 0.1% Triton X-100 (Sigma) in PBS for 1 hr. The fixed slices were incubated with extravidin-fluorescein isothiocyanate (FITC) (Sigma) at a dilution of 1:200 in PBS for 3 hr. The slices were then mounted in Vectashield (Vector Laboratories, Burlingame, CA), and labeled cells were reconstructed using a confocal microscope (astro 2000, Molecular Dynamics, Zeiss).
Immunocytochemical staining combined with biocytin labeling.Cells were injected with biocytin and submitted to RT-mPCR as described above. The slices containing the injected cells were then fixed overnight in 4% paraformaldehyde in PBS at 4°C, rinsed three times in PBS for 10 min, and incubated in 0.2% gelatin/0.1% Triton X-100 in PBS for 30 min. According to the RT-mPCR results, slices were incubated with rabbit antisera raised against either CR (1:2500; Swant) or PV (1:5000; Swant) in 0.2% gelatin/0.1% Triton X-100 in PBS for 2 d at 4°C. Slices were washed four times in PBS and incubated in a mixture of extravidin-FITC (1:200; Sigma) and Cy3-conjugated sheep anti-rabbit IgG (1:200; Sigma) diluted in PBS supplemented with 0.2% gelatin and 0.1% Triton X-100 for 3 hr at room temperature. The slices were then mounted and observed with a chilled CCD camera (Hamamatsu, Bridgewater, NJ) mounted on a fluorescence microscope. No staining was detected in control experiments performed in the absence of the primary antibody (not shown).
Electrophysiological analysis. The input resistanceRi was measured by applying a hyperpolarizing current pulse (amplitude −50 pA, duration 800 msec). The analysis of the waveforms of the first two spikes was performed on action potential discharges elicited by short pulses of depolarizing current (80 msec, sampling rate 62.5 kHz) in the 50–150 pA range. The amplitude of the first two action potentials (A1 and A2) was measured from the threshold to the peak of the spike. Their duration (D1 and D2) was measured at half amplitude. The amplitude reduction and the duration increase were calculated according to (A1 − A2)/A1 and (D2 − D1)/D1, respectively. The amplitude of the afterhyperpolarizations (AHPs) was measured between the spike threshold and the peak of the AHP. The accommodation parameters were measured on discharges elicited by application of 800 msec depolarizing current pulses (sampling rate 10 kHz). The instantaneous discharge frequency was determined all along the discharge and plotted as a function of time at all stimulation intensities tested. The instantaneous discharge frequencies between the first two spikes (finitial), 200 msec after the beginning of the discharge (f200) and at the end of the stimulation (ffinal) were then measured. Early and late accommodations were calculated according to (finitial −f200)/finitial and (f200 −ffinal)/finitial, respectively. To calculate the kinetics of the early accommodation, we also measured the time needed to reach 50% of the early accommodation (t1/2 early). Statistical analysis of accommodation parameters (early and late accommodation andt1/2 early) was performed on the values corresponding to only one evoked discharge obtained in a frequency range for f200 between 20 and 70 Hz. The maximal frequency (fmax) was measured at 600 msec after the beginning of the discharge elicited by a 200–350 pA current pulse.
RESULTS
RT-mPCR
The RT-mPCR was designed to detect simultaneously, at the single-cell level, the mRNAs encoding three CaBPs (CB, PV, and CR) and four neuropeptides (NPY, VIP, SS, and CCK), commonly used as molecular markers to define neocortical interneuron subtypes. In this technique two rounds of PCR amplification were performed after RT (see Materials and Methods). During the first PCR the seven makers were co-amplified by mixing their specific primer pairs. The products of the first PCR were then used as a template in seven second amplifications, each using a specific primer pair. The efficiency of this protocol was tested on total RNA purified from rat neocortex. Figure1A shows that the seven specific mRNAs were detected, each generating a PCR fragment of the size predicted by its mRNA sequence (see Fig. 1 legend). The PCR fragments were further identified in Southern blot using specific radiolabeled oligoprobes (Fig. 1A, bottom).
Fig. 1.

Sensitivity and specificity of the RT-mPCR.A, Neocortical RNA (500 pg) was subjected to the RT-mPCR protocol (see Materials and Methods). The seven PCR products were resolved in separate lanes by agarose gel electrophoresis in parallel with Φx174 digested by HaeIII (Φ) as molecular weight marker and stained with ethidium bromide (top panel). The amplified fragments had the sizes (in bp) predicted by the mRNA sequences: 432 (CB), 388 (PV), 309 (CR), 359 (NPY), 287 (VIP), 209 (SS), and 216 (CCK). Southern blot analysis of this agarose gel performed with specific radiolabeled oligoprobes is shown in the bottom panel.B, RT-mPCR applied on a single cerebellar Purkinje cell after electrophysiological recording. Agarose gel electrophoresis (top panel) showed PCR-generated fragments corresponding to CB and PV, as confirmed by Southern blot analysis using specific oligoprobes (bottom panel).
The sensitivity and specificity of the RT-mPCR were then examined at the single-cell level on cerebellar Purkinje cells known to co-express CB and PV among the seven markers (Celio, 1990; Tolosa de Talamoni et al., 1993). These cells were identified in acute parasagittal cerebellar slices by their location and their morphology. After electrophysiological recording (not shown), the content of the cell was harvested, expelled into a test tube, and submitted to the RT-mPCR procedure. Figure 1B shows the molecular analysis performed on a single Purkinje cell for which the only PCR products that were observed corresponded to CB and PV transcripts. These two mRNAs species were detected in 9 of 10 Purkinje cells analyzed, CR mRNAs were found in one of these cells, and SS transcripts were found in another one. The remaining cell contained only CB mRNAs (not shown). In a similar experiment performed on 10 glial cells from neocortical acute slices, none of the seven markers were detected in any individual cell (not shown). Additional experiments were performed to compare the expression of mRNAs and corresponding proteins at the single-cell level. Nonpyramidal cells in neocortical slices were filled with biocytin during whole-cell recordings, and their mRNAs were analyzed by RT-mPCR. The slices were then processed for the detection of the biocytin labeling and for the immunocytochemistry against one CaBP (see Materials and Methods). After this procedure, we detected the co-expression of mRNAs and corresponding proteins in three tested cells: one PV and two CR neurons. An example of such an analysis for a CR-expressing nonpyramidal cell is shown in Figure 6. Overall, the results of these control experiments showed the sensitivity and specificity of the single-cell RT-mPCR.
Fig. 6.
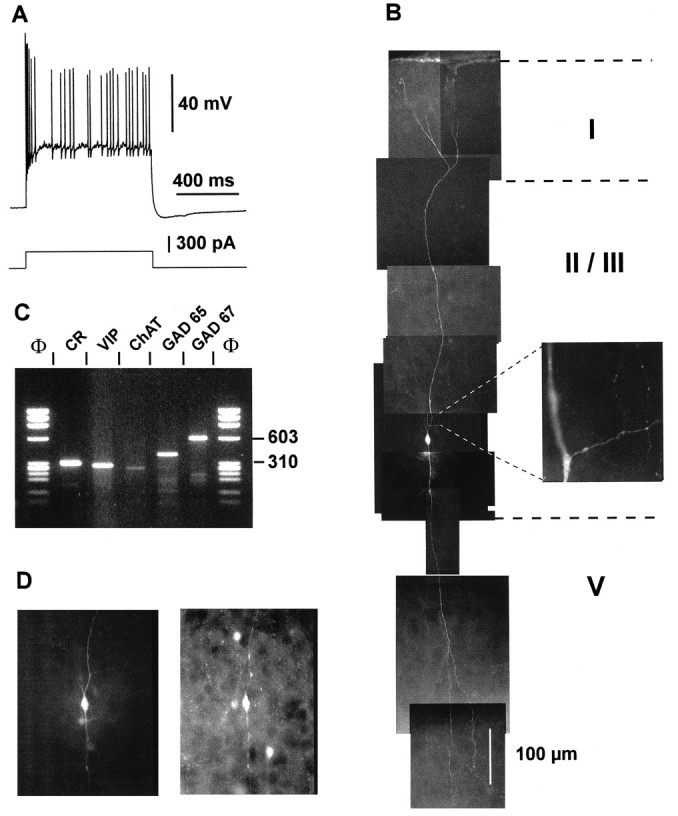
Physiological, morphological, and molecular analyses of a layer II–III IS cell. A, Current-clamp recording obtained in response to a depolarizing current pulse (300 pA). Note the initial burst followed by irregularly discharged action potentials. B, Reconstruction of the cell labeled with biocytin injection revealed a typical bipolar morphology with two narrow vertical dendritic arborizations. The ascending dendrite (top) extended up to layer I where it branched before reaching the cortical surface. The descending dendrites extended to layer V. Inset, Higher magnification of a portion of the proximal ascending dendrite showing the beginning of the axon running horizontally. Note the ascending and descending colaterals displaying varicosities. C, Agarose gel analysis of products of the RT-mPCR designed for the detection of CR, VIP, ChAT, GAD65, and GAD67 mRNAs. The five amplified fragments had the sizes (in bp) predicted by the mRNA sequences of 309 (CR), 287 (VIP), 262 (ChAT), 391 (GAD65), and 600 (GAD67).D, Comparison of the biocytin labeling of the recorded neuron (left panel) with the immunostaining of the slice with an antibody against CR (right panel). Note the immunoreactivity of the biocytin-labeled cell.
Because expression of CB, CCK, and SS has been observed in subpopulations of neocortical pyramidal cells (Burgunder and Young, 1990; Celio, 1990; Schiffmann and Vanderhaeghen, 1991; Kubota et al., 1994; Ong et al., 1994), control experiments were performed on eight pyramidal cells from layer V and on 10 pyramidal cells from layers II–III (not shown). The majority of layer V pyramidal cells (n = 5) did not express any of the seven markers, one of them contained SS, another one contained CCK, and the last one contained NPY mRNAs. Among the layer II–III pyramidal cells investigated, four did not express any markers. In the six remaining layer II–III pyramidal cells, the following expression pattern of mRNAs was observed: CB–CCK–SS (n = 1), CB–CCK (n = 3), CCK (n = 1), and SS (n = 1). These observations are in good agreement with previous immunostaining and in situ hybridization studies (Burgunder and Young, 1990; Celio, 1990; Schiffmann and Vanderhaeghen, 1991; Kubota et al., 1994; Ong et al., 1994).
Characterization of neocortical nonpyramidal cells
Nonpyramidal cells in acute slices of rat sensory-motor cortex were first identified according to their morphology as seen in infrared (IR) videomicroscopy with Nomarsky optics. Molecular analyses were applied to 97 single nonpyramidal cells after electrophysiological investigations. The specificity of PCR-generated fragments was confirmed by Southern blot analysis.
Three physiological groups of nonpyramidal cells were defined according to their action potential firing behavior. Neurons of the first group (n = 34) corresponded to the FS cells (see introductory text), which fired fast action potentials at a high constant rate. On the contrary, cells of the second group (n = 48) were unable to sustain high frequencies of repetitive discharges. This type of firing behavior corresponds to that of RS nonpyramidal (RSNP) cells, described previously by Kawaguchi (1995). Finally, neurons of the third group (n = 15) were characterized by an irregular firing pattern and were termed IS neurons.
All of the 97 cortical nonpyramidal cells analyzed in this study expressed the mRNAs of at least one of the three CaBPs. The laminar distributions of CB, PV, and CR were 68, 43, and 25%, respectively, in layers II–III, and 51, 47, and 24% in layer V. In addition, the majority (n = 73) of nonpyramidal cells expressed the transcripts of at least one of the four neuropeptides with the following laminar distributions for NPY, VIP, SS, and CCK: layer II–III, 30, 25, 48, and 13%, respectively, and layer V, 8, 8, 56, and 8%, respectively.
FS nonaccommodating cells
Among the 97 nonpyramidal cells analyzed in this study, 34 were able to fire fast action potentials at a high constant rate and were therefore identified as FS cells. The morphology of these cells as seen in IR videomicroscopy was heterogeneous, with soma diameters ranging from 10 to 30 μm in the longest axis. An example of an FS cell is presented in Figure 2. This cell was located in layer V and had a round soma 11 μm in diameter (see the center of Fig.2D and note the neighboring pyramidal cell on theleft). The action potentials of this cell had a short duration and a large AHP (Fig. 2A, bottom trace), which are general characteristics of FS cells. In this cell type, these two parameters did not change between the first two action potentials (Table 1). As seen in Figure2A, bottom trace, FS cells emitted a single action potential at the beginning of a near-threshold current pulse, followed by a silent period of variable duration and a discharge of nonaccommodating action potentials. When such near-threshold depolarization was maintained for a longer period of time, the activity of FS cells consisted of clusters of action potentials interrupted by quiescent periods characterized by subthreshold membrane potential oscillations (Fig. 2B). These oscillations as well as the action potentials were blocked by bath-application of 0.5–1.0 μm tetrodotoxin (TTX) (data not shown). At higher stimulation intensities, all FS cells exhibited a continuous repetitive discharge. The analysis of the instantaneous firing frequency showed that most of the FS cells (82%) presented a small reduction of the discharge frequency (early accommodation) that occurred during the first 200 msec (for example, see Fig. 2C, left). This early accommodation was fast and of small amplitude (Table 1, early accommodation and t1/2 early). After this early phase of accommodation, FS cells discharged at a constant rate. In a few FS cells (18%), no sign of accommodation was observed at all stimulation intensities tested (Fig. 2C, inset). The discharge frequency increased as a function of the stimulation intensity, but the accommodation profiles for a given cell were similar at all stimulation intensities (Fig. 2C). The maximal frequency (fmax), measured for high intensities of depolarizing currents (for example, see Fig.2A, top trace; for this cell,fmax was 106 Hz), ranged from 72 to 196 Hz (Table 1). In addition, FS cells had a relatively small input resistance (between 130 and 363 MΩ; see Table 1), except for two cells that presented a high input resistance (550 and 620 MΩ).
Fig. 2.

Electrophysiological and biochemical characterization of a layer V FS cell. A, Current-clamp recording during injection of depolarizing current pulses. Membrane potential was adjusted to −76 mV by continuous current injection, as indicated on the left of each recording. In response to a near-threshold current pulse (50 pA; bottom trace), this FS cell emitted a single fast action potential with a large AHP followed by a silent period and a late discharge of action potentials. Note the membrane potential oscillations during the silent period. Application of a larger depolarizing current (200 pA; top trace) induced a continuous discharge at high frequency.B, Continuous near-threshold depolarizing current (60 pA) evoked clusters of nonaccommodating discharges of fast action potentials. Note the membrane potential oscillations between these clusters. C, Left panel, Analysis of the instantaneous firing frequency during the action potentials discharges evoked in the same FS cell by current pulses of increasing intensities (50–250 pA; bottom to top traces). Note that after a fast early accommodation, discharges rapidly reached a steady-state frequency. Inset, Analysis of the instantaneous firing frequency during the action potentials discharges evoked in another FS cell by current pulses of increasing intensities (50, 100, 150, 200, and 350 pA; bottom to top traces). Note the lack of early accommodation of the discharge frequency at each stimulation intensity. D, IR videomicroscopy picture of the FS cell. The FS cell is located at the center and has a small round soma (diameter ∼10 μm). Note the large layer V pyramidal cell immediately on the left. Pial surface isupward. E, Agarose gel analysis of the RT-mPCR products of the same FS cell. The only PCR-generated fragment was that of PV.
Table 1.
Physiological properties of four groups of necortical neurons
| PYR (n = 29) | FS (n = 34) | RSNP (n = 48) | IS (n = 10)1-a | |
|---|---|---|---|---|
| fmax(Hz) | 20 ± 5 | 104 ± 25 | 42 ± 14 | n.d. |
| PYR. < RSNP < FS | ||||
| Early accommodation | 66.2 ± 7.1% | 15.3 ± 15.0% | 46.6 ± 13.6% | n.d. |
| (finitial −f200)/finitial | FS < RSNP < PYR. | |||
| Late accommodation | 7.4 ± 4.7% | 6.0 ± 5.9% | 10.1 ± 8.2% | n.d. |
| (f200 −ffinal)/finitial | n.s. | |||
| t1/2 early (msec) | 15 ± 8 | 11 ± 8 | 29 ± 17 | n.d. |
| PYR, FS. < RSNP | ||||
| First spike duration (msec) | 1.52 ± 0.29 | 0.59 ± 0.13 | 1.06 ± 0.28 | 0.95 ± 0.17 |
| FS < RSNP, IS < PYR. | ||||
| Second spike duration (msec) | 2.68 ± 0.67 | 0.61 ± 0.13 | 1.35 ± 0.85 | 1.17 ± 0.35 |
| FS < RSNP, IS < PYR. | ||||
| Spike duration increase | 75.6 ± 27.7% | 3.7 ± 5.9% | 21.4 ± 30.6% | 23 ± 25% |
| FS < RSNP, IS < PYR. | ||||
| First spike amplitude (mV) | 92 ± 9 | 83 ± 8 | 88 ± 10 | 88 ± 10 |
| n.s. | ||||
| Second spike amplitude (mV) | 61 ± 14 | 78 ± 7 | 79 ± 13 | 65 ± 13 |
| PYR., IS < FS, RSNP | ||||
| Spike amplitude reduction | 34.1 ± 10.9% | 6.4 ± 4.6% | 13.1 ± 11.1% | 26 ± 11% |
| FS < RSNP < PYR., IS | ||||
| First AHP (mV) | −1 ± 3 | −24 ± 4 | −15 ± 6 | −10 ± 5 |
| FS < RSNP, IS < PYR. | ||||
| Second AHP (mV) | −7 ± 3 | −25 ± 4 | −15 ± 5 | −13 ± 4 |
| FS < RSNP, IS < PYR. | ||||
| Input resistance (MΩ) | 245 ± 93 | 240 ± 106 | 389 ± 138 | 403 ± 122 |
| PYR., FS < RSNP, IS | ||||
| Resting potential (mV) | −72 ± 4 | −73 ± 8 | −66 ± 7 | −70 ± 7 |
| n.s. | ||||
Values given are mean ± SD. n, Number of cells; n.d., not determined; n.s., no statistically significant difference. FS, Fast spiking cells; IS, irregular spiking cells; RSNP, regular spiking nonpyramidal cells; PYR, pyramidal cells. <, Significantly smaller with p = 0.01. Statistically significant differences were determined using the Mann-Whitney U test. Physiological parameters were measured as described in Materials and Methods. finitial, Frequency at the beginning of the discharge; f200, frequency 200 msec after the beginning of the discharge; ffinal, frequency at the end of the current stimulation;fmax, instantaneous discharge frequency measured at 600 msec during high intensity current injection (>200 pA).t1/2 early, Time needed to reach 50% of the early accommodation.
Accommodation parameters andfmax could not be calculated for IS cells because of their bursting behavior. The five IS cells analyzed for the expression of CR, VIP, ChAT, GAD65, and GAD67 were not included in this table because they were recorded at 34°C.
The RT-mPCR analysis of FS cells revealed that most of them (88%) expressed PV mRNAs, as seen in Figure 2E. In addition, 44% of the FS cells were found to co-express CB together with PV transcripts. The expression of CB with no other CaBP was found in only 12% of FS cells, and CR was never detected. Fifty percent of the FS cells co-expressed at least one of the four neuropeptides studied in addition to a CaBP (see Fig. 7). SS was the most frequently expressed neuropeptide (41%). NPY was found in 20% of the FS cells, and CCK was found in only one cell. In 12% of the FS cells, SS was co-expressed together with NPY. Finally, expression of VIP was never detected (for more details, see Table 2).
Fig. 7.
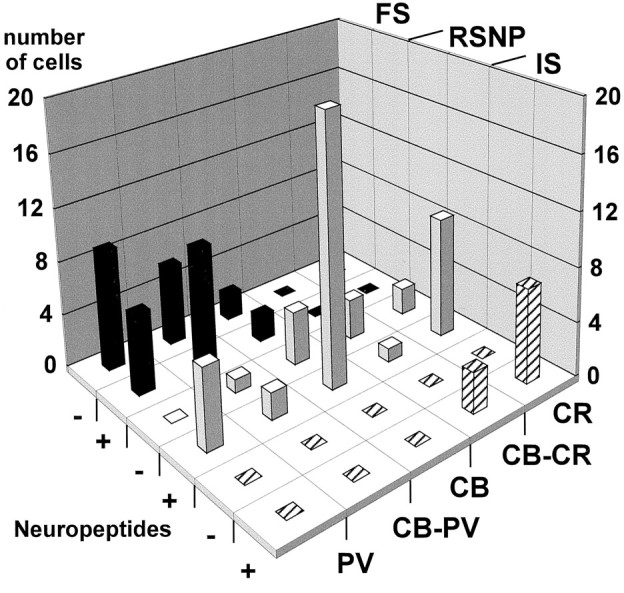
Expression patterns in different subtypes of neocortical nonpyramidal cells. This histogram shows the distribution of the cells from each physiological subtype according to their CaBP expression and the occurrence of neuropeptides. +, Expression of at least one neuropeptide; −, none of the four neuropeptides expressed. Most of the fast spiking cells (FS, black bars) expressed PV, except four cells that expressed only CB. None of them expressed CR. Approximately half of the FS cells showed neuropeptide expression. Regular spiking nonpyramidal cells (RSNP, gray bars) displayed the most heterogeneous expression patterns. All of the biochemical markers studied have been detected in this cell type. Most of them expressed at least one neuropeptide. All irregular spiking cells (IS, hatched bars) expressed CR and VIP.
Table 2.
Patterns of expression of seven biochemical markers in three groups of cortical nonpyramidal cells
| PV | CB | CR | PV–CB | CB–CR |
|---|---|---|---|---|
| FS (n = 34) | ||||
| 9 no peptide | 2 no peptide | 0 | 6 no peptide | 0 |
| 1 NPY | 1 NPY SS | 2 NPY | ||
| 4 SS | 1 SS CCK | 5 SS | ||
| 1 NPY SS | 2 NPY SS | |||
| RSNP (n = 48) | ||||
| 5 SS | 4 no peptide | 2 no peptide | 1 no peptide | 2 no peptide |
| 1 VIP | 10 SS | 3 NPY | 1 SS | 1 SS |
| 3 CCK | 3 SS | 1 VIP SS CCK | 1 VIP SS | |
| 6 NPY SS | 2 CCK | |||
| 1 VIP CCK | 1 VIP SS | |||
| IS(n = 10) | ||||
| 0 | 0 | 5 VIP | 0 | 1 VIP |
| 1 VIP SS | 2 VIP SS | |||
| 1 VIP SS CCK | ||||
No peptide, None of the four peptides detected. Numbers in each case correspond to the number of cells expressing the specific combination of markers.
Therefore, FS cells appeared homogeneous when their electrophysiological properties and the expression of PV mRNAs were considered. They differed from one another, however, in the expression of the transcripts of CB and neuropeptides.
RSNP cells
In all cortical layers studied, a large proportion of the recorded cells (48 of 97) were unable to sustain high frequencies of repetitive discharges (see below) and were then classified as RSNP cells. The morphology of these cells as seen in IR videomicroscopy was heterogeneous with soma diameters ranging from 6 to 22 μm in the longest axis. Figure 3C shows a layer II–III RSNP cell with an oval soma and two main visible vertically oriented dendrites. Intracellular labeling of this cell with biocytin (Fig.3D) disclosed a sparsely spiny dendritic arborization and a vertically oriented axon sending most ramifications toward upper layer II and layer I. Two other RSNP cells were filled with biocytin. These two neurons were located in layer V and had vertically oriented nonspiny dendritic arborizations. The dendrites of one of these neurons was restricted to layer V, whereas the dendrites of the second cells extended to layers III and VI (not shown).
Fig. 3.
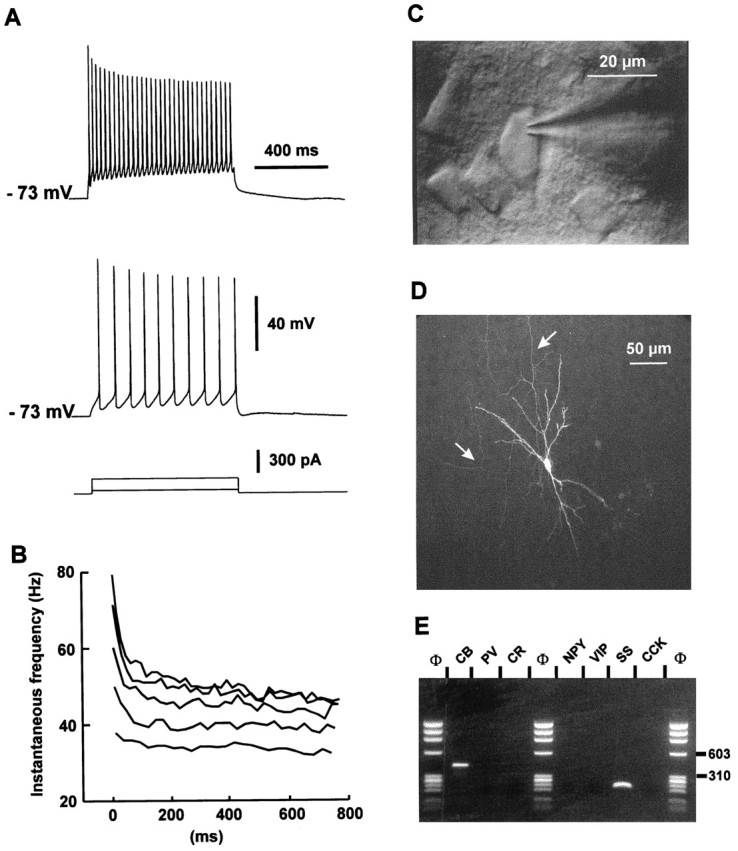
Physiological, morphological, and RT-mPCR analysis of a layer II–III RSNP neuron. A, Current-clamp recording obtained in response to application of current pulses of 50 and 200 pA. Application of a 50 pA depolarizing current induced a discharge of action potential at a constant rate (bottom trace). Application of larger depolarizing current (200 pA;top trace) evoked accommodating discharges.B, Plot of the instantaneous discharge frequency as a function of time at different stimulation intensities of depolarizing current (150–350 pA). The instantaneous discharge frequency increased with the intensities of stimulation (bottom to top traces). Note that at high stimulation intensities the frequency accommodated throughout the discharge with a marked early accommodation. C, IR videomicroscopy picture of the same neuron that presented a vertically oriented soma (20 μm long). Pial surface is upward. D, Intracellular labeling by biocytin injection. This RSNP cell had a sparsely spiny vertically oriented dendritic arborization. Note the mainly ascending axon (arrows). E, Agarose gel analysis of the RT-mPCR products from the same cell showed expression of CB and SS.
Action potentials evoked by current injection in RSNP cells had a longer duration at half height and a smaller AHP than those recorded in FS cells (Table 1). At a low discharge frequency (below 40 Hz), RSNP neurons emitted action potentials with moderate or no accommodation [Fig. 3A (top trace), B]. After application of current pulses of higher intensity, action potential discharges exhibited an accommodation whose amplitude increased with firing frequency [Fig. 3A (top trace),B)]. The early phase of this accommodation was slower than that exhibited by FS cells (Table 1, t1/2 early), and at high firing frequencies (above 50 Hz) accommodation always continued until the end of the current injection (Fig. 3B, Table 1).
In 11 RSNP cells, application of a hyperpolarizing pulse of current produced a marked depolarizing rebound that triggered action potentials. This rebound or low-threshold spike (LTS) was probably mediated by low voltage-activated Ca2+ channels, because it was resistant to bath application of 1 μm TTX and 10 mm Cs, which block Na+ currents andIQ-type currents, respectively (Fig.4A).
Fig. 4.

Electrophysiological and RT-mPCR analysis of a layer V RSNP neuron exhibiting an LTS. A, Effects of Cs and TTX on LTS. A rebound of depolarization generating a burst of action potentials appeared after a hyperpolarizing current pulse (Ctrl. trace, left panel). Bath application of 10 mm Cs induced an increase in the resistance of the cell but did not abolish the depolarizing rebound (Cs, left panel). Addition of 1 μmTTX in the bath suppressed the action potentials but not the slow depolarizing potential (Cs + TTX, right panel).B, Action potential firing of the same LTS cell induced in response to the application of a depolarizing pulse of current (+50 pA). Note the relatively fast action potentials and the accommodation of the firing. C, Agarose gel analysis of the same LTS cell. Two PCR-generated fragments were amplified; one corresponded to CR with a size of 309 bp and the other one to SS with a size of 209 bp.
A marked accommodation of the firing frequency is also observed in pyramidal cells (Connors and Gutnick, 1990; Kawaguchi, 1993) (Table 1). RSNP and pyramidal neurons, however, could be differentiated by the amplitude and duration of their action potentials. Action potentials emitted by pyramidal cells were slower and had a smaller AHP than those of RSNP cells (Table 1). Furthermore, the second action potential of discharges evoked in pyramidal cells by depolarizing steps of current was always slower than the first action potential (Table 1). This increase in action potential duration was not observed or was small in most RSNP cells (Table 1); however, some neurons (n = 12) identified as nonpyramidal cells in IR videomicroscopy exhibited action potentials similar to that of pyramidal cells. Three of these neurons have been included in the group of RSNP cells because they expressed CR, which is never observed in pyramidal cells. The remaining eight neurons expressed biochemical markers that are found in some pyramidal cells (CB and/or CCK; see previous remarks) and were therefore discarded from the present study.
The RT-mPCR analysis of RSNP cells revealed a large diversity in the expression pattern of the biochemical markers. The cell given as an example in Figure 3 showed co-expression of CB and SS mRNAs (Fig.3E). CB (65%) was detected more frequently than CR (31%) and PV (19%). In a few cells, the transcripts of two CaBPs were co-expressed: three RSNP cells co-expressed CB and PV and four co-expressed CB and CR. Most of RSNP cells (81%) expressed the mRNAs of at least one of the four neuropeptides (see Fig. 7); SS was the most frequent (58%), followed by NPY (19%), CCK (15%), and VIP (10%). Finally, 19% of the RSNP cells co-expressed at least two neuropeptides (for more details, see Table 2). As expected from the high occurrence of CB and SS, a large percentage of RSNP cells (40%) co-expressed these two markers. Nevertheless, in RSNP cells, CaBP and neuropeptide transcripts seemed to be randomly associated, and therefore this type of association probably does not define homogeneous subpopulations of RSNP cells. For instance, the observed CB–SS and CB–NPY associations (40% and 12.5%, respectively) were not statistically different (χ2 test; p = 0.8 for both) from the theoretical values (38% and 12.3%, respectively) expected from random associations between CB (65%) and SS (58%) or NPY (19%).
Among RSNP neurons, those exhibiting an LTS (n = 11) did not show a specific pattern of CaBP mRNAs expression. Five of these cells expressed CB, and four expressed CR (Fig. 4C). In two LTS neurons, both CB and CR were detected. As for the whole population of RSNP cells, SS was the most frequently detected neuropeptide in LTS neurons (n = 7), whereas NPY was detected in two cells, CCK in one cell, and VIP in one cell.
IS cells
In addition to the two physiological groups of nonpyramidal cells described previously (FS and RSNP cells), a small population of neurons found in layers II–III and V was characterized by an irregular firing behavior. The mRNAs of 10 of these cells were analyzed according to the same procedure used to study FS and RSNP cells, whereas another RT-mPCR was used on five other IS cells to characterize these neurons further (see below).
The typical discharge of IS cells in response to depolarizing current pulses consisted of the emission of an initial cluster of two to six action potentials, depending on the level of depolarization, followed by action potentials emitted at an irregular frequency (Figs.5A, 6A). Small oscillations of the membrane potential occurred between the action potentials of the irregular late discharges (Fig. 5A). These oscillations were blocked by bath application of 1 μm TTX (not shown).
Fig. 5.

Physiological, morphological, and RT-mPCR analysis of a layer V IS cell. A, Current-clamp recording obtained in response to depolarizing current pulses (50 and 150 pA). Note the initial burst of action potentials, the irregular firing frequency of the following spikes, and the membrane potential oscillations between each action potential. B, IR videomicroscopy of this cell typically presenting a vertically oriented fusiform soma (20 μm long). Two main dendrites extended in opposite directions from the soma, one toward the superficial layers and the other toward the white matter. C, Confocal image of the cell labeled by intracellular biocytin injection. This IS bipolar cell displayed two main narrow dendritic arborizations. The ascending dendrites (top) extended up to layers II–III; the descending dendrites extended to layer VI. D, Agarose gel analysis of the second PCR products. Three fragments corresponding to CB, CR, and VIP with a size of 432, 309, and 287 bp, respectively, were amplified.
All IS neurons appeared as vertically oriented bipolar neurons when observed by IR videomicroscopy during the electrophysiological recordings (Fig. 5B). This observation was confirmed further by intracellular injections of biocytin in five neurons. The example presented in Figure 5, B and C, shows a layer V IS cell with a narrow bipolar vertically oriented dendritic arborization devoid of spines. The ascending dendrites extended to layers II–III. The descending dendritic tree that reached layer VI had side branches that extended more laterally than those of the ascending dendritic arborization. The axon of this particular cell was probably cut during the slicing procedure and could not be retrieved. Figure6B shows another example of an IS cell labeled with biocytin. The soma of this aspiny neuron was located in layer III, and the bipolar vertical dendritic arborization extended from layer I to layer V. The axon arose from the proximal part of the ascending dendrite (Fig. 6B, inset). The primary axonal branch ran along the cortical lamination and branched within layer III into ascending and descending vertical colaterals with varicosities. The three other IS cells labeled with biocytin had similar bipolar morphologies (not shown).
The RT-mPCR analysis revealed that all tested IS cells (n = 10) co-expressed CR and VIP mRNAs among the three CaBPs and the four neuropeptides (Fig. 7). In five of them, expression of CB (Fig. 5D), SS, or CCK was also detected (for more details, see Table 2). The consistent expression of CR and VIP in all IS cells suggests that they probably correspond to a subpopulation of the bipolar VIP-immunoreactive interneurons described previously in the neocortex (Eckenstein and Baughman, 1984; Morrison et al., 1984; Peters and Harriman, 1988) and led us to investigate the nature of their putative neurotransmitter. Indeed, there has been a debate as to whether VIP-expressing neocortical cells are GABAergic or cholinergic neurons (Eckenstein and Baughman, 1984; Peters and Harriman, 1988; Chédotal et al., 1994; Kubota et al., 1994). We therefore designed another RT-mPCR to amplify simultaneously CR and VIP as selective markers of these neurons, together with GAD65 and GAD67, the GABA-synthesizing enzymes, and ChAT, the acetylcholine-synthesizing enzyme (see Materials and Methods). The efficiency of this RT-mPCR was first confirmed by the co-detection of the five mRNAs investigated from 500 pg of total RNA from neocortex (not shown). The same protocol was applied to one FS cell and two RSNP cells. In these three neurons, the mRNAs of GAD65 and GAD67 were expressed, and CR was observed in one of the two RSNP cells. VIP and ChAT mRNAs were not detected in these three nonpyramidal cells (not shown). These results indicate the cell-type specificity of the procedure. Five IS cells were analyzed with this protocol. As expected, CR and VIP were detected in these five neurons. In addition, four of them also expressed the mRNAs for GAD65 and GAD67 (Fig. 6C) and one expressed GAD67 but not GAD65 mRNAs. Among these five IS cells, four expressed ChAT mRNAs (Fig. 6C). These results show that in addition to VIP, IS neurons express the mRNAs for the synthesizing enzymes of GABA and acetylcholine.
DISCUSSION
The aim of the present work was to investigate the physiological and biochemical characteristics of rat neocortical nonpyramidal cells. The investigation of single nonpyramidal cells by a combination of whole-cell patch-clamp recordings with RT-mPCR disclosed diverse firing behaviors and expression patterns of biochemical markers. Our results confirm that the FS cell population expresses predominantly PV, and in addition they reveal that half of these neurons also express the mRNAs of CB and/or of one neuropeptide. The pattern of expression of the biochemical markers was even more complex in the group of RSNP cells. In contrast with this biochemical heterogeneity of FS and RSNP cells, a small population of IS interneurons co-expressed consistently CR and VIP mRNAs. These cells have a bipolar morphology and also express the transcripts of the synthesis enzymes of both GABA and acetylcholine.
Simultaneous detection of three CaBPs and four neuropeptides by RT-mPCR
The experiments performed on total RNA purified from rat cerebral cortex showed that the RT-mPCR protocol detected simultaneously all of the seven mRNAs investigated: CB, PV, CR, NPY, VIP, SS, and CCK. Furthermore, all of these markers were detected in the sample of single cortical neurons that was analyzed. The reliability of the method was assessed by the detection of the mRNAs encoding CB in all single cerebellar Purkinje cells analyzed and by the detection of PV mRNAs in 9 of 10 of these neurons. Indeed, these two CaBPs are known to be co-expressed in Purkinje cells (Celio, 1990; Tolosa de Talamoni et al., 1993). The additional detection of CR in one cell and of SS in another is in agreement with reports showing expression of these two markers in small subpopulations of Purkinje cells (Naus, 1990; Villa et al., 1994). The good overall correspondence between the results of RT-mPCR and those of previous immunochemical studies on Purkinje cells (Celio, 1990; Tolosa de Talamoni et al., 1993) and on some populations of neocortical neurons indicates that in most instances the mRNAs detected are indeed translated. This conclusion is also supported in the present study by the co-detection of mRNAs and corresponding proteins in three tested nonpyramidal cells recorded in neocortical slices. The specificity of the amplification procedure was demonstrated further by controls performed in neocortical slices on electrophysiologically characterized glial cells and pyramidal cells. Taken together, these controls validate the use of this RT-mPCR procedure to investigate the patterns of expression of the mRNAs encoding CB, PV, CR, NPY, VIP, SS, and CCK in single nonpyramidal cells.
Co-expression patterns of three CaBPs and four neuropeptides in neocortical nonpyramidal cells
The simultaneous probing of the seven markers in single cells extends previous observations on the co-expression of CaBPs and neuropeptides in neocortical neurons. All of the 97 neocortical nonpyramidal cells analyzed in this study expressed at least one of the three CaBP transcripts. The laminar distributions of CB, PV, and CR were 68, 43, and 25% (layers II–III), respectively, and 51, 47, and 24% (layer V), respectively. These proportions are roughly similar to those reported previously, although lower proportions of CB cells (layers II–III, 46%, and layer V, 35%) and higher proportions of PV cells (layers II–III, 43%, and layer V, 61%) were found using immunohistochemistry (Kubota et al., 1994). Co-expression of two CaBP mRNA species (CB–PV or CR–CB) was detected frequently (25 of 97 recorded nonpyramidal neurons), but co-expression of PV and CR was never observed, in agreement with immunohistochemical studies (Kubota et al., 1994; Alcantara et al., 1996).
In addition, the majority (73 of 97) of nonpyramidal cells expressed the mRNAs of one or more neuropeptides, with 16 cells co-expressing two neuropeptides and two cells co-expressing three neuropeptides. SS was the most frequently detected neuropeptide (46 cells), in good agreement with the proportion of SS immunoreactive GABAergic interneurons found in rat frontal cortex, which ranged from 26 to 45% depending on the cortical layer studied (Kubota et al., 1994). Consistent with the study of Kubota et al. (1994), we found the majority of SS cells in layer V and the majority of NPY cells in layers II–III. Therefore, as far as the expression of individual markers is concerned, there is a good match between the proportion of cells expressing the mRNAs, as detected by RT-mPCR, and the percentage of immunoreactive cells reported by others (Kubota et al., 1994; Alcantara et al., 1996); however, some discrepancies appeared when the results of mRNA and protein detection were compared to evaluate the pattern of co-expression of the different markers. For instance, previous studies on the neocortex reported that SS was co-expressed only with CB (Rogers, 1992; Kubota et al., 1994) or in very few cells with PV (Kosaka et al., 1987; Demeulemeester et al., 1991) but never with CR. In the present work, SS was frequently found in CB-containing cells (n = 30); however, SS was also observed in PV- or CR-expressing neurons (n = 19 and 9, respectively). This discrepancy might result from a higher sensitivity of the RT-mPCR as compared with double immunohistochemistry, because of the difficulty of optimizing the simultaneous detection of two antigens (Hendry et al., 1984). Alternatively, the possibility that some mRNAs are not translated cannot be ruled out totally.
Molecular diversity of physiologically identified neocortical nonpyramidal cells
FS neurons represented 35% of the total sample. Similar proportions of FS cells were reported in layers II–III of the rat agranular cortex (Kawaguchi, 1995). A majority (88%) of FS cells expressed PV mRNAs, in good agreement with previous immunohistochemistry studies (Kawaguchi and Kubota, 1993, 1996;Kawaguchi, 1995). Therefore, this association of firing pattern and PV expression seems to define a relatively homogeneous cell population; however, the expression of mRNAs encoding CB (56%) and/or neuropeptides (50%) shows that a heterogeneity exists in this cell population, as observed previously in biochemical and anatomical studies. Indeed, variable subunit composition of AMPA receptors has been found in FS cells by single-cell RT-PCR (Lambolez et al., 1996), and intracellular labeling has revealed that FS cells correspond to either basket cells or chandelier cells (Kawaguchi, 1995).
Among the different physiological cell types, RSNP cells were the most numerous cell group (n = 48). These cells seem similar to the RSNP cells described previously in the rat frontal cortex (Kawaguchi, 1995; Kawaguchi and Kubota, 1996). Although they displayed a large diversity in their expression patterns, none of these specific patterns (for instance co-expression of CB and SS mRNAs) could be linked to specific firing properties to define subgroups of RSNP cells in this study.
This study was based on the assumption that correlations between firing patterns and mRNA expression of CaBPs and neuropeptides in nonpyramidal cells could help to define subpopulations acting at specific functional levels in the cortical network. The majority (73 of 97) of nonpyramidal cells expressed the transcripts of one or more neuropeptides. This proportion is presumably even higher when other members of the neuropeptide family are also considered (e.g., enkephalins, substance P, etc.). Therefore, co-transmission of GABA and one or more neuropeptides can potentially occur in the majority of nonpyramidal cells, and neuropeptides may be important regulators of neocortical activity; however, with the exception of IS cells (see below), the expression of neuropeptides does not seem to be correlated with either a firing pattern or a CaBP. If CaBPs or firing patterns define functionally homogeneous elements of the cortical network, activation of this element would result in the release of different neuropeptides. Conversely, if functional network elements are based on neuropeptide expression, they would contain cells with different firing patterns. The characterization of populations constituting functional network elements probably requires additional parameters not analyzed in this study. These parameters could include the anatomical distribution, morphology, or connectivity of the cells.
IS cells: a homogeneous population co-expressing CR, VIP, ChAT, and GAD
Finally we described a small population of cortical interneurons (n = 15) that shared common anatomical, biochemical, and physiological characteristics. These vertical bipolar cells emitted bursts of action potentials and co-expressed CR and VIP. A similar firing behavior was reported by Kawaguchi (1995) in vertical bipolar cells. These cells probably correspond to the bipolar VIP-immunoreactive interneurons described in the rat neocortex (Morrison et al., 1984; Peters and Harriman, 1988; Kawaguchi and Kubota, 1996) and found closely associated with blood vessels (Eckenstein and Baughman, 1984; Chédotal et al., 1994).
In addition, further molecular investigation of IS neurons revealed the co-expression of GAD and ChAT mRNAs in these cells. The possible colocalization of two classical neurotransmitters, one inhibitory (GABA) and the second potentially excitatory (acetylcholine), has already been suggested for a discrete subpopulation of bipolar neurons of the rat neocortex (Kosaka et al., 1988). Furthermore, the relative proportions of VIP-immunoreactive bipolar neurons expressing ChAT or GAD in the neocortex led Peters and Harriman (1988) to propose that a subpopulation of VIP-expressing bipolar neurons may contain both ChAT and GAD. Our study strongly supports this hypothesis and reveals further that these cells can now be electrophysiologically identified according to their irregular firing behavior.
These results suggest that IS cells form a relatively homogeneous cell population that may serve a specific physiological function in the neocortex. Interestingly, VIP and acetylcholine as well as GABA are believed to be involved in the control of local cortical blood flow or metabolism (Lee et al., 1984; Magistretti, 1990; Fergus and Lee, 1996).
Footnotes
This work was supported by Centre National de la Recherche Scientifique, Human Frontier Science Program Organization (RG-85/94 B) and by National Institutes of Health Grant EY-09120 (S.H.). We thank Dr. Antoine Triller for the confocal microscopy, Mathieu Stricker for assistance with the statistical analysis, and Drs. Serge Charpak and James Porter for critical comments.
Correspondence should be addressed to Etienne Audinat, Neurobiologie et Diversité Cellulaire, Centre National de la Recherche Scientifique Unité de Recherche Associée 2054, ESPCI, 10 rue Vauquelin, 75231 Paris cedex 5, France.
REFERENCES
- 1.Alcantara S, de Lecea L, Del Rio JA, Ferrer I, Soriano E. Transient colocalization of parvalbumin and calbindin D28K in the postnatal cerebral cortex: evidence for a phenotypic shift in developing nonpyramidal neurons. Eur J Neurosci. 1996;8:1329–1339. doi: 10.1111/j.1460-9568.1996.tb01595.x. [DOI] [PubMed] [Google Scholar]
- 2.Baimbridge KG, Celio MR, Rogers JH. Calcium-binding proteins in the nervous system. Trends Neurosci. 1992;15:303–308. doi: 10.1016/0166-2236(92)90081-i. [DOI] [PubMed] [Google Scholar]
- 3.Baughman RW, Gilbert CD. Aspartate and glutamate as possible neurotransmitters in the visual cortex. J Neurosci. 1981;1:427–439. doi: 10.1523/JNEUROSCI.01-04-00427.1981. [DOI] [PMC free article] [PubMed] [Google Scholar]
- 4.Bochet P, Audinat E, Lambolez B, Crépel F, Rossier J, Iino M, Tsuzuki K, Ozawa S. Subunit composition at the single-cell level explains functional properties of a glutamate-gated channel. Neuron. 1994;12:383–388. doi: 10.1016/0896-6273(94)90279-8. [DOI] [PubMed] [Google Scholar]
- 5.Brice A, Berrard S, Raynaud S, Ansieau S, Coppola T, Weber MJ, Mallet J. Complete sequence of a cDNA encoding an active rat choline acetyltransferase: a tool to investigate the plasticity of cholinergic phenotype expression. J Neurosci Res. 1989;23:266–273. doi: 10.1002/jnr.490230304. [DOI] [PubMed] [Google Scholar]
- 6.Burgunder JM, Young WS. Cortical neurons expressing the cholecystokinin gene in the rat: distribution in the adult brain, ontogeny, and some of their projections. J Comp Neurol. 1990;300:26–46. doi: 10.1002/cne.903000104. [DOI] [PubMed] [Google Scholar]
- 7.Celio MR. Parvalbumin in most gamma-aminobutyric acid-containing neurons of the rat cerebral cortex. Science. 1986;231:995–997. doi: 10.1126/science.3945815. [DOI] [PubMed] [Google Scholar]
- 8.Celio MR. Calbindin D-28k and parvalbumin in the rat nervous system. Neuroscience. 1990;35:375–475. doi: 10.1016/0306-4522(90)90091-h. [DOI] [PubMed] [Google Scholar]
- 9.Chédotal A, Cozzari C, Faure MP, Hartman BK, Hamel E. Distinct choline acetyltransferase (ChAT) and vasoactive intestinal polypeptide (VIP) bipolar neurons project to local blood vessels in the rat cerebral cortex. Brain Res. 1994;646:181–193. doi: 10.1016/0006-8993(94)90076-0. [DOI] [PubMed] [Google Scholar]
- 10.Chomczynski P, Sacchi N. Single-step method of RNA isolation by acid guanidinium thiocyanate-phenol-chloroform extraction. Anal Biochem. 1987;162:156–159. doi: 10.1006/abio.1987.9999. [DOI] [PubMed] [Google Scholar]
- 11.Connors BW, Gutnick MJ. Intrinsic firing patterns of diverse neocortical neurons. Trends Neurosci. 1990;13:99–104. doi: 10.1016/0166-2236(90)90185-d. [DOI] [PubMed] [Google Scholar]
- 12.Demeulemeester H, Vandesande F, Orban GA, Brandon C, Vanderhaeghen JJ. Heterogeneity of GABAergic cells in cat visual cortex. J Neurosci. 1988;8:988–1000. doi: 10.1523/JNEUROSCI.08-03-00988.1988. [DOI] [PMC free article] [PubMed] [Google Scholar]
- 13.Demeulemeester H, Arckens L, Vandesande F, Orban GA, Heizmann CW, Pochet R. Calcium binding proteins and neuropeptides as molecular markers of GABAergic interneurons in the cat visual cortex. Exp Brain Res. 1991;84:538–544. doi: 10.1007/BF00230966. [DOI] [PubMed] [Google Scholar]
- 14.Eckenstein F, Baughman RW. Two types of cholinergic innervation in cortex, one co-localized with vasoactive intestinal polypeptide. Nature. 1984;309:153–155. doi: 10.1038/309153a0. [DOI] [PubMed] [Google Scholar]
- 15.Fergus A, Lee KS (1996) GABAergic regulation of resting tone in cerebral microvessels of the rat. Soc Neurosci Abstr 22(Part 2):910.
- 16.Hendry SHC, Jones EG, DeFelipe J, Schmechel D, Brandon C, Emson PC. Neuropeptide-containing neurons of the cerebral cortex are also GABAergic. Proc Natl Acad Sci USA. 1984;81:6526–6530. doi: 10.1073/pnas.81.20.6526. [DOI] [PMC free article] [PubMed] [Google Scholar]
- 17.Hendry SHC, Jones EG, Emson PC, Lawson DEM, Heizmann CW, Streit P. Two classes of cortical GABA neurons defined by differential calcium binding protein immunoreactivities. Exp Brain Res. 1989;76:467–472. doi: 10.1007/BF00247904. [DOI] [PubMed] [Google Scholar]
- 18.Houser CR, Hendry SHC, Jones EG, Vaughn JE. Morphological diversity of immunocytochemically identified GABA neurons in the monkey sensory-motor cortex. J Neurocytol. 1983;12:617–638. doi: 10.1007/BF01181527. [DOI] [PubMed] [Google Scholar]
- 19.Jacobowitz DM, Winsky L. Immunocytochemical localization of calretinin in the forebrain of the rat. J Comp Neurol. 1991;304:198–218. doi: 10.1002/cne.903040205. [DOI] [PubMed] [Google Scholar]
- 20.Kawaguchi Y. Groupings of nonpyramidal and pyramidal cells with specific physiological and morphological characteristics in rat frontal cortex. J Neurophysiol. 1993;69:416–431. doi: 10.1152/jn.1993.69.2.416. [DOI] [PubMed] [Google Scholar]
- 21.Kawaguchi Y. Physiological subgroups of nonpyramidal cells with specific morphological characteristics in layer II/III of rat frontal cortex. J Neurosci. 1995;15:2638–2655. doi: 10.1523/JNEUROSCI.15-04-02638.1995. [DOI] [PMC free article] [PubMed] [Google Scholar]
- 22.Kawaguchi Y, Kubota Y. Correlation of physiological subgroupings of nonpyramidal cells with parvalbumin- and calbindin D28k-immunoreactive neurons in layer V of rat frontal cortex. J Neurophysiol. 1993;70:387–396. doi: 10.1152/jn.1993.70.1.387. [DOI] [PubMed] [Google Scholar]
- 23.Kawaguchi Y, Kubota Y. Physiological and morphological identification of somatostatin- or vasoactive intestinal polypeptide-containing cells among GABAergic cell subtypes in rat frontal cortex. J Neurosci. 1996;16:2701–2715. doi: 10.1523/JNEUROSCI.16-08-02701.1996. [DOI] [PMC free article] [PubMed] [Google Scholar]
- 24.Kosaka T, Heizmann CW, Tateishi K, Hamaoka Y, Hama K. An aspect of the organizational principle of the gamma-aminobutyric acidergic system in the cerebral cortex. Brain Res. 1987;409:403–408. doi: 10.1016/0006-8993(87)90732-3. [DOI] [PubMed] [Google Scholar]
- 25.Kosaka T, Tauchi M, Dahl JL. Cholinergic neurons containing GABA-like and/or glutamic acid decarboxylase-like immunoreactivities in various brain regions of the rat. Exp Brain Res. 1988;70:605–617. doi: 10.1007/BF00247609. [DOI] [PubMed] [Google Scholar]
- 26.Kubota Y, Hattori R, Yui Y. Three distinct subpopulations of GABAergic neurons in rat frontal agranular cortex. Brain Res. 1994;649:159–173. doi: 10.1016/0006-8993(94)91060-x. [DOI] [PubMed] [Google Scholar]
- 27.Lambolez B, Audinat E, Bochet P, Crépel F, Rossier J. AMPA receptor subunits expressed by single Purkinje cells. Neuron. 1992;9:247–258. doi: 10.1016/0896-6273(92)90164-9. [DOI] [PubMed] [Google Scholar]
- 28.Lambolez B, Ropert N, Perrais D, Rossier J, Hestrin S. Correlation between kinetics and RNA splicing of α-amino-3-hydroxy-5-methylisoxazole-4-propionic acid receptors in neocortical neurons. Proc Natl Acad Sci USA. 1996;93:1797–1802. doi: 10.1073/pnas.93.5.1797. [DOI] [PMC free article] [PubMed] [Google Scholar]
- 29.Lee TJF, Saito A, Berezin I. Vasoactive intestinal polypeptide-like substance: the potential transmitter for cerebral vasodilation. Science. 1984;224:898–901. doi: 10.1126/science.6719122. [DOI] [PubMed] [Google Scholar]
- 30.McCormick DA, Connors BW, Lighthall JW, Prince DA. Comparative electrophysiology of pyramidal and sparsely spiny stellate neurons of the neocortex. J Neurophysiol. 1985;54:782–806. doi: 10.1152/jn.1985.54.4.782. [DOI] [PubMed] [Google Scholar]
- 31.Magistretti PJ. VIP neurons in the cerebral cortex. Trends Pharmacol Sci. 1990;11:250–254. doi: 10.1016/0165-6147(90)90253-5. [DOI] [PubMed] [Google Scholar]
- 32.Morrison JH, Magistretti PJ, Benoit R, Bloom FE. The distribution and morphological characteristics of the intracortical VIP-positive cell: an immunohistochemical analysis. Brain Res. 1984;292:269–282. doi: 10.1016/0006-8993(84)90763-7. [DOI] [PubMed] [Google Scholar]
- 33.Naus CC. Developmental appearance of somatostatin in the rat cerebellum: in situ hybridization and immunohistochemistry. Brain Res Bull. 1990;24:583–592. doi: 10.1016/0361-9230(90)90163-t. [DOI] [PubMed] [Google Scholar]
- 34.Ong WY, Garey LJ, Sumi Y. Distribution of preprosomatostatin mRNA in the rat parietal and temporal cortex. Mol Brain Res. 1994;23:151–156. doi: 10.1016/0169-328x(94)90221-6. [DOI] [PubMed] [Google Scholar]
- 35.Peters A, Harriman KM. Enigmatic bipolar cell of the rat visual cortex. J Comp Neurol. 1988;267:409–432. doi: 10.1002/cne.902670310. [DOI] [PubMed] [Google Scholar]
- 36.Rogers JH. Immunohistochemical markers in rat cortex: co-localization of calretinin and calbindin-D28k with neuropeptides and GABA. Brain Res. 1992;587:147–157. doi: 10.1016/0006-8993(92)91439-l. [DOI] [PubMed] [Google Scholar]
- 37.Ruano D, Lambolez B, Rossier J, Paternain AV, Lerma J. Kainate receptor subunits expressed in single cultured hippocampal neurons: molecular and functional variants by RNA editing. Neuron. 1995;14:1009–1017. doi: 10.1016/0896-6273(95)90339-9. [DOI] [PubMed] [Google Scholar]
- 38.Schiffmann SN, Vanderhaeghen JJ. Distribution of cells containing mRNA encoding cholecystokinin in the rat central nervous system. J Comp Neurol. 1991;304:219–233. doi: 10.1002/cne.903040206. [DOI] [PubMed] [Google Scholar]
- 39.Somogyi P, Hodgson AJ, Smith AD, Nunzi MG, Gorio A, Wu JY. Different populations of GABAergic neurons in the visual cortex and hippocampus of cat contain somatostatin- or cholecystokinin-immunoreactive material. J Neurosci. 1984;4:2590–2603. doi: 10.1523/JNEUROSCI.04-10-02590.1984. [DOI] [PMC free article] [PubMed] [Google Scholar]
- 40.Stuart GJ, Dodt HU, Sakmann B. Patch-clamp recordings from the soma and dendrites of neurons in brain slices using infrared video microscopy. Pflügers Arch. 1993;423:511–518. doi: 10.1007/BF00374949. [DOI] [PubMed] [Google Scholar]
- 41.Tolosa de Talamoni N, Smith CA, Wasserman RH, Beltramino C, Fullmer CS, Penniston JT. Immunocytochemical localization of the plasma membrane calcium pump, calbindin-D28k, and parvalbumin in Purkinje cells of avian and mammalian cerebellum. Proc Natl Acad Sci USA. 1993;90:11949–11953. doi: 10.1073/pnas.90.24.11949. [DOI] [PMC free article] [PubMed] [Google Scholar]
- 42.Van Brederode JFM, Helliesen MK, Hendrickson AE. Distribution of the calcium-binding proteins parvalbumin and calbindin-D28k in the sensorimotor cortex of the rat. Neuroscience. 1991;44:157–171. doi: 10.1016/0306-4522(91)90258-p. [DOI] [PubMed] [Google Scholar]
- 43.Villa A, Podini P, Panzeri MC, Racchetti G, Meldolesi J. Cytosolic Ca2+ binding proteins during rat brain ageing: loss of calbindin and calretinin in the hippocampus, with no change in the cerebellum. Eur J Neurosci. 1994;6:1491–1499. doi: 10.1111/j.1460-9568.1994.tb01010.x. [DOI] [PubMed] [Google Scholar]