

Abstract
The spike activity of neurons was recorded from the dorsal bank of the superior temporal sulcus (area MSTd) of alert behaving macaque monkeys performing visual fixation or target tracking tasks, with the aim of studying the tuning features of these neurons with both the direction of slow eye movement and the position of gaze. One hundred thirty-two neurons were tested for several fixation points and tracking directions. Many of them (43%) tuned to the direction of pursuit, regardless of the angle of gaze. Some (18%) showed a tonic discharge modulated by the static position of the eyes without pursuit direction specificity. A substantial number of cells (22%) were characterized by a discharge rate tuned to pursuit direction but influenced also by angle of gaze. Tuning curves for eye movement direction presented an average bandwidth of 130° and turned out to be continuously overlapping, suggesting a sort of vector coding of smooth pursuit direction. Gaze fields of eye position (EP) neurons were mostly ramp-like, with center of ramps shifted away from the straight ahead, implying a form of scalar coding of gaze eccentricity. The different categories of cells were intermingled and close to each other, suggesting possible reciprocal interactions within the same cortical area. These results show that EP and pursuit direction are signaled mainly by separate neuronal elements in area MSTd. Moreover, some cells can integrate both signals. Taking into account the visual responses of MSTd neurons to large, textured, moving fields, it is suggested that this area could be the site of interaction between visuo-oculomotor signals related to visual motion detection, slow eye movement direction, and EP. This signal interaction may be important for integrative functions such as analysis of external or self-induced visual motion, cortical control of pursuit eye movements, and eye/head coordination.
Keywords: oculomotor system, smooth pursuit, eye position, extrastriate cortex, area MSTd, visuomotor integration, self-movement control
Area medial superior temporal (MST) of the macaque monkey, a cortical region originally identified as the visual area in the superior temporal sulcus (STS) receiving direct fibers from area middle temporal (MT) (Maunsell and Van Essen, 1983), has been subdivided further into more restricted sub-areas (Desimone and Ungerleider, 1986; Ungerleider and Desimone, 1986; Hikosaka et al., 1988; Komatsu and Wurtz, 1988). Currently accepted nomenclature recognizes three cortical fields inside the former MST: a dorsal region (MSTd), a ventrolateral portion (MSTl), and an area situated on the floor of the STS (FST). Because of the direct input from the “motion area” MT, MST complex is regarded as an advanced cortical stage devoted to visual motion processing.
At the same time, these areas are probably the first cortical station, in the so-called “visual motion pathway,” revealing both retinal and extraretinal signals during the performance of smooth pursuit (SP) eye movements (Sakata et al., 1983; Newsome et al., 1988), so that they are considered as control centers for initiation and maintenance of SP. For its double role as a sensory- and motor-related cortical region, MST seems to be an important node in the nervous network subserving visuo-oculomotor integration.
Visual features of MST neurons have been studied extensively. Cells in this region are reported to be activated by moving stimuli with direction selectivity (Desimone and Ungerleider, 1986; Saito et al., 1986; Tanaka et al., 1986). MSTd and MSTl are distinct for the different occurrence of neurons responding to large structured fields or to small luminous stimuli. Cells responding to large fields prevail in MSTd, whereas neurons activated by small spots predominate in MSTl (Komatsu and Wurtz, 1988). In addition, MSTd is peculiar because some of its neurons are specifically activated not only by translational movements of visual stimuli but also by rotation and expansion or contraction of visual patterns (Saito et al., 1986; Tanaka and Saito, 1989; Duffy and Wurtz, 1991), as well as by spiral motion of visual fields (Graziano et al., 1994). All these patterns of visual stimulation occur in nature during eye or body movements in a textured visual environment. Thus, area MSTd is regarded as a cortical structure devoted to the visual analysis of self-movement.
On the other hand, the functional features of MST neurons related to eye movements have been understated in comparison to the attention paid to the visual properties of the area. Tracking-related activity of neurons located in a region of STS probably corresponding to area MST has been reported by Sakata et al. (1983). Since then, the most extensive studies describing the correlation between MST cells and SP direction were done in Wurtz’s laboratory (Komatsu and Wurtz, 1988;Newsome et al., 1988), and it was found that in both regions, MSTd and MSTl, neurons are driven by the slow phase of tracking eye movements with direction selectivity. The results of this work led to the notion that a neuronal population, especially concentrated in area MSTd, is able to signal the direction of SP on the basis of extraretinal as well as retinal input.
How SP direction is encoded by MSTd neurons is still not defined, because detailed reports on the properties of tuning curves for SP direction are lacking. Moreover, in addition to the SP-related neurons, signaling eye position (EP) during steady fixation (SF) has been described recently in MST. EP neurons are able to represent eye eccentricity from the straight-ahead position in all directions of the visual field (Squatrito and Maioli, 1996). The presence in MSTd of neurons related to static properties of the oculomotor system, physically close to elements signaling the direction of the slow eye movements, emphasizes the importance of directional and positional eye signals for the sensorimotor integration processes necessary to control self-motion in the visual environment.
The aim of this paper is to describe the functional correlation of MSTd neurons with both dynamic and static aspects of EP, i.e., direction of slow eye movements and instant EP during SF. For this purpose we recorded the spike activity of neurons in the dorsal bank of STS of alert macaque monkeys while the animals performed visual tracking or fixation tasks in a dark environment. We studied quantitatively cell activity as a function of both eye movement direction and EP, to see how the two signals are represented in this area.
MATERIALS AND METHODS
The experiments were performed on two juvenile male Java monkeys (Macaca fascicularis) weighing 2.3 and 3.0 kg. All of the experimental procedures were conducted in accordance with the Society for Neuroscience policy on the use of animals in neuroscience research and comply with local and international laws. The animals were trained to perform steady gaze fixations or pursuit eye movements. They sat in a monkey chair facing a 19 inch video monitor (Conrac 7351; 1280 × 1024 pixels), positioned at 28.5 cm from the eyes, with its center aligned with the eye primary position. The visual field covered by the screen was ∼70 × 60°. A fixation target, consisting of a square pattern made by two vertical 0.51° bright bars, separated by a 0.17° gap, was presented on a dark background (0.000 cd/m2 as measured by a United Detector Technology System S351 photometer). The task of the monkey was to detect, within a limited time, a sudden shift of the orientation of the gap from vertical to horizontal. Correct trials were rewarded with water, whereas no punishment was used for the wrong responses. The target could be steady in several points of the screen or moving slowly, in several directions, making the animal steadily fixate or slowly pursue it. For the period of training and experiments, the animals received their regular amount of water during daily working sessions 5 d a week. During the remaining 2 d, they had free access to water. The weight and general health of the animals were checked daily, and if signs of dehydration were detected, training or experiments were suspended.
Schematic representation of the behavioral sequences are shown in Figure 1. For SF task (Fig. 1B,C), the target was presented to make the animal steadily fixate on several different points of the visual field in random order. Each trial started with the appearance of the target at a specific screen position (event T in Fig. 1B); the beginning of the fixation period was signaled by the animal pressing a key (eventK). After fixation periods varying from 0.5 to 6 sec, the target suddenly rotated by 90° (event C), and the animal released the key (event E) to signal the detection of the change. At this point, the target was turned off and an intertrial period, varying from 1.5 to 3 sec, followed.
Fig. 1.
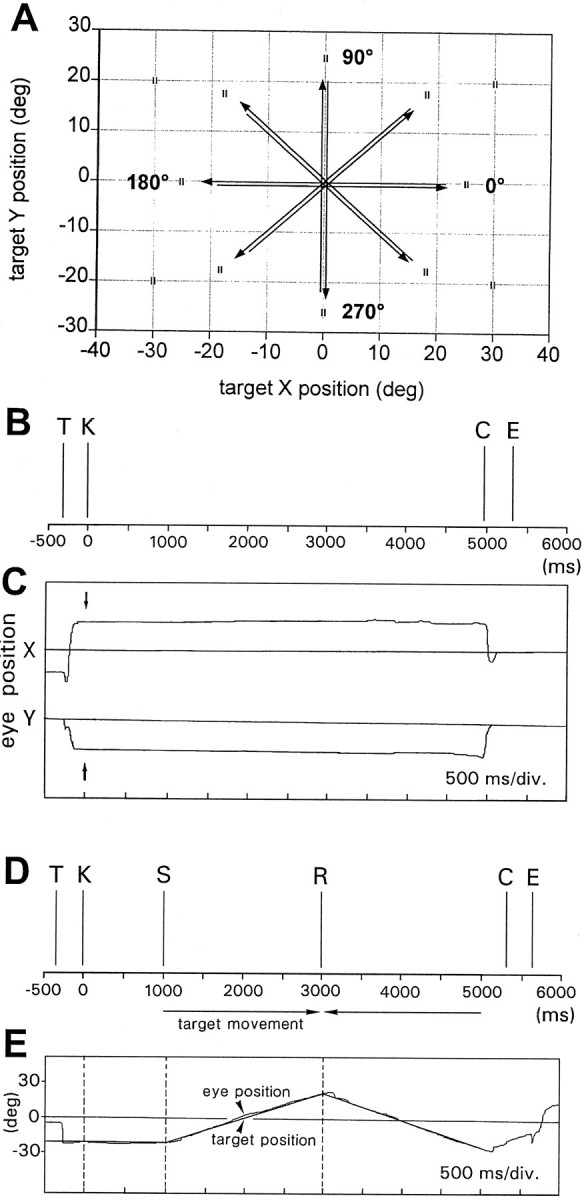
Behavioral tasks. A, Diagram of the screen viewed by the animal, with exemplary grid of fixation points and typical trajectories of target slow movements. B, Example showing the phases of SF task. T, Target onset;K, key-down event signaling the acknowledgment of the target by the animal and the start of fixation period (K–C); C, target-flip event used as cue for the release of the key (E) that ends the trial.C, Exemplary traces of EP. Arrows point to the key-down event. D, Example showing the phases of tracking task. K–S is the SF period before the starting of the target movement. S–R and R–C are the periods of the target movement in opposite directions.E, Target and EP traces along the main axis of displacement.
For SP task (Fig. 1D,E), the target was moving throughout the visual field along rectilinear trajectories centered on the middle of the screen (Fig. 1A) according to a triangular wave stimulation. Usually the amplitude of the sweep was 45–50° at speeds ranging between 14° and 28°/sec. In this protocol, the trials began with the appearance of the target at an eccentric screen location (event T in Fig.1D). The animal foveated the target and signaled the fixation with the pressing of the key (event K). Then, after a 500–1000 msec period of rest at the starting point of the movement (period K–S), the target began to move at a constant velocity, followed by the tracking movement of the animal eyes. When the target reached the end of the sweep, the direction was reversed (event R). One or more opposite sweeps were repeated, according to the randomized duration of the trial, the amplitude of the sweep, and the speed of the target. Finally the target rotated by 90° (event C), and as soon as the animal released the key (event E), the target went off, ending the trial.
Once each animal reached a criterion performance (95% or more correct trials), it was anesthetized with pentobarbital, and using aseptic technique a metal peg was attached to the skull with neurosurgical cement (Refobacin Palacos, Merck) to allow painless restraint of the head. At the same time, a cylindrical stainless steel chamber (1.8 cm inner diameter) was cemented to the skull above the parietal region of the cerebral cortex. This chamber was later used to seal the opening in the skull through which extracellular metal microelectrodes were introduced into the cerebral cortex.
After recovery (at least 1 week) and during daily experimental sessions with the head of the animal fixed, the activity of single cortical neurons was recorded during periods of gaze fixation and SP. Recording epochs started 1 sec before target onset and ended 1 sec after its disappearance. At least 10 correct trials were repeated for each fixation point or for each eye movement direction. The distribution of the sampled points and their local density was varied as needed to assess specific spatial features of each cell. The number of fixation points tested ranged from 9 to 32, forming a two-dimensional grid covering a portion of the visual field almost coextensive with the monitor screen. The sampled eye movement directions varied from 8 to 12, in steps of 45 or 30°. Extracellular spikes were recorded by glass-coated elgiloy microelectrodes, driven through the intact dura by a remotely controlled stepping motor fixed on top of the chamber. During the recording sessions, the animal was kept in a totally dark cabinet. To avoid dark adaptation, the ambient light was periodically turned on for a few minutes during pauses in the recording activity.
For every isolated unit, responsiveness to conventional visual stimuli was studied by moving white solid bars manually (using a “mouse”) around the screen, on foveal as well as parafoveal and peripheral locations, while the animal fixated on the center of the screen. Stimuli ranged in size between 0.05 and 5° in length and between 0.05 and 2.5° in width, and in luminance between 0.01 and 20 cd/m2. When visual responses were detected, the stimulus was adjusted as to orientation, size, direction, and speed of movement for the best response, and the receptive field (RF) was mapped. Trials were then begun with the stimulus flashing on the RF or moving over it at constant speed (from 7 to 70°/sec).
EP was monitored continuously, monocularly, with an optoelectronic system (Dr. Bouis oculometer; Bach et al., 1983) that uses the corneal reflection of an infrared light beam and has a resolution of ∼0.2°. EP signals were sampled at 62.5/sec or 125/sec and stored on hard disk together with the spike signals. Fixation target and other visual stimuli were generated and controlled by a second computer equipped with a graphics board (Matrox PG-1281); the same computer controlled and recorded the behavioral responses of the animals.
Recordings were made from both hemispheres of each animal. One week before the end of the experiments, specific electrode penetrations were performed to place microlesions at selected locations of the cortex. These lesions were later used as landmarks for reconstruction of the recording sites. At the end of the recording sessions, the animals were killed with an overdose of anesthetic. With the brain still in the skull, four short metal rods (0.8 mm in diameter) were inserted perpendicularly to the cortex at fixed chamber coordinates, with the same inclination as the electrodes, to delimit the region underlying the metal chamber. The brains were then removed and examined histologically. The cutting plane was defined by two of the rods inserted previously so that the track of each electrode would lie in one or closely adjacent sections. Electrode tracks were then reconstructed with the help of the microlesions, the chamber coordinates of each penetration, logs of the recording depths and the functional observations made during the penetrations.
The quantitative data analysis was carried out after the experiments. First, the raster plots of the cell discharges, grouped by fixation point or eye movement direction, and temporally aligned with the start of the fixation or the key-down event, were visually inspected and matched with the EP signals. Only fixation periods >1 sec, or eye movements concluding at least the first sweep, were considered for analysis. Then, the mean discharge rate of each fixation point, or SP direction, was calculated within a time window of ∼0.6–1.0 sec, beginning when fixation (or SP) and cell discharge had reached a steady state (usually at least 600 msec after the animal signaled the presence of the target pattern, or after the beginning of the SP ramp). The subsequent analysis and graphical representation of the data, as described in the following section, were done by in-house or commercial computer programs.
RESULTS
We recorded and classified >600 cells in 110 electrode penetrations. Among these neurons, 217 were studied quantitatively for their responsiveness to one or more aspects of oculomotor behavior or visual motion: namely, static EP, direction of SP eye movements, and direction of moving visual stimuli. The penetrations were made mainly through the inferior parietal lobule (Fig. 2), perpendicular to the cortex, up to 8–9 mm from the cortical surface.
Fig. 2.

Penetration sites. A, Sketch of the parietal cortex of a monkey brain reporting the points of penetration made in two different animals (4 hemispheres). B, Histological section at the level of the straight linetraced in A, showing the location of superficial (7a) and deep (MST) cortical areas encountered by electrode tip along penetrations perpendicular to the gyral surface. CS, Central sulcus; IPS, intraparietal sulcus; LF, lateral fissure;LS, lunate sulcus; STS, superior temporal sulcus.
With this approach, combined with the subsequent anatomical reconstruction, it was easy to distinguish the recording sites located in the superficial cortex (within 3000 μm from the pial surface) from those placed deeply (usually between 3000 and 7500 μm from the cortical surface) in the anterodorsal bank of the STS. Only cells found deeper (n = 132) were assigned to area MSTd. Superficial units (n = 72), assigned to area 7a, and units found in the banks of the intraparietal sulcus (n= 11) or in other regions (n = 2) are not considered in this study.
In this paper we describe mainly the discharge rate of MSTd neurons during the slow phase of tracking movements in different directions, in comparison with the activation during the fixation of different points on a two-dimensional screen. We also report, for comparison, the cell responsiveness to conventional visual stimuli moving in several directions across the screen and stimulating either foveal or extrafoveal retinal sites. The aim of the visual test was just to check cell responsiveness to local visual motion and to judge whether retinal slip of single visual objects on the fovea or in the periphery could drive the neuronal discharge. We did not intend to study the complex visual sensitivity of MSTd neurons to global motion of the visual field.
A significant majority of neurons (86 of 132) increased their discharge during the pursuit, tuned to the direction of eye movement. These cells were classified as SP neurons. A set of 38 cells showed a discharge tuned to the instant position of the eyes when the animal steadily fixated several points of the screen and were classified as EP neurons. This set included 14 units of the SP class, whereas 23 were modulated just by EP. The latter neurons, in fact, changed their discharge rate during SP, but not uniformly throughout the entire amplitude of the movement and without directional selectivity. Thus one can suppose that during SP these cells are driven by the current position of the eyes and not by the movement per se. Responsiveness to conventional visual stimuli was found for 33 cells. Some of them (n = 18) were also modulated by SP and others (n = 15) were not.
SP neurons
Of 132 cells assigned to area MST, 86 (65%) were characterized by a discharge rate clearly increasing during the slow phase of tracking in respect to SF. All of these cells showed a clear direction selectivity for the eye movement, and in all cases it was possible to draw a tuning curve for the direction of movement. Figure3 shows the discharge of a typical pursuit-related neuron tested for 16 directions. Figure 3A reports the raster plots of movements made in 12 directions (periodsS–R), demonstrating the evident modulatory effect of the SP direction. Figure 3B displays the direction tuning, traced as a polynomial fitting curve, for all 16 data points.
Fig. 3.
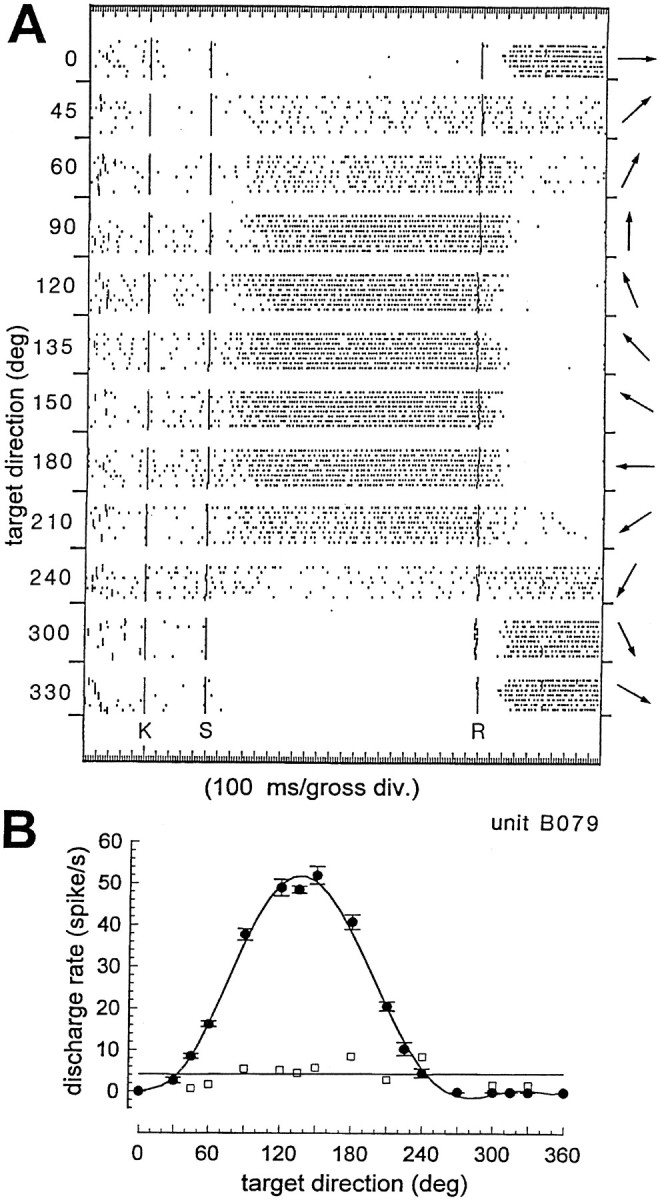
Example of SP-related neuron. A, Raster plots of discharge during SP eye movements in 12 (of 16 tested) directions. Each row of the raster represents a trial, each dot a spike. Numbers on theleft vertical axis and arrows on theright are the directions of target/eye movement for each set of trials. Short vertical lines at the beginning of each trial indicate the target onset. Vertical linesmarked K, S, and Rindicate the key-down event, the starting of the target movement, and the inversion of the target direction, respectively. Amplitude of target sweep is 45°, at 20.5°/sec. Eye movement followed the target after ∼250 msec. B, SP direction tuning curve of the same neuron. Each filled dot with error bars represents the mean discharge, ± 1 SEM, computed on a 1 sec window once the eye has reached a constant speed. The curve is traced by polynomial fitting. Open squares indicate the discharge during the SF periods (K–S in A) before the start of target/eye movement. The straight line is a linear regression of the SF points.
It is highly probable that the discharge of at least part of SP cells is related to eye movement rather than to visual input from the target itself or from the background. First, because a significant number of the cells (68 of 86) failed to respond to small luminous stimuli presented on the foveal region during the preliminary study of each unit, and second because many cells consistently kept firing during SP in the absence of visual targets or when the target was out of the fovea, moving in an opposite direction in respect to the SP. The effects of the absence of visual target were observed during periods after the disappearance of the fixation pattern at the end of each trial. An example is seen in Figure 4, where selected trials are aligned with target-flip event (Fig. 4C) preceding by 200–300 msec the target disappearance (Fig.4C, arrow). It is evident how the discharge continues as the eyes keep going in the same direction for a few hundred milliseconds, whereas it ceases when the SP is interrupted. The mismatch between target and eye direction occurred at the end of each sweep, when the target suddenly inverted its direction of motion. At that moment the eyes continued to move in the previous direction for some hundred milliseconds, before a saccade was made to reach the target moving in the opposite direction (Fig. 5). During this short period, the mismatch between target direction and eye direction does not eliminate cell firing, which is eliminated, however, by the inversion of eye movement. It is also unlikely that cell discharge could be driven by extrafoveal visual stimuli, because the trials were performed with a totally dark background and presence of any stray light was carefully avoided. Furthermore, most neurons failed to show any responsiveness to conventional visual stimuli moving in different peripheral regions of the visual field.
Fig. 4.

Discharge rate during SP without target.Top graph, Raster plot of last portions of selected trials aligned with the target-flip event (C), showing the periods when the target is turned off (arrow) and the eyes continue to move in the previous direction for a short time. Period R–R’ is the third sweep of each trial (in this instance a null direction). Lower traces, Superimposed X and Y EP signals of the same trials represented in the raster plot. The X and Y scales indicate the EP in respect to the straight-ahead (0) position. Positive numbers on the X scale mean rightward positions, negative numbers leftward positions. Positive numbers on the Y scale indicate upward, negative numbers downward displacements.
Fig. 5.

Discharge at the inversion of the target direction. Top, Raster plot of an exemplary set of trials during SP movement in opposite directions. T,K, S, and R indicate the trial phases as in Figure 1. Amplitude of target sweep is 35°, at 22°/sec. Target/eye directions for periods S–R and R–R’ are 330 and 150°, respectively. Bottom, Eye traces withX and Y scales as in Figure 4. Note that when the target suddenly inverts its direction of movement (eventR), the eyes continue to move in the previous direction for a while before changing the direction to catch the target with a saccade. During this period, target and eye directions are opposed. The discharge rate is in phase with the direction of eye movement more than with the direction of retinal slip.
Typically, SP units presented a low-to-medium discharge rate during SF before the start of target movement. Firing rates measured during these periods ranged from 0 to 32 spikes/sec (mean, 6.7; SD, 7.6). The discharge increased or decreased in respect to SF once the eyes started to move during the slow phase of the tracking. For the majority of these cells, the maximum discharge rate, in the preferred directions, was reached after a few hundred milliseconds from the starting of the eye movement ramp and was maintained for the entire pursuit in the same direction, regardless of its amplitude. Peak rates at preferred directions ranged between 10 and 87 spikes/sec (mean, 29.7; SD, 17.4). For each SP neuron, the discharge in the preferred direction increased by at least 50% compared with the discharge before the movement. Usually it was several times greater. For all neurons modulated by SP, the difference between the maximum mean discharge rates and firing during SF was at least four times the SEM. The average difference was 11.6 SEM.
The mean discharge rate, measured once it reached its steady state, was clearly tuned to the direction of the slow eye movement, being increased up to a maximum at the preferred direction and usually inhibited (decreased below SF activity) in the null direction (when the SF firing was >0). For almost all SP units, we drew the tuning curves for movement direction by sampling the mean discharge rate for 12 directions, in steps of 30°. Sometimes the sampled directions were reduced to eight, at a distance of 45° from each other. The tuning curves, traced by polynomial fitting, were typically monophasic. The increments of discharge rate for the preferred directions in respect to the null directions were as low as 2.43 times and as high as 518 times; the mean was 66 times.
The bandwidths of the tuning curves, measured as full width at half height ranged between 70° and 200° of arc, with an average of 130°. To compare the bandwidths of the whole population, we normalized all the tuning curves of 80 SP neurons and plotted them on the same X–Y chart, aligned with the preferred direction. Figure6A shows the superimposed curves, together with the relative ongoing activity during SF (Fig.6A, straight lines).
Fig. 6.
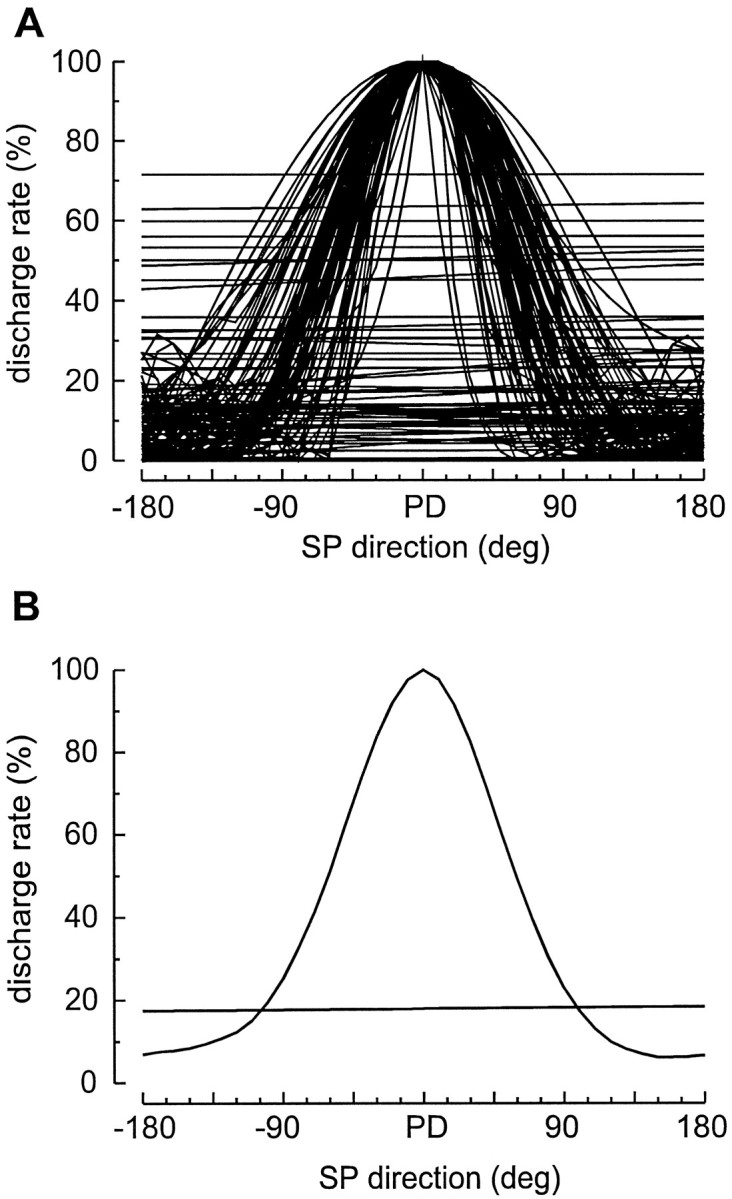
SP direction tuning curves. A, Cumulative plot of normalized SP direction tuning curves of 80 SP units. Each curve is obtained by sampling the mean discharge rate during pursuit in at least eight directions (usually 12) in steps of 45° (usually 30°) and drawing a polynomial fitting curve to the points. Actual directions are disregarded to superimpose the curves aligned with the preferred direction (PD). Horizontal scale is relative to the PD. Horizontal linesare the linear regression functions of discharge during SF, before the start of the target movement. Units, the discharge of which was modulated by SF to different positions, are not included in this set.B, Averages of all the tuning curves and regression lines shown in A.
It is evident how the curves cluster around a mean function, the bandwidth of which is ∼130° wide. The average of all these curves is shown in Figure 6B, which also shows the average of all the discharge lines during SF. To better express the dispersion of bandwidths of this sample, we plotted their frequency distribution grouped in classes of 30°. Figure 7 reports such a histogram. It demonstrates that 79% of bandwidths are included in a range between 90° and 180°, with a peak class from 120° to 150°.
Fig. 7.

Frequency distribution histogram of SP tuning curve bandwidths. Bandwidths, measured as full width at half height, of 80 SP direction tuning curves, grouped in classes of 30°; 79% of bandwidths are included in the range between 90 and 180°.
Preferred directions (peaks of the tuning curves) for the whole-cell population of our sample spanned the whole 360°. To determine whether there was any lateralization of the preferred directions, we reported in separate files the tuning curves of units recorded from left and right hemispheres. Then, we considered as leftward-oriented all curves the peak of which was from 90° to 269° and as rightward-oriented curves with peaks between 270° and 89°. The distribution of the peak directions for left and right hemispheres is illustrated in Figure8A.
Fig. 8.
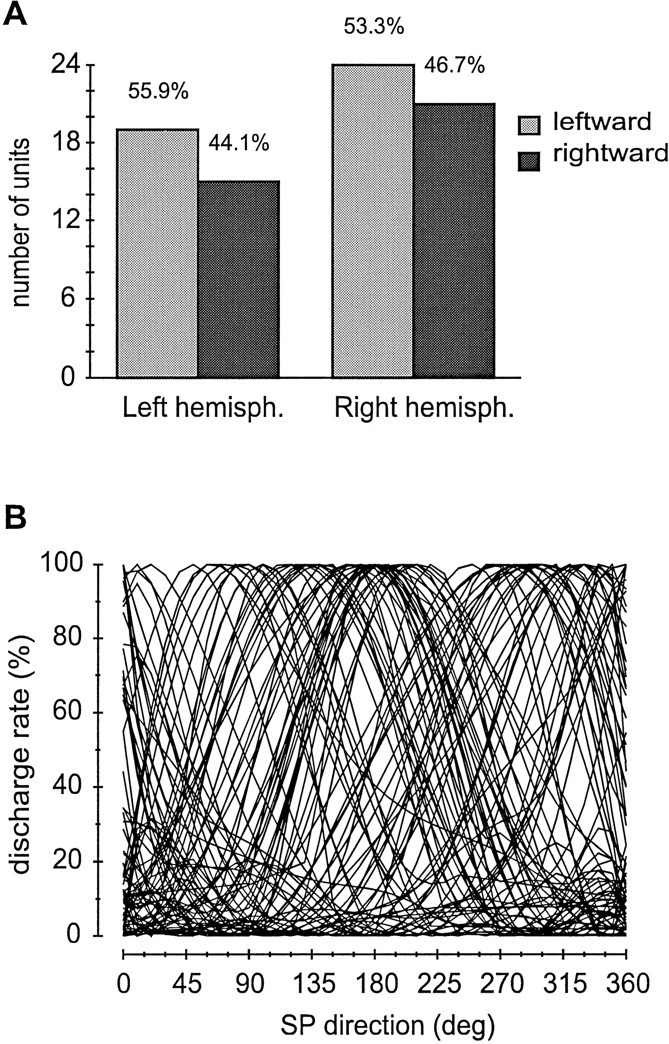
Spatial distribution of preferred directions of SP tuning curves. A, Histogram of preferred directions (peaks of SP direction tuning curves) grouped by cerebral hemisphere and leftward/rightward preferences. Tuning curves with peak from 90 to 269° were included in the leftward class; curves with peaks from 270 to 89° were included in the rightward class. In both hemispheres leftward and rightward preferences seem quite balanced.B, Cumulative plot of 80 SP direction tuning curves, normalized and reported with their real directions. Note the wide overlapping of the tuning curves, which might be the basis for a vectorial coded representation of SP direction in area MST.
Figure 8A shows that the occurrence of both left and right directions is fairly balanced in each hemisphere, without any evident sign of lateralization. On the basis of this result, we reported the normalized curves of all SP neurons, with their current preferred direction, on the same chart (Fig. 8B). The graph documents how preferred directions distribute uniformly throughout the 360° and how the curves widely overlap each other.
An additional group of six units, all with ongoing discharge during SF, showed a mild-to-strong reduction of the firing rate during SP movements without modulation by the direction of movement. Because no SP tuning curve could be drawn, they were not included in the SP class. Four of these cells presented evident visual responses, with direction modulation, and were then included among the visual motion neurons. The other two were placed in the group that was not classified.
EP neurons
EP-modulated neurons accounted for 38 of 132 quantitatively studied in area MST. Their activation features during SF have been described in a previous paper (Squatrito and Maioli, 1996). Here we summarize those static characteristics and describe the dynamic activation during SP of the same cell population. EP neurons are tonically influenced by the angle of gaze when the animal steadily fixates a point in space. Their discharge is spatially modulated, and the firing rate profile for fixation points on a plane in front of the animal is referred to as gaze field (GF). By sampling a relevant number of fixation points for each cell and fitting a surface to the mean firing rates, we found that the majority (32 of 38) of EP neurons showed GFs that took the form of a nearly planar surface best characterized as a ramp tilted toward a hemifield or quadrant of the visual field, with the axis oriented toward a cardinal or diagonal direction. Figure 9 exemplifies two of these ramp-shaped GFs by reporting the mean discharge rates for a grid of fixation points. For each example, the discharge is represented in the form of bubble plot that gives a two-dimensional image of the discharge profiles, and as a three-dimensional chart that allows a better representation of the GF by fitting a three-dimensional surface to the data points. The fitting curves were drawn by means of a double polynomial expansion calculated by Taylor–McLaurin series (Draper and Smith, 1981).
Fig. 9.
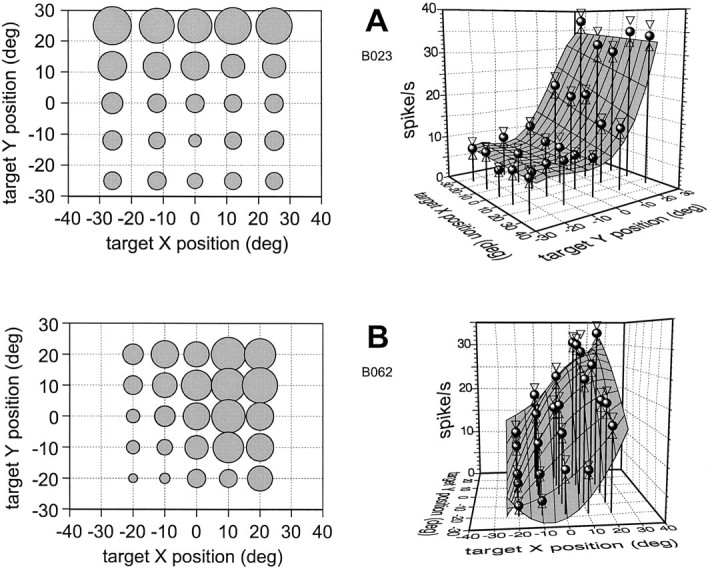
Examples of the main type of GF of EP neurons in MST. A, Left panel shows a bubble plot in which the area of each circle is proportional to the cell discharge when the animal fixates the point of the screen where the circle is centered.Right panel is a three-dimensional representation of the GF by a surface fitting the mean frequencies for different gaze positions. The base of the graph represents the screen. Eachround symbol expresses the mean firing rate for fixation at the point of X and Y intersection to which each data symbol is anchored. Opposed triangles show the SEM. The shaded surface is drawn by a computer algorithm that finds the best fitting surface using double polynomial expansion. Note that in this case the GF has a nearly planar surface, with a ramp rising mainly along the y-axis and shifted toward the top half of the visual field. B, A second example of ramp-shaped GF oriented toward a diagonal direction. These two examples are picked from the same cell population of EP-related neurons described in more details in a previous paper (Squatrito and Maioli, 1996).
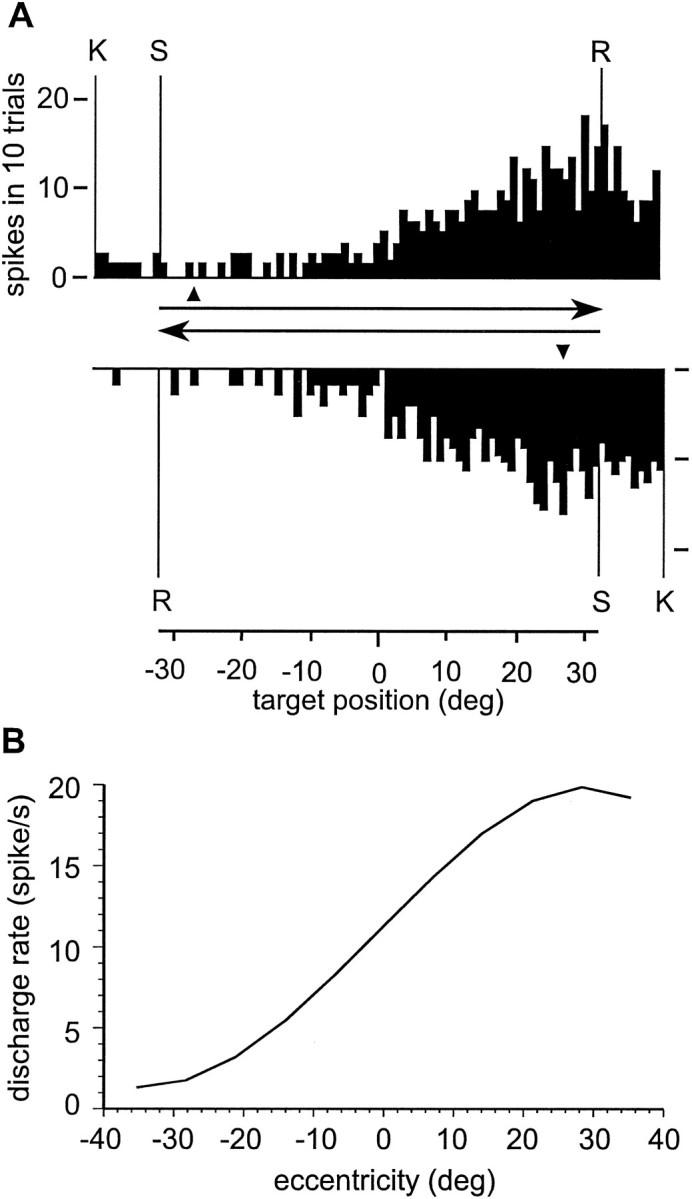
All orientations round the primary position were actually represented. The ramps were shifted eccentrically with respect to the straight-ahead position, and with a midpoint centered between 0 and 20° of gaze eccentricity and saturation between 10 and 35°. Figure10 shows the average of 30 ramp profiles of neurons recorded in MST, regardless of their orientation.
Fig. 10.

Average of the ramp profiles of 30 EP units recorded in area MSTd. The curve has been obtained by expressing each GF of the type illustrated in Figure 9 as a line describing the profile of the surface along the main gradient, and then averaging all the normalized curves. The current orientation of the ramps has been disregarded and the resulting curve has been expressed in terms of eccentricity of the gaze in respect to the straight-ahead fixation. Thezero point on the abscissa represents the primary gaze position. Positive values mean displacement of the gaze along the main direction in which the neuronal discharge rises; negative values gaze eccentricities in the opposite direction. The resulting curve shows how EP neurons in area MSTd can signal the static eccentricity of the gaze. This curve has been obtained by a subset of the cell population described in more details in a previous paper (Squatrito and Maioli, 1996).
Only a minor group of cells (6 of 38) presented a GF forming a dome-like surface (not illustrated here) covering a limited region of the visual field. Pure EP neurons seem to carry mainly an EP signal, because they are not activated by conventional visual stimuli.
EP cells were also activated during SP when the target was moving within the high discharge region of GF, but the activity profiles of EP neurons during eye movement were different from those of SP neurons in two aspects. (1) The discharge rate of EP neurons gradually increased or decreased with eye displacement, according to the GF ramp, whereas SP neurons reached the maximum discharge rate soon after the onset of the eye movement, regardless of the starting point of the movement, and maintained it unchanged until the end of the sweep; and (2) EP neurons did not show eye movement direction selectivity in the region (quadrant or hemifield) of high discharge rate, whereas SP neurons were characterized by a clear directionality regardless of the position of the eyes. Figure 11A documents these dynamic features of EP cells by showing temporal histograms of the discharge of an EP neuron during SP in two opposite directions. The two histograms are matched for target position to better compare their spatial profiles. Note that in the same hemifield (positive target positions), the discharge is modulated by the EP but not by the direction of movement. Figure 11B also shows, for comparison, the GF profile in the same direction. The match between the modulation profiles because of SF and the firing increase during SP is evident. Thus, it is likely that these neurons are driven only by the position of the eyes.
Fig. 11.
Activation of an EP neuron during SP.A, Temporal histograms showing the discharge of an EP neuron before and during SP movements in two opposite directions. Eachcolumn represents the cumulative number of spikes, in 10 trials, in bins of 50 msec. Trial events are K,S, and R, as in Figure1D. Horizontal arrows indicate the relative target directions during S–R intervals for top andbottom histograms. Current directions are 0 and 180° fortop and bottom diagram. Histogram columns of the two plots, for the intervals S–R, are matched for target position. Thetriangles at the base of each histogram point to the start of the eye movement ramp. From this point on, target and EP are matching. B, GF profile of the same unit in the main direction of the ramp (left to right). The curve is extracted from the fitting surface expressing the GF of the unit obtained by a grid of 15 fixation points spread over a frontal plane of 70 by 60°. Values on the abscissa, as in Figure 10. The increase or decrease of the firing rate during SP clearly seems a result of the instant position of the eyes, not the direction of eye movement.
Visual responses
We carefully tested all recorded neurons for responsiveness to conventional visual stimuli, flashed or moved at different speeds on the screen. Of the whole population of 132 cells recorded in MST, only 33 presented unequivocal visual responses to small stimuli or to solid luminous figures. Some (n = 18) also showed a modulation by SP, whereas others (n = 15) did not. Almost all visual responsive cells were driven by luminous bars moving across the screen, one was excited also by stationary flashing stimuli, and two presented only an inhibitory response to moving bars. Twenty-two units, among those activated by moving stimuli, presented a conventional RF with direction selectivity. RFs were very large and located contralaterally, often including the vertical meridian. Measured average size of RFs was 40 × 40°, but the value may be underestimated because RFs often extended beyond the border of the screen so that accurate measurement was not possible. Nine units were characterized by a large RF centered on the fovea and responded to radial stimulation, being best activated by stimulus movements centripetal or centrifugal in respect to the fovea.
Tuning curves for direction of visual motion were drawn by plotting the mean discharge rates for different stimulus directions; 8–12 directions were sampled. The tuning curves of the whole sample collected were strictly comparable to those obtained for SP directions. Figure 12A shows the average of 27 normalized tuning curves for direction of visual motion obtained from as many visual responsive units. The distribution of bandwidths for this sample is shown in Figure 12B. The similarities between the encoding processes of visual motion and eye movement directions are quite evident.
Fig. 12.

Spatial properties of visual motion direction tuning curves of MSTd neurons. A, Tuning curves for direction of visual motion of conventional stimuli have been drawn for 27 neurons of area MSTd responsive to conventional visual stimuli by polynomial fitting a curve to the mean discharge rates of 8–12 directions of stimulus motion. The tuning curves have been normalized and averaged, disregarding their real preferred direction. The resulting average curve is shown in this panel. B, Distribution of visual motion tuning bandwidths (full width at half height) for the same units of A, grouped in classes of 30°. Also for visual motion, as for SP direction, the great majority (85%) of the bandwidths are included in the 90–180° range. These results emphasize the similarities in spatial properties of neurons signaling visual motion or SP direction, in area MSTd. These similarities suggest that directions of moving objects and of pursuit eye movements are encoded by comparable neuronal operations.
Mixed types
All the cells recorded were tested for SP and visual motion directionality as well as for static EP dependence. Although many of them had their discharge modulated by just one of these modalities, some were influenced by more than one of them, with different degrees of blending.
SP and EP signal mixing
A subset of SP neurons (n = 22) was characterized by a modulation of the discharge rate because of both SP direction and gaze position during the eye movement. That is, at least in some directions of tracking, the firing rate of these cells was not sustained for the whole amplitude of the movement but increased (or decreased) as the eyes moved to a specific region of the visual field. This activation pattern resembles that of EP neurons. Nevertheless, unlike EP cells, the movement in the null direction eliminated the discharge even in the region of high firing rate, demonstrating that these cells had an evident direction preference. The substantial difference with pure EP neurons, however, is that these cells did not show a GF during SF, or if they had one, the modulation by EP during SF was much less than the modulation by SP. Figure 13shows an example of an SP neuron influenced by EP. The figure presents paired temporal histograms of cell discharge during eye movement in preferred and null directions. In the top histogram (preferred direction), the discharge rises soon after the starting of eye movement (Fig. 13, triangular mark), reaching a maximum at ∼200 msec, but then decreases gradually as the eyes move to the bottom right quadrant of the screen. In the lower histogram (null direction), the cell is almost silent for the whole extension of the eye movement. Figure 14 provides a wider account of the cell behavior during SP, showing discharge histograms for several directions. The top chart reports the discharge profile for the preferred directions, whereas the lower plot shows the discharge for null directions. It is evident that the firing during pursuit is maximum for directions left to right and up to down, but only in the top left quadrant. Slow movements, in the same quadrant but in opposite directions, are ineffective. We refer to this subset of SP neurons as SP “position dependent” (SPpd), to stress this mixing of EP and eye direction signals. Note in Figure 13 that during periods K–S of the two diagrams, corresponding to the firing rates during SF of two opposite points on the screen, the cell does not change its discharge, showing a lack of modulation by steady EP. Actually, the cell, tested for SF modulation with a grid of nine fixation points, did not present any GF. This was the typical result for SPpd neurons. The next example (Fig.15) shows an instance of an SP neuron the discharge during eye movement of which depends on EP, but is characterized also by some modulation by static EP.
Fig. 13.

Example of neuron modulated by EP during SP. Temporally matched discharge histograms before and during SP in two opposite directions of movement. Each column represents the cumulative number of spikes, in 10 trials, in bins of 50 msec. Trial events are K, S, andR, as in Figure 1D.Horizontal arrows indicate the relative target directions during S–R intervals for the two histograms. Current directions were 300 and 120° for the top and bottom histogram, respectively. Histogram columns, for intervals S–R, are matched for target position. The triangles at the base of each histogram point to the start of eye movement ramp. From this point on, target and EP are matching. The neuron discharge in the preferred direction decreases with the position of gaze, showing some dynamic influence of EP on SP direction coding. Nevertheless, SF does not modulate the neuron, because discharges during fixation of opposite points of the screen (K–S periods) are not different.
Fig. 14.

Activation of an SPpd neuron during eye movements in different directions. Three-dimensional plots of discharge histograms in different directions of the same neuron presented in Figure 13. The base of each plot represents the visual field delimited by the trajectories of SP movements in 14 directions. Amplitude of each target sweep is 45°. The direction of target movement is indicated by the long arrows. Curve points anchored to the base, along each diagonal line, report the number of spikes in 10 trials in bins of 50 msec. Only S–R periods are plotted. Top plot reports 7 directions with the highest discharge rates.Bottom plot depicts the directions opposite the preferred ones. It is clear how this cell discharges for eye movements directed toward the bottom right quadrant, but only when the gaze is in the top left quadrant.
Fig. 15.

Example of SP neuron dynamically and statically influenced by EP. Temporally matched discharge histograms before and during SP in two opposite directions of movement. Eachcolumn represents the cumulative number of spikes in 10 trials in bins of 50 msec. Trial events are K,S, and R, as in Figure1D. Horizontal arrows indicate the relative target directions during S–R intervals for topand bottom histograms. Current directions were 135 and 315°, for top and bottom histogram, respectively. Histogram columns, in the intervals S–R, are matched for target position. The triangles at the base of each histogram point to the start of the eye movement ramp. From this point on, target and EP are matching. As in the example of Figure 13, the neuron discharge in the preferred direction decreases with the position of the gaze, showing a dynamic influence of the EP. In addition, SF modulates the neuron in this instance, because discharge rates during fixation of opposite points of the screen (K–S periods) are different. Nevertheless, the modulation by SP is much stronger than that by static EP.
This example is similar to the one presented in Figure 13, except for the different discharge during periods K–S, evidence of a static EP modulation. It is noteworthy, however, that such a modulation affects the cell discharge much less than the eye movement. A similar modulation by static EP was evident in only 7 of 22 SPpd neurons. Given the small number of these cases, it is not possible to make any statement about possible relationships between GF orientation and SP preferred direction in these units. In summary, EP influence on SP neurons is most often evident only during eye movement, whereas the ongoing discharge before the onset of the movement could be unmodulated or poorly modulated by the gaze shift. When both static and dynamic forms of modulation were present, these cells presented both a typical GF and a typical SP direction tuning curve, but the latter always reached definitely higher discharge rates than the former.
Finally, a mild modulation by static EP, with typical GFs, was also present in SP neurons (7 of 64) not influenced by EP during eye movement, proving again some convergence of directional and positional signals on single units. Also in these cases, however, eye movement direction selectivity largely prevailed over EP modulation.
SP and visual signal mixing
Eighteen cells were activated by both SP and visual stimuli. In these cases, the responses to visual stimulation could be less than, equal to, or greater than the activation by SP. Figure16 gives examples of cells activated by SP as well as by moving luminous bars. The tuning curves for eye movement and stimulus movement directions are reported on the same polar plots for each unit, to compare firing rates in the two conditions. The figure also shows how cells with sensitivity to both eye movement and visual motion usually presented the same orientation of the tuning curves for the two modalities, as well as comparable bandwidths.
Fig. 16.

Comparison of SP and visual motion direction tuning curves. A–C, Three examples of neurons activated by both SP and visual motion. Each polar plot depicts the tuning curves for SP (black dots and thick curves) and visual motion (open circles and thin curves) directions. In the three instances, the discharge rate during SP is less than, equal to, or greater than during visual motion of conventional visual stimuli. Preferred directions and bandwidths are always equal for both modalities. These examples might be interpreted as a continuum transition within a cell population from local visual motion to pursuit direction encoding.
In very rare instances cells showed more complex activation profiles, being influenced in varying degree by more than two modalities. Actually, the whole picture of features activating MSTd neurons is a complex one, showing cells driven only by one modality (direction of SP, static EP, or conventional visual stimuli) and other mixed types presenting responsiveness to different combinations of SP direction, EP, and visual signals.
A summary of the quantitative distribution of our sample, in respect to the modality of activation, is represented in Figure17, by a chart inspired by Venn diagrams, in which each circle of different area represents the number of units influenced by each feature. The chart shows that the majority of cells (80 of 132) are driven only by one modality. Nevertheless, a substantial number of units (44 of 132) are characterized by mixed features, suggesting that some interaction of signals related to eye movement direction, static EP, and visual motion direction may exist at the single unit level.
Fig. 17.

Quantitative distribution of different classes of neurons. Diagram showing the quantitative distribution of studied neurons in area MSTd according to their activation features related to SP, EP, and local visual motion. The area of each circleis roughly proportional to the number of neurons activated by the feature indicated by the abbreviation. EP, Static eye position; SP, smooth pursuit; VM, visual motion; SPpd, SP position dependent. The latter category is included inside the SP group because it is considered a subset of SP neurons. Intersecting areas indicate subsets of neurons activated by more than one modality. Numbers inparentheses indicate the number of units in each circle.Numbers inside the circles indicate the number of units in each subcategory. The diagram does not include eight more units classified as “others,” showing further different functional profiles, such as nondirectional inhibition by SP, activation by saccades, etc.
Eight more units, showing further different functional profiles, such as nondirectional inhibition by SP, activation by saccades, etc., are not shown in the diagram.
Anatomical location
Single-unit recording sites were identified on the basis of functional observations made during the recording sessions (such as the sequence of gray and white matter, as judged by the background biological activity, and the main functional features of the cells in the recorded region), and reconstruction of the penetrations using electrode coordinates and the purposely placed microlesions (see Materials and Methods).
Cells encountered in the superficial cortex of the inferior parietal lobule, i.e., within 3000 μm from the cortical contact of the electrode tip, and before any electrophysiological sign of white matter penetration, were presumed to be in area 7a. In this area, in addition to neurons related to static EP, we found a large number of units driven by motion of traditional visual stimuli, with directional selectivity. Many visually responsive cells had large, often bilateral RFs ranging in size from 20 × 20° to >60 × 60°. Often the RFs exhibited opponent vector organization (Motter and Mountcastle, 1981). SP-related cells were rare in this region.
Units encountered between 3000 and 7500 μm from the cortical surface, usually after signs suggesting white matter recording, were assigned to the anterodorsal bank of the STS. Postmortem reconstruction of the recording sites on flat maps of the caudal half of STS (Fig.18) confirmed that almost all the deep recording region was located in the anterodorsal bank of the STS, between the fundus and the lip of the sulcus, the region topographically identified as area MSTd. All units reported in this paper were located in this area.
Fig. 18.

Anatomical cell distribution. A,B, Flat maps of the recording regions in the two hemispheres from which data have been collected, reconstructed according to the method described by Van Essen and Maunsell (1980). The regions represented by the maps correspond to the slashed areas in Figures A’ and B’. Each thin line represents the fourth layer of a histological section oriented as the lines of the slashed regions in Figures A’ and B’. The average distance between sections is 400 μm. Thick lines represent the lips of sulci. Dotted lines indicate the fundi of sulci. Only units located in the dorsal bank of the STS, a region topographically corresponding to area MSTd, are reported in this figure. Different symbols represent different cell categories:solid triangles, EP neurons; solid dots, SP neurons (not influenced by EP); stars, pure visual responsive cells; open circles, cells activated during SP, dynamically influenced by EP (SPpd); half-filled circles, SP neurons with static EP modulation; open squares, units activated by both SP and visual motion;crosses, units activated by more than two modalities.IPS, Intraparietal sulcus; LS, lunate sulcus; LF, lateral fissure; STS, superior temporal sulcus. In each map, the rostrocaudal dimension is expanded by a factor of 2. Although same symbols tend to form small clusters, different categories are intermingled without an ordered pattern.
Neurons of the different types described above were usually found close to each other over distances of a few tens of micrometers along each electrode penetration, although the occurrence of cells of the same class along contiguous electrode tracks suggested that they were grouped in clusters of the same modality. Nevertheless, our experiments did not reveal any segregation of the different modalities in the cortex, because pairs of neurons of the same modality seemed to be intermingled with cells of different functional features (Fig. 18). Moreover, neurons of the same modality very close to each other in space often showed disparate, and at times opposite, GF ramp orientations or SP preferred directions.
DISCUSSION
Neural activity within the area MST of the macaques is associated with the perception of moving objects, as well as with global visual field movements such as those occurring during self-motion (Desimone and Ungerleider, 1986; Saito et al., 1986; Tanaka et al., 1986; Duffy and Wurtz, 1991; Graziano et al., 1994). At the same time, the discharge of MST neurons is correlated with slow pursuit eye movements (Sakata et al., 1983; Kawano et al., 1984; Newsome et al., 1988). At present, two main pursuit-related areas have been identified in this region (Komatsu and Wurtz, 1988): MSTl, located in the posterior bank and floor of the STS, and MSTd, located on the anterodorsal bank of the sulcus. Neurons in these areas fire with direction selectivity when the animal tracks a visual target in the dark. Some of them, found especially in MSTd and in lesser amount in MSTl, carry a pure oculomotor signal. In addition to this “dynamic” feature, related to the slow eye movements, it has also been found (Squatrito and Maioli, 1996) that some neurons in area MSTd are tuned to more “static” features, namely EP during SF.
We have attempted a detailed quantitative study of the discharge modulation of MSTd neurons by slow eye movement direction and by EP. The main result of this research is that neurons of area MSTd are able to signal SP direction and EP with coherent changes in their discharge rates, expressible as tuning curves for eye movement direction and as GF for SF. These signals are conveyed mainly by separate cellular populations. Nevertheless, some SP cells are modulated also by EP, suggesting some sort of interaction between the two signals. We will briefly discuss the topics of anatomical assignment of the recorded cells to known cortical areas, the possible source of the signals the neurons convey, and the functional interpretation of the results.
Anatomical localization
We made electrode penetrations perpendicular to the cortex through the medial region of the inferior parietal lobule. The superficial cortex of this region corresponds to area 7a (Andersen et al., 1985), the neurons of which are specifically activated by visual and oculomotor events (Motter and Mountcastle, 1981; Andersen et al., 1987;Steinmetz et al., 1987). The functional features of the cells that we recorded in the superficial part of our electrode penetrations were similar to those reported for this area. In this region, neurons were driven by gaze fixation or responded to moving visual stimuli with direction selectivity. Opponent vector organization of the RFs (Motter and Mountcastle, 1981) was commonly encountered. Very few cells discharged during SP eye movements.
Underneath this region, the upper bank of the STS is encountered, where part of the MST complex is located. Both the topography and cellular response characteristics of the deep region of our recordings were comparable to those of area MSTd. All cells we have considered for this paper were located in the anterodorsal bank of the STS, between the fundus and the lip of the sulcus (Fig. 18). Most of the cells were activated during SP eye movements, with direction selectivity, but were poorly responsive or not responsive at all to conventional moving visual stimuli, suggesting a probable extraretinal input typical of MSTd. Although the number of cells in our sample responding to visual motion is small compared with that of previous reports (Komatsu and Wurtz, 1988), in which almost all cells were found responsive to visual stimuli (either small figures or large random-dot fields), this discrepancy may well be a result of our not testing the cells with large textured fields. Nevertheless, when visual responses were present, RFs were large, often including an entire quadrant or hemifield, as is exemplary for area MSTd.
Retinal or extraretinal input?
The issue of retinal versus extraretinal input to SP-related neurons in area MST has been examined by previous reports (Sakata et al., 1983; Newsome et al., 1988). Two sources of visual input may be taken into account as a possible drive for the cells: the presence of the target itself on the foveal region and movement of a visible background relative to the retina because of eye movement.
We did not systematically perform tests aimed at differentiating between retinal and extraretinal signals on SP cells, such as blinking of the target or stabilization of the retinal image during SP. Nevertheless, we have some clues suggesting that in most cases the discharge during SP was driven by extraretinal input. First, the stimulation of the foveal region with luminous figures, matching the target by size and luminous intensity, mostly failed to activate the cells. Second, the SP-related discharge rate of most neurons seemed to be independent of the presence of the target when at the end of the trials the target went off and the eyes kept moving in the same direction for a short time; however, the discharge ceased when the SP ended and was replaced by a saccade. Furthermore, when the target suddenly inverted the direction of motion and the eyes continued to move in the previous direction, the discharge rate was maintained until the eye direction changed, regardless of the inverted direction of the retinal slip.
It is also unlikely that extrafoveal stimuli drove the responses during SP, because experiments were carried out with the animal in a totally dark environment and the luminance of the monitor screen was kept to zero. Although we cannot exclude the possibility that in some visually responsive SP cells some undetected visual stimuli might have contributed to the discharge, it is reasonably probable that in many cases the discharge was driven by an extraretinal input related to the smooth eye movement.
Functional interpretation
Area MST is currently regarded as a “high level” visual area specifically processing visual motion on the sensory side and performance of SP on the oculomotor domain. An integrative visuomotor function of MST is suggested by the functional features of its cells. MST neurons, in fact, show responsiveness to local and global visual motion, with specificity not only for translational but also for rotational components and for expanding/contracting or spirally moving visual fields. All of these visual cues are important both for the perceptual analysis of the visual motion in the three dimensions of space and for the control of self-motion, from eye movements to head rotation and body movements. On the oculomotor side, neurons of MST discharge during SP, with and without retinal input, and lesions in that area produce impairment in SP initiation and maintenance (Dursteler and Wurtz, 1988).
This interpretation of the role of MST as visuomotor interface is confirmed by its anatomical connections, because MST receives its main input via sensory areas such as MT (Maunsell and Van Essen, 1983;Ungerleider and Desimone, 1986), and efferent fibers of this region reach a number of oculo- and body movement-related centers, such as frontal eye field, superior colliculus, pontine nuclei, etc. (Boussaoud et al., 1990, 1992).
The results of the present paper, limited to area MSTd, emphasize the sensorimotor transformations occurring in this area and provide some new elements for the interpretation of its role in visuomotor representation. The relative broad range of SP tuning curves, along with opponent excitatory/inhibitory directions and their wide overlapping, suggests that SP direction in this area may be encoded according to a vectorial model, similar to direction encoding of other body movements, such as voluntary limb movements (Georgopoulos et al., 1983). The similarities of tuning curves for local visual motion and SP directions demonstrate that the encoding of SP and visual motion directions is accomplished through neurons that operate with similar ranges and resolution. Moreover, the occurrence of both signals in individual neurons, with same directionality, similar bandwidths, and sometimes the same strength, mean that some cells are equally able to signal the direction of local motion and eye movement. The examples reported in Figure 16 might be interpreted as a continuum transition, within a cell population, from local visual motion to pursuit-direction encoding.
On the other hand, directionality of visual stimuli and/or of eye movements are not the only signals computed by MST cells. Pure EP signals, conveyed by neurons anatomically close to direction-specific elements, may be used for encoding the instant eccentricity of the eyes in precise directions (Squatrito and Maioli, 1996). This suggests that the position of the eyes in the orbits is an important cue for spatial analysis of visual field and eye movements. EP signals, added to the information processing related to computation of SP direction or to detection of global motion, may be important for eye/head coordination during tracking as well as for control of body posture during self-motion. Psychophysics experiments (Royden et al., 1992, 1994) have concluded that extraretinal information about EP is important for perceiving heading accurately, despite former reports (Warren and Hannon, 1988) stating that optical flow is sufficient for perceiving the direction of self-motion. Our results may provide neurophysiological evidence that EP signals do indeed contribute to the computation of the global field motion analysis, during both SF and pursuit eye movements.
It is noteworthy that the two oculomotor features, SP direction and instant EP, are computed in MST cortex in different ways. Considering a radial frame of reference centered on the primary position of the eyes, it seems evident that eye movement direction is computed according to a vectorial coding model, whereas eye eccentricity is represented according to a scalar coding model. This might well be the basis for a summation of the two signals, leading to their integration into more advanced neuronal elements.
Even though in area MSTd signals related to SP direction and EP are mainly present in separate neuronal populations, the finding of a class of neurons like SPpd demonstrates that direction and position signals might indeed combine in individual cells, and neurons characterized by an SP direction tuning curve and a GF for static fixation (see example in Fig. 15) may substantiate some sort of summation of the two signals. Nevertheless, this integration might be more complex than a simple summation, because most SPpd neurons do not show modulation by static EP although they are “dynamically” modulated by EP during pursuit. This could be interpreted as a concurrence of other signals, in addition to EP, which enhance the cell response during SP in specific EPs (whereas EP input alone is not sufficient to drive the cell). Alternatively, it might be that some EP neurons act as inhibitory interneurons on SP cells, cutting down their discharge when the eyes reach the top of the GF ramp. This could serve the purpose, in eye/head coordination, of switching off the SP direction signal when the eyes reach a peripheral position in the orbits.
Although a detailed discussion of the theoretical implications entailed by such compound signals is beyond the scope of this paper, we can conclude in a general sense that the heterogeneity in functional properties of MST neurons stressed in this paper emphasizes the role of this area in visuomotor integration works. Nevertheless, because some signals are still largely separated at this stage, MST seems to be a transitional area in the transformation processes leading from visual field analysis to body movement control. The signal mixing appearing in some MST neurons could be more evident in downstream cerebral regions receiving input from MST and performing further synthesis in the sensorimotor integration processes.
Footnotes
This research was supported by grants from the Italian National Council of Research (CNR) and the Department of University and Scientific Research of the Italian Government (MURST). We are indebted to Mr. Andrea Meoni for his important technical contribution in the training of the animals and in the daily laboratory operations, and to Dr. Boaz Samolsky-Dekel for his help in the reconstruction of the anatomical maps. We also thank Leonida Sabattini and Giuseppe Mancinelli for mechanical and electronic assistance, as well as Chemical Industries Bracco for supplying the neurosurgical cement.
Correspondence should be addressed to Dr. Salvatore Squatrito, Department of Human and General Physiology, University of Bologna, Piazza di Porta S. Donato, 2, 40127 Bologna, Italy.
REFERENCES
- 1.Andersen RA, Asanuma C, Cowan WM. Callosal and prefrontal associational projecting cell populations in area 7A of the macaque monkey: a study using retrogradely transported fluorescent dyes. J Comp Neurol. 1985;232:443–455. doi: 10.1002/cne.902320403. [DOI] [PubMed] [Google Scholar]
- 2.Andersen RA, Essick GK, Siegel RM. Neurons of area 7 activated by both visual stimuli and oculomotor behavior. Exp Brain Res. 1987;67:316–322. doi: 10.1007/BF00248552. [DOI] [PubMed] [Google Scholar]
- 3.Bach M, Bouis D, Fischer B. An accurate and linear infrared oculometer. J Neurosci Methods. 1983;9:9–14. doi: 10.1016/0165-0270(83)90103-6. [DOI] [PubMed] [Google Scholar]
- 4.Boussaoud D, Ungerleider LG, Desimone R. Pathways for motion analysis: cortical connections of the medial superior temporal and fundus of the superior temporal visual areas in the macaque. J Comp Neurol. 1990;296:462–495. doi: 10.1002/cne.902960311. [DOI] [PubMed] [Google Scholar]
- 5.Boussaoud D, Desimone R, Ungerleider LG. Subcortical connections of visual areas MST and FST in macaques. Vis Neurosci. 1992;9:291–302. doi: 10.1017/s0952523800010701. [DOI] [PubMed] [Google Scholar]
- 6.Desimone R, Ungerleider LG. Multiple visual areas in the caudal superior temporal sulcus of the macaque. J Comp Neurol. 1986;248:164–189. doi: 10.1002/cne.902480203. [DOI] [PMC free article] [PubMed] [Google Scholar]
- 7.Draper N, Smith H. Applied regression analysis. Wiley; New York: 1981. [Google Scholar]
- 8.Duffy CJ, Wurtz RH. Sensitivity of MST neurons to optic flow stimuli. I. A continuum of response selectivity to large-field stimuli. J Neurophysiol. 1991;65:1329–1345. doi: 10.1152/jn.1991.65.6.1329. [DOI] [PubMed] [Google Scholar]
- 9.Dursteler MR, Wurtz RH. Pursuit and optokinetic deficits following chemical lesions of cortical areas MT and MST. J Neurophysiol. 1988;60:940–965. doi: 10.1152/jn.1988.60.3.940. [DOI] [PubMed] [Google Scholar]
- 10.Georgopoulos AP, Caminiti R, Kalaska JF, Massey JT. Spatial coding of movement: a hypothesis concerning the coding of movement direction by motor cortical populations. Exp Brain Res Supp. 1983;7:327–336. [Google Scholar]
- 11.Graziano MSA, Andersen RA, Snowden RJ. Tuning of MST neurons to spiral motions. J Neurosci. 1994;14:54–67. doi: 10.1523/JNEUROSCI.14-01-00054.1994. [DOI] [PMC free article] [PubMed] [Google Scholar]
- 12.Hikosaka K, Iwai E, Saito H-K, Tanaka K. Polysensory properties of neurons in the anterior bank of the caudal superior temporal sulcus of the macaque monkey. J Neurophysiol. 1988;60:1615–1637. doi: 10.1152/jn.1988.60.5.1615. [DOI] [PubMed] [Google Scholar]
- 13.Kawano K, Sasaki M, Yamashita M. Response properties of neurons in posterior parietal cortex of monkey during visual-vestibular stimulation. I. Visual tracking neurons. J Neurophysiol. 1984;51:340–351. doi: 10.1152/jn.1984.51.2.340. [DOI] [PubMed] [Google Scholar]
- 14.Komatsu H, Wurtz RH. Relation of cortical areas MT and MST to pursuit eye movements. I. Localization and visual properties of neurons. J Neurophysiol. 1988;60:580–603. doi: 10.1152/jn.1988.60.2.580. [DOI] [PubMed] [Google Scholar]
- 15.Maunsell JHR, Van Essen DC. The connections of the middle temporal visual area (MT) and their relationship to a cortical hierarchy in the macaque monkey. J Neurosci. 1983;3:2563–2586. doi: 10.1523/JNEUROSCI.03-12-02563.1983. [DOI] [PMC free article] [PubMed] [Google Scholar]
- 16.Motter BC, Mountcastle VB. The functional properties of the light-sensitive neurons of the posterior parietal cortex studied in waking monkeys: foveal sparing and opponent vector organization. J Neurosci. 1981;1:3–26. doi: 10.1523/JNEUROSCI.01-01-00003.1981. [DOI] [PMC free article] [PubMed] [Google Scholar]
- 17.Newsome WT, Wurtz RH, Komatsu H. Relation of cortical areas MT and MST to pursuit eye movements. II. Differentiation of retinal from extraretinal inputs. J Neurophysiol. 1988;60:604–620. doi: 10.1152/jn.1988.60.2.604. [DOI] [PubMed] [Google Scholar]
- 18.Royden CS, Banks MS, Crowell JA. The perception of heading during eye movements. Nature. 1992;360:583–585. doi: 10.1038/360583a0. [DOI] [PubMed] [Google Scholar]
- 19.Royden CS, Crowell JA, Banks MS. Estimating heading during eye movements. Vision Res. 1994;34:3197–3214. doi: 10.1016/0042-6989(94)90084-1. [DOI] [PubMed] [Google Scholar]
- 20.Saito H-A, Yukie M, Tanaka K, Hikosaka K, Fukada Y, Iwai E. Integration of direction signals of image motion in the superior temporal sulcus of the macaque monkey. J Neurosci. 1986;6:145–157. doi: 10.1523/JNEUROSCI.06-01-00145.1986. [DOI] [PMC free article] [PubMed] [Google Scholar]
- 21.Sakata H, Shibutani H, Kawano K. Functional properties of visual tracking neurons in posterior parietal association cortex of the monkey. J Neurophysiol. 1983;49:1364–1380. doi: 10.1152/jn.1983.49.6.1364. [DOI] [PubMed] [Google Scholar]
- 22.Squatrito S, Maioli MG. Gaze field properties of eye position neurones in areas MST and 7a of the macaque monkey. Vis Neurosci. 1996;13:385–398. doi: 10.1017/s0952523800007628. [DOI] [PubMed] [Google Scholar]
- 23.Steinmetz MA, Motter BC, Duffy CJ, Mountcastle VB. Functional properties of parietal visual neurons: Radial organization of directionalities within the visual field. J Neurosci. 1987;7:177–191. doi: 10.1523/JNEUROSCI.07-01-00177.1987. [DOI] [PMC free article] [PubMed] [Google Scholar]
- 24.Tanaka K, Hikosaka K, Saito HA, Yukie M, Fukada Y, Iwai E. Analysis of local and wide-field movements in the superior temporal visual areas of the macaque monkey. J Neurosci. 1986;6:134–144. doi: 10.1523/JNEUROSCI.06-01-00134.1986. [DOI] [PMC free article] [PubMed] [Google Scholar]
- 25.Tanaka K, Saito H-A. Analysis of motion of the visual field by direction, expansion/contraction, and rotation cells clustered in the dorsal part of the medial superior temporal area of the macaque monkey. J Neurophysiol. 1989;62:626–641. doi: 10.1152/jn.1989.62.3.626. [DOI] [PubMed] [Google Scholar]
- 26.Ungerleider LG, Desimone R. Cortical connections of visual area MT in the macaque. J Comp Neurol. 1986;248:190–222. doi: 10.1002/cne.902480204. [DOI] [PubMed] [Google Scholar]
- 27.Van Essen DC, Maunsell JHR. Two-dimensional maps of the cerebral cortex. J Comp Neurol. 1980;191:255–281. doi: 10.1002/cne.901910208. [DOI] [PubMed] [Google Scholar]
- 28.Warren WH, Hannon DJ. Direction of self-motion is perceived from optical flow. Nature. 1988;336:162–163. [Google Scholar]