Abstract
The effect of changes in the shape of the presynaptic action potential on neurotransmission was examined at synapses between granule and Purkinje cells in slices from the rat cerebellum. Low concentrations of tetraethylammonium were used to broaden the presynaptic action potential. The presynaptic waveform was monitored with voltage-sensitive dyes, the time course and amplitude of presynaptic calcium entry were determined with fluorescent calcium indicators, and EPSCs were measured with a whole-cell voltage clamp. Spike broadening increased calcium influx primarily by prolonging calcium entry without greatly affecting peak presynaptic calcium currents, indicating that the majority of calcium channels reach maximal probability of opening in response to a single action potential and that spike broadening increases the open time of these channels. EPSCs were exquisitely sensitive to elevations of calcium influx produced by spike broadening; there was a high power relationship between calcium influx and release such that a 23% increase in spike width led to a 25% increase in total calcium influx, which in turn doubled synaptic strength.
The finding that even small changes in spike width influence neurotransmitter release suggests that altering the presynaptic waveform may be an important means of modifying the strength of this synapse. Waveform changes do not, however, contribute significantly to presynaptic modulation via activation of adenosine A1 or GABAB receptors. Furthermore, greatly reducing presynaptic calcium influx did not alter the presynaptic waveform, indicating that calcium channels and calcium-activated channels do not participate in shaping the presynaptic waveform.
Keywords: synaptic transmission, spike broadening, parallel fiber, Purkinje cell, tetraethylammonium, voltage-sensitive dyes, calcium-sensitive indicators.
The shape of the presynaptic action potential is of fundamental importance in determining the strength of synapses. The waveform of the depolarization dictates the calcium signal available to trigger vesicle fusion by controlling the opening of voltage-gated calcium channels and the driving force for calcium influx. Altering the presynaptic waveform has been shown to affect neurotransmitter release in many systems (Klein and Kandel, 1980; Llinas et al., 1981; Coates and Bulloch, 1985; Gainer et al., 1986; Spencer et al., 1989;Augustine, 1990; Delaney et al., 1991; Wheeler et al., 1996). For example, in Aplysia serotonin modulates presynaptic potassium channels, thereby broadening the action potential. This leads to increased calcium influx, which contributes to enhanced neurotransmitter release (Siegelbaum et al., 1982; Hochner et al., 1986).
Much remains to be learned about the coupling between the presynaptic waveform and neurotransmitter release at synapses in the mammalian CNS. The enhancement produced by spike broadening depends on the properties of presynaptic calcium channels and the calcium sensitivity of the release apparatus. In the giant synapse of squid, which is the only system in which the effect of waveform changes on neurotransmitter release has been quantitatively studied, it is thought that spike broadening increases calcium entry principally by opening more calcium channels (Augustine, 1990). It is not known, however, whether this applies to other synapses at which calcium channel activation and deactivation kinetics may be different. Somatic calcium channels from cerebellar granule cells respond very differently to waveform changes than squid, with slower action potential repolarization increasing the duration of calcium entry without affecting peak calcium currents greatly (Wheeler et al., 1996). It is not known whether the calcium channels in presynaptic terminals of these cells respond similarly to spike broadening.
The manner in which spike broadening leads to changes in synaptic strength also provides insight into how calcium channels are coupled to neurotransmitter release. At the squid giant synapse, spike broadening causes the same percentage increase in presynaptic calcium influx as in the amplitude of postsynaptic currents; this supports the idea that vesicle fusion at this synapse is driven by calcium entering the terminal through single calcium channels located near individual release sites (see Discussion) (Augustine, 1990). Recent studies suggest a very different arrangement for synapses in the mammalian brain, in which multiple calcium channels act synergistically to control vesicle fusion at single release sites (Wu and Saggau, 1994;Dunlap et al., 1995; Mintz et al., 1995; Borst and Sakmann, 1996). A measurement of the effect of spike broadening on calcium influx and synaptic strength will serve as a test of this view, which predicts that broadening presynaptic action potentials should result in a supralinear relationship between calcium influx and release (Augustine et al., 1991).
Studying the effect of waveform changes on synaptic strength also has important implications for the understanding of synaptic modulation in the CNS. Mammalian neurons contain a large variety of channels and an equally impressive array of modulatory pathways that target these channels (Hille, 1992; Levitan, 1994). This has led to speculation that, as has been shown in Aplysia, waveform changes are used to alter synaptic strength in the mammalian brain. However, because presynaptic terminals in the mammalian central nervous system are typically less than 1 μm in diameter, it has been difficult to extend studies of the relationship between action potential waveform and synaptic strength to synapses within the brain.
Here we investigate the effect of presynaptic waveform changes on presynaptic calcium entry and on the resulting postsynaptic currents at synapses between cerebellar granule cells and Purkinje cells in rat cerebellar slices. The presynaptic action potential waveform and presynaptic calcium currents were monitored optically, and postsynaptic currents were recorded electrically. We applied low concentrations of tetraethylammonium (TEA) to block presynaptic potassium channels involved in spike repolarization, thereby altering the shape of the action potential. By performing experiments in low (1 mm) external calcium and only slightly increasing the action potential width, we limited our studies to conditions in which the calcium influx did not saturate the release apparatus. We report that broadening the presynaptic waveform prolongs the presynaptic calcium current without affecting peak currents significantly. These increases in calcium entry greatly enhance synaptic strength, resulting in a supralinear relationship between the increases in calcium influx and EPSC amplitude caused by spike broadening.
MATERIALS AND METHODS
Transverse slices (300 μm thick) were cut from the cerebellar vermis of 10- to 18-d-old Sprague Dawley rats. The slices were allowed to recover at 30°C for 1 hr before use, and the experiments were conducted at 20–24°C. The external solution consisted of (in mm) 125 NaCl, 2.5 KCl, 1 CaCl2, 2 MgCl2, 26 NaHCO3, 1.25 NaH2PO4, 25 glucose, and 0.02 bicuculline bubbled with 95% O2 and 5% CO2.
Electrophysiology. Whole-cell recordings of Purkinje neurons were obtained using 1.1–2.0 MΩ glass pipettes containing an internal solution of (in mm) 35 CsF, 100 CsCl, 10 EGTA, 10 HEPES, and 0.1 methoxyverapamil (D600), pH 7.3, with CsOH (Regehr and Mintz, 1994). The access resistance (<5 MΩ after series resistance compensation) and leak current (−20 pA to −200 pA) were continuously monitored. The parallel fibers were stimulated with 0.2–0.6 msec current pulses delivered to the molecular layer via a glass or bipolar metal electrode. EPSCs were recorded with an Axon Instruments (Foster City, CA) Axopatch 200A in voltage clamp mode and filtered at 1 kHz.
Extracellular potential recordings were made 400–700 μm from the stimulating electrode with 2.0–3.0 MΩ glass pipettes filled with external solution. In experiments in which voltage-sensitive dye absorption transients and field recordings were made simultaneously, the recording pipette was placed at the edge of the illumination spot.
Purkinje cell spontaneous EPSCs were recorded as described previously in the presence of 0.2–0.5 μm tetrodotoxin (TTX) and 20 μm bicuculline (Dittman and Regehr, 1996). Glass pipettes of 1.5–2.5 MΩ were filled with internal solution of (in mm): 88 Cs2SO4, 10 EGTA, 10 HEPES, 4 MgSO4, 4 CaCl2, 1.5 MgCl2, 4 Na2ATP, 0.4 Na3GTP, and 0.1 D600 at pH 7.3 with CsOH. Amplitude histograms were binned with 2 pA intervals. To detect changes in the amplitude distributions, the amplitude histograms were integrated and normalized. As cumulative distributions, histograms were compared using the Kolmogorov–Smirnov test for significance.
TEA (Fluka, Buchs, Switzerland) was prepared as a 100 mmstock in external solution at the start of each experiment and diluted to its final concentration immediately before each application. ω-Conotoxin-GVIA (Peninsula Laboratories, Belmont, CA) and ω-Aga-IVA (Pfizer, Groton, CT) were prepared as stock solutions and stored at −20°C.
Detection of presynaptic calcium transients. Parallel fibers were labeled with a high-pressure stream of mag-fura-5 (Delbono and Stefani, 1993; Zhao et al., 1996) or magnesium green (Atluri and Regehr, 1996; Zhao et al., 1996) (Molecular Probes, Eugene, OR) using techniques developed previously (Regehr and Atluri, 1995; Regehr and Tank, 1991). Epifluorescence was measured with a photodiode from a spot several hundred micrometers from the loading site, where the vast majority of the fluorescence signal arises from parallel fiber presynaptic boutons that synapse onto Purkinje cells. The peak ΔF/F change produced by a single stimulus was used as a linear measure of presynaptic calcium influx, as established previously (Mintz et al., 1995; Regehr and Atluri, 1995; Sabatini and Regehr, 1995; Feller et al., 1996). Increases in calcium corresponded to decreases in fluorescence for mag-fura-5 (380 nm excitation), and to increases in fluorescence for magnesium green.
To measure the time course of the presynaptic calcium entry, slices were labeled as above with magnesium green. Fluorescence transients were measured from a 20- to 30-μm-diameter spot in the molecular layer following stimulation of the parallel fibers with 0.1 msec current pulses. As described previously for this preparation, the first derivative of the magnesium green fluorescence transient provides an accurate measure of the time course of the presynaptic calcium current (Sabatini and Regehr, 1996). As required by this method, magnesium green responds linearly to increases in presynaptic calcium of the range seen in this study, and the kinetics of calcium binding to magnesium green is sufficiently fast to report the time course of the presynaptic calcium current accurately. The slight overshoot observed in these signals reflects a rapid component of calcium decay.
The time course of our optically determined calcium currents is not detectably slowed by the action potential propagation time across the illumination spot or by the 2 kHz filtering of the fluorescence transient, as neither further reducing the size of the illumination spot nor increasing the corner frequency changed the time course of the calcium current (not shown). Derivatives were calculated digitally using a difference approximation that introduced no time delays. The derivatives of magnesium green fluorescence transients have been inverted to correspond to inward currents.
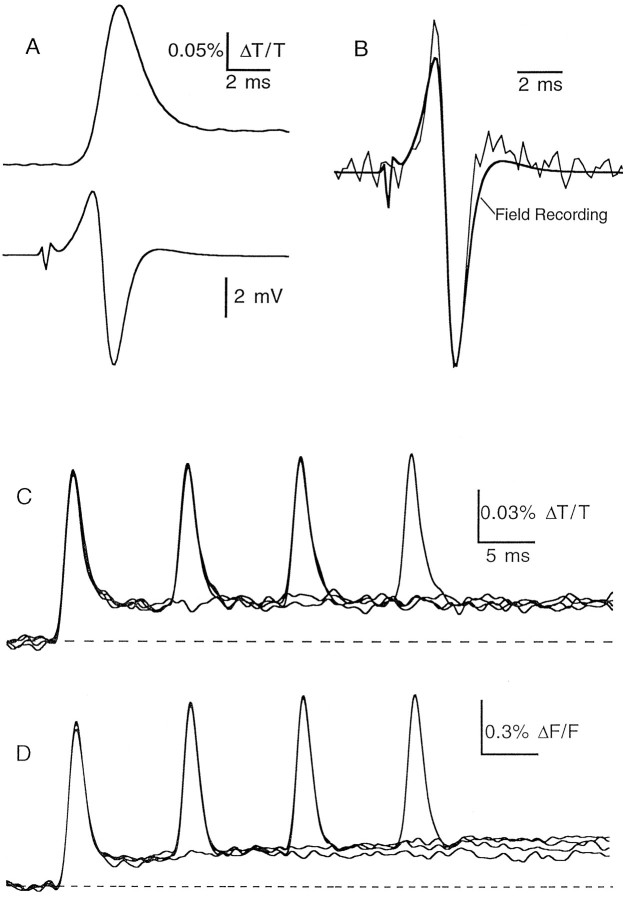
Measurement of presynaptic action potential time course.Slices were bath labeled with the voltage-sensitive dye RH482 (50–100 μg/ml for 0.5–1 hr), which has been used previously to measure the presynaptic waveform in cerebellar parallel fibers (Konnerth et al., 1987). For this dye and the others described below, optical signals were recorded from a 20- to 40-μm-diameter spot in the molecular layer and were filtered at 1–2 kHz. Stimulation of parallel fibers with a 0.2 msec current pulse delivered through an extracellular electrode placed in the molecular layer produced small changes in transmittance of 710 nm light (Fig.1A). The signal had a width at half-maximum of approximately 1.5 msec, which is an appropriate duration for an action potential measured at 22°C. To test the accuracy of the presynaptic waveform reported by the voltage-sensitive dye, we measured simultaneously the presynaptic volley, which reflects the current flow associated with a propagating action potential. In Figure 1B the second derivative (calculated with a difference approximation) of the waveform measured with RH482 is compared with the presynaptic volley. As is expected from theory, the time courses of these signals are very similar (Plonsey and Barr, 1991). Not surprisingly, the field recording has a slightly longer duration, which likely reflects the fact that extracellular signals are influenced by current flow in structures beyond the region sampled by our optical measurements.
Fig. 1.
Recording the presynaptic waveform with voltage-sensitive dyes. A, Simultaneously recorded RH482 transmittance transients (top) and extracellular field potentials (bottom) after stimulation of the molecular layer. B, Comparison of the time course of the field potential (thick line) with that of the second derivative of the voltage-sensitive dye signal (thin line). Traces are averages of 130 trials. C, Transmittance transients of bath-loaded RH482 during trains of one to four stimuli delivered at 100 Hz to the molecular layer (average of 20 trials). D, Fluorescence transients from parallel fibers focally loaded with Di-8-ANEPPS and stimulated one to four times at 100 Hz (average of 18 trials).
The change in transmittance of RH482 consisted of a rapid transient phase followed by a sustained plateau component (Fig.1A). We examined the pharmacological sensitivity of this signal and found that it was entirely eliminated by TTX (200 nm). Blocking synaptic transmission with either 6-cyano-7-nitroquinoxaline-2,3-dione (5 μm) and (±〉-2-amino-5-phosphonopentanoic acid (50 μm) or with cadmium (100 μm) did not affect the fast transient and had only small effects on the slower component (data not shown).
We tested several different dyes and loading conditions to see whether the long-lasting component corresponded to an afterdepolarization in the parallel fibers or whether it was an artifact associated with the dye. Experiments performed with two dyes are shown in Figure 1,C and D. In both of these experiments parallel fibers were stimulated with 100 Hz trains of one to four pulses. In Figure 1C the slice was bath loaded with the dye RH482. In Figure 1D, parallel fibers were loaded focally, as described for the calcium dyes, with the fluorescent voltage-sensitive dye di-8-ANNEPS. After waiting 4–6 hr for the dye to diffuse, recordings of stimulus-evoked changes in fluorescence were made several hundred micrometers from the loading site, where the only structures that seemed to be labeled were parallel fibers. Similar results were obtained in these two experimental conditions; each stimulus produced rapid transients of comparable duration followed by a sustained component that was quite prominent after the first stimulus in the train and negligible for subsequent stimuli.
Additional evidence that this long-lasting signal was not an artifact induced by the voltage-sensitive dye includes: (1) the sign of the fluorescence and transmission changes showed the proper dependence on excitation wavelength; (2) no signal was detected in the absence of the voltage-sensitive dyes; (3) bath loading a slice with voltage-sensitive dyes and exposing the slice to the light levels used in our recordings did not affect the electrically recorded presynaptic volley; and (4) the size of the slower component relative to the transient component was insensitive to changes in illumination intensity, dye concentration, and stimulus intensity (data not shown). Furthermore, similar results were obtained for other dyes and conditions: in fluorescence measurements with Di-4-ANEPPS, Di-8-ANEPPQ, and Di-18:2-ANEPPS and in absorption measurements with Di-8-ANEPPS loaded by focal or bath application. Absorption measurements with RH155, which has been used previously to record from parallel fibers in slices from the rat (Vranesic et al., 1994), showed an additional prominent afterdepolarization that was cadmium sensitive and has been attributed to depolarization of glia (Konnerth et al., 1987).
Taken together our results suggest that the sustained component of ΔF/F and ΔT/T signals likely reflects a true depolarization in the parallel fibers. The sustained component cannot arise from synaptic activation of postsynaptic targets, because it remains even when synaptic transmission is eliminated. In addition, it must arise from the parallel fibers, because it is observed even when fibers are focally loaded and postsynaptic structures are not labeled with dye. The depolarization may result from the accumulation of potassium in the extracellular space (Kocsis et al., 1983) and likely occurs in both stimulated and unstimulated fibers. However, because of its slow time course, the long-lasting component did not interfere with our ability to measure the waveform of the propagating presynaptic action potential.
Simultaneous recordings of presynaptic waveform and calcium currents. Slices were focally loaded with magnesium green followed by bath loading of RH482 as described above. Excitation light for magnesium green (500DF20 filter) and RH482 (710DF20 filter) from separate light sources was combined using a custom dichroic filter (490/700DBDR) and restricted to a 20–30 μm illumination spot centered in the molecular layer. Transmittance was passed through a second 710DF20 filter and monitored with a photodiode placed below the condenser, and epifluorescence was collected [10SWF-650 (Newport, Irvine, CA) and LP530 filters] and focused onto a second photodiode. Both signals were filtered with identical filters (Frequency Devices, Haverhill, MA) at 2 kHz and sampled at 50 kHz. Tests with light-emitting diode pulses showed that this recording configuration introduced no relative time shifts between the signals. With the exception of 10SWF-650, all filters and dichroics were manufactured by Omega Optical (Brattleboro, VT).
Simulations of calcium channel activation. The activation of calcium channels by presynaptic action potentials was simulated by imposing a voltage waveform and calculating the response of the calcium channels. A two-state model was used to describe calcium channels such that:
with opening rate α = 3/[(1 +e−0.072(V − 5)] and closing rate β = 0.04 (V − 8.9)/[e0.2(v − 8.9) − 1]. These parameters were based on those used to describe calcium channels in turtle cerebellar granule cells (Gabbiani et al., 1994). They have been slightly modified to conform better to the constraints imposed by the timing and shape of the calcium currents in rat cerebellar granule cells (see Figs. 4 and 5) (Sabatini and Regehr, 1996; Wheeler et al., 1996). Two gates were assumed per channel so that the relative calcium current was given by ICa ∝O2 (V −ECa), with ECa = 125 mV. Numerical solutions were calculated with Euler integration using time steps of 10 μsec.
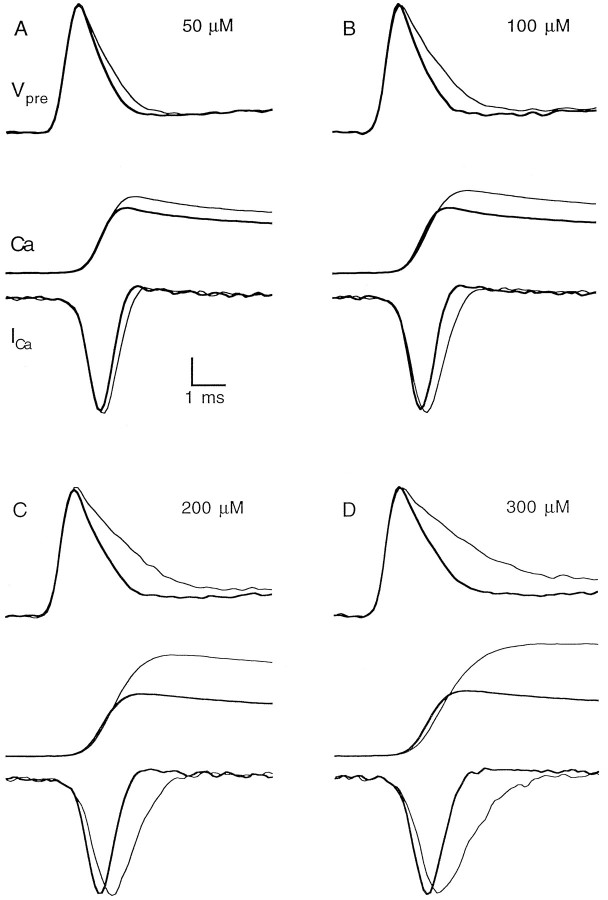
Fig. 4.
Simultaneous recordings of presynaptic action potential waveform and presynaptic calcium entry. Each panel shows the presynaptic waveform (top), presynaptic calcium transient (middle), and presynaptic calcium current (bottom) in control conditions (thick line) and in the presence of the indicated concentration of TEA (thin line). Vertical scale bar, 0.10–0.15% ΔT/T for RH482, 3% ΔF/F for magnesium green, and 2 (%ΔF/F)/msec for the derivatives of magnesium green signals.
Fig. 5.
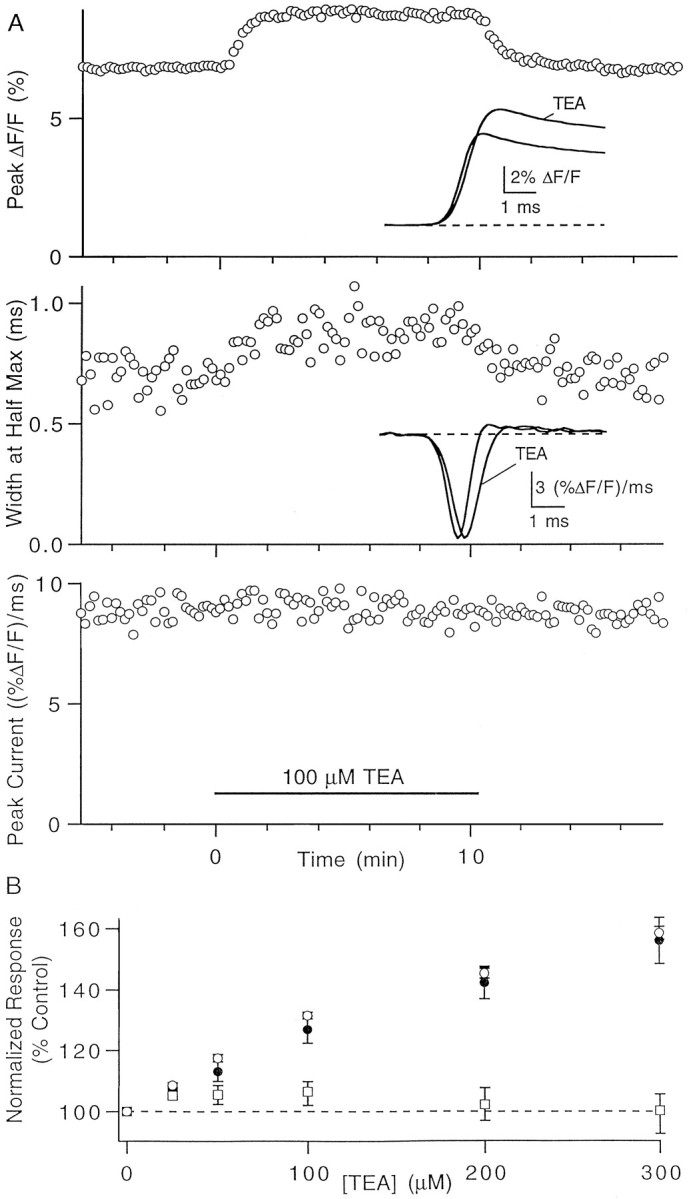
The effect of spike broadening on presynaptic calcium entry. A, Representative experiment showing the effects of 100 μm TEA on total calcium influx (top), width at half-maximum amplitude of the calcium current (middle), and peak calcium current (bottom). Insets, Fluorescence transients (top) and derivatives of fluorescence transients (middle) in control conditions and in the presence of TEA. B, Dose dependence of the effects of TEA on total presynaptic calcium influx (open circles) and on the half-width (filled circles) and peak amplitude (squares) of the calcium current. Data points are mean ± SEM of 5 to 11 experiments.
All calcium channels were assumed to have the same activation properties. Contributions of channels in a “reluctant” state, which only open at extremely positive potentials, were not considered (Bean, 1989).
RESULTS
The goal of this study was to assess the effects of subtle changes in presynaptic waveform on presynaptic calcium entry and on the resulting postsynaptic currents. One important requirement was to obtain a reliable and specific means of broadening the presynaptic action potential. Previous studies have generally used one of two potassium channel blockers, 4-aminopyridine (4-AP) or TEA, for this purpose. We found that 4-AP was not well suited to studies of spike broadening at the granule cell to Purkinje cell synapse; it acted very slowly and washed out poorly, possibly reflecting an intracellular site of block (Howe and Ritchie, 1991; Stephens et al., 1994). In contrast, TEA, which is known to block some types of potassium channels with high affinity at an extracellular site (Hille, 1967; MacKinnon and Yellen, 1990), acted quickly and reversed rapidly.
Effects of TEA on the presynaptic waveform
To understand how regulation of the presynaptic action potential shape can be used to control synaptic strength, it is necessary to obtain a reliable measure of the presynaptic waveform. Unfortunately, because the presynaptic boutons at this synapse are very small (Palay and Chan-Palay, 1974), it is not feasible to monitor their transmembrane potential with intracellular electrophysiological techniques. In contrast, it is straightforward to measure the presynaptic volley, which is the field potential associated with the propagating action potential in the parallel fibers (Eccles et al., 1967).
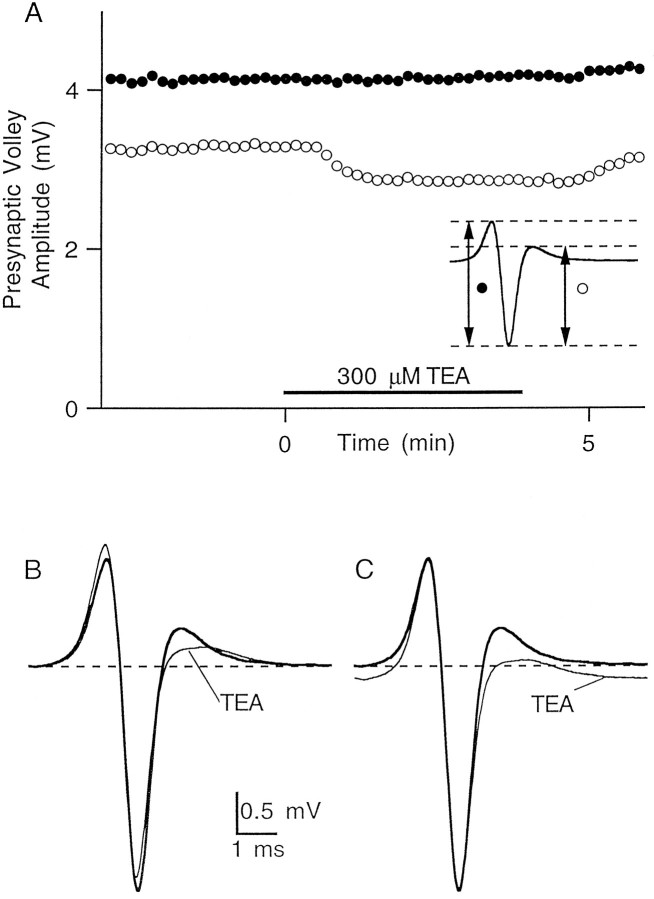
We used 25–300 μm TEA to increase the duration of the action potential that propagates along parallel fibers after stimulation of the molecular layer. As shown in Figure2, bath application of 300 μm TEA did not alter the amplitude or time course of the negative-going phase of the extracellular field potential. This phase corresponds to the inward current flowing during the upstroke of the action potential, and any significant change in the number of parallel fibers activated would have been reflected in its amplitude. In contrast, the subsequent positive-going phase, which is generated by current flow during action potential repolarization, was reduced in amplitude, indicating that TEA slowed spike repolarization.
Fig. 2.
Application of TEA slows action potential repolarization without significantly altering presynaptic fiber excitability. A, Application of 300 μm TEA has no effect on the magnitude of the negative-going phase of the field potential (filled circles) but decreases the magnitude of the subsequent positive-going phase (open circles). Inset, The two measured amplitudes of the field potential. B, Field potential recordings in control conditions and in the presence of TEA. C, Same traces as in B aligned for ease of comparison of amplitude and time course.
Theoretically the presynaptic volley is proportional to the second derivative of the transmembrane potential, and it should be possible to estimate the action potential waveform from the double integral of the field potential (Plonsey and Barr, 1991). However, this is impractical because of the tendency of a double integration to amplify small contaminating signals into large offsets. Therefore, rather than depending on electrical methods, we used voltage-sensitive dyes to obtain reliable and quantitative recordings of the shape of the action potential in the parallel fibers (see Materials and Methods).
Recordings of the presynaptic action potential waveform with the voltage-sensitive dye RH482 confirmed that TEA lengthened the repolarization phase of the action potential. In the representative experiment shown in Figure 3A, 100 μm TEA increased the width at half-maximum amplitude of the action potential by 19%. Changes in action potential duration were similar when measured on either the first or second action potential elicited by a train of stimuli (Fig. 3B), indicating that the slow depolarizing signal that follows the first stimulus did not interfere with our ability to measure the time course of the action potential accurately. The dose dependence of the action potential broadening caused by TEA is plotted in Figure 3C.
Fig. 3.
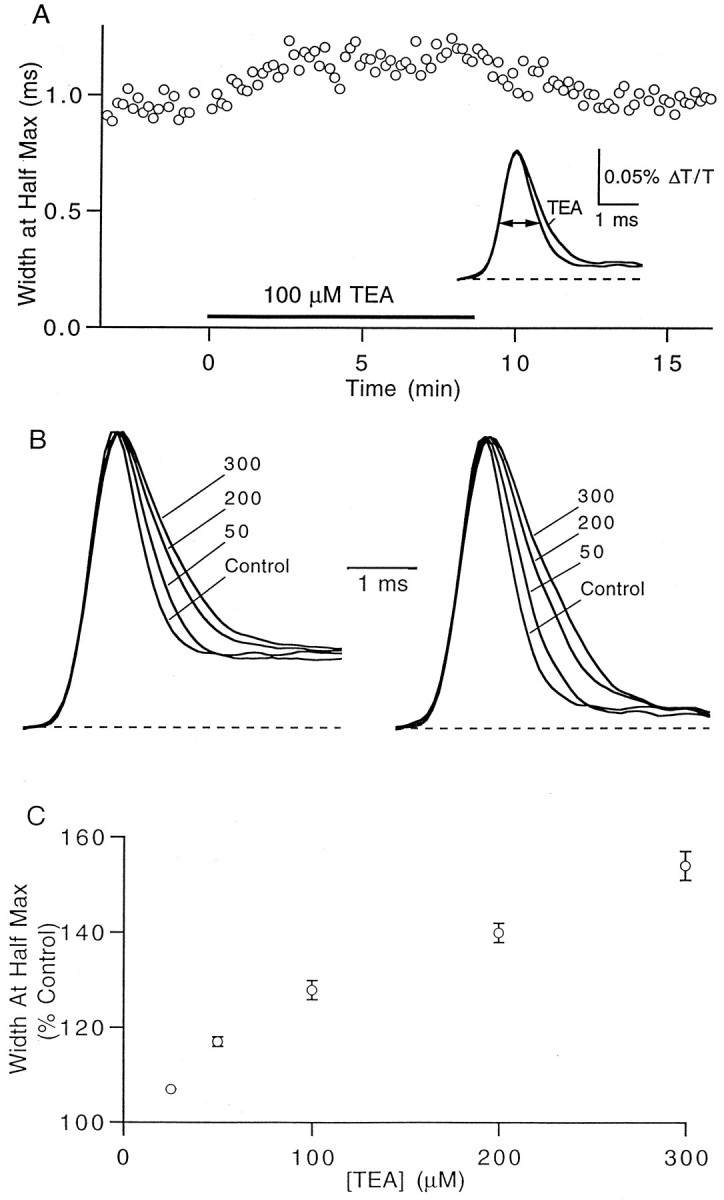
TEA broadens the presynaptic action potential.A, The width at half-maximum amplitude of the presynaptic action potential increases during application of 100 μm TEA. Inset, RH482 transmittance transients in control and TEA conditions (average of 30 trials).B, Representative experiment showing the effects of the indicated concentrations of TEA (in micromolar concentrations) on the presynaptic waveform. The first (left) and second (right) action potentials in a pair separated by 10 msec were broadened by equal amounts. The amplitudes of the transients have been normalized. C, Dose dependence of the increase in action potential duration of the first spike. Data points are mean ± SEM of five experiments.
Effects of spike broadening on presynaptic calcium influx and synaptic currents
The coupling of presynaptic waveform and calcium entry into presynaptic terminals was examined by simultaneously measuring the presynaptic waveform and the presynaptic calcium transient with the voltage-sensitive dye RH482 and the calcium-sensitive fluorophore magnesium green (see Materials and Methods). The amplitude of magnesium green ΔF/F transients produced by parallel fiber stimulation is linearly related to the total presynaptic calcium influx, and the derivative of this signal provides an accurate measure of the time course of the presynaptic calcium currents (Atluri and Regehr, 1996; Sabatini and Regehr, 1996). As shown in Figure4, in these experimental conditions most of the calcium entered the presynaptic terminals during the spike repolarization, and broadening the presynaptic action potential increased calcium influx primarily by prolonging the duration of presynaptic calcium current.
We performed a series of experiments, such as that shown in Figure5A, in which we quantitatively examined the effect of TEA on presynaptic calcium entry. The application of 100 μm TEA caused a rapid and reversible increase of 29% in the total calcium influx. The width at half-maximum of the calcium current was reversibly increased by 26%, from 700 to 880 μsec, whereas the peak current was only increased by 2%. Figure5B summarizes the effect of TEA on total calcium influx and on the width at half-maximum and peak amplitudes of the calcium current.
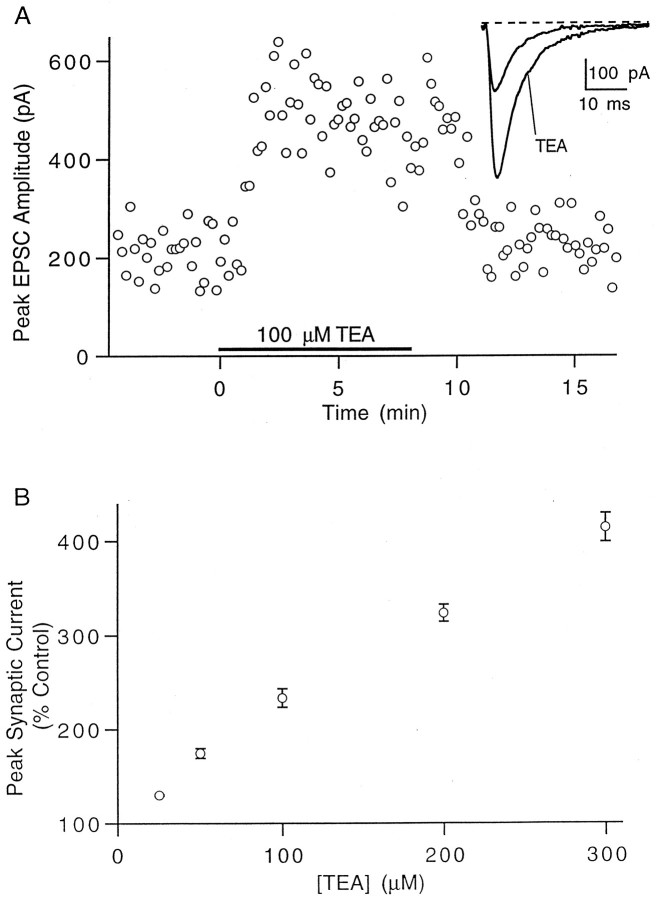
TEA also enhanced synaptic efficacy, as assessed by recording EPSCs from voltage-clamped Purkinje cells. Figure6A shows a typical experiment in which the application of 100 μm TEA caused a rapid and approximately 2.5-fold increase in the peak EPSC. Figure6B summarizes the effect of different concentrations of TEA on the EPSC amplitude.
Fig. 6.
Increase in the magnitude of synaptic currents by TEA. A, Representative experiment showing the effect of 100 μm TEA on the EPSC amplitude. Inset,Currents in control conditions and in the presence of TEA (average of 20 trials). B, Dose dependence of the increase in synaptic currents. Data points are mean ± SEM of five to eight experiments.
Effects of TEA on spontaneous release of neurotransmitter and postsynaptic sensitivity to glutamate
One important requirement of the method used to broaden presynaptic action potentials was that it do so in a specific manner. To test whether TEA caused calcium-independent presynaptic changes in synaptic transmission or changes in postsynaptic glutamate sensitivity, we recorded spontaneous miniature EPSCs (mEPSCs) in the presence of bicuculline and TTX (Fig. 7A) (Dittman and Regehr, 1996). No significant change in mEPSC frequency was found after the application of TEA (96 ± 4% of control; n = 4). In addition, as is shown for a representative cell in Figure7B, TEA had no significant effect on mEPSC amplitude (p = 0.97–1.00 by Kolmogorov–Smirnov test in four cells).
Fig. 7.
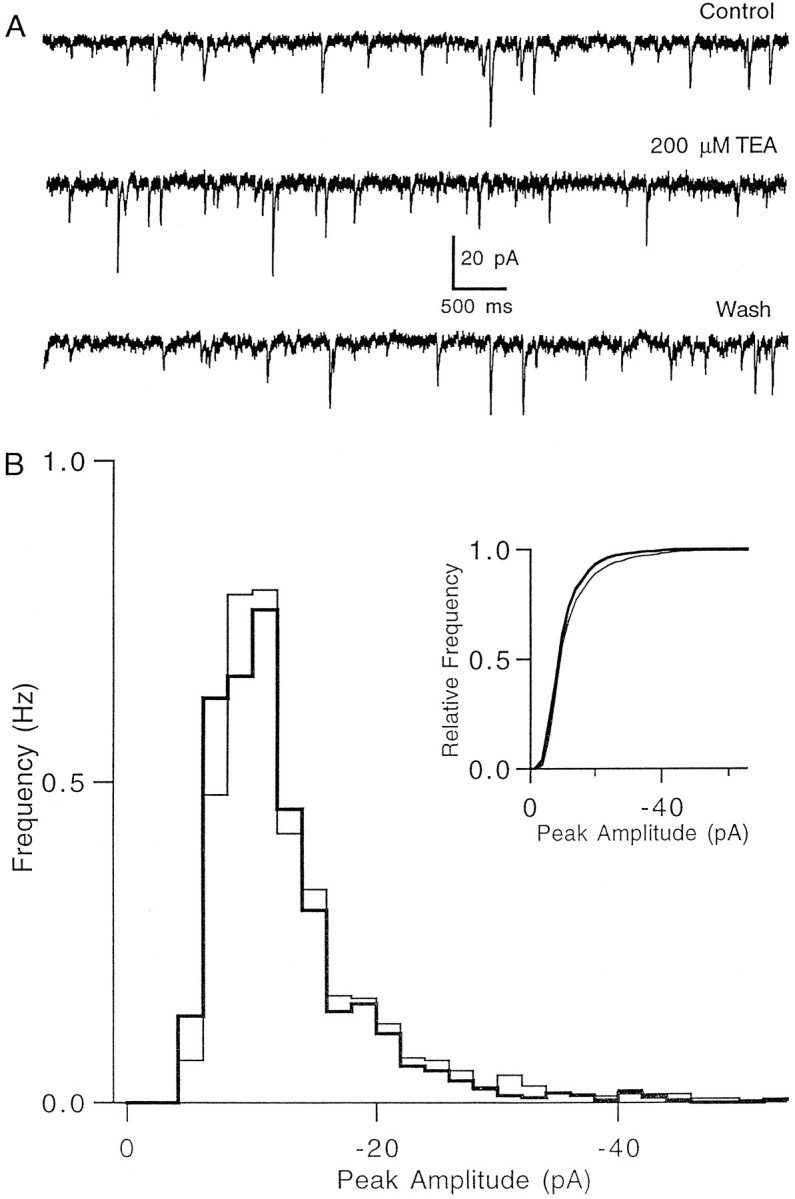
TEA has no effect on spontaneous miniature EPSC frequency and amplitude. A, mEPSCs recorded at a holding potential of −70 mV in control conditions (top), in the presence of 200 μm TEA (middle), and after washout of TEA (bottom). TTX was present throughout the experiment. B, mEPSC amplitude distribution histogram in control conditions (thin line) and in the presence of TEA (thick line). Inset, Normalized cumulative amplitude distributions in control conditions (thin line) and in TEA (thick line) do not differ significantly (p = 0.97 by Kolmogorov–Smirnov test). Changing the holding potential caused a readily detectable decrease in mEPSC amplitude (p < 0.05) for this experiment (data not shown). Data are from 400 sec of recording with 1499 events in the control distribution and 1443 events for the TEA distribution.
The relationship between presynaptic action potential duration, presynaptic calcium influx, and postsynaptic currents
We have shown that the application of TEA broadens the presynaptic waveform without significantly altering fiber excitability, calcium-independent presynaptic processes, or postsynaptic sensitivity to glutamate. In addition, the concentrations of TEA used in these experiments are not expected to have significant direct effects on calcium channels. Therefore, the increases in presynaptic calcium influx and EPSC amplitude can be attributed entirely to changes in the presynaptic waveform.
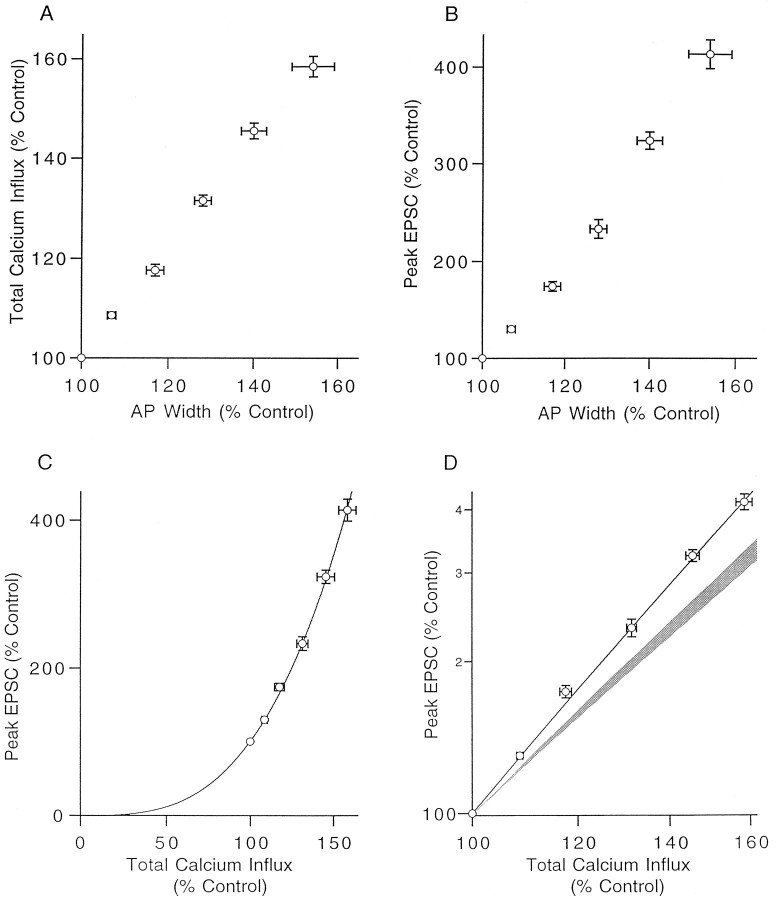
Figure 8A depicts the relationship between calcium influx and spike width and shows that an increase in action potential duration causes an approximately equal percentage increase in total calcium influx. In contrast, the EPSC is very sensitive to variations in the width of the action potential; an increase of just 20–25% in the width of the action potential doubles the size of the EPSC (Fig. 8B).
Fig. 8.
The relationship between action potential duration, calcium influx, and EPSC amplitude. A, The effect of TEA on total presynaptic calcium influx is plotted as a function of its effects on presynaptic action potential duration as measured by the width at half-maximum. B, Synaptic strength plotted as a function of action potential width (percentage of control). C, Relationship between presynaptic calcium influx and postsynaptic response when calcium influx is increased by spike broadening. D, Same data as in Cplotted on a log–log plot to demonstrate the power law relationship. The solid lines in C and Dshow the relationship described by Equation 1 withn = 3.1. The shaded regionrepresents the relationship between calcium influx and release found previously when calcium influx was altered by changing extracellular calcium concentration or by blocking calcium influx with cadmium (Mintz et al., 1995).
The relationship between EPSC amplitude and calcium influx when the presynaptic waveform is broadened is plotted in Figure 8, Cand D, on a log–log scale. The relationship is well described by a power law of the form:
| Equation 1 |
where k is a constant, ∫ICadt = Cainfluxis the total calcium influx per action potential (Regehr and Atluri, 1995), and n is the power law exponent. For these experiments, in which the alteration in calcium entry was secondary to changes in the presynaptic waveform, the power law relating calcium entry and EPSC amplitude is reminiscent of that observed at this synapse when calcium entry was altered directly by changing the external calcium concentration or by blocking calcium influx with cadmium (Mintz et al., 1995). However, in those studies,n = 2.5 (Fig. 8D, shaded region), whereas here, for spike broadening, n = 3.1 (Fig.8C,D, lines).
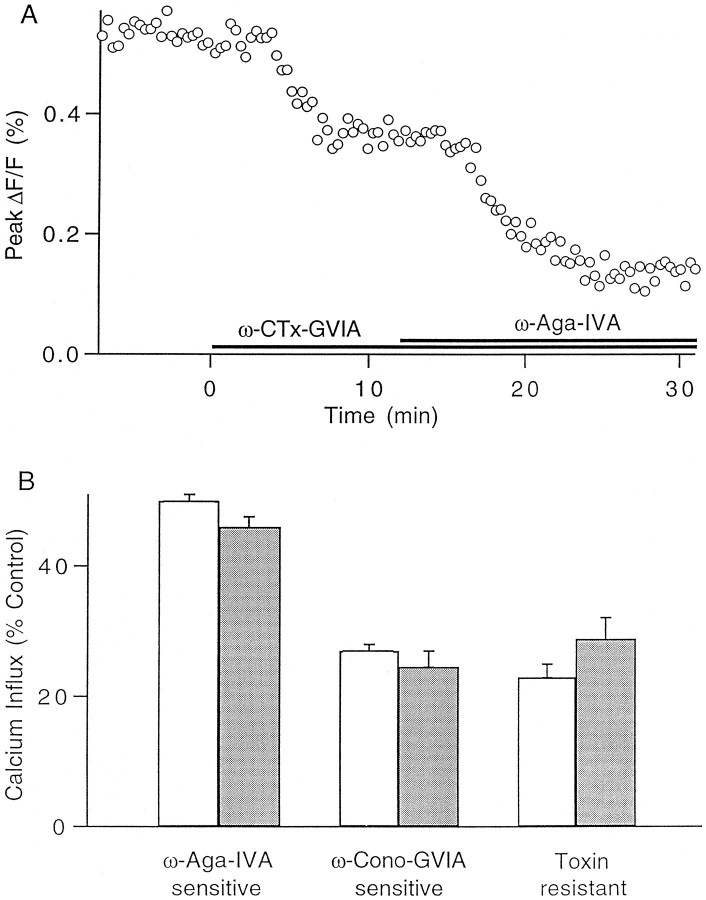
We checked one possible explanation for the steeper power law seen when calcium influx was altered by spike broadening compared with that seen when the external calcium concentration was changed. Calcium enters parallel fiber synaptic boutons through three pharmacologically distinct classes of calcium channels: one blocked by ω-Aga-IVA, a second blocked by ω-conotoxin-GVIA, and a third that is resistant to both toxins (Mintz et al., 1995). Calcium influx through ω-Aga-IVA-sensitive channels seems to be more effective at triggering neurotransmitter release than is influx through other channel types. We tested the possibility that differences in channel kinetics made the ω-Aga-IVA-sensitive channels particularly susceptible to spike broadening by measuring the percentage of the total calcium influx that entered through each channel type in the presence of 200 μm TEA. Figure 9A shows the results of an experiment in which calcium influx was monitored with mag-fura-5 during application of ω-conotoxin-GVIA followed by coapplication of ω-Aga-IVA and ω-conotoxin-GVIA. On average, the relative calcium influx through each channel class in the presence of TEA was the same as that measured in control conditions (Fig.9B) (Mintz et al., 1995). Thus, spike broadening does not significantly alter the fractional contribution to the total calcium entry of influx through different calcium channels types, consistent with studies at the granule cell body (Wheeler et al., 1996).
Fig. 9.
Relative calcium influx through different channel types is unchanged by spike broadening. A, Representative experiment showing the effect on total calcium influx of an application of ω-conotoxin-GVIA, followed by a coapplication of ω-conotoxin-GVIA and ω-Aga-IVA. The experiment was performed in the presence of 1 mm external calcium and 200 μmTEA. B, The percentages of calcium influx that are ω-conotoxin-GVIA sensitive, ω-Aga-IVA sensitive, and toxin resistant are plotted for 2 mm external Ca (white bars) and in the presence of 1 mm external calcium and 200 μm TEA (gray bars). Error bars, SEM (n = 5).
The effect of modifying calcium entry on presynaptic waveform
The observation that small changes in waveform can lead to large changes in neurotransmitter release suggested that waveform changes could contribute to synaptic modulation. For the cerebellar granule cell to Purkinje cell synapse, activation of presynaptic adenosine A1 receptors and GABAB receptors reduces neurotransmitter release primarily by decreasing presynaptic calcium influx (Dittman and Regehr, 1996). We tested the possibility that these reductions in calcium influx might be a consequence of changes in the presynaptic waveform. Simultaneous measurements of the presynaptic calcium current and the presynaptic waveform revealed that activation of A1 receptors by 2-chloroadenosine (2-CA) decreased the presynaptic calcium current without altering the presynaptic waveform (Fig. 10A). This was also true for activation of GABAB receptors with baclofen (Fig.10B). On average, the width at half-maximum of the presynaptic action potential (expressed as a percentage of control) was 97.8 ± 2.3% in the presence of 10 μm 2-CA (n = 4) and 99.7 ± 1.9% in 10 μmbaclofen (n = 4). These measurements establish that alterations in the presynaptic waveform are not the primary causes of the decrease in transmitter release produced by these neuromodulators.
Fig. 10.
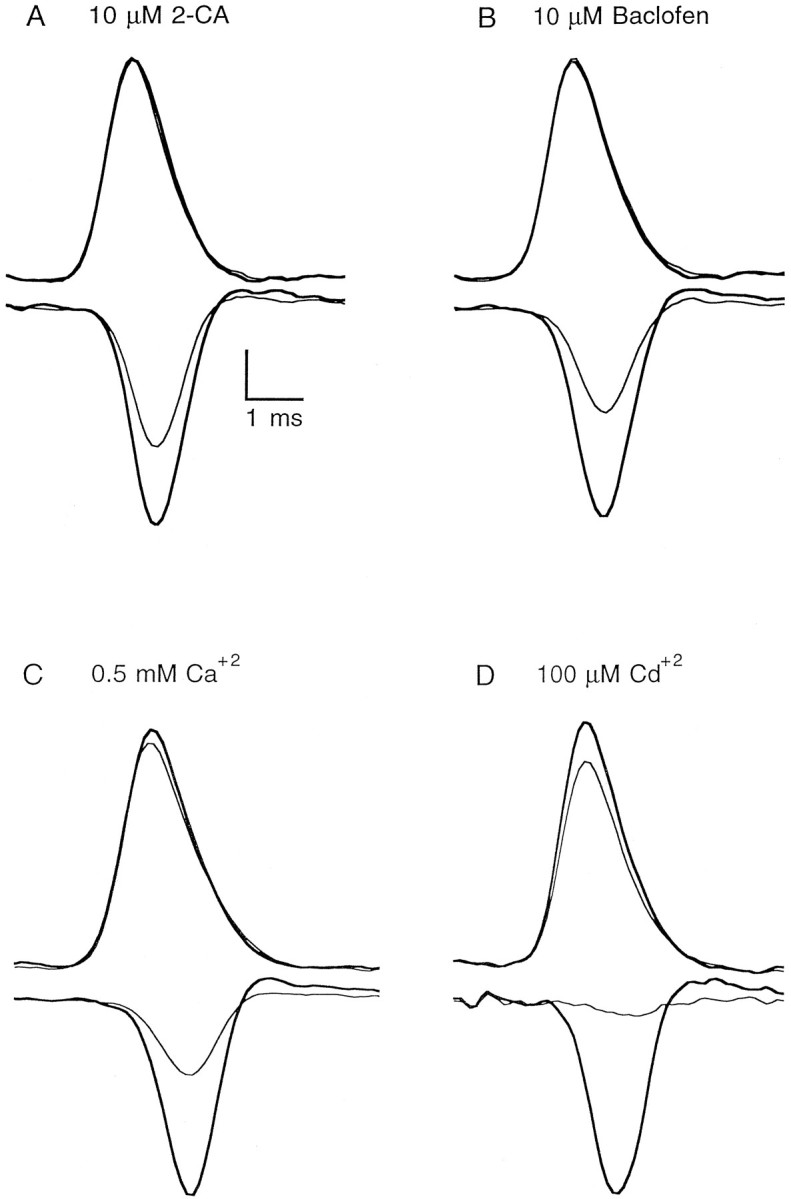
Effects of modulators of synaptic strength on presynaptic waveform and presynaptic calcium current. Each panel shows the presynaptic waveform (top) and presynaptic calcium current (bottom) in control conditions (thick line) and after the indicated manipulation (thin line). Vertical scale bar, 0.06–0.1% ΔT/T for RH482 transmittance transients and 1.0–2.5 (%ΔF/F)/msec for the derivatives of magnesium green fluorescence transients.
These studies also showed that large changes in calcium entry did not cause detectable changes in the time course of the presynaptic action potential. This prompted us to examine the role of calcium currents and calcium-activated conductances in shaping presynaptic action potentials. Greatly reducing calcium entry, either by reducing external calcium (Fig. 10C) or by blocking calcium channels with cadmium (Fig. 10D), did not affect the width of the presynaptic action potential. In 0.5 mm external calcium the spike width was 98.9 ± 2.7% of control (n = 4), and in the presence of 100 μm cadmium the spike width was 99.6 ± 2.7% of control (n = 4). Small decreases in the amplitude of the ΔT/T signals are consistent with a slight reduction in the number of fibers excited in low calcium conditions and in the presence of 100 μmcadmium (Mintz et al., 1995).
DISCUSSION
We found that, at the synapse between granule cells and Purkinje cells in the cerebellum, a slight broadening of the presynaptic action potential modestly increases presynaptic calcium influx, which in turn leads to greatly enhanced neurotransmitter release. The process of understanding how such changes in the presynaptic waveform alter synaptic strength has provided insight into action potential-mediated activation of presynaptic calcium channels and the way in which these channels are coupled to release.
Coupling of the presynaptic waveform to voltage-gated calcium channels
The first step in understanding how the presynaptic waveform controls synaptic strength is to determine the effect of waveform changes on the calcium signal available to trigger release. We found that spike broadening increased calcium entry almost exclusively by prolonging the calcium current, with only slight increases in the peak calcium currents. In addition, spike broadening did not differentially enhance any of the pharmacologically separable calcium current components. These results are remarkably similar to those obtained in action potential clamp recordings from granule cell somata (Wheeler et al., 1996).
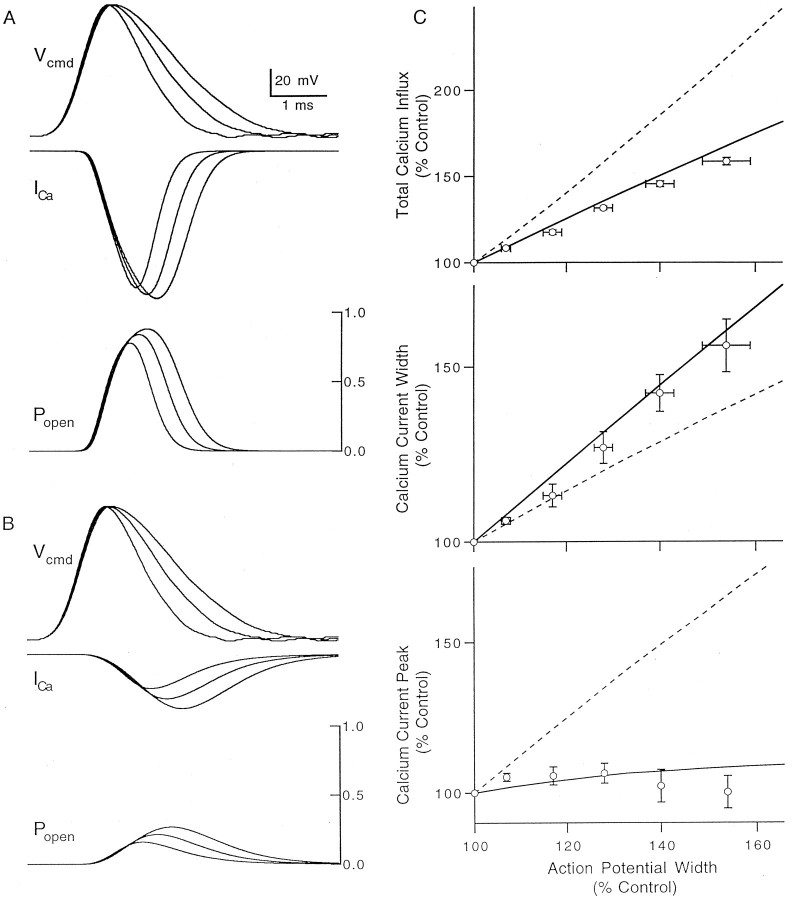
We further examined the relationship between presynaptic waveform and calcium influx by performing simulations of the calcium currents elicited by a family of action potentials with different durations. Simulations based on reported kinetics for voltage-gated calcium channels (Fig. 11A) provided a good match to the timing and shape of the observed calcium currents and reproduced the effects of spike broadening on total calcium influx and on the half width and peak amplitude of the calcium current (Fig.11C, solid traces). These parameters predict that the majority of calcium channels open during an action potential and that spike broadening prolongs the open time of the channels but increases the number of open channels only slightly.
Fig. 11.
Simulations of calcium channel activation.A, Simulations showing the effect of the imposed command voltages (top) on the calcium current (middle) and the fraction of open calcium channels (bottom). The waveforms used in this simulation are the same as the one measured in control conditions and two versions of it broadened to correspond to the waveforms seen in 100 μmand 300 μm TEA. The action potentials have been scaled to have an amplitude of 100 mV and a resting potential of −70 mV. The calcium channel kinetics was simulated with a two-state model as described in Materials and Methods. B, Simulation as inA, but with calcium channel kinetics slowed by a factor of 5. Calcium currents in A and B are shown on the same scale. C, Total calcium influx (top), calcium current half-width (middle), and peak calcium current (bottom) plotted as a function of action potential half-width. The symbols show experimental data from Figures 5 and 8, and lines show the results produced by the simulation parameters used in A (solid line) andB (dashed line).
The calcium channel activation described here does not conform to the classic view of the coupling of action potentials to calcium channels in presynaptic terminals, which is based on the squid giant synapse. According to that view an action potential opens only a small percentage of presynaptic calcium channels, and spike broadening enhances calcium entry primarily by increasing the number of calcium channels that open in response to an action potential. This leads to large increases in the peak calcium current (Augustine, 1990). By slowing the calcium channel kinetics used in our simulations (Fig.11B), it was possible to reproduce important qualitative features of calcium channel activation seen at the squid giant synapse. Clearly the results of the simulations with the slower kinetics are inconsistent with the observed behavior of calcium channels in cerebellar granule cells (Fig. 11C, dashed lines).
Thus the most straightforward explanation of our experimental results is that in granule cells rapid calcium channel kinetics allow almost all of the calcium channels to reach maximal probability of opening during an action potential and that spike broadening increases calcium entry by keeping channels open longer.
Coupling of calcium to neurotransmitter release
It is the coupling of calcium entry to release that makes synaptic strength so sensitive to waveform changes; even small alterations in calcium entry greatly affect neurotransmitter release. We found that the relationship between increases in calcium influx and synaptic strength induced by spike broadening is approximated by a power law (Eq. 1 with n = 3.1) similar to that described at this synapse when calcium influx was altered by changing external calcium concentration or by blocking influx with cadmium (Mintz et al., 1995). The slight difference in the exponent of the power law (n = 2.5 for the studies of Mintz et al., 1995) is not understood, although we have demonstrated that it does not result from spike broadening preferentially enhancing calcium influx though types of calcium channels that are more effective at triggering neurotransmitter release (Fig. 9).
Another interesting aspect of transmission at the granule cell to Purkinje cell synapse that is revealed by these experiments is that release seems to be controlled by the total calcium influx rather than by peak calcium currents. In contrast to the good power law fit of the relationship between total calcium influx and neurotransmitter release (Fig. 8), peak calcium currents are essentially unchanged by spike broadening (Fig. 5) and, therefore, cannot be correlated with the increases in synaptic strength.
Comparison with other synapses
It is instructive to compare this cerebellar synapse with other synapses with regard to the manner in which spike broadening changes synaptic strength. Here we found that the sensitivity of postsynaptic current to spike width is remarkably similar to that observed in squid (Augustine, 1990). Synaptic currents are doubled by an increase in spike width of 16% in squid and 23% in the cerebellum (compare Figs. 8B and 6B ofAugustine, 1990). However, these synaptic enhancements are achieved by very different means. In the cerebellum there is a one-to-one correspondence between spike width and calcium entry, whereas in squid, calcium entry is much more sensitive to spike width; broadening the presynaptic action potential by 25% increases calcium influx by 28% in granule cell terminals and by 200% in squid. These synapses also seem to differ in the manner in which calcium channels control release; increasing calcium entry by 25% increased the EPSC amplitude by 100% in Purkinje cells but by only 22% in squid. Thus, there is an approximately linear relationship between calcium entry and neurotransmitter release in squid.
The disparate ways in which spike broadening changes synaptic strength at these two synapses suggests that they differ in basic features of transmission. In general it is thought that release is triggered by “domains” of high calcium concentration (>50 μm) that form very near open calcium channels (Fogelson and Zucker, 1985; Simon and Llinas, 1985), but there are two models for how calcium channels are coupled to release. In squid the “nonoverlapping domain model” is thought to apply. According to this model, neurotransmitter release is normally driven by the opening of a single calcium channel near a release site, and release is proportional to the number of calcium channels that open in the presynaptic terminal. In squid it is thought that spike broadening increases neurotransmitter release primarily by opening more calcium channels. In contrast, we have shown previously that at the mammalian granule cell to Purkinje cell synapse the “overlapping domain model” applies, and multiple channels act together to trigger vesicle fusion at each release site (Borst and Sakmann, 1996; Dunlap et al., 1995; Mintz et al., 1995; Wu and Saggau, 1994). Here we show that at this synapse spike broadening increases the average open time of the calcium channels without opening many more calcium channels. Most of the effect of synaptic enhancement produced by spike broadening occurs subsequent to calcium entry because of the supralinear relationship between neurotransmitter release and calcium influx (Mintz et al., 1995), which likely reflects the involvement of multiple calcium ions in triggering release (Dodge and Rahamimoff, 1967; Heidelberger et al., 1994; Lando and Zucker, 1994).
The effects of spike broadening at the crayfish neuromuscular junction are also different from those at the granule cell to Purkinje cell synapse. In crayfish, when calcium entry is altered by changing the extracellular calcium concentration, Equation 1 holds withn = 5, but when TEA is used to broaden the presynaptic action potential, n = 1.6 (Delaney et al., 1991). This suggests that in crayfish the manner in which spike broadening enhances synaptic strength is intermediate between those in the squid giant synapse and in the granule cell to Purkinje cell synapse.
Control of presynaptic waveform
The finding that release is exquisitely sensitive to the presynaptic waveform at the granule cell to Purkinje cell synapse indicates that modulation of any of the conductances involved in determining the time course of the presynaptic action potential can, in theory, alter synaptic strength. We found, however, that the presynaptic waveform was not significantly changed by activation of presynaptic adenosine A1 receptors (2.2 ± 2.3% reduction in half width) or GABAB receptors (0.3 ± 1.9% reduction). These data can be used to constrain the contributions of spike broadening to synaptic modulation. Assuming Equation 1 to hold with n = 3.1, it is possible to say with 95% confidence that waveform changes account for less than a 20% inhibition of synaptic strength by 10 μm 2-CA and for less than a 12% inhibition by 10 μm baclofen. Thus, even though the half-width of the presynaptic waveform was measured with high precision, because synaptic strength is so sensitive to waveform changes, these data do not eliminate the possibility that a very subtle change in the presynaptic waveform, too small for us to detect, could make modest contributions to synaptic inhibition by baclofen and 2-CA.
We also examined the role of calcium channels and calcium-activated channels in controlling the presynaptic waveform. Previous studies had indicated that calcium-activated potassium channels are involved in spike repolarization in the soma of many cell types and in presynaptic terminals at the frog neuromuscular junction (Robitaille and Charlton, 1992) and that, in other systems, the calcium current itself contributes to the presynaptic waveform (Dunlap and Fischbach, 1978). We found that manipulations that drastically reduced calcium entry did not affect the presynaptic waveform (Fig. 10), suggesting that neither calcium channels nor calcium-activated channels play a prominent role in shaping the presynaptic action potential at this synapse.
The optical approach we have used here also promises to be generally useful in determining whether the shape of the presynaptic action potential is altered by other forms of chemical messenger-mediated modulation and in further elucidating the factors that control the presynaptic waveform and spike repolarization in the mammalian CNS.
Footnotes
This work was supported by National Institutes of Health Grant R01-NS32405-01, a McKnight scholars award, a Klingenstein fellowship award in the neurosciences to W.R., and National Eye Institute Training Grant T32EY07110-06 and a Quan fellowship to B.S. Pfizer generously provided ω-Aga-IVA for these experiments. We thank Pradeep Atluri, Chinfei Chen, Jeremy Dittman, and Bruce Peters for comments on this manuscript.
Correspondence should be addressed to Wade G. Regehr, Department of Neurobiology, Harvard Medical School, 220 Longwood Avenue, Boston MA 02115.
REFERENCES
- 1.Atluri PP, Regehr WG. Determinants of the time course of facilitation at the granule cell to Purkinje cell synapse. J Neurosci. 1996;16:5661–5671. doi: 10.1523/JNEUROSCI.16-18-05661.1996. [DOI] [PMC free article] [PubMed] [Google Scholar]
- 2.Augustine G. Regulation of transmitter release at the squid giant synapse by presynaptic delayed rectifier potassium current. J Physiol (Lond) 1990;431:343–364. doi: 10.1113/jphysiol.1990.sp018333. [DOI] [PMC free article] [PubMed] [Google Scholar]
- 3.Augustine GJ, Adler EM, Charlton MP. The calcium signal for transmitter secretion from presynaptic nerve terminals. In: Stanley EF, Nowycky MC, Triggle DJ, editors. Calcium entry and action at the presynaptic nerve terminal. New York Academy of Sciences; New York: 1991. pp. 365–381. [DOI] [PubMed] [Google Scholar]
- 4.Bean BP. Neurotransmitter inhibition of neuronal calcium currents by changes in channel voltage dependence. Nature. 1989;340:153–156. doi: 10.1038/340153a0. [DOI] [PubMed] [Google Scholar]
- 5.Borst JGG, Sakmann B. Calcium influx and transmitter release in a fast CNS synapse. Nature. 1996;383:431–434. doi: 10.1038/383431a0. [DOI] [PubMed] [Google Scholar]
- 6.Coates CJ, Bulloch GM. Synaptic plasticity in the Molluscan peripheral nervous system: physiology and role of peptides. J Neurosci. 1985;5:2677–2684. doi: 10.1523/JNEUROSCI.05-10-02677.1985. [DOI] [PMC free article] [PubMed] [Google Scholar]
- 7.Delaney K, Tank DW, Zucker RS. Presynaptic calcium- and serotonin-mediated enhancement of transmitter release at crayfish neuromuscular junction. J Neurosci. 1991;11:2631–2643. doi: 10.1523/JNEUROSCI.11-09-02631.1991. [DOI] [PMC free article] [PubMed] [Google Scholar]
- 8.Delbono O, Stefani E. Calcium transients in single mammalian skeletal muscle fibers. J Physiol (Lond) 1993;463:689–707. doi: 10.1113/jphysiol.1993.sp019617. [DOI] [PMC free article] [PubMed] [Google Scholar]
- 9.Dittman JS, Regehr WG. Contributions of calcium-dependent and calcium-independent mechanisms to presynaptic inhibition at a cerebellar synapse. J Neurosci. 1996;16:1623–1633. doi: 10.1523/JNEUROSCI.16-05-01623.1996. [DOI] [PMC free article] [PubMed] [Google Scholar]
- 10.Dodge FA, Rahamimoff R. Co-operative action of calcium ions in transmitter release at the neuromuscular junction. J Physiol (Lond) 1967;193:419–432. doi: 10.1113/jphysiol.1967.sp008367. [DOI] [PMC free article] [PubMed] [Google Scholar]
- 11.Dunlap K, Fischbach GD. Neurotransmitters decrease the calcium component of sensory neurone action potentials. Nature. 1978;276:837–839. doi: 10.1038/276837a0. [DOI] [PubMed] [Google Scholar]
- 12.Dunlap K, Luebke JI, Turner TJ. Exocytotic Ca2+ channels in mammalian central neurons. Trends Neurosci. 1995;18:89–98. [PubMed] [Google Scholar]
- 13.Eccles JC, Ito M, Szentagothai J. The cerebellum as a neuronal machine. Springer; New York: 1967. [Google Scholar]
- 14.Feller MB, Delaney KR, Tank DW. Presynaptic calcium dynamics at the frog retinotectal synapse. J Neurophysiol. 1996;76:381–400. doi: 10.1152/jn.1996.76.1.381. [DOI] [PubMed] [Google Scholar]
- 15.Fogelson AL, Zucker RS. Presynaptic calcium diffusion from various arrays of single channels. Implications for transmitter release and synaptic facilitation. Biophys J. 1985;48:1003–1017. doi: 10.1016/S0006-3495(85)83863-7. [DOI] [PMC free article] [PubMed] [Google Scholar]
- 16.Gabbiani F, Midtgaard J, Knöpfel T. Synaptic integration in a model of cerebellar granule cells. J Neurophysiol. 1994;72:999–1009. doi: 10.1152/jn.1994.72.2.999. [DOI] [PubMed] [Google Scholar]
- 17.Gainer H, Wolfe SAJ, Obaid AL, Salzberg BM. Action potentials and frequency-dependent secretion in the mouse neurohypophysis. Neuroendocrinology. 1986;43:557–563. doi: 10.1159/000124582. [DOI] [PubMed] [Google Scholar]
- 18.Heidelberger R, Heinemann C, Neher E, Matthews G. Calcium dependence of the rate of exocytosis in a synaptic terminal. Nature. 1994;371:513–515. doi: 10.1038/371513a0. [DOI] [PubMed] [Google Scholar]
- 19.Hille B. The selective inhibition of delayed potassium currents in nerve by tetraethylammonium ion. J Gen Physiol. 1967;50:1287–1302. doi: 10.1085/jgp.50.5.1287. [DOI] [PMC free article] [PubMed] [Google Scholar]
- 20.Hille B. Ionic channels of excitable membranes, Ed 2. Sinauer Associates; Sunderland, MA: 1992. [Google Scholar]
- 21.Hochner B, Klein M, Schacher S, Kandel ER. Action-potential duration and the modulation of transmitter release from the sensory neurons of aplysia in presynaptic facilitation and behavioral sensitization. Proc Natl Acad Sci USA. 1986;83:8410–8414. doi: 10.1073/pnas.83.21.8410. [DOI] [PMC free article] [PubMed] [Google Scholar]
- 22.Howe JR, Ritchie JM. On the active form of 4-aminopyridine: block of K+ currents in rabbit Schwann cells. J Physiol (Lond) 1991;433:183–205. doi: 10.1113/jphysiol.1991.sp018421. [DOI] [PMC free article] [PubMed] [Google Scholar]
- 23.Klein M, Kandel ER. Mechanism of calcium current modualtion underlying presynaptic facilitation and behavioral sensitization in Aplysia. Proc Natl Acad Sci USA. 1980;77:6912–6916. doi: 10.1073/pnas.77.11.6912. [DOI] [PMC free article] [PubMed] [Google Scholar]
- 24.Kocsis JD, Malenka RC, Waxman SG. Effects of extracellular potassium concentration on the excitability of the parallel fibres of the rat cerebellum. J Physiol (Lond) 1983;334:225–244. doi: 10.1113/jphysiol.1983.sp014491. [DOI] [PMC free article] [PubMed] [Google Scholar]
- 25.Konnerth A, Obaid AL, Salzberg BM. Optical recording of electrical activity from parallel fibres and other cell types in skate cerebellar slices in vitro. J Physiol (Lond) 1987;393:681–702. doi: 10.1113/jphysiol.1987.sp016848. [DOI] [PMC free article] [PubMed] [Google Scholar]
- 26.Lando L, Zucker RS. Ca2+ cooperativity in neurosecretion measured using photolabile Ca2+ chelators. J Neurophysiol. 1994;72:825–830. doi: 10.1152/jn.1994.72.2.825. [DOI] [PubMed] [Google Scholar]
- 27.Levitan IB. Modulation of ion channels by protein phosphorylation and dephosphorylation. Annu Rev Physiol. 1994;56:193–212. doi: 10.1146/annurev.ph.56.030194.001205. [DOI] [PubMed] [Google Scholar]
- 28.Llinas R, Steinberg IZ, Walton K. Relationship between presynaptic calcium current and postsynaptic potential in squid giant synapse. Biophys J. 1981;33:323–352. doi: 10.1016/S0006-3495(81)84899-0. [DOI] [PMC free article] [PubMed] [Google Scholar]
- 29.MacKinnon R, Yellen G. Mutations affecting TEA blockade and ion permeation in voltage-activated K+ channels. Science. 1990;250:276–279. doi: 10.1126/science.2218530. [DOI] [PubMed] [Google Scholar]
- 30.Mintz IM, Sabatini BL, Regehr WG. Calcium control of transmitter release at a cerebellar synapse. Neuron. 1995;15:675–688. doi: 10.1016/0896-6273(95)90155-8. [DOI] [PubMed] [Google Scholar]
- 31.Palay SL, Chan-Palay V. Cerebellar cortex. Springer; New York: 1974. [Google Scholar]
- 32.Plonsey R, Barr R. Bioelectricity: a quantitative approach. Plenum; New York: 1991. [Google Scholar]
- 33.Regehr WG, Atluri PP. Calcium transients in cerebellar granule cell presynaptic terminals. Biophys J. 1995;68:2156–2170. doi: 10.1016/S0006-3495(95)80398-X. [DOI] [PMC free article] [PubMed] [Google Scholar]
- 34.Regehr WG, Mintz IM. Participation of multiple calcium channel types in transmission at single climbing fiber to Purkinje cell synapses. Neuron. 1994;12:605–613. doi: 10.1016/0896-6273(94)90216-x. [DOI] [PubMed] [Google Scholar]
- 35.Regehr WG, Tank DW. Selective fura-2 loading of presynaptic terminals and nerve cell processes by local perfusion in mammalian brain slice. J Neurosci Methods. 1991;37:111–119. doi: 10.1016/0165-0270(91)90121-f. [DOI] [PubMed] [Google Scholar]
- 36.Robitaille R, Charlton MP. Presynaptic calcium signals and transmitter release are modulated by calcium-activated potassium channels. J Neurosci. 1992;12:297–305. doi: 10.1523/JNEUROSCI.12-01-00297.1992. [DOI] [PMC free article] [PubMed] [Google Scholar]
- 37.Sabatini BL, Regehr WG. Detecting changes in calcium influx which contribute to synaptic modulation in mammalian brain slice. Neuropharmacology. 1995;34:1453–1467. doi: 10.1016/0028-3908(95)00129-t. [DOI] [PubMed] [Google Scholar]
- 38.Sabatini BL, Regehr WG. Timing of neurotransmission at fast synapses in the mammalian brain. Nature. 1996;384:170–172. doi: 10.1038/384170a0. [DOI] [PubMed] [Google Scholar]
- 39.Siegelbaum SA, Camardo JS, Kandel ER. Serotonin and cyclic AMP close single K+ channels in Aplysia sensory neurones. Nature. 1982;299:413–417. doi: 10.1038/299413a0. [DOI] [PubMed] [Google Scholar]
- 40.Simon SM, Llinas RR. Compartmentalization of the submembrane calcium activity during calcium influx and its significance in transmitter release. Biophys J. 1985;48:485–498. doi: 10.1016/S0006-3495(85)83804-2. [DOI] [PMC free article] [PubMed] [Google Scholar]
- 41.Spencer AN, Przsiezniak J, Acosta-Urquidi J, Basarsky TA. Presynaptic spike broadening reduces junctional potential amplitude. Nature. 1989;340:636–638. doi: 10.1038/340636a0. [DOI] [PubMed] [Google Scholar]
- 42.Stephens GJ, Garratt JC, Robertson B, Owen DG (1994) On the mechanism of 4-aminopyridine action on the cloned mouse brain potassium channel mKv1.1. J Physiol (Lond) 477(part 2):187–196. [DOI] [PMC free article] [PubMed]
- 43.Vranesic I, Iijima T, Ichikawa M, Matsumoto G, Knöpfel T. Signal transmission in the parallel fiber-Purkinje cell system by high-resolution imaging. Proc Natl Acad Sci USA. 1994;91:13014–13017. doi: 10.1073/pnas.91.26.13014. [DOI] [PMC free article] [PubMed] [Google Scholar]
- 44.Wheeler DB, Randall A, Tsien RW. Changes in action potential duration alter reliance of excitatory synaptic transmission on multiple types of Ca2+ channels in rat hippocampus. J Neurosci. 1996;16:2226–2237. doi: 10.1523/JNEUROSCI.16-07-02226.1996. [DOI] [PMC free article] [PubMed] [Google Scholar]
- 45.Wu L-G, Saggau P. Pharmacological identification of two types of presynaptic voltage-dependent calcium channels at CA3–CA1 synapses of the hippocampus. J Neurosci. 1994;14:5613–5622. doi: 10.1523/JNEUROSCI.14-09-05613.1994. [DOI] [PMC free article] [PubMed] [Google Scholar]
- 46.Zhao M, Hollingworth S, Baylor SM. Properties of tri- and tetracarboxylate Ca2+ indicators in frog skeletal muscle fibers. Biophys J. 1996;70:896–916. doi: 10.1016/S0006-3495(96)79633-9. [DOI] [PMC free article] [PubMed] [Google Scholar]


