

Abstract
Near-infrared (NIR, 740–780 nm) optogenetic systems are well-suited to spectral multiplexing with blue-light-controlled tools. Here, we present two protocols, one for regulation of gene transcription and another for control of protein localization, that use a NIR-responsive bacterial phytochrome BphP1–QPAS1 optogenetic pair. In the first protocol, cells are transfected with the optogenetic constructs for independently controlling gene transcription by NIR (BphP1–QPAS1) and blue (LightOn) light. The NIR and blue-light-controlled gene transcription systems show minimal spectral crosstalk and induce a 35- to 40-fold increase in reporter gene expression. In the second protocol, the BphP1–QPAS1 pair is combined with a light-oxygen-voltage-sensing (LOV) domain-based construct into a single optogenetic tool, termed iRIS. This dual-light-controllable protein localization tool allows tridirectional protein translocation among the cytoplasm, nucleus and plasma membrane. Both procedures can be performed within 3–5 d. Use of NIR light–controlled optogenetic systems should advance basic and biomedical research.
INTRODUCTION
Non-opsin optogenetic tools allow light-control of a variety of biological processes in cells and in whole organisms1,2. Most of the developed optogenetic tools are operated by a single wavelength, and hence enable control of a single cellular event, such as promoting gene transcription or activation of a signaling pathway3,4. However, the majority of physiological processes are controlled by multifunctional regulatory molecules or their ensembles. Thus, optogenetic tools for spectral multiplexing are required to increase the complexity of light-driven manipulations. Here, we present a protocol for our recently developed approach for gene transcription activation with a NIR (740–780 nm) light-sensing optogenetic system based on a bacterial phytochrome from Rhodopseudomonas palustris (RpBphP1; hereafter BphP1) and its engineered protein partner QPAS1 (ref. 5). This protocol allows multiplexing of the BphP1–QPAS1 system with blue-light-controllable tools with minimal spectral crosstalk. We also provide a protocol for manipulation of the intracellular protein localization independently controlled by blue and NIR light.
Development of the protocol
Protein–protein interactions (PPIs) have a crucial role in cellular functions and biological processes in all organisms. Control of PPIs by light should promote the progress of basic biology and biomedicine due to noninvasiveness, adjustability, high spatiotemporal resolution and potential for multiplexing. Natural diversity of light-sensing photoreceptors allowed the development of a series of effective tools for regulation of cell functions by light6. Among them, the tools based on bacterial phytochromes were shown to be beneficial for use in mammalian cells and whole animals. This is because bacterial phytochromes use biliverdin IXα (BV), which is a ubiquitous heme derivative present in mammalian cells, as a chromophore7–9 and are naturally sensitive to farred and NIR light, which penetrates deep into mammalian tissues through the so-called tissue transparency window between 650 and 900 nm (refs. 10,11).
The first BphP1-based optogenetic system for a light-controllable PPI was designed using its full-length natural binding partner RpPpsR2 (hereafter referred to as PpsR2)4. BphP1 is a light-sensing component of the BphP1–PpsR2 optogenetic system and adopts the Pfr state, absorbing at 760 nm in the dark. Under NIR light of 740–780 nm, it undergoes photoconversion into the Pr state, absorbing at 680 nm and resulting in the binding of PpsR2. This light-controllable reversible PPI was successfully used to regulate cell signaling and gene transcription in cultured cells and in mice4. At this stage, it was shown that prolonged expression of BphP1 in mammalian cells allows usage of the system without the requirement for exogenous BV.
Further improvement in the BphP1 system led to the development of an engineered PpsR2 variant, called QPAS1, which is threefold smaller than the natural protein and lacks domains potentially involved in its oligomerization. The resulting BphP1–QPAS1 system was used for both transcription activation and transcription inhibition by NIR light. Moreover, the interaction of BphP1 and QPAS1 was used for light-induced intracellular protein relocalization. Detailed analysis of the spectral behavior of the BphP1-based tools revealed negligible cross-activation with common GFP-like fluorescent proteins. More importantly, this also facilitates spectral multiplexing with blue-light-activatable optogenetic constructs, thereby allowing for fast, reversible, two-color-controlled protein targeting in cells. We have recently combined the BphP1–QPAS1 tool with an optogenetic tool based on a LOV domain from Avena sativa phototropin-1 (hereafter AsLOV2), in which the caged nuclear localization signal (cNLS) is uncaged in response to 460-nm light5. In this protocol, we describe two multiplexing approaches for light-controlled transcription activation and protein targeting. In the first, gene expression is activated in mammalian cells in response to NIR and blue light with negligible spectral crosstalk. In the second approach, the protein of interest is actively relocalized from the cytoplasm to either the plasma membrane or the nucleus, being independently controlled by two distinct colors.
Applications of the method
Spatiotemporal optogenetic control of biochemical processes in cells and animals can advance basic biology and biomedicine. An important venue of optogenetic manipulation is the modulation of cellular PPIs to control various cellular processes. NIR-light-controlled tools may be applied to activate almost any physiological process dependent on PPIs.
Genetically encoded optogenetic NIR-light-dependent systems exhibit several advantages over pharmacologically inducible PPI approaches; these include noninvasiveness, high PPI activation rates, fast reversibility and lack of potential side effects of drugs. These systems can be used not only in cell culture but also in animals for controlling intracellular protein localization, induction of enzymatic activity and activation of gene expression4. The BphP-based transcription regulation systems are compatible with reporter systems based on a Tet response element (TRE) and a Gal4 upstream activation sequence (UAS). These reporter systems are the most popular for conditional transcription activation in animals and, consequently, various Tet- and Gal4-responder animal lines (including fruit flies, zebrafish and mice) are available12–14, which potentially allows wide application of the BphP1-based transcription activation in animals.
Beyond proof-of-principle applications, non-opsin optogenetic systems have been proven useful for controlling the physiology of various invertebrate15,16 and vertebrate organisms4,17,18. Among biological processes, cell differentiation and reprogramming were light-regulated to achieve tissue modeling19. These types of applications can benefit greatly from multiplexing with visible-light tools, potentially allowing more-complex differentiation scenarios. Indeed, cellular differentiation processes during development are usually guided by transcription factor ensembles rather than single triggering molecules. Although complex gene networks were modeled in bacteria20, substantially fewer multiplexing approaches are known for mammalian cells21,22, making BphP1–QPAS1-based systems beneficial for multicolor control of cell differentiation. Unlike the original PpsR2, the smaller QPAS1 in the BphP1–QPAS1 pair is expected to be preferable in certain size-limited gene-delivery systems, such as adeno-associated viruses. Such virus-mediated delivery is hardly possible for larger light-sensitive proteins such as GIGANTEA23 or PhyB (ref. 24), or those which require delivery of additional enzymes to provide chromophore synthesis25. Its viral gene delivery will allow use of the BphP1–QPAS1 pair in various difficult-to-transfect cell lines and in tissues of living animals, expanding its applicability.
Moreover, the smaller QPAS1 size enables combination of the BphP–QPAS1-based NIR-sensitive system with the AsLOV2-based blue-light-sensitive optogenetic system. A near-IR-blue-light-inducible shuttle (termed iRIS), based on QPAS1 (NIR) and LOV (blue), allows researchers to target proteins to the nucleus with blue light (460 nm), to the plasma membrane with NIR light and to the cytoplasm in the dark. Among other possible applications, the iRIS could also be used for more stringent regulation of protein localization. For example, a transcription factor could be caged at the plasma membrane using the iRIS. This caging could act synergistically with a nuclear exclusion signal (NES) to additionally reduce the background activity of a transcription factor in the nucleus. In this case, activation of the transcription factor would require two triggers, dark relaxation of BphP1 for uncaging from the membrane and blue light for active nuclear transport, providing more stringent control. In applications in which protein activity or protein signaling depends on its localization, the iRIS creates new approaches to study functions of signaling molecules in specific subcellular environments. Instead of the membrane-localization peptide sequence in the current iRIS variant, various protein-targeting signals could be used to target a protein of interest to different organelles or allow its secretion. As bacterial phytochrome-based and LOV-based optogenetic tools have been used separately in non-mammalian model animals15,26–28, we anticipate that the iRIS-based approach can be applied in various model animals. Activation of the BphP1 part of the system can be done with NIR light, whereas activation of the LOV part of the system can be done with 460-nm blue light or 900-nm light in two-photon mode.
Similar to other light-sensitive proteins used for optogenetic tool development, the BphP1–QPAS1 pair can be further modified using protein-engineering techniques1,29,30. Potential properties to modify include the BV binding rate (to avoid uncontrolled interaction with QPAS1), background QPAS1 interaction in the Pfr state, the kinetics of BphP1 photoconversion and the stability of the Pr and Pfr states. For the last, experimental data from the area of bacterial phytochrome-based NIR fluorescent proteins can be used for structure-guided rational design31,32.
Comparison with other methods
Many systems using small molecules to control PPIs share common drawbacks. Among these drawbacks are the lack of temporal and spatial precision, potential side effects of the activating drugs33, slow pharmacokinetics and large consumption of expensive compounds. Some systems are also reported to be leaky or to demand more-specific reagents34,35. Optogenetic systems lack these drawbacks, and inexpensive, widely available LED emitters allow easy custom assembly of low-voltage light sources for illumination in any spectral range, from UV to IR.
Optogenetic tools developed from bacterial phytochromes possess several advantages over other light-controlled systems. First, the BV availability in mammalian cells and tissues makes the application of the bacterial phytochrome-based systems independent of exogenously supplied chromophores, whereas plant phytochrome-derived constructs, such as those based on PhyB, although exploited in a wide range of light-controlled applications24,36, require the phycocyanobilin compound as a chromophore. This compound is not available in eukaryotic cells and should be delivered exogenously or synthesized intracellularly by overexpressing several bacterial enzymes25,37, potentially incurring cytotoxicity and other side effects.
Second, bacterial phytochrome–based tools are sensitive to NIR light, which has a higher penetration depth by virtue of low light absorption and scattering of 650- to 800-nm light by mammalian tissues (Supplementary Fig. 1). By contrast, blue-light-controlled tools require much higher light intensities, when applied to animal models, to achieve light-activation in deep tissues3. It is also known that the plant phytochrome-based tools are extremely sensitive to farred light (660 nm)37. Moderate sensitivity to light and reversibility of BphP1 activation make the BphP1-based tools tolerate low-level ambient light, which makes them easier to work with in an experimental setting. BphP1-based tools are also non-sensitive to illumination from conventional light sources with an emission peak in the blue–yellow spectral range. However, some precautions with broadband and blue-light sources are required because a partial BphP1 activation through its Soret absorption band, which peaks at 390–420 nm, may occur.
These properties of optogenetic tools based on bacterial phytochromes make them more valuable when combined with other light-sensitive constructs. In this regard, AsLOV2-based tools for protein targeting28,38–40 using the peptide caging–uncaging principle are perfect for this combination. Until now, all protein-targeting optogenetic systems could either direct a protein of interest from the cytosol to a single specific compartment (e.g., plasma membrane, mitochondria, nucleus and peroxisomes) or translocate it between two different locations (e.g., nucleus and mitochondria). In this protocol, the two-color-controllable tool iRIS, which uses the AsLOV2 domain, provides tridirectional protein targeting, which is not possible with optogenetic tools of monochromatic light.
Limitations
Despite successful use of the BphP1–QPAS1 pair for light-control of cellular processes, there are several factors that currently narrow its applications. Most of the limitations are shared with similar systems, which use light or drugs to control PPIs.
One potentially limiting feature of the bacterial phytochrome-based tools is dependence on cellular BV, which was shown to vary depending on the particular tissue or cell type9. As the BphP1 apoprotein likely can also interact with PpsR2 in a light-independent way41, high BphP1 concentrations and a shortage of BV may lead to undesired PPIs in the dark, reducing the light-to-dark signal contrast. This may become especially critical for applications in which absolute signal values are sometimes hard to compare or estimate correctly, and it can be a limiting step, in particular for applications that are sensitive to the background level in the dark.
However, in cell culture, this can be overcome by the generation of a stable cell line with low expression of the BphP1 component (see Box 1 for detailed procedures). Applicability of the BphP1–QPAS1 systems in vivo in tissues with low BV levels, such as neural tissues, must be tested. However, successful visualization of NIR fluorescent proteins incorporating BV as a chromophore in neurons and in the mouse brain42 provides reasons for optimism.
Box 1 |. Generation of a cell line stably expressing the BphP1 component of the optogenetic system ● TIMING 6 weeks.
BV is an essential factor for the correct functioning of bacterial phytochrome–based optogenetic systems. In mammalian cells, BV exists in equilibrium with bilirubin, and these together act as a part of the protective system against cellular stress49. Endogenous BV levels are usually sufficient in experiments with bacterial phytochrome expression over prolonged times4,50. However, if delivered using transient transfection, the high level of BphP1 expression may require additional BV, which can be supplemented exogenously. Alternatively, a cell line stably expressing BphP1 can be generated to bypass the need for exogenous BV supplementation.
The efficiency of stable cell-line generation can be substantially increased by using a transposase system such as Sleeping Beauty45. Transposases facilitate the integration of the intact nucleotide sequence of interest into the genome by using a cut-and-paste mechanism. To do so, the BphP1–mCherry–TetR encoding cassette is placed between terminal repeats, which are recognized by the Sleeping Beauty transposase (pT2/SVNeo-103, see Table 1). Cells are cotransfected with plasmid pT2/SVNeo-103 and the pCMV(CAT)T7-SB100 transposase-producing plasmid (Table 1).
Procedure
Seed 4 × 10⁵ HeLa cells in 3 ml of DMEM supplemented with 10% (vol/vol) FBS and 1% (vol/vol) penicillin–streptomycin in a 60-mm culture dish. Let the cells adhere overnight.
-
The next day, cotransfect the cells with pT2/SVNeo-103 and pCMV(CAT)T7-SB100 plasmids using Effectene transfection reagent as follows: mix 900 ng of pT2/SVNeo-103 and 100 ng of pCMV(CAT)T7-SB100 plasmids with the DNA-condensation buffer EC, to a total volume of 150 µl. Add 8 µl of enhancer and mix by vortexing for 1 s. Incubate at room temperature for 2–5 min.
▲ CRITICAL STEP To avoid toxic effects after transfection, use endotoxin-free quality plasmid DNA purification kits.
Add 25 µl of Effectene transfection reagent to the DNA-enhancer mixture. Mix the samples by vortexing for 10 s. Incubate the samples for 5 min at room temperature for transfection-complex formation.
While complex formation takes place, aspirate the medium from the 60-mm culture dish with cells, wash the cells once with 3 ml of PBS and add 4 ml of DMEM medium supplemented with 10% (vol/vol) FBS and 1% (vol/vol) penicillin–streptomycin to the cells.
Add 1 ml of DMEM media supplemented with 10% (vol/vol) FBS and 1% (vol/vol) penicillin–streptomycin to the tube containing the transfection complexes, and mix by pipetting. Add the transfection complexes dropwise to the cells in the culture dish, and gently shake the dish to ensure uniform distribution of the transfection complexes.
14–16 h after incubation with the transfection complex, replace the transfection complex with DMEM supplemented with 10% (vol/vol) FBS and 1% (vol/vol) penicillin–streptomycin.
After 8 h of cultivation in a tissue culture incubator, trypsinize the cells and transfer them to a 150-mm culture dish containing 20 ml of DMEM supplemented with 10% (vol/vol) FBS and 1% (vol/vol) penicillin–streptomycin. Let the cells adhere overnight and replace the culture medium with 20 ml of selective medium: DMEM supplemented with 10% (vol/vol) FBS and 1% (vol/vol) penicillin–streptomycin and G418 active component (700 µg ml−1).
-
Change the selective medium every day until colonies appear.
▲ CRITICAL STEP Carefully wash the cells with PBS when changing the selective medium, as many dead cells are expected after several days of cultivation with the selective medium.
After single colonies appear, decrease the concentration of G418 active component to 470 µg ml−1; this will result in faster cell growth.
Once the colonies have increased in size (to ~30–50 cells per colony), trypsinize the cells and transfer them to a 100-mm culture dish containing 10 ml of selective medium. Maintain the cells in selective medium with the concentration of G418 active component at 470 µg ml−1 until confluency.
Trypsinize the cells and transfer them to a 150-mm culture dish containing 20 ml of selective medium. Maintain the cells in selective medium with the concentration of G418 active component at 470 µg ml−1 until confluency.
The day before scheduled FACS-sorting, seed 2 × 10⁶ nontransfected HeLa cells onto a 25-cm2 culture flask. These cells will be used as a negative control to discriminate mCherry-negative cells.
Start preparing the cells 2 h before scheduled sorting. Trypsinize the cells from the 150-mm culture dish, transfer them to a 15-ml sterile tube, pellet the cells (180g, 7 min, 4 °C) and resuspend them in 15 ml of PBS without Ca2+ and Mg2+. Count the cells using a hemocytometer, pellet the cells by centrifugation at 180g for 7 min at 4 °C and resuspend the cells in PBS without Ca2+ and Mg2+ supplemented with 4% (vol/vol) FBS, 2 mM EDTA and 6 U µl−1 benzonase. Filter the cells through a sterile 30-µm filter and transfer them to a sterile FACS tube. Place the tube with cells on ice.
Trypsinize the nontransfected HeLa cells from the 25-cm2 culture flask and transfer them to a 15-ml tube. Pellet the cells by centrifugation at 180g for 7 min at 4 °C, resuspend them in 4 ml of PBS without Ca2+ and Mg2+, filter the cells through a 30-µm filter and transfer them to a sterile FACS tube.
Prepare several collection tubes with 500 µl of DMEM supplemented with 60% (vol/vol) FBS.
Perform FACS sorting. For this, run nontransfected cells and create a gate to select the mCherry-positive cells. Run the transfected cells and sort the mCherry-positive cells (Supplementary Fig. 6).
After sorting, seed the cells into an appropriate culture dish depending on the number of sorted cells. Let the cells adhere overnight and replace the culture medium with selective medium.
Expand the cells in selective medium in a 150-mm dish. This step may take up to 2 weeks and depends on the amount of sorted cells.
To substantially enrich the population of mCherry-positive cells, repeat FACS sorting as described in steps 9–17.
Expand the cells in selection medium in a 150-mm dish.
-
Trypsinize the cells from the 150-mm dish, pellet the cells (180g, 7 min, 4 °C) and resuspend them in 10 ml of DMEM supplemented with 50% (vol/vol) FBS and 10% (vol/vol) DMSO. Put 1-ml aliquots in cryotubes and place the tubes into a freezing container. Incubate the container at −80 °C for 24 h, and then store the tubes in liquid nitrogen.
■ PAUSE POINT The cells can be stored in liquid nitrogen for up to several years.
Another difficulty with the BphP1–QPAS1 pair is its relatively slow kinetics of thermal relaxation (deactivation) as compared with similar systems. Moreover, the level and kinetics of the cellular response to NIR illumination may depend not only on the well-characterized light-controlled PPI between BphP1 and QPAS1 (refs. 4,5), but also on the characteristics of DNA-binding domains (Gal4 and TetR), transcription regulation modules (VP16 and SID) and the protein-targeting peptide signals (NLS, NES and CAAX) used. Similarly, the output signal values in transcription activation, as well as background signals in protein targeting, are strongly influenced by the expression levels of all components of the system. Thus, pilot studies to determine BV dependence and appropriate expression schemes are unavoidable when developing new applications or applying existing tools to specific biological problems.
Experimental design
This protocol is designed to control gene expression or the cellular localization of a protein of interest with NIR and blue light in cultured mammalian cells. For controlling gene expression (Fig. 1a), the cells are transfected with constructs carrying the BphP1-based light-controlled transcription activation system (containing transactivation domain VP16 and DNA-binding domain Gal4, split in a way similar to yeast two-hybrid systems) and the gene of interest under the conditional promoter (Gal4-UAS) (Table 1). At the same time, the cells are also transfected with the blue-light-sensing LightOn transcription activation system3, which is based on a homodimerization of the Vivid (VVD) domain of the LOV protein family (Fig. 1b).
Figure 1 |.

Mode of function of the NIR- and blue-light-inducible transcription activation systems. (a) In the dark, the BphP1 bacterial phytochrome is in the Pfr state and localized in the cytoplasm. NIR light (740 nm) converts BphP1 to the active Pr state, which is able to bind QPAS1. The formed BphP1-QPAS1 complex translocates to the nucleus where it interacts with a reporter gene construct via its Gal4 DNA-binding domain. Gene transcription occurs from the minimal promoter, activated by the BphP1 fused to the VP16 transactivation domain with NLS deleted (VP16dNLS). (b) After the blue-light activation, the Vivid domains homodimerize and interact with a reporter gene construct via its Gal4 domain (1–65). Transcription from the minimal promoter is activated by the p65 transactivation domain. a adapted from ref. 5, Nature Publishing Group.
Table 1 |.
Plasmids used in the protocol.
| Application | Plasmid | Description | Addgene no. | Reference |
|---|---|---|---|---|
| Transcription activation (two-color), Steps 3, 7A | pQP-T2A | BphP1–VP16–T2A–NLS–GAL4–QPAS1 | 102583 | 5 |
| pGAVPO | GAL4–VVD–p65 | Not commercially availablea | 3 | |
| pFR-Luc | UAS-controlled reporter (luciferase) | Not available from Addgeneb | 5 | |
| Tridirectional protein targeting, Steps 3, 7B | pQP-iRIS | BphP1–mVenus–CAAX–IRES2-NES–mCherry–QPAS1–AsLOV2NLS | 102584 | 5 |
| Stable cell line generation, Box 1 | pT2/SVNeo-103 | RpBphP1–mCherry–TetR | 79841 | 4 |
| pCMV(CAT)T7-SB100 | Sleeping Beauty 100× transposase | 34879 | 45 | |
| Kinetics of light-induced transcription activation, Box 2 | pCMV-104 | NLS–PpsR2–VP16 | 79842 | 4 |
| pTRE-Tight-SEAP | TRE-controlled reporter (alkaline phosphatase) | Not commercially availablea | 4 | |
| Light activation of gene expression in mice, Box 3 | pCMV-104 | NLS–PpsR2–VP16 | 79842 | 4 |
| pTRE-Tight-Rluc8 | TRE-controlled reporter (luciferase) | Not commercially availablea | 4 |
Plasmids and plasmid sequences should be requested from the corresponding authors of the respective original publications.
Available from Agilent Technologies, cat. no. 219050.
Then the transfected cells are illuminated with NIR (740 nm) and blue (460 nm) light. Under NIR illumination, the VP16 transactivator and DNA-binding domain associate with each other and relocalize to the cell nucleus (driven by the NLS), where the complex binds the UAS and launches the transcription of a gene of interest. Independently, under blue light, Vivid forms a dimer, allowing Gal4-driven expression in cells expressing the LightOn system. Finally, the cells are analyzed for the expression level of the protein of interest. To achieve the best results, the ratio of plasmids and the transfection procedure should be optimized for each particular cell type. Control cells co-expressing (i) reporter constructs without the activator component and (ii) nonconditional activator with the reporter are needed for estimation of reporter leakage and light-activation dynamic range.
Generation of cells stably expressing the light-sensing component may precede the transient transfection and illumination step in order to achieve light regulation without the necessity of exogenous BV (Box 1, Supplementary Fig. 2). This may be beneficial for the reproducibility, for coexpression with other constructs and when low expression levels of BphP1 are desirable. We recommend establishing stable cell lines if cells do not tolerate transient transfection or BV addition. Otherwise, transient transfection with additional BV in cell culture medium is, usually, a less laborious way to obtain meaningful results. Kinetics of the protein production can be studied using a secreted reporter, such as secreted embryonic alkaline phosphatase (SEAP) (Box 2). Alternatively, the cell line stably expressing BphP1 may be used for transcription activation in mice (Box 3).
Box 2 |. Determination of the kinetics of light-induced transcription activation using a TetR-responsive system ● TIMING 12 h, over 6 d.
To optimize the time of light-induced transcription activation, it is recommended to study the kinetics of protein expression in response to 740-nm light illumination. In this box, we describe how the expression of a reporter protein (SEAP) can be induced by 740-nm light, and how the kinetics of expression can be monitored by detecting secreted SEAP in culture medium samples collected every 6–12 h after the beginning of illumination. For this, HeLa cells stably expressing BphP1–mCherry–TetR (Box 1) are cotransfected with pTRE-Tight-SEAP (7× tetO) reporter plasmid and the pCMV-104 plasmid, encoding the transcription activator VP16 fused with PpsR2 and nuclear localizing signal (Table 1).
Procedure
Culture of HeLa cells ● TIMING 1 h, day 1
-
1
Start with one 80% confluent 100-mm dish containing HeLa cells stably expressing BphP1–mCherry–TetR (Box 1) grown in DMEM medium supplemented with 10% (vol/vol) FBS, 1% (vol/vol) penicillin–streptomycin and G418 active component (470 µg ml−1).
-
2
Trypsinize the cells and seed them in six wells of each of two 12-well plates at a density of 1 × 10⁵ per well in 1 ml of DMEM medium supplemented with 10% (vol/vol) tetracycline-free FBS, 1% (vol/vol) penicillin–streptomycin and G418 active component (470 µg ml−1).
▲ CRITICAL STEP It is important to use tetracycline-free FBS, as trace amounts of tetracycline may affect the efficiency of light-induced SEAP expression.
Transfection procedure ● TIMING 2 h, day 2
-
3
The next day, cotransfect cells in three wells in each plate with pCMV-104 and pTRE-Tight-SEAP, and in the other three wells with a mock plasmid (instead of pCMV-104) and the pTRE-Tight-SEAP plasmid with a plasmid ratio of 5:1. Cells cotransfected with the mock and pTRE-Tight-SEAP plasmids may be used as a control to detect the background level of SEAP expression from the pTRE-Tight-SEAP reporter plasmid. Prepare 300 ng of plasmid DNA mix (all the reagent amounts at this step are indicated per well) with the DNA-condensation buffer (EC buffer), to a total volume of 75 µl. Add 2.4 µl of enhancer and mix by vortexing for 1 s. Incubate at room temperature for 2–5 min.
-
4
Add 6 µl of Effectene transfection reagent to the DNA–enhancer mixture. Mix the samples by vortexing for 10 s. Incubate the samples for 5 min at room temperature for transfection-complex formation.
-
5
While complex formation takes place, aspirate the medium from the cells, wash the cells once with 1 ml of PBS buffer and add 800 µl of DMEM medium supplemented with 10% (vol/vol) FBS and 1% (vol/vol) penicillin–streptomycin.
-
6
Add to the tubes containing the transfection complexes 400 µl of DMEM medium supplemented with 10% (vol/vol) tetracycline-free FBS and 1% (vol/vol) penicillin–streptomycin, and mix by pipetting. Add the transfection complexes dropwise to the cells in the corresponding wells, and gently shake the plate to ensure uniform distribution of the transfection complexes. Transfer the dishes to a tissue culture incubator and protect them from light.
Transcription activation ● TIMING 1 h, days 3–5
-
7
After 8–12 h, replace the culture medium with pre-warmed DMEM medium supplemented with 10% (vol/vol) tetracycline-free FBS, 1% (vol/vol) penicillin–streptomycin and G418 active component (470 µg ml−1).
-
8
Place one culture plate into the cell culture incubator equipped with an illumination source as described in the Equipment Setup section and illuminate the plate with a 740-nm LED with 0.2 mW cm−2 for up to 72 h. Keep the other plate in a separate cell culture incubator or securely covered with black material or aluminum foil.
Sample collection ● TIMING 1 h, days 3–5
-
9
Collect 35 µl of supernatant from each well every 6 or 12 h into separate microtubes, starting right after changing the culture medium after transfection (considering the first samples as at 0 h). Spin the samples down at 200g for 5 min at room temperature to pellet cell debris, and transfer 30 µl of the supernatant to clean microtubes and store them at −20 °C.
▲ CRITICAL STEP Before collecting the samples, gently shake the plate to provide uniform distribution of SEAP in the culture medium.
■ PAUSE POINT The supernatants can be stored at −20 °C for several months.
SEAP assay ● TIMING 4 h, day 6
▲ CRITICAL To detect the level of SEAP in the collected samples, we suggest using a Great EscAPe SEAP Fluorescence Detection Kit. All buffers described in the procedure below are from this kit.
-
10
Thaw the collected supernatants, and transfer 25 µl to individual wells of a 96-well plate.
-
11
Use a multichannel pipette to transfer 25 µl of 1× dilution buffer to each well, and then seal the plate with adhesive tape.
-
12
Incubate the sealed plate at 65 °C on a heat block or in a water bath for 30 min to inactivate endogenous phosphatases.
-
13
Cool the plate by placing it on ice for 2–3 min, and then centrifuge the plate at 1,200g for 3 min at room temperature.
-
14
Use a multichannel pipette to add 75 µl of assay buffer to each well, and incubate the buffer at room temperature for 5 min.
-
15
Prepare enough 120-µM 4-methylumbelliferyl phosphate (MUP) in 1× dilution buffer and use a multichannel pipette to add 25 µl of 120-µM MUP solution to each well.
-
16
Seal the plate with transparent adhesive tape.
-
17
The excitation and emission peaks of MUP fluorescence are 360 nm and 449 nm, respectively; measure the MUP fluorescence for 2 h in 5-min intervals using a plate reader.
Box 3 |. Light activation of gene expression in mice ● TIMING 10 h, over 5 d.
HeLa cells stably expressing BphP1–mCherry–TetR (Box 1) can be used for light-induced transcription activation after s.c. injection in mouse. For this, cells are cotransfected with the pCMV-104 plasmid, encoding the transcription activator VP16 fused with NLS–PpsR2, and the pTRE-Tight-Rluc8 (7× tetO) reporter plasmid, encoding red-shifted Renilla luciferase (Table 1). 24 h after transfection, 3 × 10⁶ cells are s.c. injected into the interscapulum area of an FVB mouse. The efficiency of light-induced transcription activation is detected with an IVIS Spectrum instrument 48 h after injection.
Procedure
Culture of HeLa cells ● TIMING 1 h, day 1
-
1
Start with one 80% confluent 100-mm dish containing HeLa cells stably expressing BphP1–mCherry–TetR (Box 1) in DMEM media supplemented with 10% (vol/vol) FBS, 1% (vol/vol) penicillin–streptomycin and G418 active component (470 µg ml−1). For an experiment on three illuminated animals and three dark-treated control animals, a total of 1.8 × 10⁷ cells are required (3 × 10⁶ cells per animal). To harvest the necessary amount of transfected HeLa cells, cotransfection with pCMV-104 and pTRE-Tight-Rluc8 plasmids (in steps 3–5) should be done on at least four 100-mm dishes (4 × 10⁶ HeLa cells are expected to be harvested from a 100-mm dish after transfection).
-
2
The day before transfection, seed 2 × 10⁶ cells on each 100-mm dish in 10 ml of DMEM medium supplemented with 10% (vol/vol) FBS, 1% (vol/vol) penicillin–streptomycin and G418 active component (470 µg ml−1).
Cotransfection procedure ● TIMING 2 h, day 2
-
3
The next day, ensure that the cells are at high density (confluency ≥80%). To achieve higher transfection efficiency, we recommend using TransIT-LT1 transfection reagent as follows: warm the transfection reagent to room temperature and vortex gently before using. Place 6 ml of Opti-MEM medium in a sterile 15-ml tube. Add 15 µg of the plasmid DNA mix (pCMV-104 and pTRE-Tight-Rluc8 in a 5:1 ratio), and pipette gently to mix completely. Add 45 µl of the transfection reagent to the diluted DNA mixture. Pipette gently to mix completely, and incubate at room temperature for 15–30 min.
-
4
While complex formation takes place, aspirate the medium from each dish with cells, wash the cells once with 10 ml of PBS and add 15.5 ml of DMEM medium supplemented with 10% (vol/vol) FBS, 1% (vol/vol) penicillin–streptomycin and G418 active component (470 µg ml−1).
-
5
Add the DNA complexes dropwise to different areas of the dish. Gently rock the dish back and forth and from side to side to evenly distribute the DNA complexes. Transfer the dish to a tissue culture incubator and protect it from light.
Preparation of animals for the experiment ● TIMING 2 h, day 2
-
6
Before injection of the cells, the fur on the interscapular area of each mouse should be removed with a depilatory cream. To facilitate fur removal before applying the cream, fur may be cut away by using scissors or a shaving machine.
! CAUTION Any experiments involving live mice must conform to relevant institutional and national regulations. All animal experiments in this protocol were performed in an AAALAC-approved facility according to permission no. 20160313 from the Albert Einstein College of Medicine Animal Use Committee.
Harvesting and injection of cells ● TIMING 3 h, day 3
-
7
24 h after transfection in step 5, trypsinize the cells from the culture dishes, transfer them to a 15-ml sterile tube, pellet the cells (180g, 4 °C, 7 min) and resuspend them in 10 ml of PBS without Ca2+ and Mg2+. Count the cells using a hemocytometer, pellet the cells by centrifugation at 180g for 7 min at 4 °C and resuspend them in 0.6 ml of RPMI-1640 media without phenol red and with 2 mM l-glutamine to a final concentration of 3 × 10⁷ ml−1. Transfer the cells to 0.5-ml syringes with a 28-gauge needle (3 × 10⁶ cells in each syringe). Keep the syringes filled with cells on ice in the dark.
▲ CRITICAL STEP During harvesting of transfected cells, do not expose them to bright sources of light.
-
8
Before injection of cells, anesthetize the mice with an isoflurane vaporizer. After s.c. injection, keep the animals under 740-nm light at 1 mW cm−2 or in the dark for 48 h.
! CAUTION Be extremely cautious when handling isoflurane. The liquid is flammable and combustible, and the vapors are toxic.
Imaging of animals ● TIMING 2 h, day 5
-
9
Before imaging, prepare the Rluc8 substrate. Dissolve Inject-A-Lume Coelenterazine native with sterile diluent to a final concentration of 2 mg ml−1 and prefill 0.5-ml syringes with a 28-gauge needle with 40 µl of the diluted substrate.
-
10
After 48 h, anesthetize the mice with an isoflurane vaporizer, and keep them under anesthesia throughout the imaging. Immediately before imaging, inject the mice i.v. through the retro-orbital vein with the Rluc8 substrate. Determine the efficiency of light-induced transcription activation by imaging the animals with an IVIS Spectrum in vivo imaging system.
The optogenetic system for protein targeting consists of the membrane-tethered BphP1 and the QPAS1–AsLOV2 fusion, termed iRIS (Fig. 2). Being localized mainly to the cytoplasm in the dark, the iRIS accumulates in the nucleus under blue light, due to the uncaging of the NLS in the AsLOV2 part28. NIR light targets the iRIS to the plasma membrane as a result of the BphP1–QPAS1 interaction. The tridirectional protein targeting can be observed in a single cell with fluorescence time-lapse imaging and analyzed using fluorescent signals in the cytoplasm and the nucleus.
Figure 2 |.
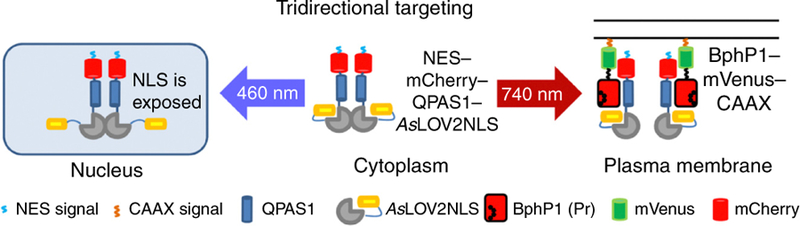
Mode of function of the light-controllable tridirectional subcellular targeting system. In the dark, the NES–mCherry–QPAS1– AsLOV2NLS construct (iRIS) is localized in the cytoplasm and can be targeted to the nucleus or the plasma membrane with blue (460 nm) or NIR (740 nm) light, respectively. Blue light uncages the nuclear localization signal (NLS), which results in the iRIS translocation to the nucleus. NIR light converts the membrane-anchored BphP1 to the active Pr state and triggers its heterodimerization with QPAS1, which results in the iRIS translocation to the plasma membrane. Adapted from ref. 5, Nature Publishing Group.
MATERIALS
REAGENTS
HeLa cells (ATCC, cat. no. CCL-2) ▲ CRITICAL The cell lines should be regularly checked to ensure they are authentic and are not infected with mycoplasma.
DMSO (Fisher BioReagents, cat. no. BP231–100)
Trypsin EDTA (Corning, cat. no. 25–053-CI)
Penicillin–streptomycin (Corning, cat. no. 30–002-CI)
DMEM (GE Healthcare Life Sciences, cat. no. SH30022.02)
PBS (GE Healthcare Life Sciences, cat. no. SH30264.01)
PBS without Ca2+ and Mg2+ (GE Healthcare Life Sciences, cat. no. SH30256.01)
Biliverdin (BV; Frontier Scientific, cat. no. B655–9)
FBS (Gemini Bio-Products, cat. no. 100–106)
-
Effectene Transfection Reagent (Qiagen, cat. no. 301425)
! CAUTION The individual kit components may be harmful; check the safety data provided by the manufacturer.
▲ CRITICAL Transfection efficiency may greatly influence the results of the described protocols. Therefore, the transfection reagent should be carefully chosen.
Plasmid Maxi Prep Kit (Qiagen, cat. no. 12162) ! CAUTION The individual kit components may be harmful; check the safety data provided by the manufacturer.
Plasmid Midi Prep Kit NucleoBond Xtra Midi EF (Macherey-Nagel, cat. no. 740420.50) ! CAUTION The individual kit components may be harmful; check the safety data provided by the manufacturer.
Live cell imaging solution (Life Technologies, cat. no. A14291DJ)
Bioluminescence assay reagent (NanoLight Technology, cat. no. 318) ! CAUTION The individual kit components may be harmful; check the safety data provided by the manufacturer.
Poly-l-lysine solution (0.01% (wt/vol); Merck, cat. no. A-005-C)
Tris-HCl (Thermo Fisher Scientific, cat. no. 15506017)
Glycerol (Thermo Fisher Scientific, cat. no. 17904)
β-mercaptoethanol (Thermo Fisher Scientific, cat. no. 21985023)
Triton X-100 (Thermo Fisher Scientific, cat. no. 85111)
-
PMSF (Thermo Fisher Scientific, cat. no. 36978)
! CAUTION This compound is toxic if swallowed. It causes severe skin burns and eye damage. Protect eyes and skin; do not inhale or swallow.
-
Plasmids (Table 1)
(Optional) Generation of a cell line stably expressing the BphP1 component of the optogenetic system
G418 (Corning, cat. no. 61–234-RF; see Box 1)
-
Benzonase (Millipore Sigma, cat. no. 70746–4)
(Optional) Determination of the kinetics of light-induced transcription activation of the TetR-responsive system
Great EscAPe SEAP Fluorescence Detection Kit (Takara Bio, cat. no. 631704; see Box 2) ! CAUTION The individual kit components may be harmful; check the safety data provided by the manufacturer.
-
FBS, tetracycline free (Takara Bio, cat. no. 631106)
(Optional) Light activation of gene expression in mice
2- to 3-month-old female FVB mice (20–25 g of body weight; see Box 3) (National Cancer Institute (NIH), strain no. 207) ! CAUTION Any experiments involving live mice must conform to relevant institutional and national regulations. All animal experiments in this protocol were performed in an AAALAC-approved facility according to permission no. 20160313 from the Albert Einstein College of Medicine Animal Use Committee.
TransIT-LT1 (Mirus Bio, cat. no. MIR 2304)
Opti-MEM (Gibco, cat. no. 31985062)
RPMI-1640 medium supplemented with l-glutamine (Gibco, cat. no. 11835030)
Inject-A-Lume Coelenterazine (NanoLight Technologies, cat. no. 303-INJ)
l-glutamine (Corning, cat. no. 25005CI)
EQUIPMENT
25-cm2 Culture flask (Corning, cat. no. 430639)
24-Well culture plate (Corning, cat. no. 3526)
Six-well culture plate (Corning, cat. no. 3516)
Inverted microscope (Olympus, model no. IX83 or a comparable epifluorescence microscope (see the Equipment Setup section))
-
NIR LED emitter (LED Engin, cat. no. LZ4–00R308)
! CAUTION If not adjusted properly, LED light sources may produce extremely bright light. Protect your eyes, if necessary.
-
Blue LED emitter (LED Engin, cat. no. LZ4–40B200)
! CAUTION If not adjusted properly, LED light sources may produce extremely bright light. Protect your eyes, if necessary.
Power source (Tekpower, cat. no. TP6005E)
24-gauge stranded wire (Remington Industries, cat. no. 24UL1007STRBLA)
Thermal adhesive tape (Luxeon Star LEDs, cat. no. LXT-S-12)
1-s–60-h pulse-pause timer (Velleman, cat. no. VM188)
NanoDrop ND-2000 spectrophotometer (Thermo Scientific, cat. no. ND2000USCAN)
Power meter (Thorlabs, cat. no. PM130D)
Power sensor (Thorlabs, cat. no. S130C)
Tissue culture hood (Thermo Fisher Scientific, 1300 Series A2 Biological Safety Cabinet)
Tissue culture incubators, set to 37 °C, 5% CO2 (Forma Series 2; Thermo Fisher Scientific, cat. no. 3110)
Victor ×3 multilabel plate reader (PerkinElmer)
Hemocytometer (Hausser Scientific, cat. no. 3120)
35-mm cell culture dish (CELLview; Greiner Bio-One, cat. no. 627 860)
Cell chamber for microscopy (Thermo Fisher Scientific, cat. no. A7816)
Circle coverslips, 25 mm (Thermo Fisher Scientific, cat. no. 1014355125NR1)
96-Well half-area, white, flat-bottom plates (Corning, cat. no. 3693)
Centrifuge with a holder for 96-well plates
200-W metal-halide arc lamp (Lumen, model no. 220PRO)
40× or 60× objective lens (e.g., Olympus UPlanSApo 40×, 0.95-NA (numerical aperture) air or 60×, 1.35-NA oil lens)
Scientific complementary metal oxide semiconductor (sCMOS) camera (e.g., QImaging optiMOS camera)
OriginPro v8.6 graphing and data-analysis software (https://www.originlab.com/)
ImageJ v1.51J8 image analysis software (https://imagej.nih.gov/ij/)
-
Fiji v1.50b image analysis software (https://fiji.sc/)
(Optional) Generation of a cell line stably expressing the BphP1 component of the optogenetic system
150-mm Culture dish (Corning, cat. no. 430599; see Box 1)
100-mm Culture dish (Corning, cat. no. 430167)
60-mm Culture dish (Corning, cat. no. 430166)
FACS tube (Corning, cat. no. 352063)
30-µm Filter (Sysmex, cat. no. 04–004-2336)
-
15-ml Sterile centrifuge tube (Corning, cat. no. 430790)
(Optional) Determination of the kinetics of light-induced transcription activation of the TetR-responsive system
12-Well culture plate (Corning, cat. no. 3513; see Box 2)
96-Well black plate (Greiner Bio-One, cat. no. 655076)
-
SpectraMax M2 fluorescence plate reader (Molecular Devices)
(Optional) Light-activation of gene expression in mice
0.5-ml Syringe (BD, cat. no. 329461; see Box 3)
IVIS Spectrum in vivo imaging system (Perkin Elmer, cat. no. 124262)
REAGENT SETUP
MidiPrep plasmid DNA purification
The purity of plasmid DNA and the absence of endotoxins are critical for transfection efficiency. Use the NucleoBond Xtra Midi EF plasmid purification kit or similar to ensure a pure, endotoxin-free plasmid DNA sample. Purified plasmid can be stored at −20 °C for several months.
Lysis buffer (for bioluminescence assay)
Lysis buffer is 20 mM Tris-HCl, pH 8.0, 10% (vol/vol) glycerol, 0.1% (vol/vol) β-mercaptoethanol, 0.1% (vol/vol) Triton X-100 and 1 mM PMSF. Make fresh lysis buffer before each experiment.
BV stock solution
Prepare a 100 mM BV stock solution in DMSO (this can be stored at 4 °C for up to 6 months). Add the BV stock to the cell culture medium >6 h before the medium change to ensure it completely dissolves. Do not add the transfection reagent in culture medium containing BV. BV is rather stable in the culture medium, so BV-containing medium may be stored for several days at +4 °C.
Poly-l-lysine-coated tissue culture dishes or coverslips
Prepare 0.1 mg ml–1 poly-l-lysine solution in sterile water. Fully cover the surface of the cell culture dish or coverslip. Incubate the solution for 1–12 h at room temperature (20–25 °C). Aspirate the poly-l-lysine solution and wash the vessel with sterile water. Allow the surface to dry aseptically. Coated vessels can be stored at room temperature for at least several weeks.
EQUIPMENT SETUP
Safelight
Preferably, to prevent activation of optogenetic systems by ambient light, a tissue culture hood should be located in a darkroom. If no darkroom is available, cover sources of light, such as windows or doors, with black adhesive vinyl foil or aluminum foil. The tissue culture room can be equipped with a source of orange safelight (Fig. 3). For this, an LED strip or LED bulb emitting light at 550–600 nm may be mounted outside the hood.
Figure 3 |.

Light-sensitivity of the iRIS optogenetic tool. Light-sensitivity of iRIS is determined by a combination of the absorption spectrum of the LOV domain in a ground state (dashed line) and by the previously measured light-action spectrum of BphP1 (solid line). The LOV part of iRIS can be activated with 460-nm light (light-blue box) without notable activation of the BphP1 part. The BphP1 part can be activated with NIR light of 730–790 nm (dark-red box). The dark-yellow box highlights the spectral region that is considered to be ‘safe’ in terms of a near-absence of iRIS light-activation. a.u., arbitrary units. Adapted from ref. 4, Nature Publishing Group.
LED arrays
For illumination of the cells, we designed and used maximally simplified equipment that does not require special skills and that can be assembled in a fast and a cost-effective way (Fig. 4). LEDs of one wavelength for the illumination of tissue culture plates may be mounted on the CPU heat sink. For example, we used a CPU heat sink with a mounting surface area of 60 mm ×y 70 mm. This heat sink accommodates an array consisting of nine LEDs, each 20 mm in diameter. LEDs are mounted on the heat sink with a thermal adhesive tape. All LEDs are connected by a parallel circuit assembly of three rows, each containing three LEDs. LEDs may be connected to a standard power supply. However, to provide regulation of light flux, the power supply should have adjustable voltage and current. The light power should be measured by the optical power meter. The pulse regimen of the illumination can be provided by a pulse-pause timer serially connected between the LED and the power supply. With the pulse-pause timer, ON and OFF steps can be easily adjusted from 1 s to several hours. A support stand with a rod and a wire support with a clamp can be used to hold the LED array above the culture plate to provide even illumination of wells. Light flux power levels used for activation of optogenetic systems are low enough to avoid the need for special measures directed to LED cooling. The passive dissipation of heat provided by the CPU heat sink is sufficient for the vast majority of experiments. If overheating occurs, a fan may be added to the heat sink to increase heat dissipation.
Figure 4 |.

Setup for the LED illumination. (a) The connection scheme of the major components is shown. Nine LEDs mounted on a CPU heat sink and connected by a parallel circuit of three rows with three LEDs each make up the LED array. To provide a pulsed regimen of illumination, the pulse-pause timer is serially connected between the LED array and the power source. (b) Photograph of the assembled setup.
Microscopy setup
Epifluorescence microscopy can be performed with an inverted microscope. A 200-W metal-halide arc lamp can be used for both imaging and activation through the objective, using appropriate filter sets. If activation through the objective is used, check the cutoff wavelength of the IR filter, if installed in a light source to prevent sample overheating, and consider replacing or removing it if the filter does not transmit light within the 700-to 800-nm range. Measure the activation light power density at a back focal plane of the objective lens. Alternatively, LED arrays may be used as a source of activation light. For this, install the arrays instead of the transmitted light source to illuminate the sample from the top, and measure the light intensity at the sample plane. Perform image acquisition using a 40× or 60× objective lens and a sCMOS camera. Do not use the automatic autofocusing systems, which exploit NIR light for measurements of the distance to the sample; check the technical specification of the microscope for details.
PROCEDURE
Culture of HeLa cells ● TIMING 1 h, afternoon of day 1
1| Culture a sufficient amount of healthy HeLa cells in DMEM medium supplemented with 10% (vol/vol) FBS and 1% (vol/vol) penicillin–streptomycin to ensure the appropriate transfection efficiency.
▲ CRITICAL STEP Deteriorated culture is often the cause of excessive toxic effects of the transfection reagent or other undesired effects. Consistency of the subculture schedule is a key to ensuring reproducible results.
2| Dissociate the cells using 1× trypsin–EDTA solution when subconfluent and seed the cells in a 24-well plate to obtain ~80% confluency after overnight cultivation (~1.5 × 10⁵ cells per well). Prepare wells in triplicate for each experimental condition (NIR light, blue light and dark) and for controls. Typically, for transcription activation, at least nontransfected cells and cells transfected with reporter vector and mock plasmid (instead of the light-controlled construct) are used as controls. For estimation of the absolute expression level, cells may be transfected with the transcription activator without a light-sensing component such as Gal4-VP16. Choose additional controls specific to your study, if needed.
Transfection procedure ● TIMING 2 h, day 2
3| To prepare the DNA mix for transcriptional activation and bioluminescence assay, follow option A, and for tridirectional subcellular targeting, follow option B (Table 1).
- DNA mix for transcriptional activation and bioluminescence assay
-
Prepare 200 ng of the following plasmid DNA mix (all the reagent amounts at this step are indicated per well of a 24-well plate):
Tube Plasmid Amount T2A pQP-T2A 150 ng pFR-Luc 50 ng GAVPO pGAVPO 100 ng pFR-Luc 100 nga Control T2A ‘Blank’ plasmid 150 ng pFR-Luc 50 ng Control GAVPO ‘Blank’ plasmid 100 ng pFR-Luc 100 nga aPlasmid ratio according to ref. 3.▲ CRITICAL STEP All mixes should be prepared in a volume sufficient for transfection of cells for three illumination conditions: 740 nm, 460 nm and in the dark, all wells in triplicate.▲ CRITICAL STEP To avoid toxic effects after transfection, use endotoxin-free quality plasmid DNA purification kits (Reagent Setup). - Increase the volume to 60 µl using DNA-condensation buffer. Add 1.6 µl of enhancer and mix by vortexing for 1 s. Incubate at room temperature for 2–5 min.
-
- DNA for tridirectional subcellular targeting
-
Prepare 200 ng of the pQP-iRIS plasmid DNA (all the reagent amounts at this step are indicated per well of a 24-well plate).▲ CRITICAL STEP To avoid toxic effects after transfection, use endotoxin-free quality plasmid DNA purification kits (Reagent Setup).
- Increase the volume to 60 µl using DNA-condensation buffer. Add 1.6 µl of enhancer and mix by vortexing for 1 s. Incubate at room temperature for 2–5 min.
-
4| Add 5 µl of Effectene transfection reagent to the DNA-enhancer mixture. Mix the samples by vortexing for 10 s. Incubate the samples for 5 min at room temperature for transfection-complex formation.
5| Add DMEM medium supplemented with 10% (vol/vol) FBS and 1% (vol/vol) penicillin–streptomycin to the tube containing the transfection complexes to a final volume of 400 µl and mix by pipetting. Aspirate the medium from the 24-well plates, wash once with warm PBS buffer and add the medium with transfection mixes to the cells. Gently shake the plate to ensure uniform distribution of the transfection complexes. Incubate the plate for 6 h under normal growth conditions.
6| Aspirate the medium containing the transfection complexes. Wash the cells once with 1–2 ml of prewarmed PBS buffer. Add 0.5 ml of fresh DMEM medium supplemented with 10% (vol/vol) FBS and 1% (vol/vol) penicillin–streptomycin, and also supplemented with 25 µM BV (for protocol setup without exogenous BV addition, see Box 1). Place the cells back into the incubator for another 42 h when performing the transcription activation and bioluminescence assay (Step 7A), or for 18 h when performing the tridirectional subcellular localization assay (Step 7B).
▲ CRITICAL STEP Although the Effectene transfection reagent may be kept on cells longer than 6 h for most applications, it is not recommended to add BV-containing media to the cells simultaneously with the transfection complexes, as this may lead to inappropriate BV uptake or even cause cytotoxicity.
Illumination and analysis of results
7| Depending on the experimental setup and plasmids used in Step 3, use option A for bioluminescence assay or option B for tridirectional subcellular targeting.
- Transcription activation and bioluminescence assay ● TIMING 3.5 h, days 3–5
-
Turn on the 740-nm (alternating cycles of 30 s of light and 180 s of dark) and 460-nm (continuous) illumination (recommended intensity: 1 mW cm−2) in separate cell culture CO2 incubators or well isolated from one another. Samples transfected with ‘T2A’ and ‘GAVPO’ mixes (see Step 3A) should be illuminated with both 740-nm and 460-nm light separately, so that each illumination condition contains both optogenetic systems for comparison. Keep the dark samples (again both ‘T2A’ and ‘GAVPO’) in a separate CO2 incubator or securely covered with black material or aluminum foil. Control plates can be placed into either an illuminated or dark incubator, as no phototoxicity is expected at the indicated light intensities. Illuminate the cells under normal growth conditions 42 h after the removal of Effectene transfection reagent (Step 6).▲ CRITICAL STEP When arranging the illumination, check for overheating of LED array heat sinks. Monitor the temperature in the CO2 incubator and water condensation on the plate covers due to excessive warming. If overheating occurs, improve the ventilation (add more space between the arrays and CO2 incubator surfaces) or reduce light intensity (740-nm light intensity, as measured on a plate surface, may be reduced to 0.2 mW cm−2 without a noticeable change in transcription activation levels). In addition, separate incubators may be used for NIR and blue light. Pulse illumination regimens help to avoid the overheating.
-
Wash the cells with 1 ml of PBS. Add 100 µl of freshly prepared ice-cold lysis buffer (see the Reagent Setup section) to each well.! CAUTION Work under a hood while using appropriate protection to avoid PMSF inhalation or contact with skin.
- Incubate the cells on a gently agitating platform at 4 °C for 30 min to lyse the cells.
- Transfer 10 µl of cell lysate from each well to a 96-well half-area nontransparent plate.
-
Add 20 µl of Bioluminescence assay reagent to each well, using a multichannel pipette or a luminometer injector. Measure bioluminescence using a luminometer.? TROUBLESHOOTING
-
- Tridirectional subcellular targeting in single cells ● TIMING 6 h, days 3–5
- Incubate the cells in the dark for 18 h after the medium change after the transfection (Step 6). Wash the cells with 1 ml of PBS and dissociate the cells using 1× trypsin−EDTA solution.
-
Seed the cells transfected with pQP-iRIS from Step 6 (4 × 10⁵ to 8 × 10⁵ cells per vessel) in glass-bottom tissue culture dishes (CELLview or similar, see the EQUIPMENT section) or coverslips precoated with poly-l-lysine (Reagent Setup) for better attachment. Incubate the cells under normal growth conditions for 3–24 h to allow them to attach.▲ CRITICAL STEP The incubation step is to ensure a low-density culture of healthy attached cells appropriate for imaging. The duration of incubation depends on the particular cell type and cell culture vessel used, and can also be affected by the expression level of the proteins to be imaged. During the incubation, avoid intensive illumination by avoiding routinely examining the cells under the microscope.
-
Gently aspirate the medium and wash the cells with 3 ml of warm PBS. Be careful if you use nonadherent cells instead of HeLa cells. When using glass coverslips in Step 7B(ii), mount the coverslips into a cell chamber for microscopy according to the chamber manufacturer’s recommendations. Ensure the absence of leakage. Add 37 °C live cell imaging solution, 1–2 ml to the coverglass chamber or 2–3 ml to the glass-bottom tissue culture dish.▲ CRITICAL STEP The maximum incubation time for incubating cells in live cell imaging solution without altering the cell physiology is limited to 2–4 h, depending on cell culture and the illumination scheme. Incubation for too long in live cell imaging solution followed by an imaging session may influence cell viability. Therefore, it is recommended to prepare a single dish before each imaging session, avoiding the simultaneous preparation of dish series.▲ CRITICAL STEP Cells may be imaged at a different confluence or in a different medium, if this is required by the specific protein of interest or experimental design.
- Place the glass-bottom dish or cover glass chamber into the stage holder. Ensure an even temperature in the live cell imaging chamber, to eliminate thermal drift during the time lapse.
-
Determine the appropriate imaging parameters, allowing sufficient signal-to-noise ratio for the ‘red’ mCherry channel (excitation: 560/25 nm; emission: 607/36 nm). Check for proper target protein localization at the initial stage in the dark and acquire an image.▲ CRITICAL STEP At this point, exposure to blue excitation light in the ‘green’ channel (excitation: 485/20 nm; emission: 525/30 nm) should be avoided, to prevent unwanted activation of the LOV-based component of the iRIS. Focusing and target protein observation should be performed using mCherry fluorescence.▲ CRITICAL STEP During the time lapse, the focal plane may be lost due to thermal drift (Step 7B(iv)) or the cells’ natural motility. Therefore, z-stack acquisition is recommended to ensure appropriate focusing during time-lapse imaging.▲ CRITICAL STEP Protocols for epifluorescence imaging are microscope-dependent, and here we provide general guidelines for image acquisition. All of the acquisition steps are described for an Olympus IX83 microscope; however, similar functions should be readily available on most inverted epifluorescence microscopes. Please consider the manufacturer’s instructions for your particular instrument and read the Equipment Setup section.
-
Determine an appropriate frame rate for the analysis of the target protein relocalization kinetics. We recommend starting from 2 frames per min for the activation of the iRIS (both blue and NIR) and 1 frame per 4 min for the recovery.▲ CRITICAL STEP Practically, the target protein relocalization time depends on the fusion partner’s physical properties, the protein diffusion rate in the cytoplasm and the nuclear transport rates (if active nuclear transport is involved). For best performance, pilot trials should be performed to find an optimal frame rate.
- Turn on the 460-nm illumination (recommended intensity: 1 mW cm−2) (see the Equipment Setup section for the description of the illumination setup through the objective lens or using a LED array; also check the recommendations for correct light intensity measurements for both illumination options) and perform time-lapse imaging for relocalization from the cytoplasm to the nucleus.
- Keep the cells in the dark for 30 min in order to allow LOV-domain thermal relaxation. Check the reporter protein for cytoplasmic localization using the mCherry channel. Perform imaging in the mCherry channel during the incubation time in the dark, if needed.
-
Adjust the frame rate for the analysis of the kinetics of target protein relocalization from the cytoplasm to the plasma membrane, turn on the 740-nm illumination (recommended intensity: 1 mW cm−2) and perform time-lapse imaging. Avoid exposure to blue light (excitation: 485/20 nm; emission: 525/30 nm) to prevent activation of the LOV-based component of iRIS.▲ CRITICAL STEP Because the kinetics for the relocalization to the membrane may differ from the kinetics of relocalization to the nucleus, adjust the frame rate appropriately. The frame rate for the relocalization to the membrane may be between 2 and 12 frames per min.
- Keep the cells in the dark for 30 min in order to allow BphP1 thermal relaxation and QPAS1 dissociation. Perform imaging in the mCherry channel during the incubation time in the dark, if needed. The relaxation process may be facilitated by exposure to 620-nm light. 1 mW cm−2 of 620-nm illumination results in doubling of the relaxation rate.
-
Export the images in an uncompressed format suitable for quantitative analysis. Ensure that the images were not automatically corrected in any way, leading to intensity distribution changes.
- Subtract the background fluorescence from the captured images.
- Make a stack from time points and align the images within the stack using rigid body registration or a similar algorithm to reduce misalignment due to cell motility. Choose an appropriate number of regions of interest (ROIs) in the cytoplasm and/or nucleus.
-
Perform analysis of the captured images. Analyze the kinetics of fluorescence intensity in the respective compartments. For each time point, normalize the intensity level to the average fluorescence for the whole cell, to account for photobleaching due to exposure during time-lapse imaging.? TROUBLESHOOTING
? TROUBLESHOOTING
Troubleshooting advice can be found in Table 2.
Table 2 |.
Troubleshooting table.
| Step | Problem | Possible reason | Solution |
|---|---|---|---|
| 7A(v) | High background level of transcription in the dark | QPAS1 or PpsR2 binding by BphP1 apoprotein due to insufficient endogenous BV concentration | Consider one of the following options: |
| • Add BV to the cell culture medium or increase its concentration. Most cell lines are tolerant to BV concentrations up to 25 µM | |||
| • Use a cell line stably expressing BphP1 (Box 1) | |||
| Expression level of transcription activation system components is too high | The easiest solution is to reduce the amount of plasmids used in the transfection procedure (Step 3), either by using mock plasmid as a substitute, or by adjusting the activator/reporter plasmid ratio Alternatively, the following modifications may be performed: | ||
| • Use weaker promoters (may depend on the particular cell line), e.g., CMVd1 (Promega) | |||
| • Use an internal ribosome entry site (IRES) of different efficiency, or use a self-cleaving peptide sequence to adjust the expression levels of system components46,47. | |||
| • Try different transfection reagents or alternative gene-delivery options that are suitable for the particular experiment | |||
| 7B(xiv) | High background level of plasma membrane–bound iRIS in the dark or under 460-nm light (supplementary Fig. 5a) | QPAS1 binding by BphP1 apoprotein due to low endogenous BV concentration, or iRIS expression is too high | See troubleshooting advice for Step 7A(v). |
| • Reduction of the expression level of the iRIS may help. Try to reduce the intensity of 460-nm light, and reduce exposure to ambient illumination | |||
| Shifted cytoplasm–nucleus equilibrium of iRIS localization (e.g., high background in the nucleus under 740-nm light) (supplementary Fig. 5b) | Nuclear transport machinery performance may differ in certain model organisms or cell lines48 | The system may be modified using nuclear localization or nuclear exclusion signals of variable strength28,38–40. Avoid exposure to blue light or ambient illumination | |
| Low mCherry fluorescence signal from the iRIS after time-course imaging | Photobleaching | Reduce the exposure to excitation light (excitation: 485/2 nm or excitation: 560/25 nm) by using neutral-density filters. Alternatively, choose a lower frame rate for image acquisition, or capture fewer z-sections for each time point |
● TIMING
Steps 1 and 2, culture of HeLa cells: 1 h (day 1)
Steps 3–6, transfection procedure: 2 h (day 2)
Step 7A(i), transcription activation: 1.5 h (days 3–5)
Step 7A(ii–v), bioluminescence assay: 2 h (days 3–5)
Step 7B(i,ii), preparation of cells for tridirectional subcellular targeting: 2 h (days 3–5)
Step 7B(iii–x) tridirectional subcellular targeting in single cells: 3 h (days 3–5)
Step 7B(xi–xiv) export of results and data analysis: 1 h (days 3–5)
Box 1, generation of a cell line stably expressing the BphP1 component of the optogenetic system: 6 weeks
Box 2, determination of the kinetics of light-induced transcription activation using a TetR-responsive system: 12 h, over 6 days
Box 3, light-activation of gene expression in mice: 10 h, over 5 days
ANTICIPATED RESULTS
Gene transcription activation (Step 7A)
This PROCEDURE results in the expression of a target gene in the 740-nm illuminated cells, demonstrating a rather low background activation in the dark. Typically, the signal level in the illuminated samples differs from that of those kept in the dark by a factor of 35–40 for both the bioluminescence and the SEAP reporter assays (Fig. 5, Supplementary Fig. 2). The absolute signal level is comparable to that obtained by activation with the nonconditional transcription activators based on the VP16 transactivation domain. Importantly, the increase in target protein expression level in cells expressing the BphP1-based system following exposure to 460-nm light is negligible (Fig. 5), which makes the BphP1–QPAS1 pair an optogenetic system of choice for spectral multiplexing with numerous blue-light-activatable tools.
Figure 5 |.

Spectral compatibility of the BphP1–QPAS1 and blue-light-activatable transcription systems. Light-to-dark ratios of luciferase reporter were detected in HeLa cells transfected with either LightOn or BphP1–QPAS1 transcription activation systems. Samples were illuminated either with continuous 460-nm light of 1 mW cm−2 or 740-nm pulsing light (30 s ON, 180 s OFF) of 1 mW cm−2. The results of individual experiments are shown as dots; bars represent the respective mean values; error bars are s.e.m.; n = 3. Adapted from ref. 5, Nature Publishing Group.
A 35-fold light-to-dark contrast of SEAP production can be achieved using mammalian cells stably expressing BphP1, without any supply of exogenous BV (Boxes 1–3). The SEAP accumulation curve typically has a sigmoid shape and reaches its plateau after 36 h (Supplementary Fig. 2b). A 32-fold increase in bioluminescence, caused by light-controlled transcription activation, may be achieved in the s.c. injected cells stably expressing BphP1 when illuminated in living mice (Supplementary Fig. 3)
Tridirectional targeting in single cells (Step 7B)
The iRIS tool enables the light-controllable translocation of a target protein between the cytoplasm, the nucleus and the plasma membrane in single cells (Fig. 6a, Supplementary Figs. 4 and 5). The relocalization of the target protein fused with a fluorescent tag to the nucleus is observed in response to 460-nm light. The fluorescence level in the nucleus reaches its maximum after ~20 min of blue-light illumination. In the dark, the target protein returns to the cytoplasm, and it can subsequently be recruited to the plasma membrane with 740-nm light. After translocation to the plasma membrane, fluorescence of the target protein’s mCherry tag can be visualized by creating an intensity profile (Supplementary Fig. 4), in which the cell perimeter and the filopodia appear as sharp peaks. Quantification of fluorescence at the plasma membrane can be problematic; therefore, the fluorescence decrease in the cytoplasm is recommended as a quantity to measure for characterization of the kinetics and degree of protein relocalization. When using an epifluorescence microscope without optical sectioning, the typical decrease of cytoplasmic fluorescence due to the targeting to the nucleus or to the plasma membrane is 40% (Fig. 6b). The light-induced relocalization of the target protein from the cytoplasm is rather quick (1–5 min) and fully reversible (Fig. 6b–e). A half-life for the thermal relaxation of the BphP1–QPAS1 system, resulting in returning the protein to the cytoplasm, is ~4.4 min in the dark; this can be reduced to ~2.3 min with 620-nm illumination (Fig. 6e).
Figure 6 |.

Two-color light-controlled tridirectional intracellular protein targeting. (a) Sequential targeting of iRIS from the cytoplasm to the nucleus and to the plasma membrane in a single cell after the indicated illumination periods: after 10 min of 460 nm of 1 mW cm−2 illumination, after 60 min in darkness, after 10 min of 740 nm of 1 mW cm−2 illumination and after 60 min in darkness again. All images were acquired at 37 °C using an epifluorescence microscope. (b) mCherry fluorescence of iRIS in cells illuminated as shown in a. Error bars represent s.e.m., n = 10 cells for each bar. (c) mCherry-tagged protein dissociation from the plasma membrane in the dark due to BphP1 thermal relaxation (time-lapse imaging). (d) Example of region of interest (ROI) placement for quantification of cytoplasmic fluorescence. (e) mCherry fluorescence of iRIS measured in the cytoplasm of HeLa cells pre-illuminated with 740-nm light and subsequently kept in the dark (black line) or under 620-nm illumination (red line). The 1-min pulses of 620-nm light (1 mW cm−2) were alternated with 1 min of darkness. Epifluorescence images of cells were acquired every 4 min. The observed dissociation half-time was ~4.4 min in the dark and ~2.3 min under 620-nm illumination. Fitting of the exponential curve was performed using OriginPro 8.6. Error bars represent s.e.m., n = 10 cells similar to those shown in c for each time point. Scale bars, 10 µm (apply to d as well). a,b,e adapted from ref. 5, Nature Publishing Group.
Further information on experimental design is available in the Life Sciences Reporting Summary.
Supplementary Material
Acknowledgments
This work was supported by grants GM122567 and NS103573 from the US National Institutes of Health, ERC-2013-ADG-340233 from the EU 7th Framework Programme (FP7), and grants 263371 and 266992 from the Academy of Finland.
Footnotes
Note: Any Supplementary Information and Source Data files are available in the online version of the paper.
COMPETING INTERESTS The authors declare no competing interests.
Publisher’s note: Springer Nature remains neutral with regard to jurisdictional claims in published maps and institutional affiliations.
References
- 1.Taslimi A et al. Optimized second-generation CRY2-CIB dimerizers and photoactivatable Cre recombinase. Nat. Chem. Biol 12, 425–430 (2016). [DOI] [PMC free article] [PubMed] [Google Scholar]
- 2.Wang H et al. LOVTRAP: an optogenetic system for photoinduced protein dissociation. Nat. Methods 13, 755–758 (2016). [DOI] [PMC free article] [PubMed] [Google Scholar]
- 3.Wang X, Chen X & Yang Y Spatiotemporal control of gene expression by a light-switchable transgene system. Nat. Methods 9, 266–269 (2012). [DOI] [PubMed] [Google Scholar]
- 4.Kaberniuk AA, Shemetov AA & Verkhusha VV A bacterial phytochrome-based optogenetic system controllable with near-infrared light. Nat. Methods 13, 591–597 (2016). [DOI] [PMC free article] [PubMed] [Google Scholar]
- 5.Redchuk TA, Omelina ES, Chernov KG & Verkhusha VV Near-infrared optogenetic pair for protein regulation and spectral multiplexing. Nat. Chem. Biol 13, 633–639 (2017). [DOI] [PMC free article] [PubMed] [Google Scholar]
- 6.Shcherbakova DM, Shemetov AA, Kaberniuk AA & Verkhusha VV Natural photoreceptors as a source of fluorescent proteins, biosensors, and optogenetic tools. Annu. Rev. Biochem 84, 519–550 (2015). [DOI] [PMC free article] [PubMed] [Google Scholar]
- 7.Ulijasz AT & Vierstra RD Phytochrome structure and photochemistry: recent advances toward a complete molecular picture. Curr. Opin. Plant Biol 14, 498–506 (2011). [DOI] [PubMed] [Google Scholar]
- 8.Piatkevich KD, Subach FV & Verkhusha VV Engineering of bacterial phytochromes for near-infrared imaging, sensing, and light-control in mammals. Chem. Soc. Rev 42, 3441–3452 (2013). [DOI] [PMC free article] [PubMed] [Google Scholar]
- 9.Tran MT et al. In vivo image analysis using iRFP transgenic mice. Exp. Anim 63, 311–319 (2014). [DOI] [PMC free article] [PubMed] [Google Scholar]
- 10.Weissleder R & Ntziachristos V Shedding light onto live molecular targets. Nat. Med 9, 123–128 (2003). [DOI] [PubMed] [Google Scholar]
- 11.Jacques SL Optical properties of biological tissues: a review. Phys. Med. Biol 58, R37–R61 (2013). [DOI] [PubMed] [Google Scholar]
- 12.Lewandoski M Conditional control of gene expression in the mouse. Nat. Rev. Genet 2, 743–755 (2001). [DOI] [PubMed] [Google Scholar]
- 13.Asakawa K & Kawakami K Targeted gene expression by the Gal4-UAS system in zebrafish. Dev. Growth Differ 50, 391–399 (2008). [DOI] [PubMed] [Google Scholar]
- 14.Halpern ME et al. Gal4/UAS transgenic tools and their application to zebrafish. Zebrafish 5, 97–110 (2008). [DOI] [PMC free article] [PubMed] [Google Scholar]
- 15.Smart AD et al. Engineering a light-activated caspase-3 for precise ablation of neurons in vivo. Proc. Natl. Acad. Sci. USA 114, E8174–E8183 (2017). [DOI] [PMC free article] [PubMed] [Google Scholar]
- 16.Harterink M et al. Light-controlled intracellular transport in Caenorhabditis elegans. Curr. Biol 26, R153–R154 (2016). [DOI] [PubMed] [Google Scholar]
- 17.Reade A et al. TAEL: a zebrafish-optimized optogenetic gene expression system with fine spatial and temporal control. Development 144, 345–355 (2017). [DOI] [PMC free article] [PubMed] [Google Scholar]
- 18.Buckley CE et al. Reversible optogenetic control of subcellular protein localization in a live vertebrate embryo. Dev. Cell 36, 117–126 (2016). [DOI] [PMC free article] [PubMed] [Google Scholar]
- 19.Polstein LR, Juhas M, Hanna G, Bursac N & Gersbach CA An engineered optogenetic switch for spatiotemporal control of gene expression, cell differentiation, and tissue morphogenesis. ACS Synth. Biol 6, 2003–2013 (2017). [DOI] [PMC free article] [PubMed] [Google Scholar]
- 20.Fernandez-Rodriguez J, Moser F, Song M & Voigt CA Engineering RGB color vision into Escherichia coli. Nat. Chem. Biol 13, 706–708 (2017). [DOI] [PubMed] [Google Scholar]
- 21.Muller K et al. Multi-chromatic control of mammalian gene expression and signaling. Nucleic Acids Res 41, e124 (2013). [DOI] [PMC free article] [PubMed] [Google Scholar]
- 22.Reichhart E, Ingles-Prieto A, Tichy AM, McKenzie C & Janovjak H A phytochrome sensory domain permits receptor activation by red light. Angew Chem. Int. Ed. Engl 55, 6339–6342 (2016). [DOI] [PubMed] [Google Scholar]
- 23.Yazawa M, Sadaghiani AM, Hsueh B & Dolmetsch RE Induction of protein-protein interactions in live cells using light. Nat. Biotechnol 27, 941–945 (2009). [DOI] [PubMed] [Google Scholar]
- 24.Levskaya A, Weiner OD, Lim WA & Voigt CA Spatiotemporal control of cell signalling using a light-switchable protein interaction. Nature 461, 997–1001 (2009). [DOI] [PMC free article] [PubMed] [Google Scholar]
- 25.Müller K et al. Synthesis of phycocyanobilin in mammalian cells. Chem. Commun. (Camb.) 49, 8970–8972 (2013). [DOI] [PubMed] [Google Scholar]
- 26.Ryu MH et al. Engineering adenylate cyclases regulated by near-infrared window light. Proc. Natl. Acad. Sci. USA 111, 10167–10172 (2014). [DOI] [PMC free article] [PubMed] [Google Scholar]
- 27.Gasser C et al. Engineering of a red-light-activated human cAMP/cGMP-specific phosphodiesterase. Proc. Natl. Acad. Sci. USA 111, 8803–8808 (2014). [DOI] [PMC free article] [PubMed] [Google Scholar]
- 28.Yumerefendi H et al. Control of protein activity and cell fate specification via light-mediated nuclear translocation. PLoS One 10, e0128443 (2015). [DOI] [PMC free article] [PubMed] [Google Scholar]
- 29.Kawano F, Suzuki H, Furuya A & Sato M Engineered pairs of distinct photoswitches for optogenetic control of cellular proteins. Nat. Commun 6, 6256 (2015). [DOI] [PubMed] [Google Scholar]
- 30.Taslimi A et al. An optimized optogenetic clustering tool for probing protein interaction and function. Nat. Commun 5, 4925 (2014). [DOI] [PMC free article] [PubMed] [Google Scholar]
- 31.Chernov KG, Redchuk TA, Omelina ES & Verkhusha VV Near-infrared fluorescent proteins, biosensors, and optogenetic tools engineered from phytochromes. Chem. Rev 117, 6423–6446 (2017). [DOI] [PubMed] [Google Scholar]
- 32.Oliinyk OS, Chernov KG & Verkhusha VV Bacterial phytochromes, cyanobacteriochromes and allophycocyanins as a source of near-infrared fluorescent probes. Int. J. Mol. Sci 18, 1691 (2017). [DOI] [PMC free article] [PubMed] [Google Scholar]
- 33.Albanese C, Hulit J, Sakamaki T & Pestell RG Recent advances in inducible expression in transgenic mice. Semin. Cell Dev. Biol 13, 129–141 (2002). [DOI] [PubMed] [Google Scholar]
- 34.Pham DH, Moretti PA, Goodall GJ & Pitson SM Attenuation of leakiness in doxycycline-inducible expression via incorporation of 3 AU-rich mRNA destabilizing elements. Biotechniques 45, 155–156 (2008). [DOI] [PubMed] [Google Scholar]
- 35.Rennel E & Gerwins P How to make tetracycline-regulated transgene expression go on and off. Anal. Biochem 309, 79–84 (2002). [DOI] [PubMed] [Google Scholar]
- 36.Yu G et al. Optical manipulation of the alpha subunits of heterotrimeric G proteins using photoswitchable dimerization systems. Sci. Rep 6, 35777 (2016). [DOI] [PMC free article] [PubMed] [Google Scholar]
- 37.Müller K, Zurbriggen MD & Weber W Control of gene expression using a red- and far-red light-responsive bi-stable toggle switch. Nat. Protoc 9, 622–632 (2014). [DOI] [PubMed] [Google Scholar]
- 38.Yumerefendi H et al. Light-induced nuclear export reveals rapid dynamics of epigenetic modifications. Nat. Chem. Biol 12, 399–401 (2016). [DOI] [PMC free article] [PubMed] [Google Scholar]
- 39.Niopek D et al. Engineering light-inducible nuclear localization signals for precise spatiotemporal control of protein dynamics in living cells. Nat. Commun 5, 4404 (2014). [DOI] [PMC free article] [PubMed] [Google Scholar]
- 40.Niopek D, Wehler P, Roensch J, Eils R & Di Ventura B Optogenetic control of nuclear protein export. Nat. Commun 7, 10624 (2016). [DOI] [PMC free article] [PubMed] [Google Scholar]
- 41.Fixen KR, Baker AW, Stojkovic EA, Beatty JT & Harwood CS Apo-bacteriophytochromes modulate bacterial photosynthesis in response to low light. Proc. Natl. Acad. Sci. USA 111, E237–E244 (2014). [DOI] [PMC free article] [PubMed] [Google Scholar]
- 42.Piatkevich K et al. Near-infrared fluorescent proteins engineered from bacterial phytochromes in neuroimaging. Biophys. J 113, 2299–2309 (2017). [DOI] [PMC free article] [PubMed] [Google Scholar]
- 43.Schneider CA, Rasband WS & Eliceiri KW NIH Image to ImageJ: 25 years of image analysis. Nat. Methods 9, 671–675 (2012). [DOI] [PMC free article] [PubMed] [Google Scholar]
- 44.Schindelin J et al. Fiji: an open-source platform for biological-image analysis. Nat. Methods 9, 676–682 (2012). [DOI] [PMC free article] [PubMed] [Google Scholar]
- 45.Mátés L et al. Molecular evolution of a novel hyperactive sleeping beauty transposase enables robust stable gene transfer in vertebrates. Nat. Genet 41, 753–761 (2009). [DOI] [PubMed] [Google Scholar]
- 46.Liu Z et al. Systematic comparison of 2A peptides for cloning multi-genes in a polycistronic vector. Sci. Rep 7, 2193 (2017). [DOI] [PMC free article] [PubMed] [Google Scholar]
- 47.Licursi M, Christian SL, Pongnopparat T & Hirasawa K In vitro and in vivo comparison of viral and cellular internal ribosome entry sites for bicistronic vector expression. Gene Ther 18, 631–636 (2011). [DOI] [PubMed] [Google Scholar]
- 48.Pumroy RA & Cingolani G Diversification of importin-α isoforms in cellular trafficking and disease states. Biochem. J 466, 13–28 (2015). [DOI] [PMC free article] [PubMed] [Google Scholar]
- 49.Jozkowicz A, Was H & Dulak J Heme oxygenase-1 in tumors: is it a false friend? Antioxid. Redox Signal 9, 2099–2117 (2007). [DOI] [PMC free article] [PubMed] [Google Scholar]
- 50.Filonov GS et al. Bright and stable near-infrared fluorescent protein for in vivo imaging. Nat. Biotechnol 29, 757–761 (2011). [DOI] [PMC free article] [PubMed] [Google Scholar]
Associated Data
This section collects any data citations, data availability statements, or supplementary materials included in this article.