Abstract
Communication and material transfer between membranes and organelles take place at membrane contact sites (MCSs). MCSs between the ER and PM, the ER/PM junctions, are the sites where the ER Ca2+ sensor STIM1 and the PM Ca2+ influx channel Orai1 cluster. MCSs are formed by tether proteins that bridge the opposing membranes, but the identity and role of these tethers in receptor‐evoked Ca2+ signaling is not well understood. Here, we identified Anoctamin 8 (ANO8) as a key tether in the formation of the ER/PM junctions that is essential for STIM1‐STIM1 interaction and STIM1‐Orai1 interaction and channel activation at a ER/PM PI(4,5)P2‐rich compartment. Moreover, ANO8 assembles all core Ca2+ signaling proteins: Orai1, PMCA, STIM1, IP3 receptors, and SERCA2 at the ER/PM junctions to mediate a novel form of Orai1 channel inactivation by markedly facilitating SERCA2‐mediated Ca2+ influx into the ER. This controls the efficiency of receptor‐stimulated Ca2+ signaling, Ca2+ oscillations, and duration of Orai1 activity to prevent Ca2+ toxicity. These findings reveal the central role of MCSs in determining efficiency and fidelity of cell signaling.
Keywords: ANO8, assembly, Ca2+, signaling, tether
Subject Categories: Membrane & Intracellular Transport, Signal Transduction
Introduction
The receptor‐evoked Ca2+ signal controls virtually all cell functions in all cellular compartments and organelles (Berridge, 2016). The core proteins that form the Ca2+ signaling complex include G protein effectors that activate phospholipase C to hydrolyze PI(4,5)P2 and generate IP3 and diacylglycerol. IP3 activates the IP3 receptors (IP3Rs) in the endoplasmic reticulum (ER) to release Ca2+ stored in the ER. Ca2+ release from the ER is sensed by the ER Ca2+ sensor STIM1, which then clusters at the ER/PM junctions and interacts with and activates the plasma membrane (PM) Ca2+ influx channel Orai1 (Yen & Lewis, 2019). After the increase in cytoplasmic Ca2+ due to ER Ca2+ release and PM Ca2+ influx, the Ca2+ is removed from the cytosol in part by the PM Ca2+ ATPase (PMCA) pump and in part by the ER/SR Ca2+ ATPase (SERCA) pump. Periodic repeat of this cycle results in physiological Ca2+ oscillations (Kiselyov et al, 2006). Disruption of the cycle by excessive Ca2+ influx and sustained increase in cytoplasmic Ca2+ is highly toxic (Petersen, 2014). Cells guard against such toxic effects by inhibition of Ca2+ influx channels shortly after their activation via fast Ca2+‐dependent inhibition (FCDI) and slow Ca2+‐dependent inhibition (SCDI; Prakriya & Lewis, 2015), which is mediated by the interaction of store‐operated calcium entry‐associated regulatory factor (SARAF; Palty et al, 2012; Jha et al, 2013) and calmodulin (Li et al, 2017) with STIM1. In addition to these core proteins, the receptor‐evoked Ca2+ signal is regulated by cytoskeletal proteins (Szasz & Webb, 2017), protein kinases (Lang et al, 2012; Jha et al, 2014), and lipids (Muallem et al, 2017).
The many functions mediated by Ca2+ require placing the core Ca2+ signaling proteins in specific cellular compartments. Examples of spatial segregation of Ca2+ signaling proteins can be seen in spines and synapses (Higley, 2014) and polarized epithelial cells, where all Ca2+ signaling proteins are clustered at the apical pole (Hong et al, 2011). Such an arrangement is essential to generate spatially and temporally precise Ca2+ signals to modulate specific cellular activity at the site where the Ca2+ signal is evoked (Park et al, 2001; Ahuja et al, 2014). It is now clear that compartmentation of cell signaling is achieved by targeting signaling proteins to membrane contact sites (MCSs; Lahiri et al, 2015; Chung et al, 2017; Marchi et al, 2017; Muallem et al, 2017; Nunes‐Hasler & Demaurex, 2017). MCSs are formed between the ER and all cellular organelles, including the mitochondria (Marchi et al, 2017) and the PM (Henne et al, 2015; Chung et al, 2017), by tether proteins. Tether proteins are defined by an ER and target membrane binding motifs, and span and bridge the gap between the two membranes.
The best‐defined tethers that form the ER/PM MCSs are in yeast, in which the three tricalbins (Toulmay & Prinz, 2012), Ist2 (Maass et al, 2009), VAPs (Murphy & Levine, 2016), and a lipid transfer protein are required to form ER/PM MCSs (Henne et al, 2015). ER/PM MCSs in mammalian cells and their role in Ca2+ signaling are not understood as well. The mammalian homologues of yeast tricalbins are the three extended synaptotagmins (E‐Syts), which participate in formation of ER/PM MCSs (Giordano et al, 2013), but appear to have specific functions. E‐Syt1 affects Ca2+ signaling (Chang et al, 2013; Maleth et al, 2014) by regulating translocation of the Orai1‐STIM1 to a PI(4,5)P2‐rich compartment, a function not shared by E‐Syt2 and E‐Syt3 (Maleth et al, 2014). E‐Syt2, but not E‐Syt1 or E‐Syt3, appears to regulate PI4P and PI(4,5)P2 at the ER/PM junctions (Dickson et al, 2016). Recently, GRAMD2a was reported as a junction‐localized protein that impacts STIM1 clustering, but with no role in Ca2+ influx (Besprozvannaya et al, 2018).
The molecular identity of the mammalian homologue of yeast Ist2 and its role in STIM1‐Orai1 function and Ca2+ signaling are not known. Sequence analysis suggests a similarity between Ist2 and members of the Anoctamin family of proteins (Whitlock & Hartzell, 2017). The first two members of the Anoctamin family, ANO1 and ANO2, function as Ca2+‐activated Cl− channels (Stohr et al, 2009). ANO6 functions as a lipid scramblase and Cl− channel, and other Anoctamins have also been reported to have some scramblase activity (Whitlock & Hartzell, 2017). The family consists of 10 members, with very limited information on their properties and cellular functions, except for ANO1 (Dang et al, 2017; Paulino et al, 2017), ANO2 (Huang et al, 2012), and ANO6 (Suzuki et al, 2010; Brunner et al, 2014; Alvadia et al, 2019).
We search for an Anoctamin that functions as an ER/PM tether controlling STIM1‐mediated activation of Orai1 and the subsequent Ca2+‐dependent inactivation of Orai1. Of all the Anoctamins tested, only Anoctamin 8 (ANO8) fulfills these properties. We found that ANO8 controls STIM1‐STIM1 and STIM1‐Orai1 interaction in response to store depletion, formation of STIM1 puncta, SOC‐mediated Ca2+ influx, and activation of Orai1 current and SCDI. In addition, ANO8 facilitates Orai1 channel inactivation by markedly enhancing SERCA2‐mediated Ca2+ influx into the ER, even at cytoplasmic Ca2+ concentration of 0.2 nM. Furthermore, FRET, Co‐IP, and functional analysis revealed that upon cell stimulation ANO8 assembles all the core Ca2+ signaling proteins into complexes at PI(4,5)P2‐rich ER/PM compartment, thereby regulating all aspects of receptor‐evoked Ca2+ oscillations. These findings suggest that ANO8 is a key tether that forms ER/PM MCSs to control the fundamental properties of Ca2+ signaling.
Results
ANO8 controls STIM1‐STIM1 and STIM1‐Orai1 interaction
MCSs at the PM are ER/PM junctions, where STIM1 interacts with and activates Orai1 (Henne et al, 2015; Chung et al, 2017; Yen & Lewis, 2019). The only established tethers at the ER/PM junctions to date with a role in Ca2+ signaling are the E‐Syts (Giordano et al, 2013). Homology analysis suggests that mammalian Anoctamins share similarities with the yeast ER/PM tether Ist2. Potential role of Anoctamins as ER/PM junction tethers was tested by measuring the effect of knockdown of ANO1, 2, 3, 5, 8, 9 or overexpression of ANO4, 6, 7, 8 and 10 on STIM1‐Orai1 current density and Orai1 current inactivation (Appendix Fig S1). Only changes in ANO8 affected the current and channel inactivation (Fig 1). Figure 1A shows that expression of ANO8 together with Orai1 and STIM1 increased the current density by about 85% and the rate of slow Ca2+‐dependent inactivation (SCDI) nearly fourfold when measured with pipette solution containing the slow Ca2+ buffer 3 mM EGTA. Interestingly, expression of the yeast Ist2 increased current density and the rate of SCDI, similar to ANO8 (Appendix Fig S2). Expression of ANO8 increased the native SOCs activated by passive ER Ca2+ store depletion caused by inhibition of the SERCA pumps by 65 ± 8% (P = 0.0001) relative to control YFP‐expressing cells (Fig 1B).
Figure 1. ANO8 increases interaction of STIM1‐Orai1 and STIM1‐STIM1 at the ER/PM junctions to control Ca2+ influx.
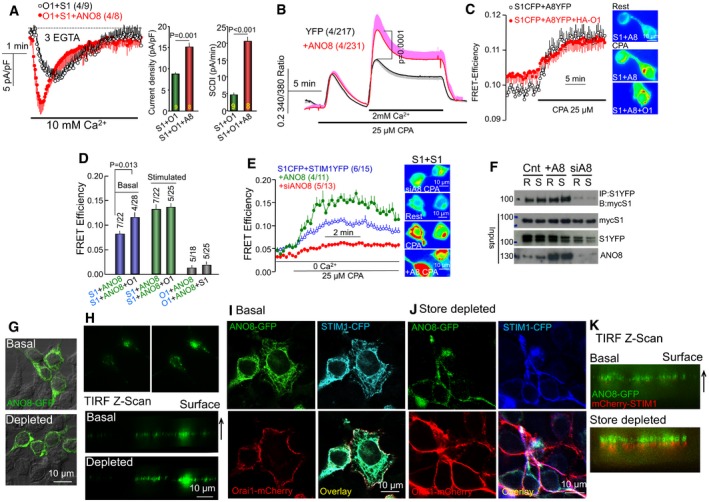
- HEK cells transfected with STIM1‐CFP, Orai1‐mCherry, and with (red) or without (black) untagged ANO8 were used to measure CRAC current with pipette solution (cytoplasmic buffer) containing 3 mM EGTA. The columns show the averaged effect of ANO8 on current density and on the slope of slow Ca2+‐dependent inactivation (SCDI). The results are mean ± SEM, and differences were analyzed by unpaired t‐test.
- Fura2‐loaded HEK cells transfected with YFP (control, black) or ANO8‐YFP (red) were used to measure store‐mediated Ca2+ influx. Stores were depleted by treatment with the SERCA inhibitor CPA, and Ca2+ influx was measured by Ca2+ add‐back. The results are mean ± SEM, and differences were analyzed by unpaired t‐test.
- FRET efficiency was measured with HEK cells transfected with STIM1‐CFP, ANO8‐YFP, and with (red) and without (black) Orai1‐HA before and after store depletion. Here and all other FRET measurements, representative images of the FRET signal under each condition are shown next to the traces. The averages are given in (D).
- Summary of FRET efficiency measurements at the indicated conditions. The results are mean ± SEM, and differences were analyzed by unpaired t‐test.
- FRET efficiency was measured with HEK cells transfected with STIM1‐CFP, STIM1‐YFP (blue), and co‐transfected with untagged ANO8 (green) or treated with siANO8 (red) before and after store depletion.
- Resting (R) or store‐depleted (S) HEK cells transfected with STIM1‐YFP and myc‐STIM1 and with or without ANO8 or treated with siANO8, were used to immunoprecipitate (IP) STIM1‐YFP and blot (B) for myc‐STIM1. The inputs (In) are with anti‐myc, anti‐YFP, or anti‐ANO8.
- Confocal and bright‐field images of basal (upper) and store‐depleted cells (lower) of HEK cells transfected with ANO8‐YFP alone.
- TIRF images (upper) and TIRF‐Z scan (lower) of the same resting and store‐depleted HEK cells transfected with ANO8‐YFP alone.
- Confocal images of resting cells transfected with ANO8‐YFP, STIM1‐CFP, and Orai1‐mCherry.
- Confocal images of store‐depleted cells transfected with ANO8‐YFP, STIM1‐CFP, and Orai1‐mCherry.
- TIRF‐Z scan of resting (upper) and store‐depleted (lower) cells transfected with ANO8‐YFP and STIM1‐mCherry demonstrating the relationship between STIM1 and ANO8 puncta at the TIRF field. Cell surface is on top.
Previous work showed that the SARAF protein mediates most of the SCDI (Palty et al, 2012; Jha et al, 2013). The enhanced SCDI observed with ANO8 raised the question whether it is mediated by SARAF. SARAF interacts with STIM1 to mediate the SCDI, and this requires the clustering of STIM1‐Orai1 at a PI(4,5)P2‐rich domain (Maleth et al, 2014). The results in Fig EV1 shows that only part of the SCDI observed in the presence of ANO8 in mediated by SARAF, although ANO8 increases interaction of ANO8 with STIM1, even in the absence of Orai1. Hence, although ANO8 facilitates interaction of SARAF with STIM1 to enhance SCDI, it also exposes a form of SARAF‐independent Orai1 current inactivation. The mechanism of this novel form of inactivation is explored below.
Figure EV1. SARAF modulates Orai1 SCDI and ANO8 increases STIM1‐SARAF interaction.

- HEK cells transfected with STIM1‐CFP, Orai1‐mCherry, and ANO8 and treated with scrambled (black) or SARAF siRNA (red) were used to measure CRAC current with pipette solution containing 3 mM EGTA.
- FRET efficiency was measured with HEK cells transfected with STIM1‐CFP, SARAF‐YFP, and with (red) and without (black) untagged ANO8 before and after store depletion.
Increased current density (Fig 1A) and Ca2+ influx (Fig 1B) by ANO8 suggested that ANO8 may interact with STIM1 and/or Orai1 to increase their clustering at the plasma membrane. We used a combination of FRET measurements and co‐immunoprecipitation (Co‐IP) to directly examine association of ANO8 with STIM1 and Orai1. Figure 1C and D shows significant basal FRET between STIM1‐CFP and ANO8‐YFP that was enhanced by expression of HA‐Orai1. The summary in Fig 1D and the traces in Fig EV2A show minimal basal FRET between Orai1 and ANO8 even when ANO8‐YFP and Orai1‐mCherry were co‐expressed with myc‐STIM1. Accordingly, ANO8 had no effect on the current of the constitutively active, STIM1‐independent Orai1 (V102C) mutant (Fig EV2B). To determine whether ANO8 affects STIM1 while still in the ER, we measured the effect of ANO8 on STIM1‐STIM1 interaction. In resting cell, overexpression of ANO8 had minimal effect on STIM1‐STIM1 interaction (Fig 1E). Notably, ANO8 significantly increases STIM1‐STIM1 interaction in response to store depletion, while knockdown of ANO8 reduced STIM1‐STIM1 interaction (Fig 1E). These somewhat unexpected results were confirmed by an independent Co‐IP assay in Fig 1F, which shows that ANO8 increased STIM1‐STIM1 Co‐IP while knockdown of ANO8 markedly reduced STIM1‐STIM1 Co‐IP in resting cells (R) and in response to store depletion (S).
Figure EV2. ANO8 does not interact with or activate Orai1.
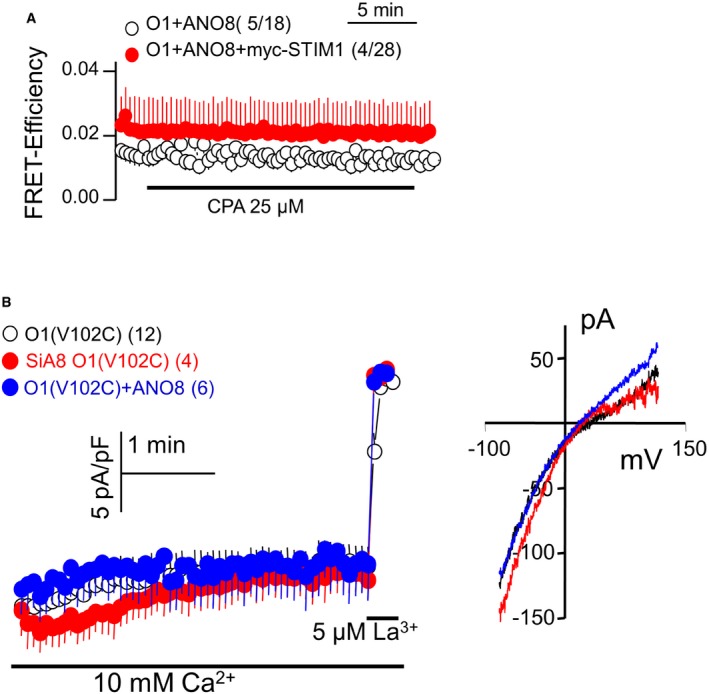
- FRET efficiency was measured with HEK cells transfected with Orai1‐mCherry, ANO8‐YFP, and with (red) and without (black) myc‐STIM1 before and after store depletion.
- Effect of ANO8 on Orai1 current was measured using the STIM1‐independent constitutively active Orai1 (V102C) mutant transfected alone in control cells (black), together with ANO8 (blue) or in cells treated with siANO8 (red).
To further examine the relationship between STIM1 and ANO8, we determined their localization in resting and store‐depleted cells by confocal and TIRF microscopy. When expressed alone (Fig 1G) or together with STIM1 and Orai1 (Fig 1I), ANO8 showed mostly ER localization in resting cells. Store depletion caused enrichment of ANO8 at the plasma membrane (Fig 1G) that was enhanced in the presence of STIM1‐Orai1 clustering (Fig 1J). The TIRF analysis in Fig 1H revealed some puncta of ANO8 at the TIRF field when expressed alone and modest increase by store depletion. This can be seen best at the TIRF‐Z scan images of the same cells (Fig 1H, bottom). Similar TIRF‐Z scans were performed with cells expressing C terminally tagged ANO8‐YFP and N terminally tagged mCherry‐STIM1. Figure 1K shows the ANO8 puncta in resting cells and their enhancement by store depletion. Interestingly, N terminally tagged mCherry‐STIM1 clusters are formed at the ANO8 puncta, but ANO8 is in a plane closer to the plasma membrane than STIM1. This suggests that ANO8 may determine the site of STIM1 clustering with Orai1. The localization studies suggest that the tether function of ANO8 is regulated by store depletion and it appears that when interacting with STIM1, the STIM1‐ANO8 complex translocates to the ER/PM junctions better than ANO8 alone.
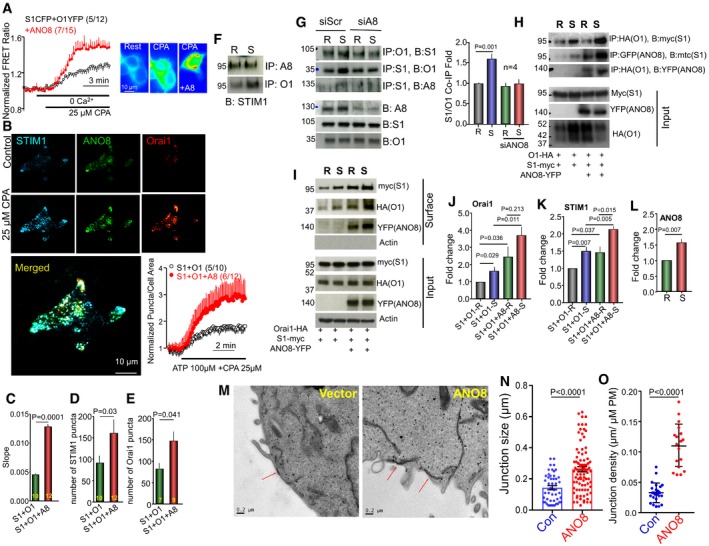
The impact of ANO8 on STIM1‐Orai1 interaction was examined by several assays. Figure 2A shows that ANO8 increased FRET between STIM1‐Orai1. TIRF microscopy showed that Orai1 co‐clusters with ANO8 in the presence of STIM1 in response to store depletion (Fig 2B). Puncta analysis showed that ANO8 increased both the rate and the number of STIM1 puncta (traces in Fig 2B–D) and Orai1 puncta (Fig 2E) by about 50%. Additional evidence for the role of native and expressed ANO8 in STIM1‐Orai1 interaction was obtained by Co‐IP. Immunoprecipitation (IP) of native ANO8 (A8) Co‐IPed native STIM1 in resting cells, which tended to increase by cell stimulation (Fig 2F), although the effect of cell stimulation did not reach statistical significance, probably due to the quality of the antibodies. A clear effect of knockdown of ANO8 is shown in Fig 2G, in which knockdown of ANO8 reduced native STIM1‐Orai1 Co‐IP in response to store depletion. Effect of ANO8 on STIM1‐Orai1 Co‐IP was readily observed with the over‐expressed proteins (Fig 2H).
Figure 2. ANO8 increases native and expressed STIM1‐Orai1 complexes and the number and size of ER/PM junctions.
-
AFRET ratio was measured with HEK cells transfected with STIM1‐CFP, Orai1‐YFP (black), and co‐transfected with untagged ANO8 (red) before and after store depletion with 25 μM CPA in Ca2+‐free solution.
-
B–ETIRF microscopy was used to quantify puncta formation at the TIRF field in cells transfected with STIM1‐CFP, ANO8‐YFP, and Orai1‐mCherry before and after store depletion. (B) Example images and time course of STIM1 puncta formation in cells transfected with STIM1 and Orai1 alone (black) or together with ANO8 (red). (C–E) Effect of ANO8 on the rate of STIM1‐STIM1 clustering (C), number of STIM1 puncta (D), and number of Orai1 puncta (E). The results are mean ± SEM, and differences were analyzed by unpaired t‐test.
-
FHEK cells were used to immunoprecipitate (IP) the native ANO8 (A8) or Orai1 (O1) and blotted (B) for STIM1. R, resting; S, stimulated.
-
GHEK cells treated with scrambled (siScr) or siANO8 (siA8) were used to IP the native Orai1 (O1) or STIM1 (S1) and blotted (B) for the native STIM1, Orai1 or ANO8, as indicated. The columns show the mean ± SEM of four independent experiments. The results are mean ± SEM, and differences were analyzed by unpaired t‐test.
-
HCo‐IP of myc‐STIM1 and Orai1‐HA, myc‐STIM1 and ANO8‐YFP, and Orai1‐HA and ANO8‐YFP was measured in transfected HEK cells before (R, resting) and in response to store depletion (S, stimulated).
-
IEffect of ANO8‐YFP on myc‐STIM1 and Orai1‐HA at the ER/PM junction.
-
J–LJunctional Orai1 (J), STIM1 (K), and ANO8 (L) in resting (R) and store‐depleted cells (S). The results are mean ± SEM of four experiments, and differences were analyzed by unpaired t‐test.
-
MExample EM images recorded from HEK cells transfected with empty vector (left) or ANO8 (right). Red arrows mark ER/PM junctions.
-
N, OThe size (N) and density (O) of ER/PM junctions in vector‐transfected (control) and ANO8‐transfected cells.
ANO8 functions as a tether at the ER/PM junctions
The effect of ANO8 on native and expressed STIM1‐Orai1 interaction and clustering raised the question whether all effects of ANO8 are due to its effect on STIM1‐STIM1 interaction or whether ANO8 modulates assembly of the STIM1‐Orai1 clustering at the ER/PM junctions. To address this question, we tested the effect of ANO8 on the junctional level of STIM1‐Orai1 complexes by surface biotinylation assay. We reasoned that increased STIM1‐STIM1 interaction at the ER should not affect surface membrane Orai1 and STIM1. On the other hand, since only 40% of Orai1 is at the PM at steady state (Hodeify et al, 2015), increased level of Orai1 at the PM and of STIM1 that interacts with it would suggest effect of ANO8 on the junctions. The results in Fig 2I–L indicate that ANO8 increased the PM level of Orai1 (Fig 2J) and increased the level of STIM1 in the junctions where it interacts with the PM‐localized Orai1 and was thus pulled down together with Orai1 (Fig 2K). ANO8 affects PM Orai1 in the resting state, with additional increase in response to store depletion. ANO8 was found in the STIM1‐Orai1 complex in the resting state, and additional ANO8 was recruited to the complex by store depletion (Fig 2L). These findings confirm the presence of a large intracellular pool of Orai1 that can be recruited to the PM (Hodeify et al, 2015) and indicate that this requires increased ER/PM junctions by ANO8.
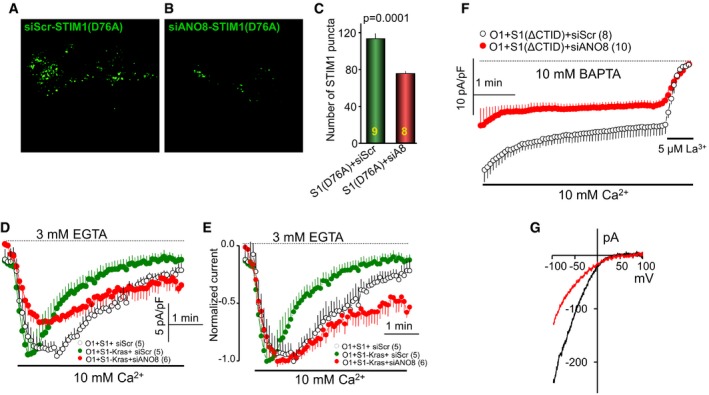
Independent evidence for an effect of ANO8 on STIM1‐Orai1 complexes at the ER/PM junctions was obtained with constitutively active STIM1. These STIM1 mutants are maximally pre‐clustered at the ER and at the ER/PM junctions independent of store depletion, and their clustering should not be affected by the effect of ANO8 on STIM1‐STIM1 interaction. Any effect of ANO8 on their clustering should be due to effect of ANO8 on the ER/PM junctions. We used three constitutively active STIM1 mutants, STIM1(D76A) (Liou et al, 2005), STIM1‐Kras (Maleth et al, 2014), and STIM1(ΔCTID) (Jha et al, 2013), all of which cluster in the junctions independent of store depletion. Figure EV3A–C shows that knockdown of ANO8 reduced the clustering of STIM1(D76A) and the Orai1 current density and SCDI by STIM1‐Kras (Fig EV3D and E). Knockdown of ANO8 reduced current by STIM1(ΔCTID), even when measured at 10 mM BAPTA that minimized Ca2+‐dependent channel inactivation (Fig EV3F and G). Finally, to obtain additional independent and direct evidence that ANO8 modulates the ER/PM junctions, we analyzed the junctions by electron microscopy (EM). Figure 2M shows example EM images, and Fig 2N and O shows analysis of the size and number of junctions in 23 and 18 sections in cells transfected with empty vector (Con) and with ANO8. ANO8 increased the number and size of the ER/PM junctions.
Figure EV3. Knockdown of ANO8 reduces clustering of constitutively active STIM1 mutants at the ER/PM junctions and activation of Orai1.
-
A–CHEK cells treated with scrambled (A) or ANO8 (B) siRNA were transfected with the constitutively active STIM1(D76A). The average number of puncta at the TIRF plane was analyzed in three separate experiments with the total number of cells indicated (C).
-
D, EOrai1 current was measured in cells transfected with Orai1 and the constitutively active STIM1‐Kras with pipette solution containing 3 mM EGTA and treated with scrambled (black, green) or ANO8 (red) siRNA; (D) shows current density and (E) is the normalized current, which better demonstrates the effect of ANO8 knockdown on the rate of SCDI. Current started by addition of 10 mM Ca2+ to the media.
-
F, GOrai1 current was measured in cells transfected with Orai1 and the constitutively active STIM1(ΔCTID) with pipette solution containing 10 mM BAPTA. The cells were treated with scrambled (black) or ANO8 (red) siRNA. Current measurement started on establishing the whole‐cell configuration in media already containing 10 mM Ca2+.
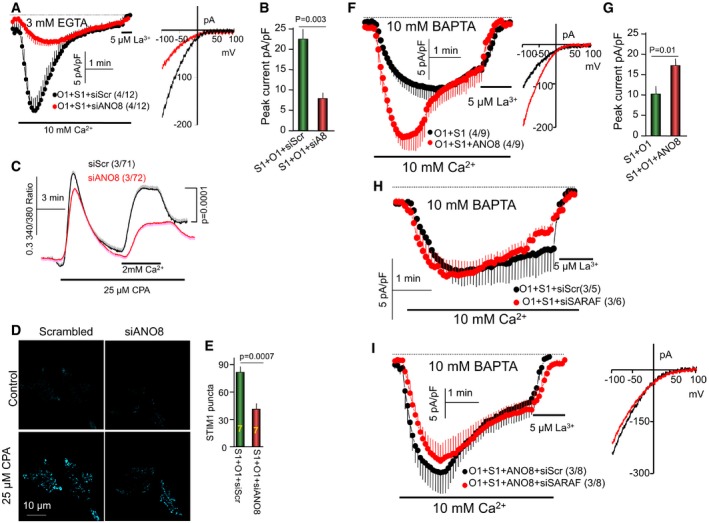
Because ANO8 knockdown prominently reduced STIM1‐STIM1 and STIM1‐Orai1 interaction, we measured the effect of knockdown of ANO8 on Orai1 current, native Ca2+ influx, and STIM1 clustering. Figure 3A and B shows that knockdown of ANO8 prominently reduced Orai1 current by about 70% without changing channel inward rectification. Similarly, knockdown of ANO8 reduced the native store‐operated Ca2+ influx by about 50% (Fig 3C). This inhibition appears to be due to reduced STIM1 puncta at the TIRF plane by about 50% (Fig 3D and E). Together, the findings in Figs 1, 2, 3 and EV3 indicate that ANO8 modulates clustering of STIM1 in the ER and the assembly and interaction of STIM1 and Orai1 at the ER/PM junctions, which in turn regulates the activation of Orai1 by STIM1 and the duration of Ca2+ influx, as expected from a bona fide ER/PM tether.
Figure 3. ANO8 is required for maximal STIM1‐Orai1 interaction and increases current inactivation under strong Ca2+ buffering.
-
A, BKnockdown of ANO8 (siA8) reduced CRAC current in cells transfected with Orai1 (O1) and STIM1 (S1) and buffered with 3 mM EGTA.
-
CKnockdown of ANO8 reduces the native store‐dependent Ca2+ influx measured in store‐depleted cells by Ca2+ add‐back.
-
D, EKnockdown of ANO8 reduced the number of store‐dependent STIM1 puncta at the TIRF plane in cells expressing STIM1 and Orai1. Panel (D) shows representative images and (E) is the summary of seven experiments.
-
F, GCurrent was measured with pipette solution contacting the fast and strong Ca2+ buffer 10 mM BAPTA in HEK cells transfected with STIM1, Orai1, and with (red) or without ANO8 (black). Panel (G) shows the increase in current density at peak current. Note the prominent current inactivation in the presence of ANO8.
-
HKnockdown of SARAF (red) in wild‐type cells had no effect on current inactivation in the presence of 10 mM BAPTA.
-
IKnockdown of SARAF did not prevent the ANO8‐dependent current inactivation in the presence of 10 mM BAPTA.
Novel ANO8‐mediated, slow SARAF‐independent Orai1 inactivation (SSII) at very low cytoplasmic Ca2+
The persistent slow Ca2+‐dependent inactivation in the presence of ANO8, but in the absence of SARAF (Fig EV1), indicated two mechanisms of SCDI, SARAF‐dependent, and SARAF‐independent and raised the question of the nature of the SARAF‐independent inactivation. To address this question, we measured whether and how ANO8 affect Orai1 current in the presence of 10 mM of the fast Ca2+ buffer BAPTA and no added Ca2+, with a calculated global free Ca2+ concentration of about 0.2 nM (assuming at most 10 μM total Ca2+ mainly due to contaminant in the Cs+‐methanosulfonate salt). In this condition, fast and slow Ca2+‐dependent current inactivation is minimal (Prakriya & Lewis, 2015; Parekh, 2017). Interestingly, Fig 3F and G shows that with 10 mM BAPTA in the pipette ANO8 still increased STIM1‐activated Orai1 current by about 60%. Moreover, unexpectedly, the current in the presence of ANO8 slowly inactivated despite the high concentration of BAPTA that prevented the SCDI in the absence of ANO8 (compare black traces in Fig 3A and F). This form of slow inhibition was independent of SARAF function. Figure 3H shows no SCDI in the presence of 10 mM BAPTA in the presence and absence of SARAF, indicating that SCDI by SARAF requires high cytoplasmic Ca2+. Figure 3I shows that ANO8‐dependent slow inactivation is not reduced by knockdown of SARAF, which we refer to henceforth as slow, SARAF‐independent inactivation (SSII).
The Anoctamin family proteins have a highly conserved Ca2+ binding site (Brunner et al, 2014; Dang et al, 2017; Paulino et al, 2017), which is also present in ANO8 (Appendix Fig S3A). Mutations of the residues that form the Ca2+ binding site shift the Ca2+‐dependent activation of ANO1 Cl− current from 0.36 μM to as high as 2 mM (Brunner et al, 2014; Dang et al, 2017; Paulino et al, 2017). On the other hand, ANO8 increased the current with 3 mM EGTA or 10 mM BAPTA in pipette solution and Ca2+ influx at cytoplasmic Ca2+ concentration of 100 nM in native cells, suggesting that the ANO8 Ca2+ binding site does not affect the tethering function of ANO8. Hence, Appendix Fig S3B and C shows that mutating two key residues in the Ca2+ binding site of ANO8 had no effect on ANO8‐mediated increase in Orai1 current density and ANO8‐dependent slow SSII.
ANO8 function depends on PM PI(4,5)P2
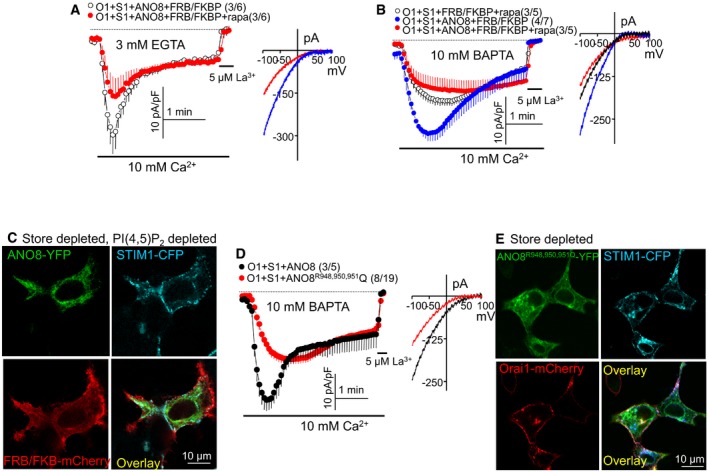
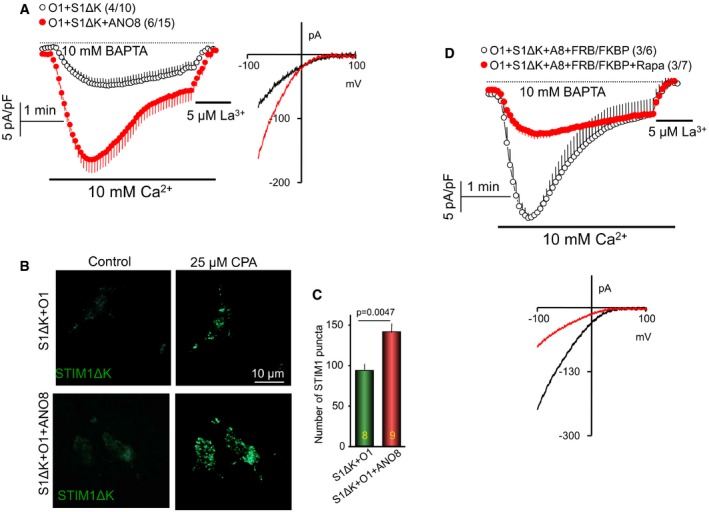
Tethers require ER and PM anchors. ANO8 is anchored at the ER (Fig 1) and should have a PM interacting site. A typical PM anchor is PI(4,5)P2, and the ANO8 yeast homologue Ist2 has a C terminus PI(4,5)P2 binding site (Maass et al, 2009). In addition, the activity of ANO1 (De Jesus‐Perez et al, 2018) and ANO6 (Aoun et al, 2016; Ye et al, 2018) is regulated by PI(4,5)P2, which prevents channel rundown (De Jesus‐Perez et al, 2018; Ye et al, 2018). Therefore, we first determined whether the function of ANO8 requires PM PI(4,5)P2 by depleting PI(4,5)P2 with PM targeted 5′‐phosphatase (Korzeniowski et al, 2009). Figure 4A–C shows that PI(4,5)P2 depletion eliminated the ANO8‐dependent increase in Orai1 current and SSII and reduced accumulation of ANO8 at the junctions in response to store depletion. Further evidence for the role of PI(4,5)P2 in the function of ANO8 was obtained by testing the effect of ANO8 on STIM1 mutant from which the polybasic domain (K) is deleted (STIM1(ΔK)). Interaction of the STIM1 polybasic domain with PI(4,5)P2 is required for clustering at the ER/PM junctions (Liou et al, 2007; Maleth et al, 2014). STIM1(ΔK) can activate Orai1, but only when expressed at high levels and in a PI(4,5)P2‐poor domain (Maleth et al, 2014). Figure EV4A shows that expression of STIM1(ΔK) at low levels poorly activated Orai1. ANO8 markedly increased Orai1 current activated by STIM1(ΔK) and revealed the SSII. This was due to recruitment of STIM1(ΔK) to PI(4,5)P2 at the ER/PM junctions, since ANO8 increased clustering of STIM1(ΔK) (Fig EV4B and C) and deletion of PI(4,5)P2 eliminated activation of STIM1(ΔK) by ANO8 (Fig EV4D).
Figure 4. Plasma membrane PI(4,5)P2 is required for ANO8 function.
-
A, BDepletion of plasma membrane PI(4,5)P2 with the FRB/FKBP system prevented the ANO8‐mediated increase in STIM1‐Orai1 current measured in pipette solutions containing 3 mM EGTA (A) or 10 mM BAPTA (B).
-
CHEK cells transfected with ANO8‐YFP, STIM1‐CFP Orai1‐HA and FRB and mCherry‐FKBP PI(4,5)P2 depleting constructs were treated with 0.2 μM rapamycin (rapa) for 5 min and then with 25 μM CPA for 10 min before fixation and imaging by confocal microscopy.
-
DMutating ANO8 R948, R950, R951 in RPRRP, a region that is predicted to include an ANO8 PI(4,5)P2 binding site, prevented increased STIM1‐Orai1 current and inactivation.
-
EMutating ANO8 R948, R950, R951 to Q reduced translocation of ANO8.
Figure EV4. ANO8 markedly increases current activated by STIM1(ΔK) that is PI(4,5)P2‐dependent.
-
ACurrent density recorded with pipette solution containing 10 mM BAPTA in cells transfected with STIM1(ΔK), Orai1 and with (red) or without (black) ANO8.
-
B, CSTIM1(ΔK) puncta were recorded with TIRF microscopy of cells expressing STIM1(ΔK), Orai1, and with or without ANO8. Example images are shown in (B) and the average of the indicated number of cells in (C).
-
DHEK cells expressing STIM1(ΔK), Orai1, ANO8, FRB, and FKB were used to measure CRAC current without (black) and with treatment with 0.2 μM rapamycin to deplete PI(4,5)P2 (red).
Regulation of ANO6 by PI(4,5)P2 (Aoun et al, 2016; Ye et al, 2018) was suggested to be by positively charged sequence (Ye et al, 2018), which is not conserved in other Anoctamins, including ANO8. We searched for potential PM phospholipid binding sites at the ANO8 N and C termini using the BHsearch program (http://helixweb.nih.gov/bhsearch; Brzeska et al, 2010). The sites identified with the highest scores are shown in red in Appendix Fig S3. Mutation of R and K in 17RGKR 20 and the first K and KR in 37 KLFGKRLLQAGR48 individually or in combination had no effect on the increased current or SSII. The first predicted C terminus PI(4,5)P2 interacting sites (877RREAFKR883) is close to the last TMD that ends at D861 and cannot access the PM. The mouse 1011PRPGKL1016 motif is not conserved in human ANO8. Mutation of the RRR in 948 RPRRP952 eliminated activation of Orai1 and the SSII by ANO8 (Fig 4D) and accumulation of ANO8R948,950,951Q at the ER/PM junctions in response to store depletion (Fig 4E). Together, the findings in Figs 4 and EV4 suggest that ANO8 interacts with PI(4,5)P2 at the PM.
SSII is mediated by SERCA2
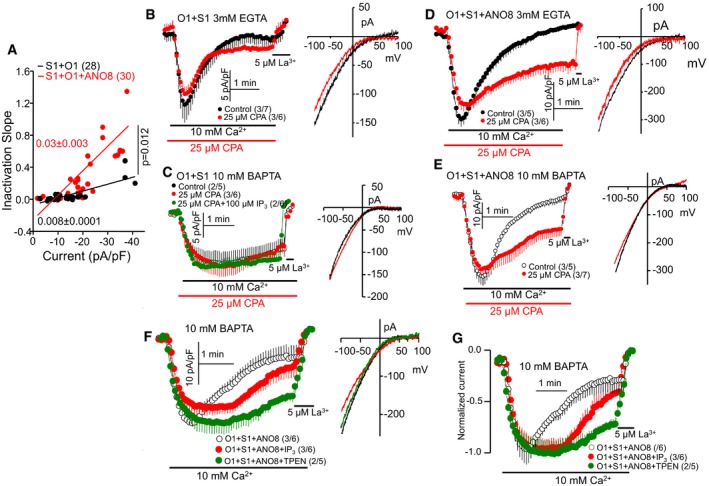
Plotting the inactivation slope as a function of the size of the current provided a clue about the mechanism mediating the prominent ANO8‐dependent SSII observed in the presence of 10 mM BAPTA. The current was measured at similar STIM1/Orai1 transfection with and without ANO8 by varying external Ca2+ between 2 and 50 mM. Figure 5A shows that ANO8 increased this relationship by almost fourfold. The size of the current is expected to determine the Ca2+ concentration at the ER/PM junctions with ANO8 increasing the local Ca2+ at the junction. This prediction was tested by measuring the effect of ANO8 on fast Ca2+‐dependent inactivation (FCDI) of Orai1 that is primarily determined by Ca2+ concentration at the mouth of Orai1 (Prakriya & Lewis, 2015; Parekh, 2017). Figure EV5A and B shows that ANO8 increased FCDI when compared at the same Orai1 current in cells with and without ANO8. Fitting the inactivation to two exponentials shows that this is primarily by increasing the first time constant (Fig EV5C).
Figure 5. Inhibiting the SERCA pumps, activation of the IP3Rs, and chelation of ER Ca2+ reduced ANO8‐dependent current inactivation.
-
APlot of the slope of inactivation as a function of current density in the presence (red) and absence of ANO8 (black). Increasing current density was obtained by varying external Ca2+ between 2 and 50 mM. The results are mean ± SEM, and differences were analyzed by unpaired t‐test.
-
B, CCRAC current was measured in HEK cells expressing STIM1 and Orai1 and in pipette solution containing 3 mM EGTA (B) or 10 mM BAPTA (C). SERCA pump was inhibited with 25 μM CPA in the red traces where indicated, and 100 μM IP3 was included in the pipette solution (green in C).
-
D, EExperimental protocol and conditions as in (B and C) except that cells were also transfected with ANO8.
-
F, GHEK cells expressing STIM1, Orai1, and ANO8 were used to measure current in pipette solution containing 10 mM BAPTA and with (red) or without (black) 100 μM IP3 or 10 mM of the ER Ca2+ chelator TPEN (green). The current density (F) and the normalized current (G) are shown, illustrating the delay in current inactivation by IP3 and TPEN.
Figure EV5. Effect of ANO8 on fast Ca2+‐dependent inactivation.
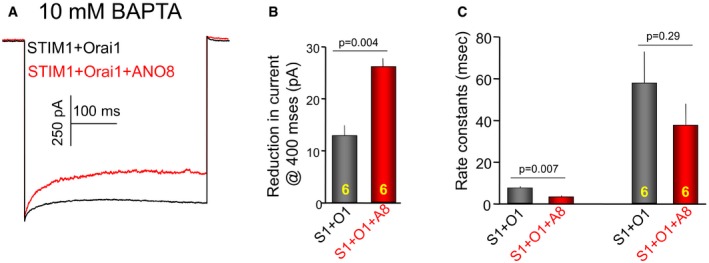
- The current traces from HEK cells transfected with STIM1, Orai1, and with (red) and without (black) ANO8 with pipette solution containing 10 mM BAPTA.
- The extent of reduction in current at 400 ms.
- The current traces were fit to two exponentials, and the left and right columns show the effect of ANO8 on the first and second exponentials, respectively.
The increase in junctional Ca2+ by ANO8 suggested that ANO8 increased the activity of a Ca2+‐dependent process that can inactivate the Orai1 current. Such a process can be SERCA2, which by reloading the ER with Ca2+ dissociates STIM1‐Orai1 to reduce the current. We used two independent assays to test this possibility. Figure 5B and C shows that inhibition of SERCA2 with CPA in cells that do not express ANO8 and buffered with 3 mM EGTA or 10 mM BAPTA had a small effect on the rate and extent of current inactivation. By contrast, Fig 5D and E shows that inhibition of SERCA2 with CPA markedly reduced the ANO8‐dependent SSII in cells buffered with EGTA or BAPTA. If SSII is due to reuptake and accumulation of Ca2+ in the ER, then reducing ER Ca2+ accumulation should also reduce SSII. To this end, we included 100 μM IP3 and 10 mM TPEN in the pipette solution. High concentration of IP3 was used to allow some activation of the IP3 receptors (IP3Rs) in the presence of such low Ca2+ of 0.2 nM (Mak & Foskett, 2015). Figure 5F and G shows that SSII was considerably reduced by IP3, particularly during the first 2 min of current measurement. SSII resumed after about 2 min, likely due to inactivation of the IP3Rs at the low cytoplasmic Ca2+, allowing ER Ca2+ accumulation by SERCA2. TPEN chelates and prevents accumulation of Ca2+ in the ER (Hofer et al, 1998). Figure 5F and G shows that SSII was strongly reduced by including 10 mM TPEN in the pipette solution.
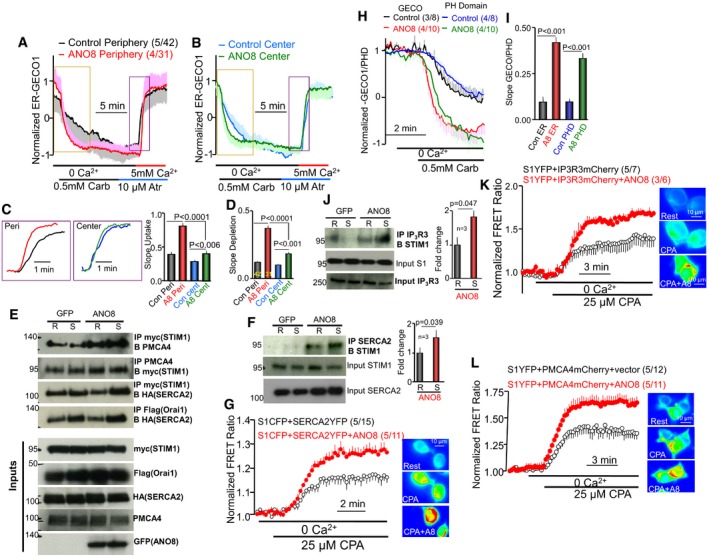
A second protocol used to examine the role of SERCA2 in SSII was measuring the effect of ANO8 on the rate of Ca2+ uptake into the ER by measuring Ca2+ content in the ER with ER‐GECO1 (Fig 6A–D). ER Ca2+ was first depleted by stimulating cells in Ca2+‐free solution expressing M3 receptors with high concentrations of carbachol. The stimulated state was then inhibited with atropine, after which the ER was reloaded by exposing the cells to a solution containing 5 mM Ca2+. ER Ca2+ uptake was analyzed in the cells’ periphery (panel A) and the cells’ center (panel B). The traces in expanded timescale and the summary in Fig 6C show that ANO8 increased the rate of Ca2+ uptake primarily by the peripheral ER. These findings, together with the findings in Fig 5, suggest that ANO8 may recruit the SERCA2 pumps to the ER/PM junctions. This is supported by multiple findings in Fig 6E–G. Figure 6E shows that ANO8 increases the Co‐IP of the expressed SERCA2 and STIM1, and Fig 6F shows similar findings with the native SERCA2 and STIM1. The FRET measurements in Fig 6G show that store depletion increased the interaction between STIM1‐CFP and SERCA2‐YFP, and ANO8 prominently increased this interaction.
Figure 6. ANO8 assembles Ca2+ signaling complexes at the ER/PM junctions.
-
A, BER Ca2+ content was measured with ER‐GECO1 in the periphery (A) and the center (B) or cells transfected with M3 receptors and with (red, green) or without (black, blue) ANO8. Receptor‐mediated store depletion was initiated by stimulating the cells with 0.5 mM carbachol in Ca2+‐free solution. Cell stimulation was terminated with 10 μM atropine, and ER Ca2+ uptake was initiated by perfusing the cells with a solution containing 5 mM Ca2+. The fluorescence was measured as F/F0 and normalized to the initial fluorescence in the presence of ANO8.
-
C, D(C) shows traces of ER Ca2+ uptake at expanded timescale in the periods marked by rectangular in (A and B) and the averaged slopes of ER Ca2+ influx and (D) shows the averaged slope of Ca2+ release at the cell periphery (Peri) and cell center (Center). In (C), the traces were aligned along the y‐axis to better show the difference in uptake rate.
-
EEnhancement by ANO8 of the Co‐IP of expressed STIM1 with PMCA4a and SERCA2 and of Orai1 with SERCA2 in resting and store‐depleted cells.
-
FEffect of ANO8 expression on the Co‐IP of the native SERCA2 and STIM1 in resting and store‐depleted cells. The columns are the mean ± SEM of three experiments.
-
GFRET ratio between STIM1 and SERCA2 in response to store depletion and its enhancement by ANO8.
-
H, ISimultaneous measurements of ER Ca2+ with ER‐GECO1 and PI(4,5)P2 hydrolysis with PHPLCδ‐GFP in response to cell stimulation of M3 receptors. Traces are shown in (H), and the average slopes are in (I).
-
JEffect of ANO8 on the Co‐IP of the native STIM1 and IP3Rs. The columns are the mean ± SEM of three experiments.
-
KFRET ratio between expressed STIM1 and IP3R3 in response to store depletion and its enhancement by ANO8.
-
LFRET ratio between expressed STIM1 and PMCA4 in response to store depletion and its enhancement by ANO8.
ANO8 assembles Ca2+ signaling complexes at the ER/PM junctions to control Ca2+ signaling
While measuring ER Ca2+ depletion in response to receptor stimulation in Fig 6A and B, we found that ANO8 markedly increased this rate. The averages in Fig 6D show that ANO8 primarily increased the rate of ER Ca2+ depletion in the cell periphery. ER Ca2+ release is mediated by receptor‐stimulated IP3 production and activation of the IP3Rs. To determine whether ANO8 affects IP3 production, we used the GFP‐tagged PLCδ PH domain (PHPLCδ‐GFP) to measure PM PI(4,5)P2 and mCherry‐ER‐GECO1 to simultaneously measure ER Ca2+ content. Figure 6H and I shows that ANO8 similarly increased the rates of IP3 production and ER Ca2+ release. In addition, Fig 6J shows that ANO8 enhanced the Co‐IP of the native STIM1 and IP3Rs and Fig 6K shows that ANO8 increased the FRET between STIM1‐YFP and IP3R3‐mCherry, suggesting that ANO8 enhances recruitment of IP3 receptors to the ER/PM junctions at which STIM1‐Orai1 cluster. Another core component of the Ca2+ signaling complex is PMCA. The Co‐IP experiments in Fig 6E and the FRET experiments with STIM1‐YFP and PMCA‐mCherry in Fig 6L show that PMCA is also recruited to the ER/PM junctions.
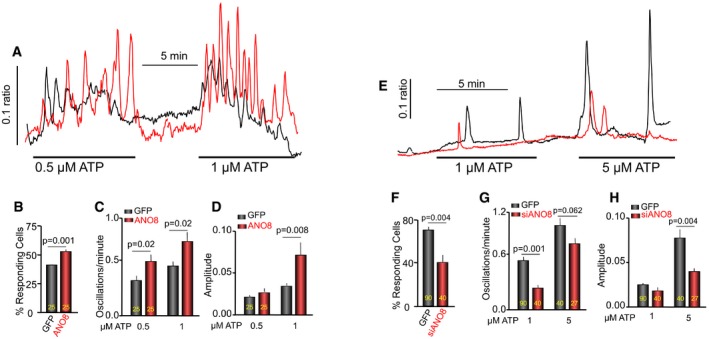
The results in Figs 1, 2, 3 and 6 indicate that all core Ca2+ signaling proteins are assembled into complexes at the ER/PM junctions upon cell stimulation with the aid of tether proteins, with ANO8 playing a primary role in the assembly. To test the physiological significance of ANO8‐mediated clustering of Ca2+ signaling proteins, we measured receptor‐stimulated physiological Ca2+ oscillations. Figure 7A–D shows that overexpression of ANO8 alone with native level of all other Ca2+ signaling proteins was sufficient to increase the number of responding cells and the frequency and amplitude of the oscillations. Conversely, Fig 7E–H shows that knockdown of ANO8 reduced all parameters of the receptor‐evoked Ca2+ signaling.
Figure 7. ANO8 tunes receptor‐evoked Ca2+ signaling.
-
A–DHeLa cells transfected with GFP (black) or ANO8 (red) were stimulated with 0.5 and then 1 μM ATP to activate the native P2Y2 receptors. The oscillations were analyzed in terms of the % of responding cells (B), oscillation frequency (C), and the amplitude of the Ca2+ signal (D).
-
E–HHeLa cells were treated with scrambled siRNA (black) or siANO8 (red) and were stimulated with 1 and then 5 μM ATP. The oscillations were analyzed in terms of the % of responding cells (F), oscillations frequency (G), and the amplitude of the Ca2+ signal (H).
Discussion
Information and material flow between cellular compartments and organelles must occur with high fidelity to ensure coordination among all cellular processes. For faithful information flow, cells use membrane contact sites (MCSs) between the ER that spans the entire cell interior and all other cellular membranes (Lahiri et al, 2015; Chung et al, 2017; Marchi et al, 2017; Muallem et al, 2017; Nunes‐Hasler & Demaurex, 2017). MCSs are formed by tether proteins that are anchored in the ER, either directly or through VAP proteins (Murphy & Levine, 2016), with cytoplasmic domains that span the distance between the ER and the target membranes they interact with (Muallem et al, 2017). These features are present in the ER/PM junction tethers E‐Syts (Giordano et al, 2013), GRAM domain proteins (Besprozvannaya et al, 2018), and the yeast Ist2 (Maass et al, 2009). The present studies show that ANO8 fulfills all the criteria for a tether and functions as a tether at the ER/PM junctions. Similar to other ANO members and its yeast homologue Ist2, ANO8 is predicted by the ROBETTA using the structure of ANO1 as a template to have 10 TMD, is located in the ER, and has a long cytoplasmic C terminus rich in basic residues that have putative PI(4,5)P2 interacting motifs (Figs 1, 4 and EV4). Moreover, ANO8 gene expression is ubiquitous with protein expression appears to be highest in the lung, brain, adrenal, breast, and pancreas (https://www.genecards.org/cgi-bin/carddisp.pl?gene=ANO8). However, unlike other ANOs that are primarily expressed in the plasma membrane and function as Cl− channels, we could not detect change in anion or cation currents by expressing ANO8 in HEK cells. However, this does not exclude the possibility that ANO8 functions as a Cl− channel and lipid scramblase in the ER, the primary localization of ANO8.
ANO8 tethers the ER/PM in resting cells and further translocates to the same compartment in response to store depletion. Moreover, importantly, ANO8 increases the number of puncta and rate of puncta formation, indicating that ANO8 actively participates in assembly of STIM1‐Orai1 complexes (and other Ca2+ signaling proteins, Fig 8) at the ER/PM junctions. ANO8 accomplishes this by promoting STIM1‐STIM1 interaction in response to store depletion (Fig 1E and F) and by increasing the number and size of the ER/PM contact sites (Fig 2M–O). Interaction and clustering of STIM1‐STIM1 is believed to require the open conformation of STIM1 in which the CC1 and CTID domains are not in contact with the SOAR domain (Muik et al, 2011; Jha et al, 2013; Stathopulos et al, 2013). ANO8 can facilitate STIM1‐STIM1 interaction by binding to STIM1 in the ER to initiate the STIM1 open conformation. However, it is also possible that by expanding the ER/PM contact sites ANO8 facilitates translocation of STIM1 to the junctions, which is sufficient for STIM1‐STIM1 interaction. Nevertheless, this STIM1‐STIM1 interaction is not sufficient for stabilization of STIM1 at the junctions since ANO8 only minimally increases STIM1 puncta in the TIRF domain before Ca2+ store depletion. Irrespective of the exact mechanism by which ANO8 facilitates STIM1‐STIM1 interaction, ANO8 appears to play a critical role in Ca2+ signaling than that played by the other ER/PM junction tethers: E‐Syts and GRAM domain proteins. Analysis of Ca2+ signaling and CRAC current showed that E‐Syt1 has a minimal role in Ca2+ signaling (Chang et al, 2013; Giordano et al, 2013; Maleth et al, 2014) and mainly affects translocation of STIM1‐Orai1 complexes to a high PI(4,5)P2 domain without affecting current density (Maleth et al, 2014). By contrast, ANO8 function is essential for CRAC current, Ca2+ influx, and the receptor‐evoked Ca2+ signal.
Figure 8. Summary model for Ca2+ signaling outside and within the tether proteins–assembled ER/PM junctions.
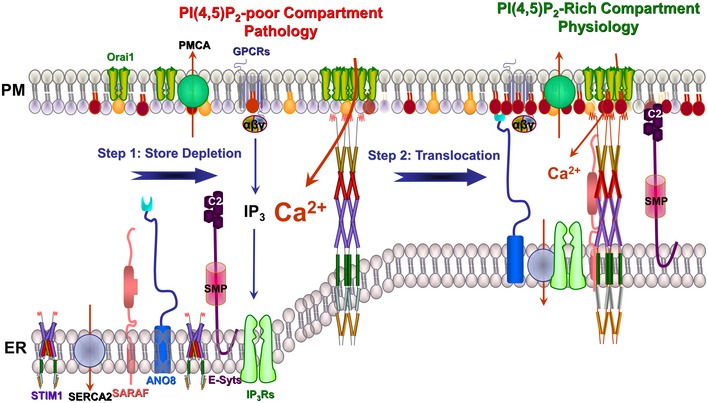
In resting cells, the ER/PM junction tethers are confined mostly to the ER and the Ca2+ signaling proteins, the PM PMCA and Orai1 and the ER IP3Rs, SERCA2, SARAF and STIM1, are not assembled into complexes and function in housekeeping. The PM proteins are localized at a region with poor PI(4,5)P2 in the inner leaflet of the PM. STIM1 is bound with Ca2+ and is folded in a manner that its SOAR domain cannot access Orai1. Upon stimulation of GPCRs and generation of IP3, peripheral ER Ca2+ is depleted to unfold STIM1 and expose its SOAR and polylysine domains, which results in STIM1 clustering while still in the ER anchors STIM1 at the PM through the polylysine domain and clustering and activation of Orai1 by the SOAR domain. This takes place at a PI(4,5)P2‐poor domain of the PM that is not sufficient to anchor the tethers at the PM. At this PI(4,5)P2‐poor domain SARAF cannot interact with STIM1 and SERCA2 and PMCA are not close to the Orai1‐STIM1 complex, which allow maximal Ca2+ influx. After the initial bolus of Ca2+ influx, the tethers ANO8 and E‐Syt1 form a PI(4,5)P2‐rich compartment to which the GPCRs complex, STIM1‐Orai1 complex, SERCA2, PMCA and IP3Rs translocate to the PI(4,5)P2‐rich domain, where they tightly communicate to control signaling intensity and the properties of the Ca2+ signal to maintain the fidelity of the physiological Ca2+ response. Failure to translocate to the tether proteins‐assembled ER/PM compartment results in a runaway Ca2+ response and pathology.
Intracellular Ca2+ is essential for life and death, with physiological Ca2+ concentrations mediating numerous essential cellular functions, while high sustained cytoplasmic Ca2+ increase causes cell toxicity and death (Petersen, 2014; Prakriya & Lewis, 2015; Berridge, 2016). The cause of high sustained cytoplasmic Ca2+ is excessive Ca2+ influx, mainly through SOCs (Prakriya & Lewis, 2015). Inactivation of the Ca2+ influx channels shortly after their activation is an important protective mechanism against excessive Ca2+ influx and cell toxicity (Prakriya & Lewis, 2015; Parekh, 2017). Two well‐established protective mechanisms are the fast and slow Ca2+‐dependent inactivation of the Orai1‐STIM1 current that are mediated by a STIM1 negatively charged sequence (Derler et al, 2009; Lee et al, 2009; Mullins et al, 2009) within the STIM1 CTID domain (Jha et al, 2013). Two proteins appear to mediate the inactivation: SARAF (Palty et al, 2012; Maleth et al, 2014), which mediates both the fast and slow inactivation (Maleth et al, 2014), and calmodulin (CaM), recently shown to affect SCDI by causing dissociation of STIM1 oligomers (Li et al, 2017). Notably, deletion of SARAF (Maleth et al, 2014) and inhibition of CaM (Li et al, 2017) inhibit SCDI by only about 50%, indicating the involvement of another prominent inactivation mechanism. The present study reveals a novel mechanism in which recruitment of SERCA2 pumps to the ER/PM junction initiates Ca2+ uptake specifically into the junctional ER. Ca2+ uptake into the junctional ER mediates a substantial part of the slow Ca2+‐dependent inactivation (Fig 5). Uptake of the Ca2+ entering through Orai1 into the ER likely dissociates the STIM1‐Orai1 complex to reduce the Ca2+ influx.
SERCA2‐mediated Ca2+ uptake into the ER outside the junctional (peripheral) ER was not affected appreciably by ANO8 even in fully store‐depleted cells, suggesting that the junctional ER behaves differently than the ER in other part of the cells. This implies that the junctional ER is functionally segregated from the bulk ER to allow regulation of the Ca2+ influx channels’ activity. Compartmentalization of the ER is also suggested by the quantal properties of IP3‐mediated Ca2+ release (Muallem et al, 1989; Shin et al, 2001). Ca2+ uptake by peripheral SERCA2b was observed when cytoplasmic Ca2+ was buffered to or below 0.2 nM. However, SERCA2b apparent affinity for Ca2+ is about 0.44 μM with no uptake observed at Ca2+ concentrations below 10 nM (Lytton et al, 1992). Therefore, it is likely that the junctional SERCA2b pumps experience Ca2+ concentration higher than 0.2 nM due to their localization in close proximity to Orai1 at the ER/PM junctions. This is supported by the findings that ANO8 increases the FCDI (Fig EV5) that depends on local Ca2+ at the mouth of Orai1 (Parekh, 2017). Thus, ANO8 recruits SERCA2 pumps to the junctions to facilitate Ca2+ uptake by the junctional ER, restricting Ca2+ influx and guarding against Ca2+ toxicity.
ANO8 promotes assembly of all core Ca2+ signaling proteins at the ER/PM junctions to control the receptor‐evoked Ca2+ signal and Ca2+ oscillations. The FRET and Co‐IP measurements suggest that ANO8 increases spatial proximity of the Ca2+ signaling proteins to tighten the complexes. TIRF and surface expression measurements suggest that ANO8 also increases the number of Ca2+ signaling complexes at the junctions by increasing the steady‐state level of Orai1 in the PM and the junctions. The result is an increase in all parameters of receptor‐evoked Ca2+ oscillations, indicating an increase in signaling responsiveness and fidelity. It is not clear at present whether ANO8 directly interacts with any of the core Ca2+ signaling proteins in the complexes, perhaps except for STIM1, since it affects STIM1‐STIM1 clustering in the absence of Orai1. However, it is more likely that the ANO8‐mediated formation and stabilization of ER/PM junctions (Fig 2) is sufficient for assembly of the core Ca2+ signaling proteins into complexes in response to cell stimulation.
As illustrated in Fig 8, the present work reveals that an important function of tether proteins is to increase efficiency and precision of cell signaling and communication between cellular compartments. In the resting state, the Ca2+ signaling proteins are not arranged in tight complexes and the tether proteins are mostly in the ER with only few of them bridging the ER/PM. In this state, the Ca2+ signaling proteins are mostly engaged in housekeeping. Upon store depletion, STIM1 molecules are clustered while in the ER with the aid of ANO8 and translocates to a PI(4,5)P2‐poor PM compartment, where the clustered STIM1 interacts with Orai1 to activate Ca2+ influx. Shortly after activation of maximal Ca2+ influx, the Ca2+ entering through Orai1 facilitates assembly of a PI(4,5)P2‐rich ER/PM compartment to which all Ca2+ signaling proteins translocate and are assembled into tight complexes. In the tight complexes, SARAF interacts with STIM1 to promote both fast and slow Ca2+‐dependent inactivation and SERCA2 gains access to the Ca2+ entering through Orai1 to mediate reuptake of part of influxed Ca2+ to further increase the slow inactivation. The tight complexes ensure fidelity and specificity of the Ca2+ signal, and the reduction in Ca2+ influx is essential to prevent Ca2+ toxicity. Disruption of the localization of signaling complexes within MCSs or preventing their translocation to the PI(4,5)P2‐rich ER/PM compartment results in uncontrolled cell stimulation, Ca2+ signaling and Ca2+ influx and thus pathology.
Materials and Methods
Electrophysiology
HEK293 cells were maintained in Dulbecco's modified Eagle's medium (DMEM) supplemented with 10% fetal bovine serum (FBS) and 1% Pen/Strep. Cells were transiently transfected using Lipofectamine 2000 (Invitrogen, Carlsbad, CA, USA) with Orai1, STIM1 with or without ANO8 or the ANO8 mutants in a 1:2:2 ratio for 24 h at 37°C. Treatment with siSARAF was carried out with 20‐40 nM, and treatment with siANO8 was carried out with 100 nM. On the day of experiments, transfected cells were released and plated on square coverslips in 35‐mm cell culture dishes and incubated with culture media for at least 2 h to allow attachment to the coverslip. Patch‐clamp pipettes were pulled from glass capillaries (Warner Instruments) using a vertical puller (PC‐10; Narishige) and had a resistance of 5–7 MΩ when filled with the pipette solution. The pipette solution contained (mM) 135 Cs‐methanesulfonate, 6 MgCl2, 2 MgATP, 10 HEPES and either 3 EGTA or 10 BAPTA, pH 7.4 (with CsOH). After establishing the whole‐cell configuration, the cells were kept in Ca2+‐free solution for 3 min to allow store depletion before exposing the cells to bath solution containing 10 mM Ca2+. The standard bath solution contained (mM) 130 NaCl, 5 KCl, 1 MgCl2, and 10 HEPES with or without 10 CaCl2 (pH 7.4 with NaOH). Whole‐cell currents were recorded using an Axopatch 200B amplifier (Molecular Devices) with low‐pass filtering at 1 kHz. The currents were digitized at a sampling frequency of 5 kHz using Digidata 1440A (Axon Instruments) and stored directly to a hard drive. Current recording was done with PClamp 10 software, and analysis was done with the help of Clampfit software. The current was recorded by 400‐ms rapid alterations of membrane potential (RAMP) from −100 to +100 mV from a holding potential of 0 mV. RAMPs were spaced at 4‐s intervals. The current recorded at −100 mV was used to calculate current density as pA/pF. For calculating the inactivation slope, the inactivation was fitted with straight line equation y = a + b*x, where b is the slope, a is the value where the line intersects the y‐axis. The means of multiple experiments are given as mean ± SEM of the number of experiments performed.
Electron microscopy
Cells grown on Thermonax coverslips were fixed in a mixture of 2.5% paraformaldehyde and 2.0% glutaraldehyde in 0.1 M sodium cacodylate buffer (SCB; pH = 7.4) for 1 h, followed by extensive wash in SCB. Then, samples were postfixed in 2.0% osmium tetroxide plus 1.6% potassium ferricyanide in the above buffer for 60 min. After several rinses in the SCB, the samples were dehydrated in a series of ethanol (30, 50, 75, 95% for 5 min and 100% for 20 min with three changes) and infiltrated with Epon‐Araldite (Ted Pella, Redding, CA; 50% for 1 h and 100% for 1 day with two changes). Samples were polymerized at 60°C for 30 h.
Ultrathin sections (about 80 nm) were cut on Leica EM UC6 Ultramicrotome (Leica, Buffalo Grove, IL) and collected on copper slot grids. Sections were counterstained with uranyl acetate and lead citrate and examined under a FEI Tecnai12 transmission electron microscope (FEI, Hillsboro, Oregon) operating at a beam energy of 120 keV. Images were acquired by using a Gatan 2k × 2k cooled CCD camera (Gatan, Warrendale, PA).
Measurement of ER Ca2+
Cells were plated on glass bottom dishes (MatTek Corporation) and transiently transfected with ER‐GECO1 and the indicated plasmids. Cells were imaged after 24 h of transfection using 60×, 1.45 NA CFI Apo objective (Nikon) mounted on a Ti‐Eclipse inverted microscope with Perfect Focus System (PFS; Nikon). Cells were illuminated with a 559‐nm light‐emitting diode laser for visualizing ER‐LAR‐GECO1. Images were collected using a iXon EMCCD Camera (Andor) and NIS elements AR software and analyzed using NIS elements and plotted using Origin 9.4 software (OriginLab). The ER‐GECO1 fluorescence was normalization to the initial fluorescence in the presence of ANO8. Since GECO1 is not ratiometric dye, the fluoresce was determined as F/Fo and the initial ratio with ANO8 is taken as 1. All other ratios were determined with respect to the initial ratio in the various experiments and then averaged.
TIRF measurements
For TIRF microscopy, HeLa cells were plated on glass bottom dishes and transfected with the indicated constructs. Cells were treated with 25 μM CPA in Ca2+‐free media to initiate STIM1‐Orai1 clustering. TIRF microscopy was with a 60×, 1.45 NA CFI Apo objective (Nikon) mounted on a Ti‐Eclipse inverted microscope with Perfect Focus System (PFS; Nikon). Images at the TIRF plane were collected using a iXon EMCCD Camera and NIS element AR software. For analysis, we defined a punctum as a standalone bright spot formed by a cluster of fluorescently tagged proteins at the TIRF plane. The size and intensity of the puncta were variable. The images from each channel were imported into ImageJ as an image sequence. The brightness threshold was adjusted in ImageJ so that the few puncta present at the beginning of the time course would be included in the data without including the cell background. The threshold was set in the first frame and kept constant for each cell. The area of the cell, which was determined using the NIS elements software, was accounted for by dividing the number of puncta counted by the area of the cell. The results are shown as mean ± SEM and are plotted using Origin 9.4 software (Origin Lab).
FRET measurements
HEK293 cells were plated at low confluence on glass bottom dishes (MatTek Corporation) and transfected with ECFP (donor) and EYFP (acceptor) tagged constructs, for 12–16 h using Lipofectamine 2000 (Invitrogen) at 37°C. FRET imaging was performed at 37°C using a confocal system (FV1000; Olympus) equipped with UplanSApo 60X oil immersion objective (NA 1.35; Olympus) at 1X zoom. Images were acquired at 10‐s intervals using the simplified two‐cube method for sensitized emission (Navarro‐Borelly et al, 2008; Wlodarczyk et al, 2008). To minimize photobleaching, low laser power (1–3%) was used. All FRET experiments were carried out with maximally opened pinhole to maximize photons capture while recording the FRET signal close to the cell surface rather than the middle of the cell. Thus, the confocal microscope was used in a “widefield mode”, which does not completely exclude some out of focus light. Therefore, to overcome this limitation we only analyzed the FRET signal at the cell periphery, where the FRET signal is driven by proteins at the ER‐PM junctions.
Image analysis was performed with NIH ImageJ software. Images were corrected for background fluorescence as necessary. FRET was determined on a pixel‐by‐pixel basis using a two‐step FRET efficiency calculation protocol (Zal & Gascoigne, 2004). Briefly, bleed‐through components were removed by generating a corrected FRET image (Fc) according to the equation Fc = IDA − dIDD where IDA and IDD are the background‐subtracted FRET and ECFP images, respectively. The microscope‐specific bleed‐through constants a and d were determined by measuring the bleed‐through from cells expressing ECFP or EYFP alone. The derived values were d = IDA/IDD = 0.061 ± 0.0064 (n = 52 cells) and a = IDA/IAA = 0.02 ± 0.0015 (n = 46 cells). In the second step, the apparent FRET efficiency (Eapp) was calculated using the algorithm Eapp = Fc/(Fc + GIDD) where Eapp is the fraction of ECFP exhibiting FRET and G is a microscope‐specific constant derived by measuring the increase in ECFP fluorescence following EYFP acceptor photobleaching with the intramolecular CFP–YFP construct YFP‐OASF‐CFP (Muik et al, 2011), which was estimated to be 0.69 ± 0.12 (n = 18 cells).
Statistics
All averages are shown as mean ± SEM of the number of experiments listed in the figures. Differences between the groups were analyzed by unpaired t‐test or one‐ or two‐way ANOVA using Prism. In all cases, P < 0.05 or better was considered statistically significant.
Author contributions
AJ, WYC, LV, JM, SL, MA, and GZ performed experiments; SM and MA supervised the study; and SM drafted the manuscript with contribution from all authors.
Conflict of interest
The authors declare that they have no conflict of interest.
Supporting information
Appendix
Expanded View Figures PDF
Review Process File
Source Data for Figure 1
Source Data for Figure 2
Source Data for Figure 3
Acknowledgements
We thank Drs. James Rothman (Yale University), Agnes Enyedi (Semmelweis University, Budapest, Hungary), and David Yule (Rochester University) for providing plasmids for Ist2, mCherry‐PMCA4, and mCherry‐IP3R3, respectively. This work was funded by intramural grant from NIH/NIDCR DE000735‐07.
The EMBO Journal (2019) 38: e101452
References
- Ahuja M, Jha A, Maleth J, Park S, Muallem S (2014) cAMP and Ca(2)(+) signaling in secretory epithelia: crosstalk and synergism. Cell Calcium 55: 385–393 [DOI] [PMC free article] [PubMed] [Google Scholar]
- Alvadia C, Lim NK, Clerico Mosina V, Oostergetel GT, Dutzler R, Paulino C (2019) Cryo‐EM structures and functional characterization of the murine lipid scramblase TMEM16F. Elife 8: e44365 [DOI] [PMC free article] [PubMed] [Google Scholar]
- Aoun J, Hayashi M, Sheikh IA, Sarkar P, Saha T, Ghosh P, Bhowmick R, Ghosh D, Chatterjee T, Chakrabarti P et al (2016) Anoctamin 6 contributes to Cl‐ secretion in accessory cholera enterotoxin (Ace)‐stimulated diarrhea: an essential role for phosphatidylinositol 4,5‐bisphosphate (PIP2) signaling in cholera. J Biol Chem 291: 26816–26836 [DOI] [PMC free article] [PubMed] [Google Scholar]
- Berridge MJ (2016) The inositol trisphosphate/calcium signaling pathway in health and disease. Physiol Rev 96: 1261–1296 [DOI] [PubMed] [Google Scholar]
- Besprozvannaya M, Dickson E, Li H, Ginburg KS, Bers DM, Auwerx J, Nunnari J (2018) GRAM domain proteins specialize functionally distinct ER‐PM contact sites in human cells. Elife 7: e31019 [DOI] [PMC free article] [PubMed] [Google Scholar]
- Brunner JD, Lim NK, Schenck S, Duerst A, Dutzler R (2014) X‐ray structure of a calcium‐activated TMEM16 lipid scramblase. Nature 516: 207–212 [DOI] [PubMed] [Google Scholar]
- Brzeska H, Guag J, Remmert K, Chacko S, Korn ED (2010) An experimentally based computer search identifies unstructured membrane‐binding sites in proteins: application to class I myosins, PAKS, and CARMIL. J Biol Chem 285: 5738–5747 [DOI] [PMC free article] [PubMed] [Google Scholar]
- Chang CL, Hsieh TS, Yang TT, Rothberg KG, Azizoglu DB, Volk E, Liao JC, Liou J (2013) Feedback regulation of receptor‐induced Ca2+ signaling mediated by E‐Syt1 and Nir2 at endoplasmic reticulum‐plasma membrane junctions. Cell Rep 5: 813–825 [DOI] [PubMed] [Google Scholar]
- Chung WY, Jha A, Ahuja M, Muallem S (2017) Ca(2+) influx at the ER/PM junctions. Cell Calcium 63: 29–32 [DOI] [PMC free article] [PubMed] [Google Scholar]
- Dang S, Feng S, Tien J, Peters CJ, Bulkley D, Lolicato M, Zhao J, Zuberbuhler K, Ye W, Qi L et al (2017) Cryo‐EM structures of the TMEM16A calcium‐activated chloride channel. Nature 552: 426–429 [DOI] [PMC free article] [PubMed] [Google Scholar]
- De Jesus‐Perez JJ, Cruz‐Rangel S, Espino‐Saldana AE, Martinez‐Torres A, Qu Z, Hartzell HC, Corral‐Fernandez NE, Perez‐Cornejo P, Arreola J (2018) Phosphatidylinositol 4,5‐bisphosphate, cholesterol, and fatty acids modulate the calcium‐activated chloride channel TMEM16A (ANO1). Biochim Biophys Acta 1863: 299–312 [DOI] [PMC free article] [PubMed] [Google Scholar]
- Derler I, Fahrner M, Muik M, Lackner B, Schindl R, Groschner K, Romanin C (2009) A Ca2(+)release‐activated Ca2(+) (CRAC) modulatory domain (CMD) within STIM1 mediates fast Ca2(+)‐dependent inactivation of ORAI1 channels. J Biol Chem 284: 24933–24938 [DOI] [PMC free article] [PubMed] [Google Scholar]
- Dickson EJ, Jensen JB, Vivas O, Kruse M, Traynor‐Kaplan AE, Hille B (2016) Dynamic formation of ER‐PM junctions presents a lipid phosphatase to regulate phosphoinositides. J Cell Biol 213: 33–48 [DOI] [PMC free article] [PubMed] [Google Scholar]
- Giordano F, Saheki Y, Idevall‐Hagren O, Colombo SF, Pirruccello M, Milosevic I, Gracheva EO, Bagriantsev SN, Borgese N, De Camilli P (2013) PI(4,5)P(2)‐dependent and Ca(2+)‐regulated ER‐PM interactions mediated by the extended synaptotagmins. Cell 153: 1494–1509 [DOI] [PMC free article] [PubMed] [Google Scholar]
- Henne WM, Liou J, Emr SD (2015) Molecular mechanisms of inter‐organelle ER‐PM contact sites. Curr Opin Cell Biol 35: 123–130 [DOI] [PubMed] [Google Scholar]
- Higley MJ (2014) Localized GABAergic inhibition of dendritic Ca(2+) signalling. Nat Rev Neurosci 15: 567–572 [DOI] [PMC free article] [PubMed] [Google Scholar]
- Hodeify R, Selvaraj S, Wen J, Arredouani A, Hubrack S, Dib M, Al‐Thani SN, McGraw T, Machaca K (2015) A STIM1‐dependent ‘trafficking trap’ mechanism regulates Orai1 plasma membrane residence and Ca(2)(+) influx levels. J Cell Sci 128: 3143–3154 [DOI] [PubMed] [Google Scholar]
- Hofer AM, Fasolato C, Pozzan T (1998) Capacitative Ca2+ entry is closely linked to the filling state of internal Ca2+ stores: a study using simultaneous measurements of ICRAC and intraluminal [Ca2+]. J Cell Biol 140: 325–334 [DOI] [PMC free article] [PubMed] [Google Scholar]
- Hong JH, Li Q, Kim MS, Shin DM, Feske S, Birnbaumer L, Cheng KT, Ambudkar IS, Muallem S (2011) Polarized but differential localization and recruitment of STIM1, Orai1 and TRPC channels in secretory cells. Traffic 12: 232–245 [DOI] [PMC free article] [PubMed] [Google Scholar]
- Huang WC, Xiao S, Huang F, Harfe BD, Jan YN, Jan LY (2012) Calcium‐activated chloride channels (CaCCs) regulate action potential and synaptic response in hippocampal neurons. Neuron 74: 179–192 [DOI] [PMC free article] [PubMed] [Google Scholar]
- Jha A, Ahuja M, Maleth J, Moreno CM, Yuan JP, Kim MS, Muallem S (2013) The STIM1 CTID domain determines access of SARAF to SOAR to regulate Orai1 channel function. J Cell Biol 202: 71–79 [DOI] [PMC free article] [PubMed] [Google Scholar]
- Jha A, Ahuja M, Patel S, Brailoiu E, Muallem S (2014) Convergent regulation of the lysosomal two‐pore channel‐2 by Mg(2)(+), NAADP, PI(3,5)P(2) and multiple protein kinases. EMBO J 33: 501–511 [DOI] [PMC free article] [PubMed] [Google Scholar]
- Kiselyov K, Wang X, Shin DM, Zang W, Muallem S (2006) Calcium signaling complexes in microdomains of polarized secretory cells. Cell Calcium 40: 451–459 [DOI] [PubMed] [Google Scholar]
- Korzeniowski MK, Popovic MA, Szentpetery Z, Varnai P, Stojilkovic SS, Balla T (2009) Dependence of STIM1/Orai1‐mediated calcium entry on plasma membrane phosphoinositides. J Biol Chem 284: 21027–21035 [DOI] [PMC free article] [PubMed] [Google Scholar]
- Lahiri S, Toulmay A, Prinz WA (2015) Membrane contact sites, gateways for lipid homeostasis. Curr Opin Cell Biol 33: 82–87 [DOI] [PMC free article] [PubMed] [Google Scholar]
- Lang F, Eylenstein A, Shumilina E (2012) Regulation of Orai1/STIM1 by the kinases SGK1 and AMPK. Cell Calcium 52: 347–354 [DOI] [PubMed] [Google Scholar]
- Lee KP, Yuan JP, Zeng W, So I, Worley PF, Muallem S (2009) Molecular determinants of fast Ca2+‐dependent inactivation and gating of the Orai channels. Proc Natl Acad Sci USA 106: 14687–14692 [DOI] [PMC free article] [PubMed] [Google Scholar]
- Li X, Wu G, Yang Y, Fu S, Liu X, Kang H, Yang X, Su XC, Shen Y (2017) Calmodulin dissociates the STIM1‐Orai1 complex and STIM1 oligomers. Nat Commun 8: 1042 [DOI] [PMC free article] [PubMed] [Google Scholar]
- Liou J, Kim ML, Heo WD, Jones JT, Myers JW, Ferrell JE Jr, Meyer T (2005) STIM is a Ca2+ sensor essential for Ca2+‐store‐depletion‐triggered Ca2+ influx. Curr Biol 15: 1235–1241 [DOI] [PMC free article] [PubMed] [Google Scholar]
- Liou J, Fivaz M, Inoue T, Meyer T (2007) Live‐cell imaging reveals sequential oligomerization and local plasma membrane targeting of stromal interaction molecule 1 after Ca2+ store depletion. Proc Natl Acad Sci USA 104: 9301–9306 [DOI] [PMC free article] [PubMed] [Google Scholar]
- Lytton J, Westlin M, Burk SE, Shull GE, MacLennan DH (1992) Functional comparisons between isoforms of the sarcoplasmic or endoplasmic reticulum family of calcium pumps. J Biol Chem 267: 14483–14489 [PubMed] [Google Scholar]
- Maass K, Fischer MA, Seiler M, Temmerman K, Nickel W, Seedorf M (2009) A signal comprising a basic cluster and an amphipathic alpha‐helix interacts with lipids and is required for the transport of Ist2 to the yeast cortical ER. J Cell Sci 122: 625–635 [DOI] [PubMed] [Google Scholar]
- Mak DO, Foskett JK (2015) Inositol 1,4,5‐trisphosphate receptors in the endoplasmic reticulum: a single‐channel point of view. Cell Calcium 58: 67–78 [DOI] [PMC free article] [PubMed] [Google Scholar]
- Maleth J, Choi S, Muallem S, Ahuja M (2014) Translocation between PI(4,5)P2‐poor and PI(4,5)P2‐rich microdomains during store depletion determines STIM1 conformation and Orai1 gating. Nat Commun 5: 5843 [DOI] [PMC free article] [PubMed] [Google Scholar]
- Marchi S, Patergnani S, Missiroli S, Morciano G, Rimessi A, Wieckowski MR, Giorgi C, Pinton P (2017) Mitochondrial and endoplasmic reticulum calcium homeostasis and cell death. Cell Calcium 69: 62–72 [DOI] [PubMed] [Google Scholar]
- Muallem S, Pandol SJ, Beeker TG (1989) Hormone‐evoked calcium release from intracellular stores is a quantal process. J Biol Chem 264: 205–212 [PubMed] [Google Scholar]
- Muallem S, Chung WY, Jha A, Ahuja M (2017) Lipids at membrane contact sites: cell signaling and ion transport. EMBO Rep 18: 1893–1904 [DOI] [PMC free article] [PubMed] [Google Scholar]
- Muik M, Fahrner M, Schindl R, Stathopulos P, Frischauf I, Derler I, Plenk P, Lackner B, Groschner K, Ikura M et al (2011) STIM1 couples to ORAI1 via an intramolecular transition into an extended conformation. EMBO J 30: 1678–1689 [DOI] [PMC free article] [PubMed] [Google Scholar]
- Mullins FM, Park CY, Dolmetsch RE, Lewis RS (2009) STIM1 and calmodulin interact with Orai1 to induce Ca2+‐dependent inactivation of CRAC channels. Proc Natl Acad Sci USA 106: 15495–15500 [DOI] [PMC free article] [PubMed] [Google Scholar]
- Murphy SE, Levine TP (2016) VAP, a versatile access point for the endoplasmic reticulum: review and analysis of FFAT‐like motifs in the VAPome. Biochim Biophys Acta 1861: 952–961 [DOI] [PubMed] [Google Scholar]
- Navarro‐Borelly L, Somasundaram A, Yamashita M, Ren D, Miller RJ, Prakriya M (2008) STIM1‐Orai1 interactions and Orai1 conformational changes revealed by live‐cell FRET microscopy. J Physiol 586: 5383–5401 [DOI] [PMC free article] [PubMed] [Google Scholar]
- Nunes‐Hasler P, Demaurex N (2017) The ER phagosome connection in the era of membrane contact sites. Biochim Biophys Acta 1864: 1513–1524 [DOI] [PubMed] [Google Scholar]
- Palty R, Raveh A, Kaminsky I, Meller R, Reuveny E (2012) SARAF inactivates the store operated calcium entry machinery to prevent excess calcium refilling. Cell 149: 425–438 [DOI] [PubMed] [Google Scholar]
- Parekh AB (2017) Regulation of CRAC channels by Ca(2+)‐dependent inactivation. Cell Calcium 63: 20–23 [DOI] [PubMed] [Google Scholar]
- Park MK, Lomax RB, Tepikin AV, Petersen OH (2001) Local uncaging of caged Ca(2+) reveals distribution of Ca(2+)‐activated Cl(‐) channels in pancreatic acinar cells. Proc Natl Acad Sci USA 98: 10948–10953 [DOI] [PMC free article] [PubMed] [Google Scholar]
- Paulino C, Kalienkova V, Lam AKM, Neldner Y, Dutzler R (2017) Activation mechanism of the calcium‐activated chloride channel TMEM16A revealed by cryo‐EM. Nature 552: 421–425 [DOI] [PubMed] [Google Scholar]
- Petersen OH (2014) Calcium signalling and secretory epithelia. Cell Calcium 55: 282–289 [DOI] [PubMed] [Google Scholar]
- Prakriya M, Lewis RS (2015) Store‐operated calcium channels. Physiol Rev 95: 1383–1436 [DOI] [PMC free article] [PubMed] [Google Scholar]
- Shin DM, Luo X, Wilkie TM, Miller LJ, Peck AB, Humphreys‐Beher MG, Muallem S (2001) Polarized expression of G protein‐coupled receptors and an all‐or‐none discharge of Ca2+ pools at initiation sites of [Ca2+]i waves in polarized exocrine cells. J Biol Chem 276: 44146–44156 [DOI] [PubMed] [Google Scholar]
- Stathopulos PB, Schindl R, Fahrner M, Zheng L, Gasmi‐Seabrook GM, Muik M, Romanin C, Ikura M (2013) STIM1/Orai1 coiled‐coil interplay in the regulation of store‐operated calcium entry. Nat Commun 4: 2963 [DOI] [PMC free article] [PubMed] [Google Scholar]
- Stohr H, Heisig JB, Benz PM, Schoberl S, Milenkovic VM, Strauss O, Aartsen WM, Wijnholds J, Weber BH, Schulz HL (2009) TMEM16B, a novel protein with calcium‐dependent chloride channel activity, associates with a presynaptic protein complex in photoreceptor terminals. J Neurosci 29: 6809–6818 [DOI] [PMC free article] [PubMed] [Google Scholar]
- Suzuki J, Umeda M, Sims PJ, Nagata S (2010) Calcium‐dependent phospholipid scrambling by TMEM16F. Nature 468: 834–838 [DOI] [PubMed] [Google Scholar]
- Szasz T, Webb RC (2017) Rho‐mancing to sensitize calcium signaling for contraction in the vasculature: role of rho kinase. Adv Pharmacol 78: 303–322 [DOI] [PubMed] [Google Scholar]
- Toulmay A, Prinz WA (2012) A conserved membrane‐binding domain targets proteins to organelle contact sites. J Cell Sci 125: 49–58 [DOI] [PMC free article] [PubMed] [Google Scholar]
- Whitlock JM, Hartzell HC (2017) Anoctamins/TMEM16 proteins: chloride channels flirting with lipids and extracellular vesicles. Annu Rev Physiol 79: 119–143 [DOI] [PMC free article] [PubMed] [Google Scholar]
- Wlodarczyk J, Woehler A, Kobe F, Ponimaskin E, Zeug A, Neher E (2008) Analysis of FRET signals in the presence of free donors and acceptors. Biophys J 94: 986–1000 [DOI] [PMC free article] [PubMed] [Google Scholar]
- Ye W, Han TW, Nassar LM, Zubia M, Jan YN, Jan LY (2018) Phosphatidylinositol‐(4, 5)‐bisphosphate regulates calcium gating of small‐conductance cation channel TMEM16F. Proc Natl Acad Sci USA 115: E1667–E1674 [DOI] [PMC free article] [PubMed] [Google Scholar]
- Yen M, Lewis RS (2019) Numbers count: how STIM and Orai stoichiometry affect store‐operated calcium entry. Cell Calcium 79: 35–43 [DOI] [PMC free article] [PubMed] [Google Scholar]
- Zal T, Gascoigne NR (2004) Photobleaching‐corrected FRET efficiency imaging of live cells. Biophys J 86: 3923–3939 [DOI] [PMC free article] [PubMed] [Google Scholar]
Associated Data
This section collects any data citations, data availability statements, or supplementary materials included in this article.
Supplementary Materials
Appendix
Expanded View Figures PDF
Review Process File
Source Data for Figure 1
Source Data for Figure 2
Source Data for Figure 3


