Abstract
Bronchioalveolar stem cells (BASCs) are a potential source for lung regeneration, but direct in vivo evidence for a multipotential lineage contribution during homeostasis and disease is critically missing, since specific genetic labeling of BASCs has not been possible. We developed a novel cell tracing approach based on intein‐mediated assembly of newly engineered split‐effectors, allowing selective targeting of dual‐marker expressing BASCs in the mouse lung. RNA sequencing of isolated BASCs demonstrates that BASCs show a distinct transcriptional profile, characterized by co‐expression of bronchiolar and alveolar epithelial genes. We found that BASCs generate the majority of distal lung airway cells after bronchiolar damage but only moderately contribute to cellular turnover under homeostatic conditions. Importantly, DTA‐mediated ablation of BASCs compromised proper regeneration of distal airways. The study defines BASCs as crucial components of the lung repair machinery and provides a paradigmatic example for the detection and manipulation of stem cells that cannot be recognized by a single marker alone.
Keywords: BASCs, cell tracing, lung repair, lung stem cells, split‐tTA
Subject Categories: Development & Differentiation, Immunology, Stem Cells
Introduction
Most organs and tissues harbor specialized stem cells, which together with progenitor cells and proliferation‐competent specialized cells are a constant source of cell renewal under homeostatic conditions. In addition, such cells enable efficient tissue regeneration following multiple types of injury and during disease. Disablement of tissue‐resident stem or progenitor cells has grave consequences for organ function as exemplified by the side effects of chemotherapy and irradiation. In particular, tissues facing the outside environment such as the skin (Blanpain & Fuchs, 2014), the intestine (Clevers, 2013), and the lung (Hogan et al, 2014) are bestowed with a high intrinsic regenerative capacity allowing them to withstand numerous adverse conditions. The pulmonary epithelium is continuously exposed to potentially harmful airborne substances and pathogens, which might cause damage requiring instant repair. This task is achieved by a battery of different stem and progenitor cells, which act at different locations along the respiratory tree and which serve in some cases additional roles as essential constituents of the lung epithelium (Giangreco et al, 2009; Hogan et al, 2014; Li et al, 2015).
In the distal lung, differentiated Club cells can self‐renew and replace lost Club cells or give rise to ciliated cells (Rawlins et al, 2009), while cuboidal alveolar type cells (AT2) in the alveoli self‐renew and in response to injury form AT1 cells required for gas exchange (Barkauskas et al, 2013). It has been speculated that Club and AT2 cells are replenished by a joint progenitor or stem cell population, located at bronchioalveolar duct junctions (BADJs). Such cells can be identified by co‐expression of Clara/Club cell secretory protein (CCSP, gene name Scgb1a1) and surfactant‐associated protein C (SPC, gene name Sftpc), seem to exhibit key stem cell properties, and differentiate into both bronchiolar and alveolar lineages in vitro (Kim et al, 2005; Lee et al, 2014). Thus, CCSP and SPC co‐expressing cells were tentatively named bronchioalveolar stem cells (BASCs; Kim et al, 2005), although the true function of BASCs in vivo has remained highly controversial (Raiser & Kim, 2009; Rawlins et al, 2009). BASCs display injury‐resistance in some pulmonary disease models but their survival during infectious diseases of the lung and their contribution to lung regeneration following, for example, influenza virus (IV) infection has not been investigated in detail.
The major bottleneck for addressing the function of BASCs in vivo has been the lack of a singular, unique BASC‐specific marker gene, which prevented specific targeting of BASCs in the mouse. Thus, we decided to develop a genetic approach allowing specific labeling and manipulation of BASCs, based on the co‐expression of CCSP and SPC. Intein‐mediated assembly of split‐Cre and split‐tTA effectors allowed us to selectively target dual‐marker expressing BASCs. We describe that BASCs contribute only moderately to the renewal of the bronchioalveolar lung epithelium under homeostatic conditions and during aging but represent the main source for tissue regeneration in the distal lung airways after naphthalene treatment. Accordingly, diphtheria toxin a‐chain (DTA)‐mediated ablation of BASCs impaired efficient lung regeneration. We also show that IV infection destroys BASCs and limits their contribution to tissue healing.
Results
Generation of split‐Cre and split‐tTA effector molecules
Since BASCs are characterized by co‐expression of CCSP and SPC, we engineered non‐functional effector halves of either the Cre recombinase or the tTA transactivator. We reasoned that separate expression of effector halves from the two BASC‐defining genetic loci will allow selective targeting of dual‐marker expressing cells (Fig 1A). For reconstitution, we utilized the split‐intein system enabling efficient intein‐mediated protein trans‐splicing (Perler, 2005; Wang et al, 2012; Hermann et al, 2014). Analysis of various different split‐effector/split‐intein fusions (Fig 1B) using Western blot (Fig EV1A and B) and reporter gene assays (Figs 1C and D, and EV1C) revealed that a Npu N1/C1 split‐Cre (Fig 1C) and a Npu N/C split‐tTA pair (Fig 1D) reached 81 and 75% of their native activities, respectively. Importantly, reconstituted tTA showed the same response to doxycycline addition as native tTA (Fig EV1D) and displayed strong activity even when different effector halves were expressed at unfavorable stoichiometry (up to factor 104; Fig EV1E).
Figure 1. Engineering of split‐Cre and split‐tTA effector molecules.
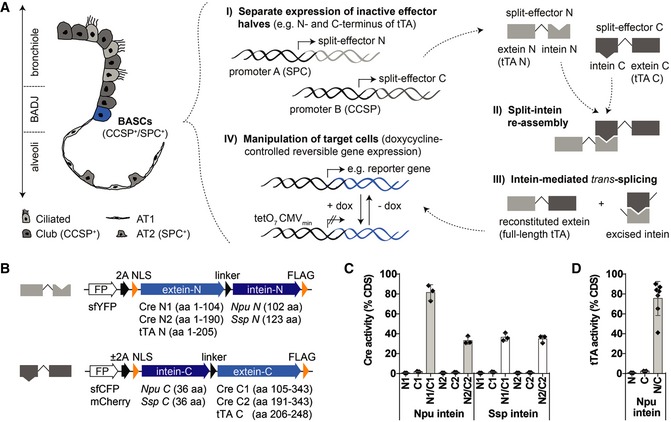
- Schematic depiction of bronchioalveolar cell types and strategy for selective in vivo manipulation of dual‐marker expressing target cells.
- Split‐effector construct design.
- Quantification of Cre activity by dual luciferase assays (mean ± SD, n = 3).
- Quantification of tTA activity by dual luciferase assays [mean ± SD, n = 3 (N and C) or n = 7 (N/C)].
Figure EV1. In vitro characterization of split‐effector molecules.
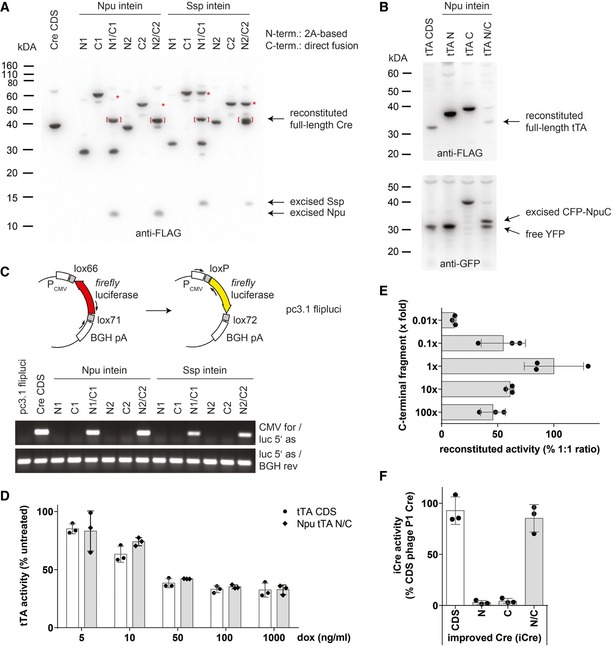
- Western blot analysis of Cre reconstitution by intein‐mediated trans‐splicing. Brackets indicate reconstituted full‐length Cre protein, and asterisks denote near complete conversion of C‐terminal effector fragment using Npu‐based split‐Cre pairs.
- Reconstitution of full‐length tTA protein by intein‐mediated trans‐splicing.
- PCR‐based analysis of Cre‐mediated DNA recombination.
- Quantification of tTA activity by dual luciferase assays in the presence of doxycycline (dox). Data depicted as mean ± SD, n = 3.
- Reconstitution of biologically active tTA protein at different ratios of N‐ and C‐terminal fragments. A constant amount of Npu tTA N was co‐transfected with varying amounts of Npu tTA C to mimic potential differences in expression levels. tTA activity was quantified by dual luciferase assays. Data depicted as mean ± SD, n = 3.
- In vitro testing of split‐iCre reconstitution used for insertion into endogenous Ccsp and Spc gene loci. Phage P1‐derived Cre fragments within the Npu N1/C1 split‐pair were replaced by equivalent sequences from a codon‐improved Cre recombinase (iCre). Cre activity was quantified by dual luciferase assays. Data depicted as mean ± SD, n = 3.
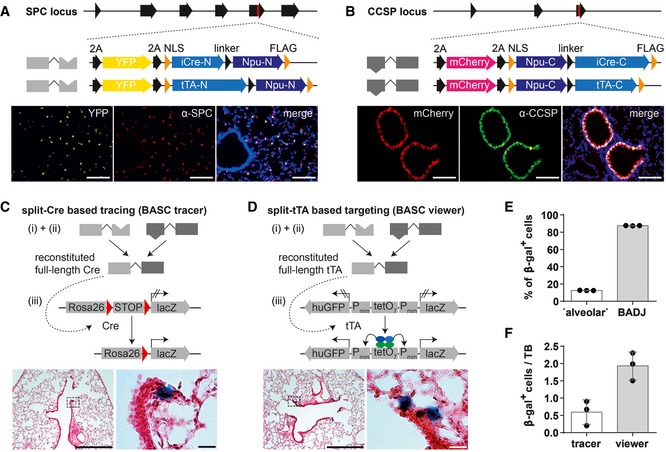
To selectively target BASCs in vivo, we inserted the most efficient split‐effector cassettes together with YFP and mCherry reporter genes into the Spc (N‐termini) and Ccsp loci (C‐termini) upstream of the endogenous stop codon (Fig 2A and B). A codon‐improved Cre recombinase (Shimshek et al, 2002) was used to prevent unwanted silencing of modified loci (Fig EV1F). Correct and robust expression of fluorescent proteins from the targeted loci was determined by fluorescence microscopy of individual split‐Cre (Appendix Figs S1 and S2) and split‐tTA knock‐in strains (Appendix Figs S3 and S4). Comparison of YFP and mCherry fluorescence with antibody staining against SPC and CCSP verified complete overlap of reporter and endogenous protein expression in AT2 and Club cells (Fig 2A and B). The combination of corresponding N‐ and C‐terminal knock‐in alleles enabled simultaneous detection of AT2 and Club cells but an unequivocal identification of dual‐positive BASCs by fluorescence was difficult, most likely due to a relatively low expression of CCSP in BASCs compared to Club cells (Kim et al, 2005).
Figure 2. Expression of split‐effectors from Spc and Ccsp loci targets BASCs at BADJs.
-
A, BScheme of engineered Spc and Ccsp loci after integration of split‐Cre and split‐tTA effectors (red mark = stop codon) and comparison of endogenous SPC or CCSP expression and YFP or mCherry reporter expression in lung sections. Blue: DAPI. Scale bar: 100 μm.
-
C, Dβ‐galactosidase and H&E staining of lung sections from BASC tracer and BASC viewer animals. Scale bars: 500 μm (overview) and 20 μm (boxed magnification).
-
ELocalization of β‐gal+ cells in adult BASC viewer animals. BADJ‐associated and “alveolar” β‐gal+ cells are expressed as percentage of all lineage‐labeled cells (mean ± SD, n = 3).
-
FNumber of β‐gal+ cells in adult BASC tracer and BASC viewer animals, normalized to the number of terminal bronchioles (TBs; mean ± SD, n = 3).
Source data are available online for this figure.
Split‐intein‐mediated effector reconstitution in SPC and CCSP co‐expressing cells enables faithful labeling of BASCs
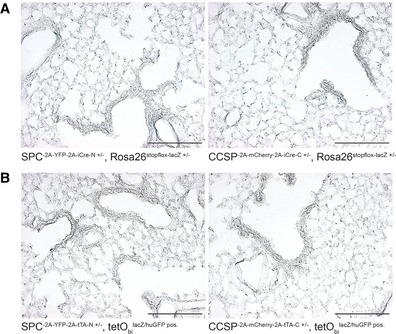
To reconstitute Cre recombinase and tTA and visualize BASCs in situ, we generated BASC tracer (SPC−2A‐YFP−2A‐iCre‐N, CCSP−2A‐mCherry−2A‐iCre‐C, Rosa26stopflox‐lacZ) and BASC viewer (SPC−2A‐YFP−2A‐tTA‐N, CCSP−2A‐mCherry−2A‐tTA‐C, tetObi lacZ/huGFP) strains by crossing the different split‐effector strains with appropriate reporters (Soriano, 1999; Krestel et al, 2001). We observed distinct labeling of cells at the predicted anatomical niche of BASCs both in BASC tracer (Fig 2C) and in BASC viewer mice (Fig 2D). The majority (~87%) of β‐gal+ cells localized directly at or in close proximity to BADJs (Fig 2E). A minor fraction (~13%) was classified as “alveolar”, since no terminal bronchioles were visible on the respective sections. Of note, no β‐galactosidase staining was present when individual N‐ and C‐terminal split‐effectors were combined with corresponding reporter alleles (Fig EV2). Although Cre‐mediated recombination should label BASCs and all derivatives, while split‐tTA‐based labeling only permits detection of the actual BASC pool, quantitative assessment indicated a threefold higher abundance of β‐gal+ cells in BASC viewer compared to BASC tracer mice (Fig 2F). We concluded that the use of split‐tTA effector molecules provides significantly higher sensitivity compared to the split‐Cre approach, which might be caused by (i) the robustness of split‐tTA reconstitution already observed in in vitro experiments (Fig EV1E), and/or (ii) the ability of even low concentrations of reconstituted tTA to efficiently drive reporter gene expression.
Figure EV2. Individual split‐effector halves are functionally inactive.
-
A, Bβ‐galactosidase staining of lung sections from N‐ and C‐terminal. (A) split‐Cre or (B) split‐tTA knock‐in strains combined with corresponding reporter alleles as indicated. Scale bar: 200 μm.
To further validate the specificity of split‐effector‐based cell targeting, we performed sequential imaging of reporter gene‐driven epifluorescence and β‐galactosidase activity on lung sections from BASC viewer mice (Fig 3A). In addition, we isolated Club cells (mCherry+), AT2 cells (YFP+), and BASCs (mCherry+/YFP+) by fluorescence‐activated cell sorting (FACS) from BASC viewer mice (Fig EV3) and stained individual populations for β‐galactosidase activity (Fig 3B). Both approaches exclusively labeled dual‐marker expressing target cells, thereby confirming BASC specificity of the split‐tTA approach. Since the split‐tTA effector did not only show higher efficiency (Fig 2F) but also allows temporal control of gene expression enabling reversible labeling and manipulation of BASCs in vivo (Fig 3C), we decided to use this system for the further course of our study.
Figure 3. Selective and reversible manipulation of CCSP and SPC co‐expressing BASCs by split‐tTA effectors.
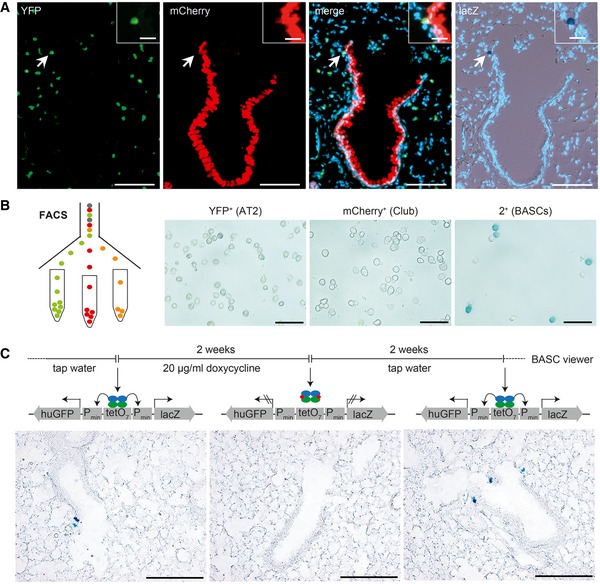
- Sequential microscopic imaging of epifluorescence and β‐galactosidase activity in lung sections of adult BASC viewer animals. Arrow highlights labeled BASC at BADJ (magnified in box). Blue: DAPI. Scale bars: 100 μm (overview) and 20 μm (boxed magnification).
- β‐galactosidase staining of AT2 cells (YFP+), Club cells (mCherry+), and BASCs (mCherry+/YFP+) isolated from BASC viewer mice by fluorescence‐activated cell sorting (FACS). Scale bar: 50 μm.
- Doxycycline‐dependent reversible labeling of BASCs in BASC viewer mice. Scale bar: 200 μm.
Figure EV3. Isolation of AT2 cells, Club cells, and BASCs by FACS .
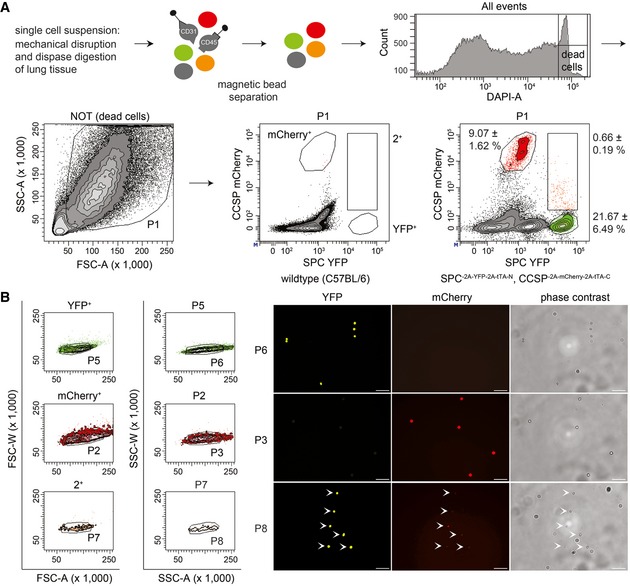
- Hematopoietic and endothelial cells were separated from lung cell suspensions using magnetic beads (anti‐CD45 and anti‐CD31). Viable epithelial cells were analyzed for mCherry and YFP fluorescence to establish the gates for mCherry+ (Club cells), YFP+ (AT2 cells), and 2+ (BASCs). Cell abundance is shown as percentage of total P1 cells. Data depicted as mean ± SD, n = 10.
- Doublet exclusion based on forward (FSC) and side scatter (SSC) width versus amplitude plots and subsequent fluorescence microscopy of FACS‐isolated single cells. Scale bar: 50 μm.
Source data are available online for this figure.
BASCs own a distinct transcriptional signature that partially overlaps with AT2 and Club cells
To further characterize BASCs co‐expressing CCSP and SPC, we examined expression of Sca‐1 (stem cell antigen‐1, gene name: Ly6A/E) by flow cytometry. In line with other studies, Sca‐1 immunoreactivity was detected in different epithelial and mesenchymal cell subsets (Fig EV4; McQualter et al, 2009; Teisanu et al, 2009). Only few BASCs were found within the Sca‐1‐positive gate, while Club cells displayed a Sca‐1‐positive marker profile (Fig EV4), indicating that Sca‐1 does not distinguish BASCs from other lung epithelial cells as suggested previously (Kim et al, 2005).
Figure EV4. Flow cytometric analysis of stem cell antigen‐1 (Sca‐1) expression.
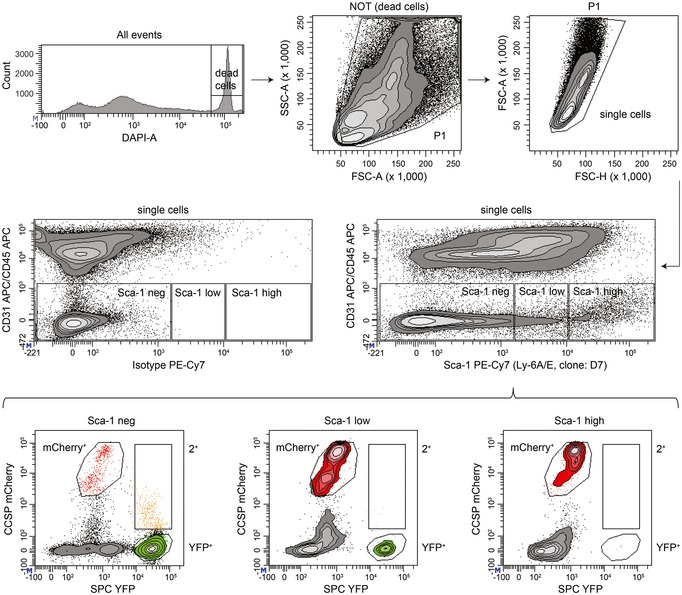
Viable single cells of non‐endothelial and non‐hematopoietic origin (CD31/CD45 neg) derived from lungs of BASC viewer mice were analyzed for Sca‐1 immunoreactivity to establish the gates Sca‐1 neg/low/high. Sca‐1 fractions were subsequently analyzed for mCherry and YFP fluorescence to identify Club cells (mCherry+), AT2 cells (YFP+), and BASCs (2+).
To unravel additional transcriptional differences and similarities between BASCs, AT2 and Club cells, we isolated CCSP+, SPC+, and CCSP+/SPC+ cells by FACS taking advantage of the mCherry and YFP reporter genes and performed RNA sequencing (RNA‐seq). Unbiased, global Spearman correlation analysis of all expressed genes revealed a higher similarity of BASCs with AT2 compared to Club cells, although all three epithelial cell types separated into distinct groups (Fig 4A). Similarly, principal component analysis (PCA) showed that BASCs clustered between AT2 and Club cell preparations (Fig 4B). Direct comparisons using MA and volcano plots identified a larger number of differentially expressed genes (DEGs) between BASCs and Club cells (Fig 4C) compared to BASCs and AT2 cells (Fig 4D). Relative to Club cells, BASCs showed higher expression of several alveolar markers including Sftpa1, Sftpb, Sftpc, Etv5, Napsa, Lamp3, and Egfl6 (Fig 4C). Moreover, BASCs expressed lower levels of the naphthalene‐metabolizing enzyme Cyp2f2, which might explain why BASCs are more resistant against xenobiotics (Fig 4C). Although differences of BASCs to AT2 cells were less pronounced compared to Club cells, RNA‐seq identified multiple bronchiolar markers such as Scgb1a1, Scgb3a2, CD24a, Muc5b, Aldh1a1, Gabrp, and Sox2 among the top 50 deregulated genes in BASCs compared to AT2 cells (Fig 4D). Simultaneous comparison demonstrated that BASCs own a distinct transcriptional profile, which is partially shared by either AT2 or Club cells (Fig 4E). Genes exclusively expressed in BASCs were rare and only transcribed at low levels questioning their usefulness as distinctive markers (Fig 4E).
Figure 4. Transcriptional profiling of BASCs, AT2 and Club cells.
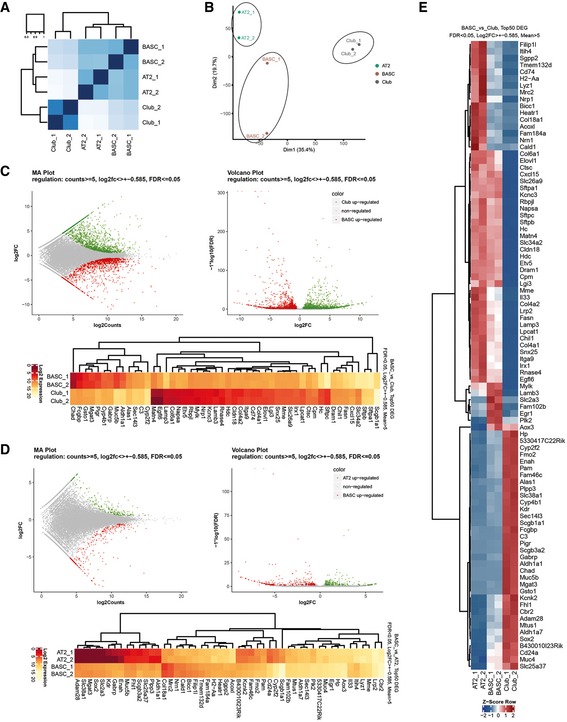
- Heatmaps for Spearman correlation.
- Principal component analysis reveals distinct clustering of AT2, Club, and BASC populations.
- MA and volcano plots, and Top50 DEGs (FDR < 0.05, Log2FC > ± 0.585, Means > 5) for visualization of pairwise differential gene expression analysis of BASCs and Club cells.
- MA and volcano plots, and Top50 DEGs (FDR < 0.05, Log2FC > ± 0.585, Means > 5) for visualization of pairwise differential gene expression analysis of BASCs and AT2 cells.
- Heatmap of RNA‐seq z‐scores computed for the Top50 DEGs in BASC, AT2 and Club cells (FDR < 0.05, Log2FC > ± 0.585, Means > 5).
BASCs continuously contribute to the homeostasis of the bronchioalveolar epithelium
To exploit the higher sensitivity of split‐tTA effectors for lineage tracing, we established quadruple transgenic mice (SPC−2A‐YFP−2A‐tTA‐N, CCSP−2A‐mCherry−2A‐tTA‐C, tetObi luc/Cre, Rosa26stopflox‐lacZ), hereafter called BASC v‐race (=view + trace). Reconstituted split‐tTA effectors in BASC v‐race animals induce expression of Cre recombinase (Schonig et al, 2002) allowing permanent labeling of BASCs and their derivatives (Fig 5A). BASC v‐race mice showed efficient labeling of BASCs and their descendants in virtually all transitional regions between terminal bronchioles (TBs) and alveoli. Adult, 3‐month‐old BASC v‐race animals harbored small clusters of lineage‐labeled cells, which exhibited a slightly broader anatomical distribution compared to BASC viewer mice indicating that BASCs had already generated differentiated cells at this stage (Fig 5B and C). Isolation of Club cells (mCherry+), AT2 cells (YFP+), and BASCs (mCherry+/YFP+) from 3‐month‐old BASC v‐race mice confirmed this assumption. β‐gal+ cells were not only present in BASC but also in Club and AT2 fractions (Fig 5B). In addition, we observed a further increase of BASC‐derived epithelial cells in 2‐year‐old aged animals, corroborating a continuous, low rate contribution of BASCs to the homeostatic turnover of the bronchioalveolar epithelium (Fig 5C).
Figure 5. BASCs continuously contribute to homeostatic renewal of the bronchioalveolar epithelium.
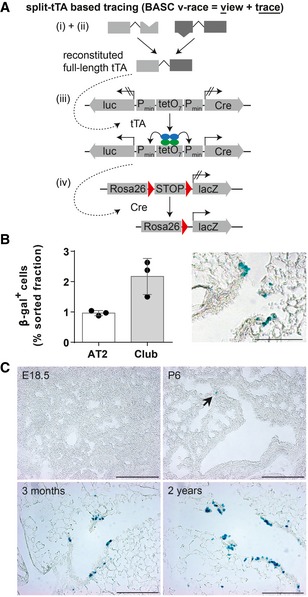
- Schematic depiction of the strategy to trace BASCs and descendants via the split‐tTA system.
- Quantification of β‐gal+ cells in FACS‐purified AT2 and Club cell fractions isolated from 3‐month‐old BASC v‐race mice (mean ± SD, n = 3) and example of β‐galactosidase label distribution in lung sections. Scale bar: 100 μm.
- BASCs emerge at early postnatal stages and contribute to epithelial turnover throughout life. β‐galactosidase staining of lung sections derived from BASC v‐race animals collected at indicated time points. Arrow highlights β‐gal+ cell at P6. Scale bar: 200 μm.
Source data are available online for this figure.
The relatively low number of BASC‐derived cells in healthy lungs suggests that BASCs emerge after birth when the formation of pulmonary epithelia has been mostly completed. To validate this conclusion and to determine the first appearance of BASCs, we analyzed the presence of β‐gal+ cells at different time points during late fetal stages and after birth (Fig 5C). We did not detect labeled cells at E18.5 but at P6 and later stages, indicating that BASCs are generated postnatally during the alveolar stage of lung development.
BASCs own multi‐lineage differential potential and contribute substantially to distal lung regeneration
Previous findings suggested that stem cells are dispensable for the maintenance of lung epithelia under steady‐state conditions (Giangreco et al, 2009) due to the ability of Club and AT2 cells to renew and give rise to ciliated cells and AT1 cells, respectively. However, the same studies suggested a stem cell‐based mechanism with clonal expansion after severe damage to restore damaged epithelia (Giangreco et al, 2009). Therefore, we subjected BASC v‐race animals to several different pulmonary disease models [i.e., bleomycin treatment, influenza virus (IV) infection, and exposure to naphthalene] and studied the appearance of BASC‐derived cells during epithelial repair in whole lung preparations (Fig 6A). To prevent any de novo labeling of cells that might arise from concomitant activation of Ccsp and Spc expression in response to injury, BASC v‐race animals were treated with doxycycline starting 2 weeks before the injury and during the recovery phase. Remarkably, prominent clusters of BASC‐derived β‐gal+ cells appeared throughout the entire distal lung parenchyma in all three disease models (Fig 6A). Bleomycin‐induced damage primarily triggered the formation of numerous large groups of BASC‐derived YFP+ AT2 cells within alveolar regions adjacent to TBs (Fig 6AII and BII). Acute naphthalene‐mediated bronchiolar injury resulted in clusters of lineage‐traced cells covering distal airways, which mainly consisted of mCherry+ Club cells (Fig 6AIV and BIV). The formation of new BASC‐derived lung epithelial cells corresponded closely to the destruction of alveolar cells by bleomycin and of Club cells by naphthalene. To further investigate the response of BASCs to different types of injury, we used the IV model in which both the alveolar and bronchiolar lung epithelium are indiscriminately destroyed. In contrast to the compartment‐specific damage, BASCs contributed equally to the repair of alveolar and distal bronchiolar compartments after IV infection (Fig 6AIII and BIII). The balanced contribution of BASCs to both epithelial compartments clearly indicates that BASCs own a multi‐lineage differentiation potential in vivo and specifically respond to distinct types of tissue damage for repair of the bronchioalveolar epithelium (Fig 6C).
Figure 6. BASCs contribute substantially to lung regeneration and display multi‐lineage differentiation potential.
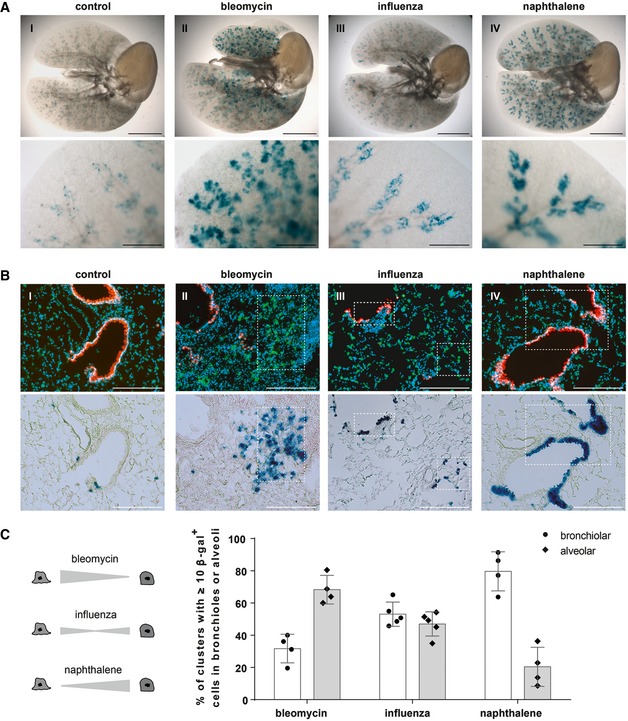
- β‐galactosidase staining of cleared whole lung preparations isolated from control and injured BASC v‐race animals 21 days (bleomycin, naphthalene) or 35 days (influenza) following injury. Scale bar: 5 mm (whole lungs) and 1 mm (magnification).
- Sequential microscopic imaging of epifluorescence and β‐galactosidase activity in lung sections of control and injured BASC v‐race mice. Clusters of BASC‐derived AT2 (YFP+) and Club cells (mCherry+) are highlighted. Blue: DAPI. Scale bar: 200 μm.
- Contribution of BASCs to different cellular compartments. Bronchiolar and alveolar accumulations of lineage‐traced BASC derivatives are expressed as percentage of all clusters containing ≥ 10 β‐gal+ cells. Data depicted as mean ± SD, n = 4 (bleomycin, naphthalene) or n = 5 (influenza).
Source data are available online for this figure.
The expansion of BASC‐derived cells was relatively moderate after IV infection compared to bleomycin‐ or naphthalene‐induced lung injury. We therefore reasoned that IV infection might damage or destroy BASCs and thereby limit their contribution to post‐viral lung repair. In fact, we observed a striking decline of β‐gal+ BASCs in influenza‐infected BASC viewer mice indicating that IV efficiently kills BASCs during the course of viral infection (Fig 7A and B).
Figure 7. BASCs expand in response to bronchiolar injury and are removed by IV infection.
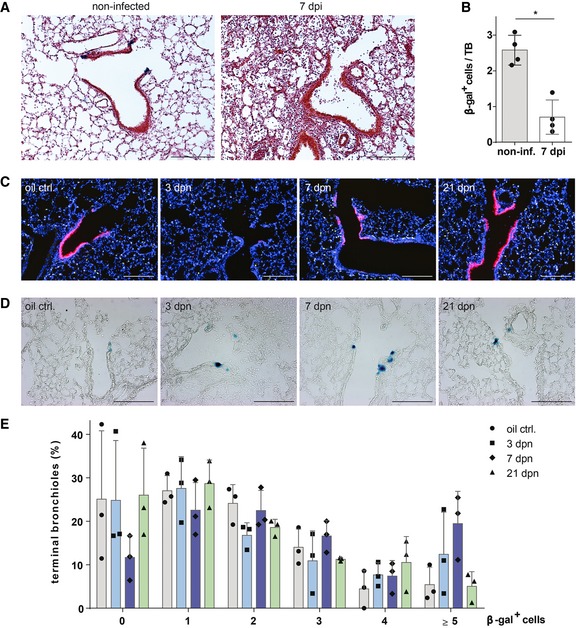
- β‐galactosidase and H&E staining of lung sections from control (non‐infected) and injured BASC viewer mice 7 days post‐infection (7 dpi) with influenza virus. Scale bar: 200 μm.
- Abundance of β‐gal+ cells in control (non‐infected) and injured (7 dpi) BASC viewer animals. Data depicted as mean ± SD, n = 4, *P = 0.0286 (Mann–Whitney test), TB, terminal bronchiole.
- Club cell depletion/recovery after naphthalene treatment. Microscopic imaging of epifluorescence in lung sections from control and injured BASC viewer animals isolated 3, 7, and 21 days post‐naphthalene (dpn). Blue: DAPI. Scale bar: 200 μm.
- β‐galactosidase staining of lung sections from control and injured BASC viewer animals 3, 7, and 21 days post‐naphthalene (dpn). Scale bar: 200 μm.
- Abundance of β‐gal+ cells in control and injured BASC viewer animals. The percentage of terminal bronchioles containing 0, 1, 2, 3, 4, ≥ 5 β‐gal+ cells is shown. Data depicted as mean ± SD, n = 3.
Source data are available online for this figure.
BASCs expand in response to bronchiolar injury and are a predominant source for distal airway regeneration
Accurate measurement of the relative contribution of BASCs to bronchioalveolar regeneration requires precise knowledge about the extent of epithelial damage. In our experimental setting, such conditions can be achieved by naphthalene treatment, which destroys all Club cells with the exception of a rare population of so‐called variant Club cells. Using BASC viewer animals, we first confirmed that most mCherry+ Club cells were destroyed 3 days post‐naphthalene (dpn; Fig 7C), while BASCs were not affected due to their resistance against naphthalene (Fig 7D and E). The number of BASCs peaked at 7 dpn when 19% of all TBs contained ≥ 5 β‐gal+ cells (Fig 7D and E) suggesting that BASCs transiently amplify during the course of regeneration without immediate differentiation to Club cells. Analysis of naphthalene‐treated BASC v‐race animals, which had been exposed to doxycycline thereby restricting labeling to already existing BASCs and immediate derivatives, revealed a dramatic enlargement of the BASC‐derived β‐gal+ cell population. In fact, BASC‐derived cells represented the majority of all mCherry+ cells in distal TBs (Fig 8A). Furthermore, we assessed the total number of BASC‐derived Club cells in whole lungs by FACS. Although this approach massively dilutes the labeled cell pool due to the inclusion of Club cells from proximal airways, we detected a sixfold increase of BASC‐derived Club cells in regenerating versus healthy lungs (Fig 8B). In addition, we detected numerous lineage‐traced ciliated cells, which were most likely generated by differentiation of BASC‐derived Club cells (Fig 8C).
Figure 8. BASCs are a main cellular source for distal airway regeneration.
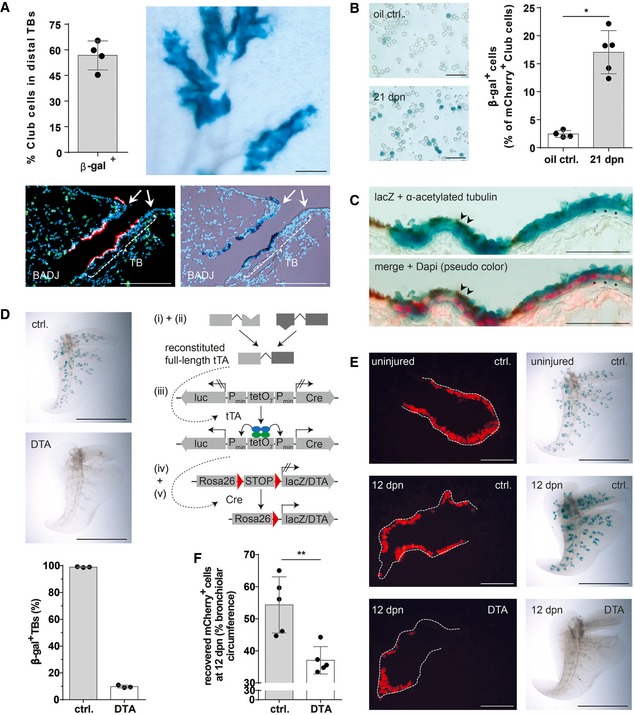
- Quantification of lineage‐traced Club cells in distal TBs and β‐galactosidase staining of cleared accessory lobe preparation (scale bar: 250 μm) isolated from injured BASC v‐race mice at 21 dpn (mean ± SD, n = 4). Bottom panel: example of sequential microscopic imaging to quantify β‐gal+ mCherry+ cells in distal TBs. Arrows denote last airway bifurcation before bronchioalveolar duct junction (BADJ). Scale bar: 200 μm.
- β‐galactosidase staining of FACS‐purified Club cells from control and injured BASC v‐race animals. Scale bar: 50 μm. The percentage of lineage‐traced Club cells is shown [(mean ± SD, n = 4 (oil ctrl.) or n = 5 (21 dpn), * P = 0.0159 (Mann–Whitney test)].
- Combined β‐galactosidase (blue) and acetylated tubulin staining (cilia, brown color) of lung sections from BASC v‐race animals at 21 dpn. Red: DAPI (pseudocolor). Examples of lineage‐traced ciliated cells (arrowheads) and Club cells (asterisks) are highlighted. Scale bar: 50 μm.
- β‐galactosidase staining of cleared accessory lobe preparations (scale bar: 5 mm) and quantification of β‐gal+ bronchioles in lung sections from adult BASC v‐race (ctrl.) and BASC‐ablated mice (DTA). Data depicted as mean ± SD, n = 3.
- β‐galactosidase staining of cleared accessory lobe preparations (scale bar: 5 mm) and fluorescence microscopy of lung sections from uninjured and naphthalene‐exposed BASC v‐race (ctrl.) and BASC‐ablated (DTA) mice 12 days post‐naphthalene (dpn). Dotted lines depict bronchiolar boundaries. Scale bar: 100 μm.
- Quantification of Club cell recovery in injured BASC v‐race (ctrl.) and BASC‐ablated (DTA) animals, expressed as percentage of bronchiolar circumference re‐populated by mCherry+ cells at 12 dpn. Data depicted as mean ± SD, n = 5, **P = 0.0079 (Mann–Whitney test). DTA, diphtheria toxin fragment A.
Source data are available online for this figure.
To investigate whether individual BASCs give rise to clones of Club and AT2 cells, we applied a stringent doxycycline regimen, which labels single BASCs in adult BASC v‐race animals (Fig EV5). We detected multiple, differentially sized clones of β‐gal+ cells 21 days after naphthalene or bleomycin treatment either in bronchiolar or alveolar compartments indicating that individual BASCs directly respond to local needs (Fig EV5). Furthermore, the doxycycline treatment formally rules out that newly labeled bronchiolar or alveolar cells were generated from cells that had lost BASC characteristics during postnatal development.
Figure EV5. Clonal analysis of BASCs forming clusters of bronchiolar and alveolar epithelial cells.
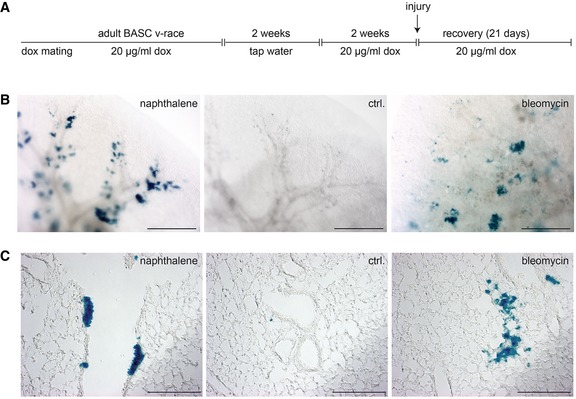
-
ASchematic outline of the treatment regimen. BASC v‐race animals were already treated with doxycycline during breeding. Doxycycline treatment of offspring was continued until adulthood. To induce labeling of single BASCs, doxycycline treatment was temporarily suspended for 2 weeks when mice reached an age of 2 months. Two weeks after re‐initiation of doxycycline treatment, lung injury was induced by administration of naphthalene or bleomycin.
-
B, Cβ‐galactosidase staining of cleared whole lung preparations (scale bar: 1 mm) and lung sections (scale bar: 200 μm) from control and injured BASC v‐race animals 21 days after injury. Labeling of single BASCs resulted in distinct clusters of β‐gal+ cells in the bronchiolar (Club cells) and alveolar (AT2 cells) compartment.
Ablation of BASCs impairs efficient regeneration of distal lung epithelia
To prove the physiological relevance of BASCs for lung regeneration, we genetically ablated BASCs via Cre‐inducible expression of diphtheria toxin (Voehringer et al, 2008; Fig 8D). Whole‐mount β‐galactosidase staining revealed efficient depletion of BASCs. Only about 10% of TBs in DTA‐expressing mice still contained β‐gal+ cells compared to nearly 100% in control animals (Fig 8D). As expected, BASC ablation completely prevented the massive expansion of lineage‐traced cells after naphthalene treatment (Fig 8E). Importantly, we observed a strong impairment of normal lung regeneration, despite the fact that ablation of BASCs was not complete. The coverage of the bronchiolar circumference by mCherry+ Club cells declined from 54% in control to 37% in BASC‐ablated animals at 12 dpn (Fig 8F) and large parts of the TB remained denuded of Club cells (Fig 8E), although the epithelium eventually recovered at later time points. Taken together, our data clearly demonstrate that BASCs play a dominant role in distal airway regeneration and critically determine the progress of repair, in particular at early stages of epithelial recovery.
Discussion
Here, we provide unequivocal evidence that a small population of cells at the BADJ characterized by co‐expression of CCSP and SPC efficiently re‐populates damaged areas of the pulmonary epithelium and is indispensable for efficient regeneration of the distal lung. In contrast, we only observed a moderate contribution of BASCs to homeostatic renewal of the bronchioalveolar epithelium. This finding is in line with the hypothesis that under steady‐state conditions, proliferation‐competent Club and AT2 cells are the main source for replenishment of the bronchioalveolar epithelium (Giangreco et al, 2009; Hogan et al, 2014; Li et al, 2015). Severe damage of the lung epithelium, however, requires expansion and differentiation of bi‐potent BASCs for efficient regeneration. Hence, BASCs will in most disease conditions jointly work together with remaining Club and AT2 cells to repair the lung. In such scenarios, loss of bronchiolar Club cells will provoke proliferation of remaining Club cells and BASCs, whereas alveolar damage will activate surviving AT2 cells and BASCs. Interestingly, BASCs responded specifically to the impairment of distinct cell populations, sensing which particular cell needs to be replaced. Naphthalene‐induced loss of Club cells resulted in differentiation of BASCs into the Club cell lineage, bleomycin‐induced alveolar damage induced differentiation into AT2 cells, while IV infections, which damage both bronchiolar and alveolar cells, resulted in concomitant formation of new Club and AT2 cells from BASCs. So far, it remains an open question whether BASCs directly receive specific emergency calls from proliferating Club or AT2 cells, whether such signals are relayed via mesenchymal cells, or whether the pathogen itself represents the decisive cue. The ability to transiently and specifically manipulate signaling pathways in BASCs by the split‐tTA system presented here creates an opportunity to address such questions in the future.
We do not want to claim that BASCs are the sole stem or progenitor cell population for replacement of Club and AT2 cells. In fact, even after virtually complete ablation of naphthalene‐sensitive Club cells, up to 43% of newly formed Club cells were not derived from BASCs but from other sources. We speculate that after naphthalene treatment, non‐BASC‐derived Club cells might mainly originate from variant Club (vClub) cells, which express uroplakin3a (UPK3A; Guha et al, 2017) but low levels of the cytochrome P450 enzyme Cyp2f2 (Buckpitt et al, 1995; Reynolds et al, 2000). The modular design of the split‐tTA system allows direct testing of this hypothesis by combining markers for vClub cells (UPK3A; CCSP) and BASCs (CCSP; SPC) followed by cell tracing. Alternatively, it seems also possible that differentiated Club cells under severe stress conditions dedifferentiate into functional Trp63+ basal stem cells (Tata et al, 2013), which then collaborate with BASCs to generate new Club or AT2 cells.
The presence of alternate cellular sources for the replacement of lost Club and AT2 cells explains the remaining regenerative capacity of the bronchioalveolar epithelium after DTA‐mediated ablation of BASCs. Despite the strong delay in lung regeneration, the main part of the epithelium eventually recovered, suggesting that other stem/progenitor cell populations are able to cope in the long term for loss of BASCs. DTA‐mediated cell ablation reduced the number of BASCs by 90% but 10% of BASCs remained. Hence, it is possible that surviving BASCs still contribute to regeneration, although we did not observe large patches of β‐gal+ Club cells after naphthalene treatment in BASC‐ablated (DTA) mice. The failure to completely eradicate BASCs by DTA expression was surprising, since DTA is continuously expressed at constant levels in BASCs and DTA‐mediated cell ablations works with a nearly 100% efficiency in other experimental settings (Gensch et al, 2008). Thus, it seems reasonable to assume that BASCs were constantly generated by cells not expressing DTA. Such newly generated BASCs might become visible just before undergoing subsequent cell death. This interpretation supports a model of substantial cellular plasticity in the bronchioalveolar epithelium, in which cells are able to transdifferentiate or dedifferentiate depending on local needs.
We also observed a strong depletion of BASCs after IV infection, which in some areas of the lung nearly reached the degree of DTA‐mediated BASC ablation. BASCs might be eradicated directly by the IV or by subsequent inflammatory processes. The severe reduction of BASCs, probably in combination with impaired functions of surviving BASCs, explains the limited contribution to lung regeneration in this disease condition. Although further studies are necessary, it is tempting to speculate that impairment of BASC pool is one of the reasons for the protracted course of pneumonia often seen after severe IV infections (Herold et al, 2015; Quantius et al, 2016).
Stem cells are defined by their ability to self‐renew and to generate specialized progeny. Furthermore, stem cells often undergo a period of transient amplification during regeneration to serve the enhanced need for the generation of differentiated cells. By using BASC viewer mice, which solely label BASCs but not their progeny, we demonstrated that BASCs indeed expand during regeneration and do not necessarily differentiate immediately into Club and AT2 cells. Hence, it should be possible to define conditions that promote proliferation of BASCs while maintaining their bi‐potent differentiation capacity. Expansion of bi‐potent BASCs will be important for the generation of better lung organoid cultures but also for future therapeutic interventions aiming to enlarge the BASC compartment in situ during disease processes. Although BASCs seem to self‐renew and amplify, it is possible that the BASC pool is also replenished by other stem cells or by more differentiated cells in the lung epithelium as discussed above, similar to the dedifferentiation of secretory cells to Trp63+ basal stem cells (Tata et al, 2013). Along this line, it is important to determine the developmental origin of BASCs or, more precisely, the cell type that gives rise to BASCs. It is evident that BASCs do not serve as embryonic progenitor cells for the bronchioalveolar epithelium as indicated by the relatively low number of BASC‐derived cells in healthy lungs. Moreover, BASCs are not directly generated from endodermal embryonic precursor cells, since we only detected BASCs after birth when the formation of pulmonary epithelia has been mostly completed. Hence, BASCs have to originate from more mature cells at later stages, probably from partially dedifferentiating Club or AT2 cells, which is also supported by RNA‐seq analysis of BASCs. Of course, we cannot exclude a yet unknown stem cell population, but Trp63+ basal stem cells seem unlikely candidates, since according to a recent cell tracing study, Trp63+ basal stem cells do not seem to contribute directly to alveolar epithelial cells (Yang et al, 2018).
While this study was under review elsewhere, Liu et al (2019) also reported that BASCs are bona fide lung epithelial stem cells using a different experimental strategy, which relies on the combinatorial use of two different recombinases (Cre and Dre) instead of a split‐molecule approach. Similar to our results, Liu et al (2019) demonstrated that BASCs contribute to lung repair and regeneration by generating Club, ciliated, AT1, and AT2 cells. Here, we also analyzed the physiological relevance of BASCs by cell ablation, applied an additional IV‐based lung damage model, and found that IV destroys BASCs. Moreover, we would also like to argue that the split‐tTA approach used in this study offers advantages compared to the combination of Cre and Dre recombinases including the possibility to reversibly manipulate target cells and enablement of long‐term labeling.
Our RNA‐seq analysis demonstrated that BASCs co‐express many genes that were assumed to be characteristic for either AT2 or Club cells indicating that BASCs represent a progenitor cell type, which is locked in a plastic intermediate state, enabling it to differentiate into two different lineages. This conclusion is also supported by the nearly complete absence of genes exclusively expressed in BASCs but not in AT2 or Club cells. Hence, we were surprised that Liu et al (2019) reported a strong enrichment of Plin2 in BASCs. According to our RNA‐seq analysis, Plin2 is not specifically expressed in BASCs. Moreover, cell lineage tracing results obtained with Plin2‐CreERT2 mice recently generated in our laboratory (El Agha et al, 2017; Ntokou et al, 2017) demonstrate a robust contribution of PLIN2+ cells to myofibroblasts but not to Club, ciliated, AT1, and AT2 cells, which seems to exclude Plin2 as a specific marker for BASCs.
Taken together, our findings resolve the long‐standing controversy about the role of BASCs in lung homeostasis and repair and provide the basis for numerous future applications. For example, selective genetic targeting of BASCs will reveal the specific impact of individual regulatory circuits for lung stem cell activation, expansion, and differentiation. Tracing as well as transplantation experiments will provide answers about the proposed involvement of BASCs in lung tumorigenesis (Jackson et al, 2001; Kim et al, 2005; Yanagi et al, 2007; Dovey et al, 2008; Regala et al, 2009). In addition, we envision a wide application of the newly engineered, highly sensitive split‐tTA effector system to follow and manipulate cellular fates of different stem cell subpopulations lacking unique markers.
Materials and Methods
Cloning and mutagenesis
Coding sequences (CDS) or N‐ and C‐terminal fragments of Cre recombinase (Jullien et al, 2003; Xu et al, 2007), improved Cre recombinase (iCre; Shimshek et al, 2002), and tTA transactivator (tTA2‐syn; Baron et al, 1997) were generated by PCR using primers to add a nuclear localization signal (NLS, aa PKKKRKV; Kalderon et al, 1984), FLAG epitope tag (aa DYKDDDDK; Hopp et al, 1988), and appropriate restriction sites. Complementary parts of the split‐DnaE intein of Synechocystis species (Ssp; Wu et al, 1998; Evans et al, 2000) were amplified by RT–PCR from Ssp total RNA (a kind gift from Prof. Dr. Udo Johanningmeier, University of Halle). A NLS, a FLAG tag, linker sequences to recapitulate native intein integration sites (aa KFAEY or CFNKS; Perler, 2002), and appropriate restriction sites were added using corresponding primers.
To generate complementary parts of the split‐DnaE intein of Nostoc punctiforme (Npu; Iwai et al, 2006), protein sequences were reverse translated using the EMBOSS backtranseq online tool (http://www.ebi.ac.uk/Tools/st/emboss_backtranseq/). Sequences were amplified by oligo‐overlap PCR adding NLS, FLAG tag, linker sequences, and appropriate restriction sites. The fluorescent proteins mCherry engineered from Discosoma sp. red fluorescent protein and enhanced variants of GFP originally derived from Aequoria victoria were amplified by PCR adding appropriate restriction sites. The following mutations were introduced to increase CFP and YFP signals and to decrease their putative toxicity: [S30R, Y39N] (Pedelacq et al, 2006); [Q69M] (Griesbeck et al, 2001); [V163A] (Siemering et al, 1996); [A206V] (Zacharias et al, 2002; Pedelacq et al, 2006). Nucleotide sequences encoding the self‐cleaving 2A peptide of Thosea asigna virus (aa GSGEGRGSLLTCGDVEENPGP; Szymczak et al, 2004) were synthesized together with appropriate restriction sites. For in vitro validation, all split‐effector molecules were assembled in the mammalian expression vectors pcDNA5/TO (split‐Cre) or pcDNA3 (split‐tTA; Invitrogen).
To generate the Cre reporter (pc3.1 flip_luci), a Photinus pyralis‐derived luciferase coding sequence was isolated from the pGL3‐Control vector (Promega) and flanked by mutant loxP variants (lox71, lox66; Albert et al, 1995) in a head‐to‐head orientation. The resulting fragment was integrated into antisense orientation downstream of the CMV promoter into the pcDNA3 vector (Invitrogen). The tTA reporter plasmid in which heptamerized tet‐operator sequences are flanked by two inversely orientated CMV minimal promotors controlling the expression of EGFP from Aequoria victoria and luciferase from Photinus pyralis (tetObi‐CMVmin luc/EGFP) was a kind gift from Dr. Kai Schönig (CIMH, Mannheim).
Cell culture and transfection
HEK293T cells (ATCC CRL‐11268) were maintained at 37°C and 10% CO2 in Dulbecco's modified Eagle medium (DMEM high glucose with L‐glutamine, PAA) supplemented with 1× penicillin/streptomycin and 10% fetal calf serum. Transient transfections were performed at 50–60% cellular confluency using Lipofectamine 2000 (Invitrogen) according to the manufacturer's recommendations. To suppress tTA activity, transfected cells were cultured in the presence of the tetracycline‐derivative doxycycline (Sigma) at indicated concentrations.
Western blotting
Samples were homogenized in extraction buffer (100 mM Tris, 10 mM EDTA, 10% SDS, pH8) containing protease inhibitors (Roche), and protein content of cleared lysates was quantified using the DC™ protein assay (Bio‐Rad). For immunoblotting, 20 μg of total protein was separated by SDS/PAGE on 4–12% Bis‐Tris gels (NuPAGE, Invitrogen) and transferred to nitrocellulose membranes, followed by blocking and incubation with mouse anti‐FLAG® M2 (Sigma) or rabbit anti‐GFP (Abcam) antibodies at 4°C overnight. After incubation with peroxidase‐conjugated secondary antibody (Pierce), immunoreactivity was detected by chemiluminescence using the HRP substrate SuperSignal® West Femto (Thermo Scientific) and the VersaDoc Imaging System (Bio‐Rad).
Analysis of DNA recombination by PCR
HEK293T cells were co‐transfected with different (split‐) Cre effectors and a Firefly luciferase‐based reporter plasmid (pc3.1 flip_luci) and harvested 24 h following transfection. Isolated DNA was analyzed by PCR using the primers 5′‐cgcaaatgggcggtaggcgtg‐3′ (CMV for), 5′‐ccttatgcagttgctctcc‐3′ (luc 5′ as), and 5′‐tagaaggcacagtcgagg‐3′ (BGH rev).
Luciferase assay
Quantification of Firefly and Renilla luciferase was performed using the Dual‐Luciferase® Reporter 1000 Assay Kit (Promega) in 96‐well plate format according to the manufacturer's instructions. Briefly, HEK293T cells were co‐transfected with different (split‐) effectors, the Firefly luciferase‐based reporter plasmids (pc3.1 flip_luci or tetObi‐CMVmin luc/EGFP) and a Renilla luciferase‐based control vector for internal normalization (pRL‐TK, Promega). Forty‐eight hours after transfection, cells were lysed in lysis buffer on a rocking platform for 15 min at RT. Samples were cleared of debris by centrifugation, and lysates were transferred into white 96‐well plates (Thermo Scientific). Luciferase activities were quantified by sequential injection of Luciferase Assay Reagent II and Stop & Glow® Reagent to detect developing luminescence in the multilabel reader Mithras LB940 (Berthold Technologies). For data analysis, Firefly luminescence was normalized to Renilla values prior to calculation of fold induction versus reporter and relating to corresponding controls.
Generation of targeting vectors
Subcloning of genomic DNA and integration of genetic modifications by recombineering was performed as previously described (Liu et al, 2003). Briefly, recombination arms (SPC: genomic position 70518317 to 70526710 in ref|NC_000080.6, CCSP: genomic position 9079224 to 9086919 in ref|NC_000085.6) flanking the STOP codon of SPC (Sftpc, Gene ID: 20389) or CCSP (Scgb1a1, Gene ID: 22287) were retrieved from bacterial artificial chromosomes (SPC: BMQ‐189J23, CCSP: BMQ‐435B8, BACPAC Resources Center) by gap repair into the pKO II targeting vector (Bardeesy et al, 2002). The targeting vector carries the negative selection marker diphtheria toxin fragment A. Mini targeting cassettes were generated by standard cloning procedures in the PL451 vector (Liu et al, 2003). Each cassette consists of a 2A‐fluorescent protein‐2A‐split‐effector module upstream of a FRT‐flanked positive selection marker (neomycin acetyltransferase) and is framed by short homology arms directly flanking the STOP codon of SPC (N‐terminal split‐effectors) and CCSP (C‐terminal split‐effectors). The final targeting vectors to create the SPC−2A‐YFP−2A‐split‐effector‐N and the CCSP−2A‐mCherry−2A‐split‐effector‐C alleles were assembled by a second recombineering step. pKO II vectors encoding the extracted SPC and CCSP recombination arms and excised mini targeting cassettes were co‐electroporated into the recombineering competent Escherichia coli strain EL250. Kanamycin‐resistant clones were analyzed by restriction analysis and validated by DNA sequencing.
ES cell targeting and establishment of knock‐in mouse strains
Murine v6.5 embryonic stem cells (C57BL/6 × 129/SV hybrid background) were cultured at 37°C and 10% CO2 in Dulbecco's modified Eagle medium (DMEM high glucose with L‐glutamine and 25 mM HEPES, Gibco) supplemented with 15% fetal calf serum, 1× penicillin/streptomycin, 1× non‐essential amino acids (NEAA, Gibco), ESGRO® leukemia inhibitory factor (104 U/ml, Millipore), and β‐mercaptoethanol on a feeder layer of mitomycin C‐inactivated mouse embryonic fibroblasts plated on 0.2% gelatin‐coated dishes. To achieve homologous recombination, targeting vectors were electroporated into low‐passage v6.5 ES cells after linearization by SacII (20 μg DNA per 107 cells). Following G418 selection (0.4 mg/ml, Invitrogen), individual neomycin‐resistant clones were isolated and analyzed for correct integration by Southern blot. Correctly targeted ES cells were expanded and injected into E3.5 donor blastocysts (C57BL/6 origin), which were subsequently implanted in pseudopregnant recipients (NMRI strain). Resulting chimeric offspring with agouti coat color were crossed to hACTB‐FLPe deleter mice (Rodriguez et al, 2000) to remove the neomycin selection cassette.
Southern blot hybridization and PCR genotyping
Correct integration of targeting constructs was analyzed by Southern blot using gene‐specific restriction enzymes and probes as described previously (Koetsier et al, 1993). Briefly, following restriction digestion (SPC: 5′ HindIII, 3′ AccI, CCSP: 5′ NheI, 3′ Eam1105I) genomic DNA was separated on agarose gels, blotted onto Hybond XL membranes (Amersham) by alkaline transfer, and hybridized with probes that bind outside of the recombination arms. PCR‐amplified 5′ and 3′ probes (500 bp) were labeled with [α‐32P] dCTP using the Rediprime II DNA Labeling System (Amersham) according to the manufacturer's instructions and column‐purified using G50 Quick Spin Columns (Roche).
Genotyping of SPC and CCSP knock‐in strains by PCR was done using the following primers: 5′‐taccagctctcaggtggccct‐3′ (SPC tag wt gt s), 5′‐cctccatcctccgagctcccg‐3′ (SPC tag wt gt as), 5′‐cagctcctcgcccttgctcac‐3′ (SPC tag sfY gt as), 5′‐ggctgcctggtgcaagctgaa‐3′ (SPC tag iCre N gt s), 5′‐tccgccgtgggccactttac‐3′ (SPC tag tTA N gt s), 5′‐tgggggtgtggggtgtttct‐3′ (CCSP tga wt gt s), 5′‐ccagctccaatgctctggctcc‐3′ (CCSP tga wt gt as), 5′‐acatgaactgaggggacagg‐3′ (CCSP tga mCherry gt as), 5′‐gacatggccagggctggtgtg‐3′ (CCSP tga iCre gt s), and 5′‐acatcacctcccacaacgagg‐3′ (CCSP tga mCherry gt s).
For genotyping of tTA‐ and Cre‐responder strains, the following primers were used: 5′‐gttgcagtgcacggcagatacacttgctga‐3′ and 5′‐gccactggtgtgggccataattcaattcgc‐3′ (tetObi lacZ/huGFP; Krestel et al, 2001), 5′‐gaccaggttcgttcactcatgg‐3′ and 5′‐aggctaagtgccttctctacac‐3′ (tetObi luc/Cre; Schonig et al, 2002) or 5′‐taatgaaaacccgctctctg‐3′ and 5′‐ctgacacgatttcctgcac‐3′ (Rosa26stopflox‐DTA; Voehringer et al, 2008). Rosa26stopflox‐lacZ mice were genotyped as described previously (Soriano, 1999).
Animal husbandry, lung injury models, and doxycycline treatment
Animals were housed in individual ventilated caging (IVC) systems with food and water provided ad libitum on a 12‐h‐based light/dark cycle. All animal experiments were performed in accordance with the Guide for the Care and Use of Laboratory Animals published by the US National Institutes of Health (NIH Publication No. 85‐23, revised 1996) and were approved by the local authorities. To induce bronchiolar depletion of Club cells, naphthalene (Sigma) dissolved in Miglyol® 812 (Caelo) was injected intraperitoneally at 200 mg naphthalene per kg body weight. To induce alveolar damage, bleomycin sulfate (Bleomedac®) dissolved in sterile saline solution (0.9%) was applied intratracheally at 2 U bleomycin per kg body weight. For IV infections, mice were instilled intratracheally with 1,000 plaque‐forming units (pfu) of influenza A/H1N1/Puerto Rico/8/34 (PR8; Peteranderl et al, 2016). Animals were sacrificed by isoflurane (cp pharma) or ketamine/xylazine overdose and exsanguination at indicated time points. To suppress tTA activity, animals were subjected to drinking water containing 20 μg/ml doxycycline (Sigma) and 5% sucrose as indicated. Solutions were kept protected from light and exchanged three times per week.
Tissue preparation for histology
Following trans‐cardial perfusion with PBS, lungs were cannulated via the trachea, inflated by instillation of formaldehyde solution (1% in PBS, Sigma), and fixed in situ for 5 min at constant pressure (infusion height 20 cm). After ligation of the trachea, lungs were dissected from the thoracic cavity and incubated for a total of 2 h in fixative on ice. To stop fixation, the ligature was removed and lungs were washed in PBS (> 1 h), followed by incubation in 20% sucrose at 4°C overnight and embedded for cryosectioning.
Immunohistochemistry and β‐galactosidase staining
For immunohistochemical staining, sections were probed with primary goat anti‐CC10 (Santa Cruz Biotechnology) or rabbit anti‐SPC antibody (Chemicon International) overnight at 4°C in a humidified chamber. After incubation with Alexa Fluor‐conjugated secondary antibodies (Invitrogen), slides were counterstained with 4′,6‐diamidino‐2‐phenylindole (DAPI) and subjected to fluorescence microscopy (Imager Z1, Carl Zeiss).
To detect β‐galactosidase activity, sections were rinsed in wash solution (0.1 M sodium phosphate buffer containing 2 mM MgCl2, 0.02% NP‐40, 0.01% Na‐deoxycholate, pH 7.4) and incubated in pre‐warmed, filtered X‐Gal staining solution (wash solution supplemented with 5 mM K3Fe(CN)6, 5 mM K4Fe(CN)6, and 1 mg/ml 5‐bromo‐4‐chloro‐3‐indolyl‐β‐D‐galactoside) overnight in the dark at 37°C. Prior to histological examination by light microscopy, some slides were counterstained with hematoxylin & eosin (H&E) following standard protocols.
To detect lineage‐traced ciliated cells, sections were first stained for β‐galactosidase activity and then probed with primary mouse anti‐acetylated tubulin antibody (Sigma) overnight. To quench endogenous peroxidase activity, sections were incubated in hydrogen peroxide (3% H2O2 in methanol). Following incubation with biotinylated secondary antibody (Vector Laboratories), staining was continued using avidin–biotin–peroxidase complexes (Vectastain Elite ABC Kit, Vector Laboratories) and the peroxidase substrate 3,3′‐diaminobenzidine (Sigma), followed by counterstaining with DAPI.
Whole‐mount staining and tissue clearing
Lungs were isolated as described above. After fixation and washing in PBS, lungs were instilled with pre‐warmed, filtered X‐Gal staining solution and incubated in staining solution overnight at 37°C under constant shaking. The next day, lungs were washed in PBS and post‐fixed (4% formaldehyde, 2 h), followed by clearing in 1% KOH solution containing increasing concentrations of glycerol for several weeks (each time 5–7 days in 1% KOH with 0, 20, 40, 60, 80, or 100% glycerol). Clearing solutions were exchanged at least every other day.
Flow cytometry
Following trans‐cardial perfusion with PBS, lungs cleared from blood were cannulated via the trachea and instilled with 1 ml of pre‐warmed dispase solution (Corning). After ligation of the trachea, lungs were dissected from the thoracic cavity and finely minced using scissors. Two milliliter dispase and DNase (20 U/ml, Roche) were added to the resulting homogenate, and samples were digested at 37°C under constant shaking for 30–45 min. Resulting cell suspensions were mixed by gentle pipetting and sequentially filtered through 100‐ and 40‐μm cell strainers using a plastic pipette and excess DMEM to mechanically push/wash cells through the filter. Following centrifugation (5 min, 300 g), pellets were re‐suspended in 1 ml pre‐cooled FACS buffer (5 mM EDTA, 25 mM HEPES in PBS). Cell suspensions were either directly stained with rat anti‐Ly‐6A/E (Sca‐1) PE‐Cy7 clone D7 or isotype control (eBioscience) in combination with rat anti‐CD31‐APC and rat anti‐ CD45‐APC (eBioscience) or depleted of hematopoietic and endothelial cells using the MACS technology (Miltenyi Biotec) for subsequent cell sorting. For depletion, samples were spun down (10 min, 300 g), re‐suspended in MACS buffer, mixed with anti‐CD45 and anti‐CD31 microbeads, and incubated at 4°C for 15 min. After washing, cells were loaded onto pre‐conditioned MS columns that had been placed in the magnetic field of a MACS separator and the flow‐through containing unlabeled cells was collected.
Fluorescence‐activated cell sorting (FACS) was performed using a BD FACSAria™ III cytometer (BD Biosciences) equipped with a 405/488/561/633 four‐laser system. Data acquisition and analyses were performed using the BD FACSDiva™ software (BD Biosciences).
For subsequent β‐galactosidase staining, sorted cells were plated on 0.2% gelatin‐coated 96‐well plates, fixed (5 min, 0.25% glutaraldehyde), and incubated in pre‐warmed, filtered X‐Gal staining solution at 37°C for several hours up to overnight. Afterward, samples were post‐fixed with 4% formaldehyde and 96‐wells were imaged using the BZ‐9000 microscope (Keyence).
RNA sequencing
Total RNA was isolated from FACS sorted cells using the miRNeasy Micro Kit (Qiagen). For exclusion of genomic DNA contamination, samples were treated by on‐column DNase digestion (DNase‐Free DNase Set, Qiagen). Total RNA and library integrity were verified with LabChip Gx Touch 24 (Perkin Elmer). 100 pg of total RNA was used as input for the SMARTer® Stranded Total RNA‐Seq Kit (Takara Clontech). Sequencing was performed on the NextSeq500 instrument (Illumina) using v2 chemistry, resulting in average of 46M reads per library with 1 × 75 bp single‐end setup. The resulting raw reads were assessed for quality, adapter content, and duplication rates with FastQC (Andrews S. 2010, http://www.bioinformatics.babraham.ac.uk/projects/fastqc). Reaper version 13‐100 was employed to trim reads after a quality drop below a mean of Q20 in a window of 10 nucleotides (Davis et al, 2013). Only reads between 30 and 150 nucleotides were used for further analyses. Trimmed and filtered reads were aligned versus Ensembl mouse genome version mm10 (GRCm38) using STAR 2.4.0a with the parameter “–outFilterMismatchNoverLmax 0.1” to increase the maximum ratio of mismatches to mapped length to 10% (Dobin et al, STAR: ultrafast universal RNA‐seq aligner). The number of reads aligning to genes was counted with featureCounts 1.4.5‐p1 tool from the Subread package (Liao et al, 2014). Only reads mapping at least partially inside exons were admitted and aggregated per gene. Reads overlapping multiple genes or aligning to multiple regions were excluded. The Ensemble annotation was enriched with UniProt data (release 06.06.2014) based on Ensembl gene identifiers (Activities at the Universal Protein Resource (UniProt)). Bioinformatics and differential gene expression analyses were done as described in detail previously (Kuenne et al, 2015).
Statistical analysis
The standard deviation of the mean was calculated from the average of at least three independent experiments/samples. Data comparison was performed using the nonparametric Mann–Whitney test (unpaired, two‐tailed), with a P‐value of < 0.05 being considered significant.
Author contributions
IS and MS conceived the split‐effector molecules and BASC‐specific mouse models. IS designed and conducted all experiments, with assistance from BS and KK. IS performed all data analyses and interpreted data. AIV‐A performed the influenza experiments. SG performed RNA sequencing and bioinformatics analyses. IS and TB wrote the manuscript. AIV‐A, MS, and SH contributed to writing and editing. TB supervised the project.
Conflict of interest
The authors declare that they have no conflict of interest.
Supporting information
Appendix
Expanded View Figures PDF
Source Data for Expanded View
Review Process File
Source Data for Figure 1C and D
Source Data for Figure 2E and F
Source Data for Figure 5B
Source Data for Figure 6C
Source Data for Figure 7B and E
Source Data for Figure 8A, B, D and F
Acknowledgements
We thank Sonja Krüger for helping with ESC targeting, Susanne Kreutzer for blastocyst injections, Marion Wiesnet and Uta Eule for performing lung injury models, Kerstin Richter and Ann Atzberger for helping with FACS, and Robert Voswinkel for discussions during the early stages of the project. This work was supported by the Max‐Planck‐Society, the DFG (Excellence Cluster Cardio‐Pulmonary System (ECCPS), SFB TRR81 TP A02, SFB1021 TP C05, SFB 1213 TP A02, B02 and KFO 309 TP 08, Z1, Z2), the LOEWE Center for Cell and Gene Therapy, and the German Center for Lung Research (DLZ).
The EMBO Journal (2019) 38: e102099
See also: Maria C Basil & Edward E Morrisey (June 2019)
Data availability
The data sets generated and/or analyzed during the current study are available from the corresponding author on reasonable request. RNA‐seq data have been deposited to the GEO database [https://www.ncbi.nlm.nih.gov/geo/query/acc.cgi?acc=GSE129440] and assigned the identifier [GSE129440].
References
- Albert H, Dale EC, Lee E, Ow DW (1995) Site‐specific integration of DNA into wild‐type and mutant lox sites placed in the plant genome. Plant J 7: 649–659 [DOI] [PubMed] [Google Scholar]
- Bardeesy N, Sinha M, Hezel AF, Signoretti S, Hathaway NA, Sharpless NE, Loda M, Carrasco DR, DePinho RA (2002) Loss of the Lkb1 tumour suppressor provokes intestinal polyposis but resistance to transformation. Nature 419: 162–167 [DOI] [PubMed] [Google Scholar]
- Barkauskas CE, Cronce MJ, Rackley CR, Bowie EJ, Keene DR, Stripp BR, Randell SH, Noble PW, Hogan BL (2013) Type 2 alveolar cells are stem cells in adult lung. J Clin Investig 123: 3025–3036 [DOI] [PMC free article] [PubMed] [Google Scholar]
- Baron U, Gossen M, Bujard H (1997) Tetracycline‐controlled transcription in eukaryotes: novel transactivators with graded transactivation potential. Nucleic Acids Res 25: 2723–2729 [DOI] [PMC free article] [PubMed] [Google Scholar]
- Blanpain C, Fuchs E (2014) Stem cell plasticity. Plasticity of epithelial stem cells in tissue regeneration. Science 344: 1242281 [DOI] [PMC free article] [PubMed] [Google Scholar]
- Buckpitt A, Chang AM, Weir A, Van Winkle L, Duan X, Philpot R, Plopper C (1995) Relationship of cytochrome P450 activity to Clara cell cytotoxicity. IV. Metabolism of naphthalene and naphthalene oxide in microdissected airways from mice, rats, and hamsters. Mol Pharmacol 47: 74–81 [PubMed] [Google Scholar]
- Clevers H (2013) The intestinal crypt, a prototype stem cell compartment. Cell 154: 274–284 [DOI] [PubMed] [Google Scholar]
- Davis MP, van Dongen S, Abreu‐Goodger C, Bartonicek N, Enright AJ (2013) Kraken: a set of tools for quality control and analysis of high‐throughput sequence data. Methods 63: 41–49 [DOI] [PMC free article] [PubMed] [Google Scholar]
- Dovey JS, Zacharek SJ, Kim CF, Lees JA (2008) Bmi1 is critical for lung tumorigenesis and bronchioalveolar stem cell expansion. Proc Natl Acad Sci USA 105: 11857–11862 [DOI] [PMC free article] [PubMed] [Google Scholar]
- El Agha E, Moiseenko A, Kheirollahi V, De Langhe S, Crnkovic S, Kwapiszewska G, Szibor M, Kosanovic D, Schwind F, Schermuly RT et al (2017) Two‐way conversion between lipogenic and myogenic fibroblastic phenotypes marks the progression and resolution of lung fibrosis. Cell Stem Cell 20: 571 [DOI] [PubMed] [Google Scholar]
- Evans TC Jr, Martin D, Kolly R, Panne D, Sun L, Ghosh I, Chen L, Benner J, Liu XQ, Xu MQ (2000) Protein trans‐splicing and cyclization by a naturally split intein from the dnaE gene of Synechocystis species PCC6803. J Biol Chem 275: 9091–9094 [DOI] [PubMed] [Google Scholar]
- Gensch N, Borchardt T, Schneider A, Riethmacher D, Braun T (2008) Different autonomous myogenic cell populations revealed by ablation of Myf5‐expressing cells during mouse embryogenesis. Development 135: 1597–1604 [DOI] [PubMed] [Google Scholar]
- Giangreco A, Arwert EN, Rosewell IR, Snyder J, Watt FM, Stripp BR (2009) Stem cells are dispensable for lung homeostasis but restore airways after injury. Proc Natl Acad Sci USA 106: 9286–9291 [DOI] [PMC free article] [PubMed] [Google Scholar]
- Griesbeck O, Baird GS, Campbell RE, Zacharias DA, Tsien RY (2001) Reducing the environmental sensitivity of yellow fluorescent protein. Mechanism and applications. J Biol Chem 276: 29188–29194 [DOI] [PubMed] [Google Scholar]
- Guha A, Deshpande A, Jain A, Sebastiani P, Cardoso WV (2017) Uroplakin 3a(+) cells are a distinctive population of epithelial progenitors that contribute to airway maintenance and post‐injury repair. Cell Rep 19: 246–254 [DOI] [PubMed] [Google Scholar]
- Hermann M, Stillhard P, Wildner H, Seruggia D, Kapp V, Sanchez‐Iranzo H, Mercader N, Montoliu L, Zeilhofer HU, Pelczar P (2014) Binary recombinase systems for high‐resolution conditional mutagenesis. Nucleic Acids Res 42: 3894–3907 [DOI] [PMC free article] [PubMed] [Google Scholar]
- Herold S, Becker C, Ridge KM, Budinger GR (2015) Influenza virus‐induced lung injury: pathogenesis and implications for treatment. Eur Respir J 45: 1463–1478 [DOI] [PubMed] [Google Scholar]
- Hogan BL, Barkauskas CE, Chapman HA, Epstein JA, Jain R, Hsia CC, Niklason L, Calle E, Le A, Randell SH et al (2014) Repair and regeneration of the respiratory system: complexity, plasticity, and mechanisms of lung stem cell function. Cell Stem Cell 15: 123–138 [DOI] [PMC free article] [PubMed] [Google Scholar]
- Hopp TP, Prickett KS, Price VL, Libby RT, March CJ, Cerretti DP, Urdal DL, Conlon PJ (1988) A short polypeptide marker sequence useful for recombinant protein identification and purification. Bio/Technology 6: 1204–1210 [Google Scholar]
- Iwai H, Zuger S, Jin J, Tam PH (2006) Highly efficient protein trans‐splicing by a naturally split DnaE intein from Nostoc punctiforme . FEBS Lett 580: 1853–1858 [DOI] [PubMed] [Google Scholar]
- Jackson EL, Willis N, Mercer K, Bronson RT, Crowley D, Montoya R, Jacks T, Tuveson DA (2001) Analysis of lung tumor initiation and progression using conditional expression of oncogenic K‐ras. Genes Dev 15: 3243–3248 [DOI] [PMC free article] [PubMed] [Google Scholar]
- Jullien N, Sampieri F, Enjalbert A, Herman JP (2003) Regulation of Cre recombinase by ligand‐induced complementation of inactive fragments. Nucleic Acids Res 31: e131 [DOI] [PMC free article] [PubMed] [Google Scholar]
- Kalderon D, Roberts BL, Richardson WD, Smith AE (1984) A short amino acid sequence able to specify nuclear location. Cell 39: 499–509 [DOI] [PubMed] [Google Scholar]
- Kim CF, Jackson EL, Woolfenden AE, Lawrence S, Babar I, Vogel S, Crowley D, Bronson RT, Jacks T (2005) Identification of bronchioalveolar stem cells in normal lung and lung cancer. Cell 121: 823–835 [DOI] [PubMed] [Google Scholar]
- Koetsier PA, Schorr J, Doerfler W (1993) A rapid optimized protocol for downward alkaline Southern blotting of DNA. Biotechniques 15: 260–262 [PubMed] [Google Scholar]
- Krestel HE, Mayford M, Seeburg PH, Sprengel R (2001) A GFP‐equipped bidirectional expression module well suited for monitoring tetracycline‐regulated gene expression in mouse. Nucleic Acids Res 29: E39 [DOI] [PMC free article] [PubMed] [Google Scholar]
- Kuenne C, Guenther S, Looso M, Zhang T, Krueger M, Zhou Y, Braun T, Kim J (2015) RNA‐Seq analysis of isolated satellite cells in Prmt5 deficient mice. Genom Data 5: 122–125 [DOI] [PMC free article] [PubMed] [Google Scholar]
- Lee JH, Bhang DH, Beede A, Huang TL, Stripp BR, Bloch KD, Wagers AJ, Tseng YH, Ryeom S, Kim CF (2014) Lung stem cell differentiation in mice directed by endothelial cells via a BMP4‐NFATc1‐thrombospondin‐1 axis. Cell 156: 440–455 [DOI] [PMC free article] [PubMed] [Google Scholar]
- Li F, He J, Wei J, Cho WC, Liu X (2015) Diversity of epithelial stem cell types in adult lung. Stem Cells Int 2015: 728307 [DOI] [PMC free article] [PubMed] [Google Scholar]
- Liao Y, Smyth GK, Shi W (2014) featureCounts: an efficient general purpose program for assigning sequence reads to genomic features. Bioinformatics 30: 923–930 [DOI] [PubMed] [Google Scholar]
- Liu P, Jenkins NA, Copeland NG (2003) A highly efficient recombineering‐based method for generating conditional knockout mutations. Genome Res 13: 476–484 [DOI] [PMC free article] [PubMed] [Google Scholar]
- Liu Q, Liu K, Cui G, Huang X, Yao S, Guo W, Qin Z, Li Y, Yang R, Pu W et al (2019) Lung regeneration by multipotent stem cells residing at the bronchioalveolar‐duct junction. Nat Genet 51: 728–738 [DOI] [PubMed] [Google Scholar]
- McQualter JL, Brouard N, Williams B, Baird BN, Sims‐Lucas S, Yuen K, Nilsson SK, Simmons PJ, Bertoncello I (2009) Endogenous fibroblastic progenitor cells in the adult mouse lung are highly enriched in the sca‐1 positive cell fraction. Stem Cells 27: 623–633 [DOI] [PubMed] [Google Scholar]
- Ntokou A, Szibor M, Rodriguez‐Castillo JA, Quantius J, Herold S, El Agha E, Bellusci S, Salwig I, Braun T, Voswinckel R et al (2017) A novel mouse Cre‐driver line targeting Perilipin 2‐expressing cells in the neonatal lung. Genesis 55: e23080 [DOI] [PubMed] [Google Scholar]
- Pedelacq JD, Cabantous S, Tran T, Terwilliger TC, Waldo GS (2006) Engineering and characterization of a superfolder green fluorescent protein. Nat Biotechnol 24: 79–88 [DOI] [PubMed] [Google Scholar]
- Perler FB (2002) InBase: the intein database. Nucleic Acids Res 30: 383–384 [DOI] [PMC free article] [PubMed] [Google Scholar]
- Perler FB (2005) Protein splicing mechanisms and applications. IUBMB Life 57: 469–476 [DOI] [PubMed] [Google Scholar]
- Peteranderl C, Morales‐Nebreda L, Selvakumar B, Lecuona E, Vadasz I, Morty RE, Schmoldt C, Bespalowa J, Wolff T, Pleschka S et al (2016) Macrophage‐epithelial paracrine crosstalk inhibits lung edema clearance during influenza infection. J Clin Investig 126: 1566–1580 [DOI] [PMC free article] [PubMed] [Google Scholar]
- Quantius J, Schmoldt C, Vazquez‐Armendariz AI, Becker C, El Agha E, Wilhelm J, Morty RE, Vadasz I, Mayer K, Gattenloehner S et al (2016) Influenza virus infects epithelial stem/progenitor cells of the distal lung: impact on Fgfr2b‐driven epithelial repair. PLoS Pathog 12: e1005544 [DOI] [PMC free article] [PubMed] [Google Scholar]
- Raiser DM, Kim CF (2009) Commentary: Sca‐1 and cells of the lung: a matter of different sorts. Stem Cells 27: 606–611 [DOI] [PMC free article] [PubMed] [Google Scholar]
- Rawlins EL, Okubo T, Xue Y, Brass DM, Auten RL, Hasegawa H, Wang F, Hogan BL (2009) The role of Scgb1a1+ Clara cells in the long‐term maintenance and repair of lung airway, but not alveolar, epithelium. Cell Stem Cell 4: 525–534 [DOI] [PMC free article] [PubMed] [Google Scholar]
- Regala RP, Davis RK, Kunz A, Khoor A, Leitges M, Fields AP (2009) Atypical protein kinase C{iota} is required for bronchioalveolar stem cell expansion and lung tumorigenesis. Can Res 69: 7603–7611 [DOI] [PMC free article] [PubMed] [Google Scholar]
- Reynolds SD, Giangreco A, Power JH, Stripp BR (2000) Neuroepithelial bodies of pulmonary airways serve as a reservoir of progenitor cells capable of epithelial regeneration. Am J Pathol 156: 269–278 [DOI] [PMC free article] [PubMed] [Google Scholar]
- Rodriguez CI, Buchholz F, Galloway J, Sequerra R, Kasper J, Ayala R, Stewart AF, Dymecki SM (2000) High‐efficiency deleter mice show that FLPe is an alternative to Cre‐loxP. Nat Genet 25: 139–140 [DOI] [PubMed] [Google Scholar]
- Schonig K, Schwenk F, Rajewsky K, Bujard H (2002) Stringent doxycycline dependent control of CRE recombinase in vivo . Nucleic Acids Res 30: e134 [DOI] [PMC free article] [PubMed] [Google Scholar]
- Shimshek DR, Kim J, Hubner MR, Spergel DJ, Buchholz F, Casanova E, Stewart AF, Seeburg PH, Sprengel R (2002) Codon‐improved Cre recombinase (iCre) expression in the mouse. Genesis 32: 19–26 [DOI] [PubMed] [Google Scholar]
- Siemering KR, Golbik R, Sever R, Haseloff J (1996) Mutations that suppress the thermosensitivity of green fluorescent protein. Curr Biol 6: 1653–1663 [DOI] [PubMed] [Google Scholar]
- Soriano P (1999) Generalized lacZ expression with the ROSA26 Cre reporter strain. Nat Genet 21: 70–71 [DOI] [PubMed] [Google Scholar]
- Szymczak AL, Workman CJ, Wang Y, Vignali KM, Dilioglou S, Vanin EF, Vignali DA (2004) Correction of multi‐gene deficiency in vivo using a single ‘self‐cleaving’ 2A peptide‐based retroviral vector. Nat Biotechnol 22: 589–594 [DOI] [PubMed] [Google Scholar]
- Tata PR, Mou H, Pardo‐Saganta A, Zhao R, Prabhu M, Law BM, Vinarsky V, Cho JL, Breton S, Sahay A et al (2013) Dedifferentiation of committed epithelial cells into stem cells in vivo . Nature 503: 218–223 [DOI] [PMC free article] [PubMed] [Google Scholar]
- Teisanu RM, Lagasse E, Whitesides JF, Stripp BR (2009) Prospective isolation of bronchiolar stem cells based upon immunophenotypic and autofluorescence characteristics. Stem Cells 27: 612–622 [DOI] [PMC free article] [PubMed] [Google Scholar]
- Voehringer D, Liang HE, Locksley RM (2008) Homeostasis and effector function of lymphopenia‐induced “memory‐like” T cells in constitutively T cell‐depleted mice. J Immunol 180: 4742–4753 [DOI] [PMC free article] [PubMed] [Google Scholar]
- Wang P, Chen T, Sakurai K, Han BX, He Z, Feng G, Wang F (2012) Intersectional Cre driver lines generated using split‐intein mediated split‐Cre reconstitution. Sci Rep 2: 497 [DOI] [PMC free article] [PubMed] [Google Scholar]
- Wu H, Hu Z, Liu XQ (1998) Protein trans‐splicing by a split intein encoded in a split DnaE gene of Synechocystis sp. PCC6803. Proc Natl Acad Sci USA 95: 9226–9231 [DOI] [PMC free article] [PubMed] [Google Scholar]
- Xu Y, Xu G, Liu B, Gu G (2007) Cre reconstitution allows for DNA recombination selectively in dual‐marker‐expressing cells in transgenic mice. Nucleic Acids Res 35: e126 [DOI] [PMC free article] [PubMed] [Google Scholar]
- Yanagi S, Kishimoto H, Kawahara K, Sasaki T, Sasaki M, Nishio M, Yajima N, Hamada K, Horie Y, Kubo H et al (2007) Pten controls lung morphogenesis, bronchioalveolar stem cells, and onset of lung adenocarcinomas in mice. J Clin Investig 117: 2929–2940 [DOI] [PMC free article] [PubMed] [Google Scholar]
- Yang Y, Riccio P, Schotsaert M, Mori M, Lu J, Lee DK, Garcia‐Sastre A, Xu J, Cardoso WV (2018) Spatial‐temporal lineage restrictions of embryonic p63(+) progenitors establish distinct stem cell pools in adult airways. Dev Cell 44: 752–761 e4 [DOI] [PMC free article] [PubMed] [Google Scholar]
- Zacharias DA, Violin JD, Newton AC, Tsien RY (2002) Partitioning of lipid‐modified monomeric GFPs into membrane microdomains of live cells. Science 296: 913–916 [DOI] [PubMed] [Google Scholar]
Associated Data
This section collects any data citations, data availability statements, or supplementary materials included in this article.
Supplementary Materials
Appendix
Expanded View Figures PDF
Source Data for Expanded View
Review Process File
Source Data for Figure 1C and D
Source Data for Figure 2E and F
Source Data for Figure 5B
Source Data for Figure 6C
Source Data for Figure 7B and E
Source Data for Figure 8A, B, D and F
Data Availability Statement
The data sets generated and/or analyzed during the current study are available from the corresponding author on reasonable request. RNA‐seq data have been deposited to the GEO database [https://www.ncbi.nlm.nih.gov/geo/query/acc.cgi?acc=GSE129440] and assigned the identifier [GSE129440].


