Abstract
Acute kidney injury (AKI) corrupts the outcome of about 50% of all critically ill patients. We investigated the possible contribution of the pathology acidemia on the development of AKI. Pigs were exposed to acidemia, acidemia plus hypoxemia or a normal acid-base balance in an experimental setup, which included mechanical ventilation and renal replacement therapy to facilitate biotrauma caused by extracorporeal therapies. Interestingly, extensive histomorphological changes like a tubular loss of cell barriers occurred in the kidneys after just 5 hours exposure to acidemia. The additional exposure to hypoxemia aggravated these findings. These ‘early’ microscopic pathologies opposed intra vitam data of kidney function. They did not mirror cellular or systemic patterns of proinflammatory molecules (like TNF-α or IL 18) nor were they detectable by new, sensitive markers of AKI like Neutrophil gelatinase-associated lipocalin. Instead, the data suggest that the increased renal proton excretion during acidemia could be an ‘early’ first hit in the multifactorial pathogenesis of AKI.
Introduction
Acute kidney injury (AKI) complicates the course of disease of up to 50% of all patients admitted to an intensive care unit [1–3] and contributes to the failure of further organs, especially the lungs [4]. This ‘kidney-lung cross-talk’ seems to take place bidirectional [5–9] and the pathophysiological mechanisms include the release of proinflammatory mediators due to mechanical ventilation, impaired circulation due to positive end-expiratory airway pressure (PEEP), as well as hypercapnia and hypoxia due to acute lung injury (ALI) or lung protective low tidal volume ventilation (LTVV) [10]. The implementation of LTVV and adequate PEEP levels reduce the mortality due to ALI [11, 12], but the combination of lung injury and LTVV can cause respiratory acidosis. In patients, respiratory acidosis is usually tolerated to facilitate lung protective ventilation regimes as long as arterial pH remains above 7.2; this approach is called ‘permissive hypercapnia’. [13, 14].
Elimination of a CO2 through the lungs and elimination of nonvolatile acids through the kidneys are the main regulators of acid-base balance. The kidneys have to increase acid elimination and retention of bicarbonate to protect pH homeostasis if the respiratory control of CO2 is impaired. The renal excretion of hydrogen ions is an active, energy consuming process that depends H+-ATPases, which exist ubiquitously in the nephrons with the highest concentration in intercalated cells [15, 16]. Still, there is little knowledge whether the ‘additional workload’, which is forced on the kidneys in case of impaired CO2-removal through the lungs, contributes to AKI. Furthermore, a reduction of mainly oxygen-dependent ATP-generation–as it can occur in ALI–might aggravate AKI further. Therefore, the hypothesis, that a short period of acidemia as well as a short period of combined acidemia and hypoxemia is an independent risk factor for the development of AKI, was tested. The investigations were performed in an experimental porcine model that enabled ‘standardized’ acidemic/hypoxemic conditions for several hours and a fast correction of the induced pathology within one hour before sacrificing the animals for kidney biopsies. The model accounted for the acute biocompatibility reactions of critically ill patients to ‘common’ organ support therapies like mechanical ventilation and renal replacement therapy.
Materials and methods
Animal wellfare
The animals were held under standard conditions at the Department of Experimental Medicine (facilities are certified by ISO 9001:2000) according the guidelines for laboratory animal care of the European and German Societies of Laboratory Animal Sciences. The study protocol was approved by the Charité veterinarian and the University Animal Wellfare Officer as well as the federal authorities for animal research in Berlin (LaGeSo, Landesamt für Gesundheit und Soziales, approval number G 0380/05), Germany.
General study design and study groups
All experiments were performed in male pigs (German landrace, large white, body weight of 37–42 kg, age of 3–4 months). Pigs were assigned to either of 4 groups with 6 animals per group (n = 6): mixed acidemia with continuous veno-venous hemofiltration (CVVH) or without (control) as well as mixed acidemia plus hypoxemia with CVVH and without (control). A full description of all used materials and methods is included in the supplementary materials. Two further groups with CVVH (n = 6) and without control, n = 5) were exposed to normoxemia and a physiological acid-base balance. Due to ethical aspects and strict local animal protection laws the normoxemic control group with normal acid-base balance is a control group of a former study (control group from Unger et al. [17]). Thus, only qualitative comparisons without statistical tests were performed between the normoxemic control-group with normal acid-base balance and the other study groups.
Anesthesia and instrumentation
General anaesthesia was induced in pigs after premedication, followed by orotracheal intubation and continuous intravenous anaesthesia (S1 Table). Initially, the pigs were normoventilated in with an end-tidal CO2 (etCO2) target of 35–40 mmHg and a saturation of peripheral oxygen (SpO2) above 95%. After intubation the animals were placed in a supine position and cannulated with an arterial line, central venous line, shaldon catheter for CVVH and pulmonary arterial catheter (PAK). The urinary bladder was directly catheterized with a balloon catheter.
Acidemia and hypoxemia protocol and CVVH
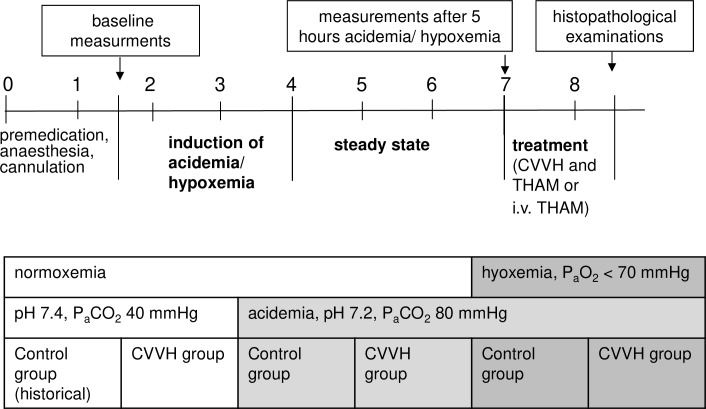
After baseline measurements, acidemia or acidemia/hypoxemia was induced (Fig 1). Mixed acidemia was achieved by infusion of an acid solution (0.2 M lactic acid and 0.2 M hyperchloremic acid diluted in 0.9% saline) and low tidal volume ventilation (6 ml/kg; arterial pH 7.19–7.24; PaCO2 of 80–85 mmHg). Hypoxemia was induced by reduction of FIO2 until PaO2 was below 70 mmHg and SvO2 below 65%. The acid infusion rate had to be adjusted individually in the hypoxemia-groups to reach the target range, since hypoxemia induced a metabolic acidosis itself (S1 Table).
Fig 1. Schematic draw of the experimental protocol and experimental groups.
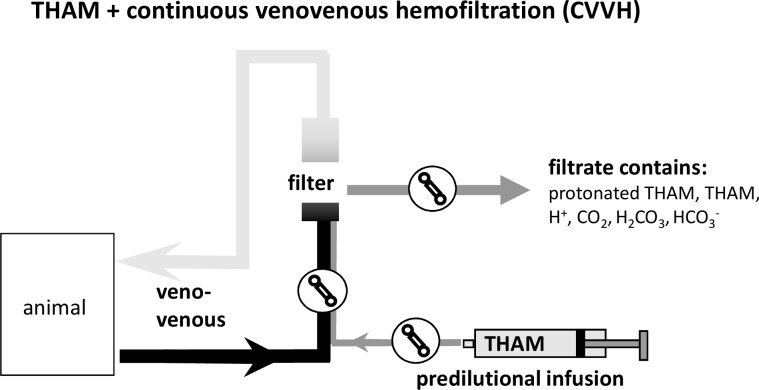
Then, respective pigs were connected to the CVVH which was operated for three hours by recirculation of the filtrate into the venous bubble trap while acidemia or acidemia/hypoxemia was maintained (total exposure to acidemia or acidemia/hypoxemia for five hours.; Fig 1). After three hours of stable acidemia or acidemia/hypoxemia the disorder was corrected with predilutional (before the hemofilter; Fig 2) infusion of 8 mmol/kg/hr of tris-hydroxymethylaminomethane-buffer (THAM) in the CVVH-groups or central-venous infusion of THAM (2mmol/kg/hr) in the control groups. CVVH-groups and control-groups received a different dosage of THAM due to the partial immediate filtration of THAM in the CVVH-animals. Hypoxemia was corrected during this ‘treatment’ period by adjusting FIO2 to 100%. Thus, final histopathology was performed after correction of mixed acidemia and hypoxemia.
Fig 2. THAM-infusion and CVVH.
The drawing illustrates the buffer properties of predilutional (before the hemofilter) infusion of tris-hydroxymethylaminomethane (THAM) in the hemofiltration circuit.
Laboratory analyses and hemodynamic measurements
All samples for blood analyses were drawn from the central venous catheter (or PAK for SvO2) and immediately processed. Blood samples were analysed at the local Institute for Clinical Chemistry, Charité—Universitätsmedizin Berlin using laboratory standard methods except for blood gas samples (ABL700; Radiometer, Copenhagen, Denmark measuring pH, PaO2, PaCO2, electrolytes: Na+, K+, Cl-, ionized Ca2+ and lactate). Serum and urine levels of IL-18, IL-6 and TNF-α were determined by commercially available enzyme linked immunoabsorbant assay (ELISA) (S7 Table).
Cardiac output (CO) was measured with the thermodilution technique and pulmonary artery occlusion pressure (PAOP) as determinant for left ventricular preload was measured at all main time points of the experiment using the PAK. Furthermore, oxygen delivery (DO2) and oxygen consumption (VO2) were calculated using standard equations [18].
Histopathology and score criteria
After the experiment the animals were euthanized with an overdose of fentanyl (0.5 mg), thiopental (1 g) and potassium chloride (60 mval), the kidneys were immediately removed and small corticomedular tissue samples were fixated in a 4 vol% buffered formalin solution. The no-flow time of the kidneys was about ten minutes. The tissue samples were embedded in paraffin; slides of 4 μm thickness were cut and stained with standard hematoxylin and eosin (HE)-staining. Kidney cell damage was analysed with a semiquantitative scoring system by adjusting existing scores [19–21] to our investigation (S2 Table and S3 Table). Tissue samples were evaluated at a 400:1 field enlargement. Multiple visual fields were scored for both kidneys of each animal (median value of 10 visual fields of each kidney equals one score value).
Immunohistochemistry (IHC) staining and ELISA analysis
IHC staining was performed for IL-18, IL-6 and TNF-α with an ABC-staining kit in concordance with the producer’s standard protocol (supplementary materials and S4–S6 Tables).
Statistical analysis
All data were analysed using Sigma Stat 3.1 for Windows. Non-parametrical tests were used, because some data failed normal distribution. Kruskal-Wallis One Way Analysis of Variance on Ranks was used to test for possible differences of the baseline values between groups. The intergroup comparison between two respective study groups (e.g. academic control vs. control group with normal acid base balance) was performed using the Mann-Whitney Rank Sum Test. Post hoc analysis (pairwise comparison) was done using either Tukey’s test for equal sample size or Dunn's method for an unequal sample size. Friedman Repeated Measures Analysis of Variance on Ranks was performed for intra-group comparisons. Statistical significance was assumed at p <0.05.
Results
Mechanical ventilation and systemic mediator release–ventilation alone did not cause a relevant biotrauma
Plasma IL-6 levels increased in tendency in all groups during the experiment, except in the normoventilated control-group, which was exposed to the highest inspiratory pressures (albeit only 22 mmHg, Table 1). A significant increase in plasma IL-6 levels was observed in the acidemic/hypoxemic CVVH-group, which was presumably exposed to the highest biotrauma with respect to compensating low pH values under hypoxemic conditions and simultaneous biocompatibility reactions to the CVVH circuit (Table 1). The same pattern was observed for plasma levels of IL-18 (Table 1).
Table 1. Mediator levels, hemodynamic, renal and blood gas parameters.
| pH 7.4 | pH 7.2 (mixed acidemia) | |||||||||||
|---|---|---|---|---|---|---|---|---|---|---|---|---|
| normoxemia | hypoxemia | |||||||||||
| control | CVVH | control | CVVH | control | CVVH | |||||||
| baseline | a. 5h | baseline | a. 5h | baseline | a. 5h | baseline | a. 5h | baseline | a. 5h | baseline | a. 5h | |
| 1.1 Mechanical ventilation and markers for biotrauma | ||||||||||||
| Peak inspiratory pressure [mbar] | 22 (22/24) | 22 (21/24) | 21 (20/22) ‡ | 21 (20/22) # | 18 (18/27) | 14 (14/19) | 18 (16/20) ‡ | 17 (16/20) # | 20 (20/20) | 20.0 (18/20) | 20 (20/22) | 18 (14/20) |
| pulmonary atelectasis | 40–65% | 10–25% | ||||||||||
| IL-6 plasma [pg/ml] | 11 (8/11) | 11 (10/13) | 0 (0/109) | 93 (0/115) | 107 (0/263) | 274 (143/460) | 0 (0/0) | 93 (0/174) | 0 (0/0) | 77 (0/236) | 0 (0) | 97 (41/172) |
| TNF-α plasma [pg/ml] | 0 (0/15) | 9 (2/16) | 37 (6/45) | 44 (38/45) | 30 (5/78) | 56 (6/71) | 47 (0/68) # | 26 (12/35) § | 69 (55/97) | 14 (0/47) | 117 (102/322)# | 53 (39/77) § |
| IL-18 plasma [pg/ml] | 509 (417/703) | 406 (354/461) | 12 (7/14) | 80 (61/108) # | 23 (7/214) | 354 (134/ 627) |
52 (42/72) | 249 (162/357)# | 273 (211/353) | 373 (319/474) | 244 (222/258) | 465 (300/675) |
| 1.2 Hemodynamic parameters and oxygenation | ||||||||||||
| PaO2 [mbar] | 170 (160/191) | 163 (122/211) | 430 (394/472) | 422 (387/456) | 397 (257/429) | 219(135/ 338)# |
457 (436/478) | 350 (287/399)§ | 412 (378/440) | 79 (68/88) #,$ | 490 (467/496) | 62 (48/64) §,$ |
| SvO2 [%] | 78 (68/84) | 56 (55/69) | 77 (75/80) | 72 (66/74) | 82 (84/89) | 67 (53/72) | 78 (78/80) | 66 (64/68) † | 79 (78/80) | 60 (38/61) | 80 (76/82) | 28 (21/40) † |
| MAP [mmHg] | 70 (65/81) | 115 (108/115) | 110 (99/115) | 90 (72/97) | 103 (98/103) | 72 (67/77) | 97 (93/104) | 66 (64/68) § | 88 (84/98) | 57 (46/60) | 117 (104/121) | 49 (47/54) § |
| CVP [mmHg] | 6 (4/8) | 6 (3/7) | 8 (7/9) | 8 (7/9) | 9 (7/11) | 12 (10/14) ‡ | 5 (2/7) | 6 (3/9) ‡ | 6 (3/10) | 7 (5/13) | 9 (7/11) | 11 (9/12) |
| PAOP [mmHg] | 6 (6/10) | 8 (6/11) | 10 (9/12) | 10 (9/12) | 9 (7/10) | 11 (10/14) | 8 (6/10) | 10 (8/11) | 10 (7/10) | 13 (12/17) | 10 (9/12) | 10 (9/12) |
| CO [l/min] | 5.3 (5.2/5.5) | 4.1 (3.6/4.1) | 4.2 (3.9/4.6) | 3.4 (3.0/4.0) | 4.7 (4.4/4.8) | 3.5 (2.9/4.1) | 3.9 (3.5/4.5) | 3.5 (3.3/3.9) |
4.0 (3.9/4.1) | 4.0 (3.4/4.8) | 3.7 (3.3/4.1) | 3.9 (3.8/4.2) |
| SVR [dyn*sec*cm-5] | 875 (838/1430) | 2207 (1711/ 2625) |
1880 (1724/ 2139) |
1626 (1525/ 1688) |
1589 (1361/ 1816) |
1350 (1205/ 1652) ‡ |
1912 (1745/ 2254) |
1282 (1217/ 1294) # |
1543 (1466/ 1648) |
892 (819/ 1059) ‡ |
2252 (2142/ 2293) |
732 (592/ 879) # |
| DO2 [ml/min] | 632 (586/717) | 452 (440/500) | 550 (467/613) | 370 (341/432) | 593 (499/655) | 396 (339/505) | 525 (483/555) | 422(407/ 456)† |
553 (500/620) | 395 (341/515) | 454 (401/501) | 332 (263/364)† |
| VO2 [ml/min] | 161 (89/169) | 190 (146/216) | 164 (154/173) | 141 (118/164) | 126 (114/141) | 164 (156/212) | 140 (112/152) | 167 (163/169) | 150 (132/172) | 179 (175/185) | 118 (114/125) | 180 (178/186) |
| 1.3 Acid-base homeostasis and kidney function | ||||||||||||
| pH arterial blood | 7.47 (7.46/7.53) | 7.51 (7.5/7.53) | 7.48 (7.47/7.5) | 7.44 (7.42/7.47) | 7.44 (7.43/7.45) | 7.25 (7.23/ 7.28) † § |
7.45 (7.43/7.46) | 7.22 (7.21/ 7.23) † |
7.49 (7.47/7.5) | 7.22 (7.21/7.25) | 7.46 (7.45/ 7.48) |
7.23 (7.23/7.24) |
| PaCO2 [mbar] | 40 (39/42) | 39 (38/39) | 44 (44/45) | 43 (42/46) # | 46 (45/48) | 80 (73/86) | 47 (44/48) | 84 (82/87) # | 43 (41/44) | 77 (73/78) § | 45 (43/46) | 92 (88/95) § |
| diuresis [ml/kg/h] | 1.2 (0.3/3.4) | 1.5 (1.4/1.7) | 7.2 (6.4/18.0) | 7.2 (5.6/13.6) | 5.2 (2.6/7.8) | 7.0 (4.6/10.4) | 7.2 (5.2/12.4) | 9.8 (8.4/17.0) § | 10.0 (5.8/12.6) | 3.8 (1.4/5.2) | 6.6 (5.2/8.4) | 3.4 (1.0/5.8) § |
| creatinine clearance [ml/min] | 32.7 (20.9/ 118.8) |
93.9 (80.1/ 115.8) |
42.5 (18.3/ 114.1) |
70.9 (64.3/ 110.1) |
52.3 (47.1/81.5) | 61.4 (48.1/ 83.9) |
52.2 (27.3/ 121.2) |
48.9 (7.5/66.1)$ | 64.7 (57.1/ 172.1) |
80.1 (58.4/90.7) $ | 45.8 (32.0/ 85.9) |
27.8 (15.3/76.1) |
| pH urine | 7.83 | 7.88 | 7.4 (7.1/7.7) $ ß |
7.25 (7.2/7.4) +Δ | 6.95 (6.0/7.1) $ | 6.2 (6.0/6.5) Δ | 6.75 (5.9/7.1) ß | 6.2 (5.7/6.8) + | 6.85 (6.1/7.3) | 6.15 (6.0/6.2) | 6.75 (6.4/7.0) | 6.65 (6.5/6.7) |
| IL-18 urine [pg/ml] | 177 (148/268) | 239 (214/311) | 136 (111/178) | 96 (85/102) | 109 (98/123) | 109 (80/134) | 119 (105/134)§ | 81 (69/115) | 119 (111/134)$ | 115 (104/117) | 65 (62/94) § $ | 71 (61/76) |
| NGAL urine [RU*100/ml/kg/h] | 1418.8 (326.4/ 1745.6) |
282.4 (194.0/ 422.0) |
12.0 (4.6/ 20.0) |
20.0 (4.2/29.2) | 40.6 (27.6/ 105.4) § |
34.0 (18.2/ 38.2) |
12.0 (10.4/ 12.6) § |
18.6 (10.6/ 20.2) $ |
18.6 (6.2/31.8) | 98.4 (72.2/ 134.8) |
27.8 (10.0/ 45.4) |
77.6 (44.6/ 228.8) $ |
| Serum creatinine [mg/dl] | 1.2 (1.0/1.2) | 1.2 (1.0/1.3) | 1.0 (0.9/1.2) | 1.2 (1.0/1.3) | 1.0 (1.0/1.0) | 1.2 (1.0/1.4) | 1.1 (1.1/1.2) | 1.1 (1.1/1.4) | 1.2 (1.1/1.3) | 1.4 (1.4/1.6) | 1.1 (1.0/1.2) | 1.5 (1.4/1.8) |
Data are presented as median with 25th and 75th percentiles at baseline (after complete instrumentation of the animals) and after five hours exposure respective to the experimental protocol. Pairs of symbols mark (e.g. ††) significant difference between two groups, grey background marks significant difference between baseline value and value after 5 hours exposure (p < 0.05 for all). CVVH means continuous veno-venous hemofiltration, control means control groups (without CVVH) as described in the article. The groups are further divided into groups with ‘normal’ acid-base balance (pH 7.4), groups exposed to acidemia (pH 7.2) and additional hypoxemia (as described in the article).
Mechanical ventilation, hemodynamics and kidney perfusion–moderate positive continuous airway pressure alone did not compromise diuresis
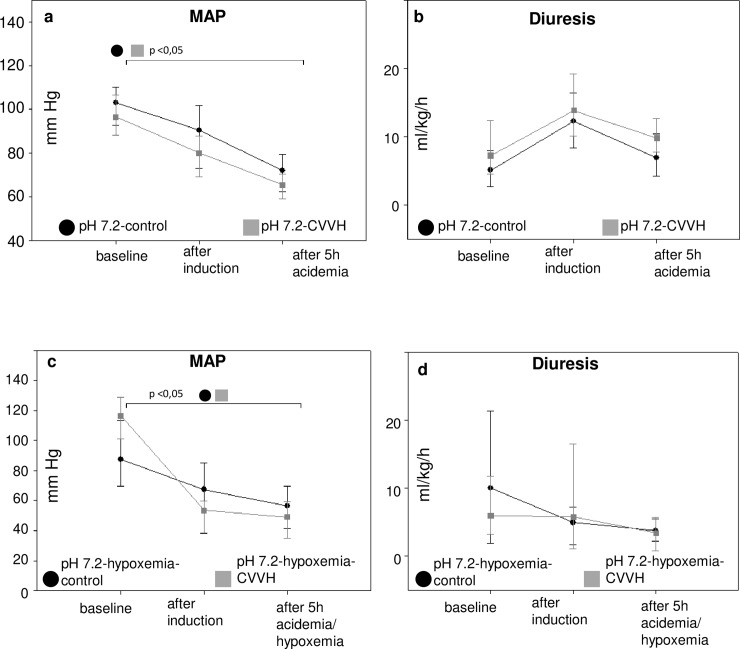
Mean arterial pressure (MAP) values decreased during the induction of acidemia, but remained above 65 mmHg. A moderate PEEP of 5 mmHg did most likely not result in a compromised kidney perfusion, since diuresis remained above clinically accepted cut offs for oliguria (0.5 ml/kg/hr) (Table 1, Fig 3). Additionally, creatinine clearance did not decrease significantly in any group and the use of advanced hemodynamic monitoring did not indicate a compromised systemic perfusion. As a result, it is unlikely that histomorphological kidney injury was caused by a compromised renal perfusion.
Fig 3. Mean arterial pressure and diuresis.
Mean arterial pressures (MAP) and diuresis are depicted as line and scatter plots (median/25th/75th percentile) for animals exposed to acidemia (3.a, b) and acidemia with additional hypoxemia (3.c,d). The abbreviations pH 7.4-control. etc. mark the experimental groups as described in the article. Bracelets mark p < 0.0.5.
Histopathology–short exposure to acidemia leads to cellular damage
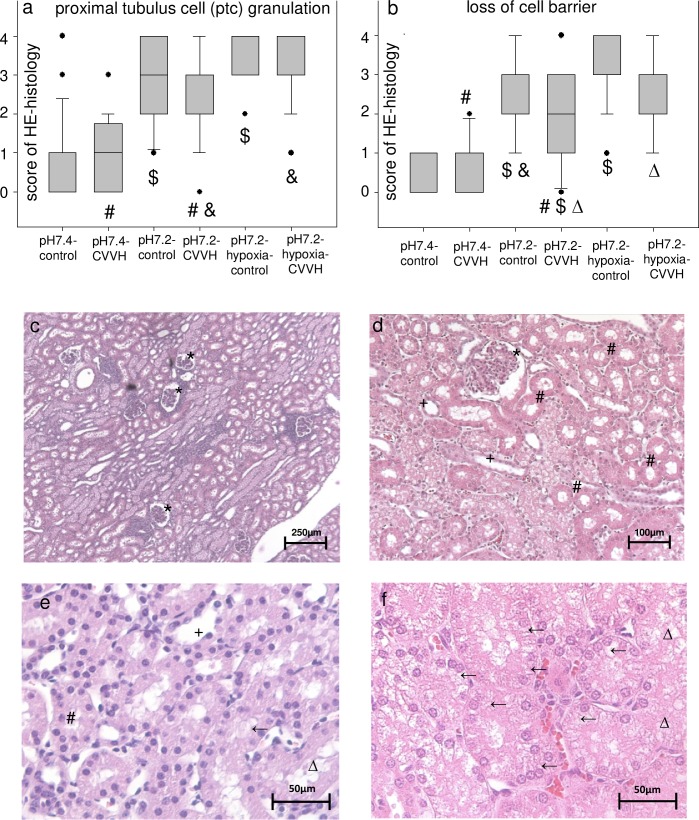
Slices of kidneys tissue samples were scored using a semiquantitative score in HE staining (Fig 4, S3 Fig; score details are described in the supplemental methods). Scoring for histopathological criteria of kidney cell damage like granulation of proximal tubular cells (ptc granulation) resulted in higher score values in the groups exposed to acidemia with highest values in the acidemic/hypoxemic groups (Fig 4), despite the short period of exposure (five hours with induction) and correction of acidemia/hypoxemia before the end of the experiments. Notably, no significant differences were detected between the respective CVVH and control-groups, which suggests that the additional extracorporeal organ support system was not a trigger for kidney cell damage. Thus, the data indicate that even a short exposure to acidemia and acidemia/hypoxemia can result in kidney cell damage.
Fig 4. Short time acidemia results in kidney cell damage.
Boxplots (median/25th/75th percentile/ outliers) (a, b) present the semiquantitative scores of the respective criteria for kidney cell damage. Y-axis: score from 0 (no damage visible) to 4 (damage in > 50% of the visual field) for the respective criteria. X-axis: study groups. Pairs of symbols mark p < 0.05. Photos (c, d, e, f) display typical kidney slices stained in hematoxylin eosin (HE, c. 50:1 enlargement, d. 200:1 enlargement, e, f at 400:1 enlargement). Graph e displays a slice with little kidney cell damage, whereas f is an exemplary photo of high kidney cell damage. * mark renal corpuscles, # mark proximal tubules, + mark distal tubules, ← mark proximal tubulus cell granulation, Δ mark loss of cell barrier.
Immunohistochemistry and plasma mediator concentrations–kidney cell damage was not caused by inflammation
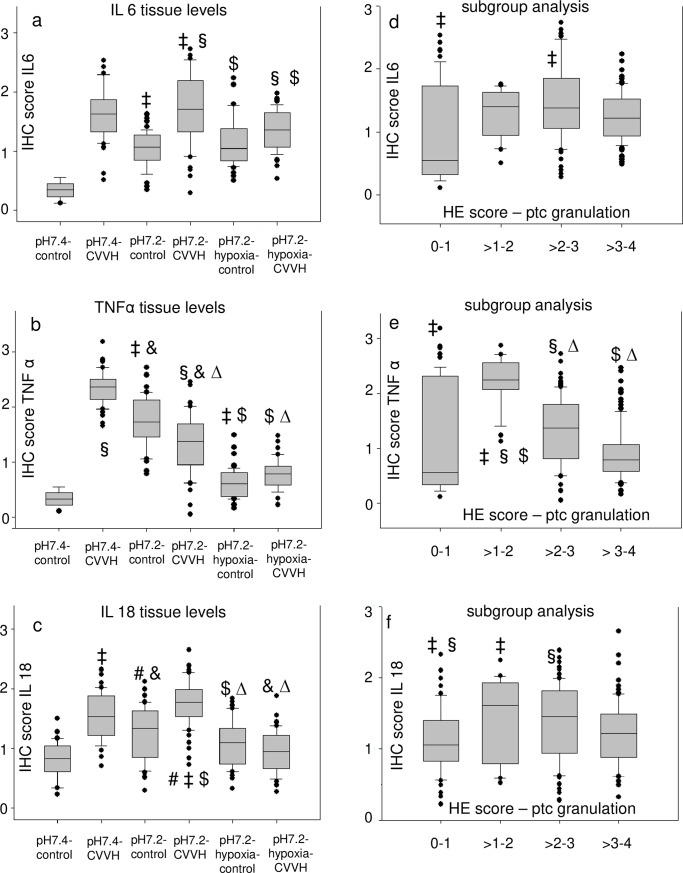
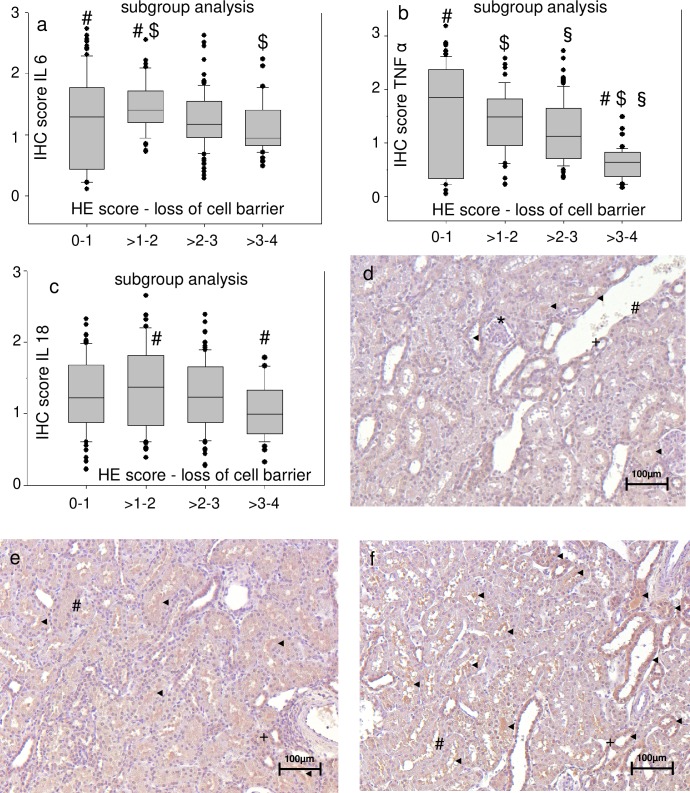
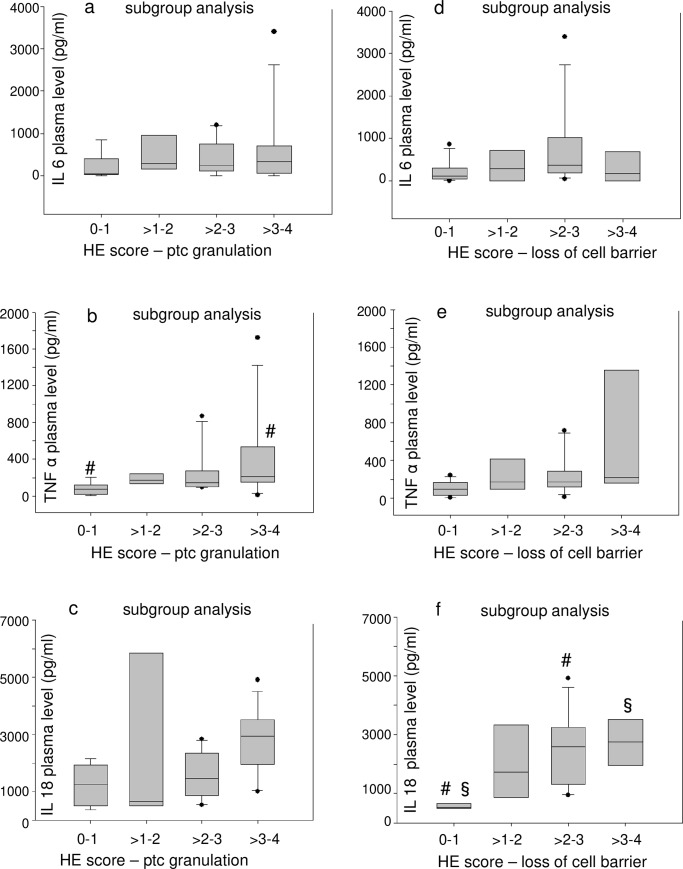
Immunohistochemical (IHC) staining of kidney slices for IL-18, IL-6 and TNF-α (S3 Fig) was inconsistent compared to HE-staining. The groups with high HE-scores for cell damage–which were the groups exposed to acidemia/hypoxemia–did not have the highest scores for tissue levels of proinflammatory mediators (Fig 5). Pooled groups, which included all animals with the respective semiquantative HE-score within a range of two regardless of the experimental group (e.g. all animals with a score of 0–1 were pooled, all animals with a score >1–2, etc.), were formed for subgroup analysis. Interestingly, a pooling of animals with high HE-scores did not result in high tissue scores of proinflammatory mediators (Fig 5 and Fig 6). Consequently, the same test was performed for subgroups of HE scores for cell damage and plasma levels of proinflammatory mediators (Fig 7). Interestingly, pooled subgroups for high HE scores did have higher IL-18 (Fig 7) and TNF-α (Fig 7) plasma levels than groups with low HE scores, but this observation was not made for any other subgroup (Fig 7). In summary, the data does not indicate that kidney cell damage was triggered by local or systemic inflammation.
Fig 5. Kidney cell damage is not accompanied by high tissue levels of proinflammatory molecules.
Boxplots present (median/25th/75th percentile/ outliers) the semiquantitative scores for immunohistochemical staining (IHC) (a, b, c) of kidney slices scored at 400:1 enlargement. X-axis: study groups. Pairs of symbols mark p < 0.05. The respective subgroup analysis (d, e, f) compares pooled subgroups for the semiquantative score for proximal tubular cell granulation (ptc) in hematoxylin eosin (HE) stained slices (0—no damage visible, 4 damage in > 50% of the visual field) with the highest/lowest scores for the respective immunohistochemical markers in immunohistochemical (IHC) stained slices.
Fig 6. Kidney cell damage is not accompanied by high tissue levels of proinflammatory molecules independently of the score criteria that is investigated.
Subgroup analysis (a, b, c) compares pooled subgroups for the semiquantitative score for loss of cell barrier in hematoxylin eosin (HE) stained slices with the highest/lowest scores for the respective immunohistochemical markers in immunohistochemical (IHC) stained slices at 400:1 enlargement. The values are presented as boxplots (median/25th/75th percentile/ outliers). Pairs of symbols mark p < 0.05. Photos (d, e, f) display kidney slices stained for IL 18 (all 200:1 enlargement) with d. little staining for IL 18 (IHC score 1), e. medium staining for IL 18 (IHC score 2), extensive staining for IL 18 (IHC score 3–4). * mark renal corpuscles, # mark proximal tubules, + mark distal tubules, ◄ mark staining for IL 18 (strained brown).
Fig 7. Kidney cell damage is not accompanied by high plasma levels of proinflammatory molecules.
Subgroup analysis (a, b, c) compares pooled subgroups for the semiquantative score for proximal tubular cell granulation (ptc) in hematoxylin eosin (HE) stained slices at 400:1 enlargement with the plasma levels of proinflammatory mediators. A further subgroup analysis was performed using loss of cell barrier as criterion of cell damage (d, e, f). The values are presented as boxplots (median/25th/75th percentile/ outliers). Pairs of symbols mark p < 0.05.
Diuresis, acid-base homeostasis and kidney cell damage–kidney cell damage might have been triggered by acidemia
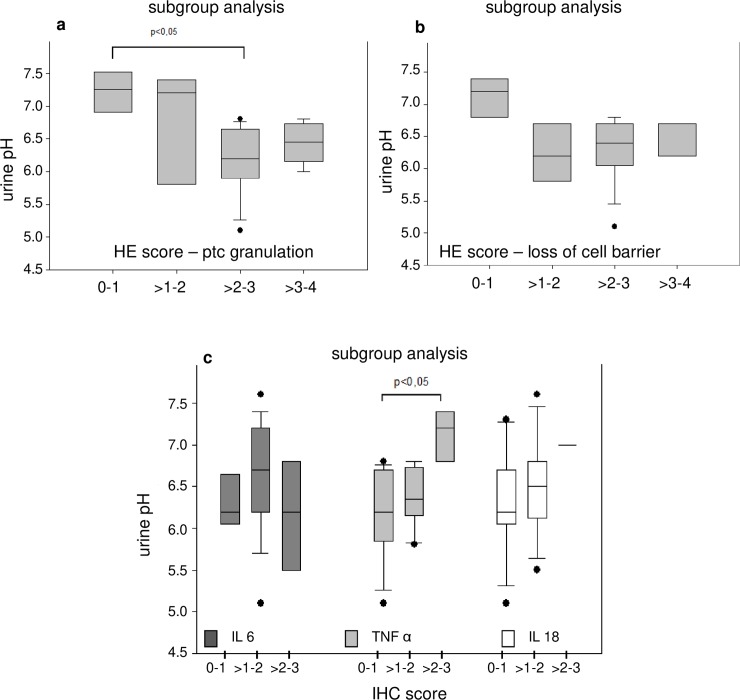
High diuresis rates were observed in all animals during acidemia/hypoxemia (3 ml/kg/hr) (Table 1). Subgroup analysis of pooled groups with high vs. low HE-scores for kidney cell damage and urine pH indicate that high HE-scores for cell damage were in tendency associated low urine pH values (not significant, Fig 8). These, findings were not matched by an analysis of pooled groups for high vs. low IHC-scores and urine pH (Fig 8). Again, the results do not support the hypothesis of an inflammatory response. Instead, the acid load was associated with early cellular kidney damage.
Fig 8. Histopathology as well as IHC scoring and urine pH.
The respective subgroup analysis (a, b) compare pooled subgroups for the semiquantative score for proximal tubular cell (PTC) granulation (a) and loss of cell barrier (b) in hematoxylin eosin (HE) stained slices at 400:1 enlargement with urine pH values. Pooled subgroups for immunohistochemical (IHC) stained slices and urin pH are depicted in c. The values are presented as boxplots (median/25th/75th percentile/ outliers). Bracelets mark p < 0.05.
Kidney cell damage was not detected by novel biomarkers of AKI
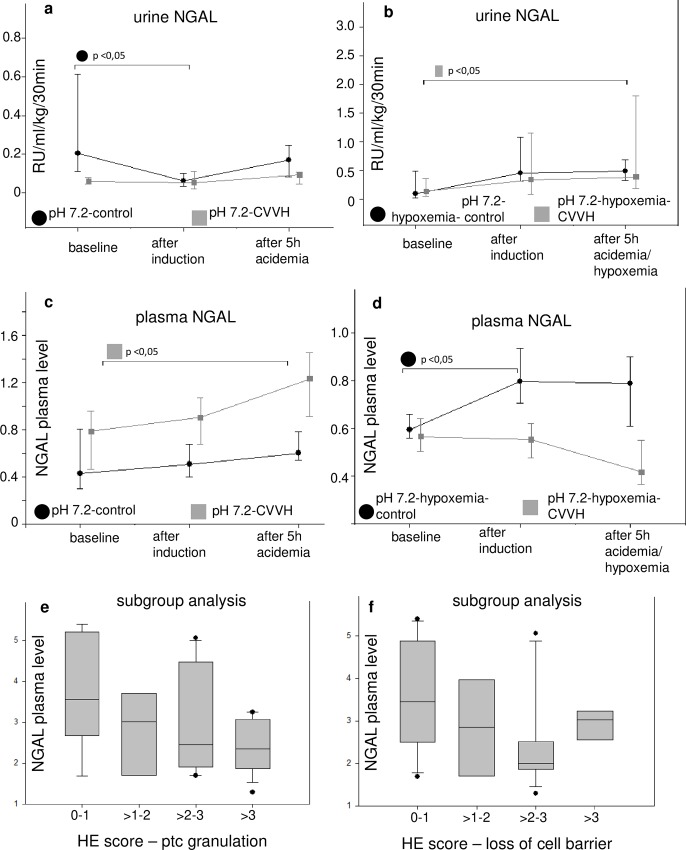
Although, urine neutrophil gelatin-associated lipocalin (NGAL) concentrations increased in the acidemic/hypoxemic CVVH-group, an irregular pattern was observed with respect to all groups as well as urine and serum NGAL concentrations after exposure to acidemia for five hours (Table 1, Fig 9). Accordingly, there was no significant increase in urine IL-18 concentrations. Subgroup analysis of pooled groups with high vs. low HE scores for kidney cell damage and serum NGAL concentrations did not indicate that a high degree of cell damage was mirrored by high NGAL concentrations (Fig 9).
Fig 9. Histopathology, urine NGAL and plasma NGAL.
The serum or urine concentrations of neutrophil gelatin-associated lipocalin (NGAL) are depicted in a-d. The values are presented as scatter plots (median/25th/75th percentile). The respective subgroup analysis (e, f) compare pooled subgroups for the semiquantative score for proximal tubular cell (PTC) granulation (a) and loss of cell barrier (b) in hematoxylin eosin (HE) stained slices at 400:1 enlargement with serum NGAL concentrations. The abbreviations pH 7.4-control. etc. mark the experimental groups as described in the article. Bracelets mark p < 0.0.5.
Discussions
Clinically, urinary output and laboratory measurements like serum creatinine are used to evaluate kidney function. Even immunological mediator levels, advanced hemodynamic monitoring and medical imaging can only give an indirect reflection of kidney perfusion, morphology and function. The hardest criterion of kidney cell damage is a biopsy and histopathological examination, which is almost never achievable in the critically ill patient. Thus, experimental investigations are necessary to identify conditions that result in cell damage and in turn AKI. To our knowledge, this was the first time that the impact of mixed acidemia on kidney function and histomorphology was investigated in large animals under clinical conditions.
Unexpectedly, we found a severe impact of acidemia itself on the kidneys’ morphological integrity after only three hours of exposure to arterial pH values of 7.2 (about five hours with induction of the pathology). The cell damages were observed despite normal to high diuresis rates and without a relevant increase of novel biomarkers of AKI. A causal relationship between kidney damage and ventilation is unlikely, since the observed kidney cell damage was less in the groups which were exposed to normal acid-base balance and simultaneously the highest inspiratory pressures and tidal volumes as compared to the acidemic groups with low tidal volume ventilation. Furthermore, Tsuno et al. ventilated piglets with a tidal volume of 13 ml/kg body weight for 48 hours and did not observe histopathological changes compared to lungs of healthy piglets [22].
An impact related to a reduced kidney perfusion was mainly excluded by using advanced hemodynamic monitoring. This was crucial since an impairment of systemic circulation can result in a reduction of renal blood flow (RBF), a decreased glomerular filtration rate (GFR) and a decreased renal clearance rates–regardless of the underlying pathomechanism. Direct measurements of RBF are hard to perform in critical ill patients and as a severe limitation we were not able to conduct direct measurements of RBF in this complex experimental setting. Nevertheless, it is known that even short warm ischemia due to cardiac arrest does not result in AKI [23] and experimentally reduced kidney perfusion of 80% for two hours did not result in AKI in sheep [24], whereas AKI occurred in experimental hyperdynamic sepsis in sheep despite an increased RBF [25, 26]. In the experiments presented here MAP was kept above 65 mmHg in the acidemic groups. Lower MAP values were accepted in the hypoxemic groups, which decompensated after an initial peak in MAP during the induction of hypoxemia. Nevertheless, cardiac output (CO) was always greater than 3 l/min at all times and the hemodynamic situation apparently enabled diuresis rates of at least 3 ml/kg/hr in all groups throughout the experiment.
An impact related to local or systemic inflammation was not likely since we did not use an animal model based on inflammation like a sepsis model. Furthermore, we did not find a distinct pattern of proinflammatory mediators–neither local nor systemic–which would support the hypothesis of an inflammatory response of the kidneys to an insult.
It is well known that the exposure of blood to an extracorporeal circuit triggers cascades of proinflammatory mediators [27]. On the other hand, operating CVVH in a high volume filtration mode can result in a partial hemofiltration of these molecules and additional adsorption of mediators always takes place [28–30]. However, we reinfused the filtrate into the venous bubble trap for the time of acidemia/hypoxemia which effectively prevented at least the hemofiltration of proinflammatory mediators during that time. Despite reinfusion of the filtrate, the acidemic as well as the acidemic/hypoxemic-control groups (no CVVH) had a higher increase of proinflammatory mediators in tendency than the CVVH-group with normal acid-base balance. This supports the hypothesis that the biotrauma caused by acidemia and the additional hypoxemia, respectively, was more serious than the exposure to the extracoporal circuit.
Nevertheless, it is difficult to interpret the relevance of proinflammatory mediators as long as organ function is not compromised. Novel biomarkers of AKI, such as IL-18 and NGAL, may detect AKI within a few hours of the incipient renal pathology, even before ‘traditionally’ used markers like serum creatinine or diuresis rate detect AKI [31, 32]. Interestingly, early histological cell damage was not indicated by a relevant increase in urine or plasma NGAL in the experiments presented here, as it can be observed e.g. in septic patients with AKI who can present with concentrations fourfold higher than non-septic patients [33].
Regardless of these findings, significantly more kidney cell damage was observed in the acidemic groups compared to groups without acidemia. The additional hypoxemia worsened the histopathological scores even further. It is well known that kidneys increase the excretion of acid equivalents during respiratory as well as metabolic acidosis. The kidneys’ response is ‘slow’ and three to five days pass before a new steady state is reached [34, 35]. Nevertheless, kidneys possess fast mechanisms to regulate hydrogen ion excretion. Especially active hydrogen ion-pumps (H+-ATPase) are the focus of recent research concerning acid-base regulation [36, 37]. Schwartz and Al-Awqati observed already in 1984 that H+-pump rich intracellular vesicles fuse with the luminal plasma membrane when the renal tubules of rabbits were exposed to an increased partial pressure of CO2 for just 15 minutes. Their work elegantly demonstrated that the major effect happened within the first minute of exposure and was accompanied by an increase in H+ secretion [38]. These processes are energy consuming–as all active ion-pumps [15].
Thus, the data presented here support the following hypothesis:
Kidneys are exposed to an energy consuming compensatory workload to regulate acid base-balance in case of acidemia, when regulation by the respiratory system is impaired
Cell damage will appear at an early stage–within hours–before clinically used markers detect AKI
This etiology may work as a ‘first hit’-insult potentiating further insults from ongoing biotrauma due to ventilation, impaired perfusion and inflammation in critically ill patients.
This hypothesis is supported by clinical data from a retrospective pooled analysis of three ARDS trials by Nin et al. Hypercapnia, defined as a maximum PaCO2 above 50 mmHg within the first 48 hours of mechanical ventilation, was associated with an increased ICU-mortality as well as a higher incidence of AKI in their work [39].
Furthermore, Jaber et al. demonstrated, that critically ill patients with a preexisting chronic kidney disease (Acute Kidney Injury Network score of 2 to 3 at study enrollment) profit from buffering a metabolic acidemia (defined as pH values below 7.2) with sodium bicarbonate with respect to days alive and days without RRT in a recent RCT [40].
This study has several limitations. In order to assess the possible impact of acidemia/hypoxemia on kidney function, the experiments were performed in healthy pigs without preexisting diseases and the experimental time was limited to seven hours. Contrary to the clinical situation, the experimental setting supported the harvest of tissue samples. However, tissue samples just reveal morphological and immunohistochemical changes at the time point of sampling. Furthermore, in our experiments kidney slices were scored for reversible markers of cell damage like cell granulation as well as irreversible changes like the loss of cell barriers. It remains unclear whether areas of the kidneys with potentially reversible changes would have developed irreversible changes over time. Some of the potentially reversible changes may present a physiological response to the energy consuming insult rather than a pathophysiological finding. Nevertheless, some cell changes like the loss of cell barrier are a permanent destruction of the tubules’ anatomic units.
At present, it is speculative to what extent the histological findings correlate with a clinically relevant compromised kidney function. Existing data suggests that healthy kidneys will sustain a considered amount of damage before kidney function is compromised at a clinical relevant level. Further research is needed to evaluate the role of acidemia as ‘first insult’ or contribution factor to AKI in a multifactorial setting.
Conclusions
An exposure to a mixed acidemia of 5 hours resulted in histomorphological changes like a tubular loss of cell barriers in the kidneys of anesthetized healthy pigs. An exposure to an additional hypoxemia aggravated these histomorphological changes. The experimental model did not result in a systemic or local inflammation which could be correlated to histomorphology or kidney function. Kidney function as well as systemic perfusion were not compromised in this experimental setup. Instead, the additional energy-depending secretion of protons through the kidneys may have caused the histomorphological changes. Further investigations are needed about the exact pathomechanism and its possible relevance in critically ill patients.
Supporting information
(DOCX)
The kidney slices were obtained in experiments investigating possible biocompatibiltiy reactions between continuous veno-venous hemofiltration (CVVH) and infusion of different colloids1; results and pictures concerning transmission electron microscopy not published). For this, anesthized pigs were exposed to CVVH and infusion of either 4% gelatine 30 kDa (Fig 6A and 6B) or 10% hydroxyethyl starch 200 kDa/0.5 (Fig c), but without exposure to acidemia. Ultra-thin slices (40–50 nm) were photographed at 1600:1 enlargement (Fig 6A and 6C) and 3150:1 enlargement (Fig b). BM marks the basal membrane, M marks a mitochondria, N marks the cell nucleus, ICV marks an intracellular vacuole. Note, multiple vacuoles of about 2,5 μm can be found in the tubular cells of the animal infused with either gelatine (6a, b) or starch (6c). Hence, relevant vacuolization due to starch infusion alone is not likely when compared to gelatine infusion.
(TIF)
Kidney slices were stained in hematoxylin eosin (HE) and photographed at 400:1 enlargement. A shows a slice with little cell damage, arrows indicate proximal tubular cell vacuolization. B and C are exemplary for high tubular cell damage with nucleus pycnosis (B) and cell barrier loss (C) highlighted with arrows. D shows normal morphology in comparison. * renal corpuscles, # proximal tubules, + distal tubules.
(TIF)
- A) Intensity of the signal score 1.
- B) Intensity of the signal score 2.
- C) Intensity of the signal score 3.
- D) Intensity of the signal score 4.
- E) Intensity of the signal score 0.
(TIF)
(DOCX)
Scoring criteria for analyzing kidney cell damage in haematoxylin-eosin (HE) staining.
(DOCX)
The table summarizes which change in percent of a visual field for a certain score criteria equals which score value.
(DOCX)
(DOCX)
The table summarizes the renal structures which were analyzed for immunohistochemical (IHC) staining.
(DOCX)
The table provides details what qualitative IHC staining intensity equals which score value.
(DOCX)
(DOCX)
Acknowledgments
We thank Prof. Dr. Georg Duda for providing the necessary laboratory facilities for the histological preparation and examination of the tissue slices. We thank our doctoral students Birgit Grossmann and Tobias Keckel for their engaged work. We thank Dr. Philip A. Pickerodt for his support of our working group while preparing this manuscript.
Data Availability
All relevant data are within the manuscript and its Supporting Information files.
Funding Statement
This study was supported by a grant from the Else Kröner-Fresenius Foundation (URL https://www.ekfs.de/) to Juliane Unger (grant number: P52/05/A32/05). The commercial sources Gambro Dialysatoren, Hechingen, and by Fresenius Kabi Deutschland GmbH, Bad Homburg, provided the hemofiltration systems, replacement fluids and fluids for volume support. The funders had no role in study design, data collection and analysis, decision to publish, or preparation of the manuscript. The funders had no role in study design, data collection and analysis, decision to publish, or preparation of the manuscript.
References
- 1.Mehta RL, Kellum JA, Shah SV, Molitoris BA, Ronco C, Warnock DG, et al. Acute Kidney Injury Network: report of an initiative to improve outcomes in acute kidney injury. Crit Care. 2007;11(2):R31 10.1186/cc5713 [DOI] [PMC free article] [PubMed] [Google Scholar]
- 2.Mandelbaum T, Scott DJ, Lee J, Mark RG, Malhotra A, Waikar SS, et al. Outcome of critically ill patients with acute kidney injury using the Acute Kidney Injury Network criteria. Crit Care Med. 2011;39(12):2659–64. 10.1097/CCM.0b013e3182281f1b [DOI] [PMC free article] [PubMed] [Google Scholar]
- 3.De Mendonça A, Vincent JL, Suter PM, Moreno R, Dearden NM, Antonelli M, et al. Acute renal failure in the ICU: risk factors and outcome evaluated by the SOFA score. Intensive Care Med. 2000;26(7):915–21. [DOI] [PubMed] [Google Scholar]
- 4.Ko GJ, Rabb H, Hassoun HT. Kidney-lung crosstalk in the critically ill patient. Blood Purif. 2009;28(2):75–83. 10.1159/000218087 . [DOI] [PMC free article] [PubMed] [Google Scholar]
- 5.Doi K, Ishizu T, Fujita T, Noiri E. Lung injury following acute kidney injury: kidney-lung crosstalk. Clin Exp Nephrol. 2011;15(4):464–70. 10.1007/s10157-011-0459-4 [DOI] [PubMed] [Google Scholar]
- 6.Basu RK, Wheeler DS. Kidney-lung cross-talk and acute kidney injury. Pediatr Nephrol. 2013;28(12):2239–48. 10.1007/s00467-012-2386-3 [DOI] [PMC free article] [PubMed] [Google Scholar]
- 7.Ricci Z, Claudio Ronco. Pulmonary/renal interaction. Curr Opin Crit Care. 2012;18(3):294 10.1097/MCC.0b013e3283532c24 [DOI] [PubMed] [Google Scholar]
- 8.Bhargava R, Altmann CJ, Andres-Hernando A, Webb RG, Okamura K, Yang Y, et al. Acute lung injury and acute kidney injury are established by four hours in experimental sepsis and are improved with pre, but not post, spesis administration of TnF-alpha antibodies. PLoS. 2013;8(11):e79037 10.1371/journal.pone.0079037 [DOI] [PMC free article] [PubMed] [Google Scholar]
- 9.Basu RK, Donaworth E, Wheeler DS, Devarajan P, Wong HR. Antecedent acute kidney injury worsens subsequent endotoxin-induced lung inflammation in a two-hit mouse model. Am J Physiol Renal Physiol. 2011;301(3):F597–604. 10.1152/ajprenal.00194.2011 [DOI] [PubMed] [Google Scholar]
- 10.Kuiper JW, Groeneveld AB, Slutsky AS, Plotz FB. Mechanical ventilation and acute renal failure. Crit Care Med. 2005;33(6):1408–15. . [DOI] [PubMed] [Google Scholar]
- 11.Ware LB, Matthay MA. The acute respiratory distress syndrome. N Engl J Med. 2000. May;342(18):1334–49. 10.1056/NEJM200005043421806 [DOI] [PubMed] [Google Scholar]
- 12.Acute Respiratory Distress Syndrome Network, Brower RG, Matthay MA, Morris A, Schoenfeld D, Thompson BT, Wheeler A.Ventilation with lower tidal volumes as compared with traditional tidal volumes for acute lung injury and the acute respiratory distress syndrome. The Acute Respiratory Distress Syndrome Network. N Engl J Med 2000. 2000;342(18):1301–8. 10.1056/NEJM200005043421801 [DOI] [PubMed] [Google Scholar]
- 13.Dellinger RP, Levy MM, Rhodes A, Annane D, Gerlach H, Opal SM, et al. Surviving sepsis campaign: international guidelines for management of severe sepsis and septic shock: 2012. Crit Care Med. 2013. February;41(2):580–637. 10.1097/CCM.0b013e31827e83af [DOI] [PubMed] [Google Scholar]
- 14.Deja M, Hommel M, Weber-Carstens S, Moss M, von Dossow V, Sander M, et al. Evidence-based therapy of severe acute respiratory distress syndrome: an algorithm-guided approach. J Int Med Res. 2008;36(2):211–21. 10.1177/147323000803600201 [DOI] [PubMed] [Google Scholar]
- 15.Wagner CA, Finberg KE, Breton S, Marshansky V, Brown D, Geibel JP. Renal vacuolar H+-ATPase. Physiol Rev. 2004. October;84(4):1263–314. 10.1152/physrev.00045.2003 [DOI] [PubMed] [Google Scholar]
- 16.Gumz ML, Lynch IJ, Greenlee MM, Cain BD, Wingo CS. The renal H+-K+-ATPases: physiology, regulation, and structure. Am J Physiol Renal Physiol. 2010. January;298(1):F12–21. 10.1152/ajprenal.90723.2008 Epub 2009 Jul 29. [DOI] [PMC free article] [PubMed] [Google Scholar]
- 17.Unger JK, Haltern C, Kobela JB, Francis B, Rossaint R, Grosse-Siestrup C. Hydroxyethyl starch 130 kd/0.4 and albumin improve CVVH biocompatibility whereas gelatin and hydroxyethyl starch 200 kd/0.5 lead to adverse side effects of CVVH in anesthetized pigs. Shock. 2006;25(5):533–45. 10.1097/01.shk.0000221322.98590.99 [DOI] [PubMed] [Google Scholar]
- 18.Al-Salam Z, Johnson S, Abozaid S, Bigam D, Cheung PY. The Hemodynamic Effects of Dobutamine during Reoxygenation after Hypoxia: A Dose-Response Study in Newborn Pigs. Shock. 2007;28(3):317–25. 10.1097/shk.0b013e318048554a [DOI] [PubMed] [Google Scholar]
- 19.Dittrich S, Groneberg DA, von Loeper J, Lippek F, Hegemann O, Grosse-Siestrup C, et al. Influence of cold storage on renal ischemia reperfusion injury after non-heart-beating donor explantation. Nephron Exp Nephrol. 2004;96(3):e97–102. 10.1159/000076751 . [DOI] [PubMed] [Google Scholar]
- 20.Torras J, Herrero-Fresneda I, Lloberas N, Riera M, Ma Cruzado J, Ma Grinyo J. Promising effects of ischemic preconditioning in renal transplantation. Kidney Int. 2002;61(6):2218–27. 10.1046/j.1523-1755.2002.00360.x . [DOI] [PubMed] [Google Scholar]
- 21.Jablonski P, Howden BO, Rae DA, Birrell CS, Marshall VC, Tange J. An experimental model for assessment of renal recovery from warm ischemia. Transplantation. 1983;35(3):198–204. . [DOI] [PubMed] [Google Scholar]
- 22.Tsuno K, Miura K, Takeya M, Kolobow T, Morioka T. Histopathologic pulmonary changes from mechanical ventilation at high peak airway pressures. Am Rev Respir Dis. 1991;143(5 Pt 1):1115–20. [DOI] [PubMed] [Google Scholar]
- 23.Chua HR, Glassford N, Bellomo R. Acute kidney injury after cardiac arrest. Resuscitation. 2012;83(6):721–7. [DOI] [PubMed] [Google Scholar]
- 24.Saotome T, Ishikawa K, May CN, Birchall IE, Bellomo R. The impact of experimental hypoperfusion on subsequent kidney function. Intensive Care Med. 2010;36(3):533–40. 10.1007/s00134-009-1740-9 [DOI] [PubMed] [Google Scholar]
- 25.Langenberg C, Wan L, Egi M, May CN, Bellomo R. Renal blood flow and function during recovery from experimental septic acute kidney injury. Intensive Care Med. 2007;33(9):1614–8. 10.1007/s00134-007-0734-8 [DOI] [PubMed] [Google Scholar]
- 26.Ishikawa K, Bellomo R, May CN. The impact of intrarenal nitric oxide synthase inhibition on renal blood flow and function in mild and severe hyperdynamic sepsis. Crit Care Med. 2011;39(4):770–6. 10.1097/CCM.0b013e318206c1fb [DOI] [PubMed] [Google Scholar]
- 27.Clark WR, Hamburger RJ, Lysaght MJ. Effect of membrane composition and structure on solute removal and biocompatibility in hemodialysis. Kidney Int. 1999;56(6):2005–15. 10.1046/j.1523-1755.1999.00784.x [DOI] [PubMed] [Google Scholar]
- 28.Kellum JA, Johnson JP, Kramer D, Palevsky P, Brady JJ, Pinsky MR. Diffusive vs. convective therapy: effects on mediators of inflammation in patient with severe systemic inflammatory response syndrome. Crit Care Med. 1998;26(12):1995–2000. [DOI] [PubMed] [Google Scholar]
- 29.Kellum JA, Dishart MK. Effect of hemofiltration filter adsorption on circulating IL-6 levels in septic rats. Critical Care. 2002;6(5):429–33. 10.1186/cc1528 [DOI] [PMC free article] [PubMed] [Google Scholar]
- 30.Atan R, Crosbie D, Bellomo R. Techniques of extracorporeal cytokine removal: a systematic review of the literature on animal experimental studies. Int J Artif Organs. 2013;36(3):149–58. 10.5301/ijao.5000128 [DOI] [PubMed] [Google Scholar]
- 31.Ralib AM, Pickering JW, Shaw GM, Devarajan P, Edelstein CL, Bonventre JV, et al. Test Characteristics of Urinary Biomarkers Depend on Quantitation Method in Acute Kidney Injury. J Am Soc Nephrol. 2012. February;23(2):322–33. 10.1681/ASN.2011040325 Epub 2011 Nov 17. [DOI] [PMC free article] [PubMed] [Google Scholar]
- 32.SM; B, R; B. Early diagnosis of acute kidney injury. Curr Opin Crit Care. 2007;13(6):638–44. 10.1097/MCC.0b013e3282f07570 [DOI] [PubMed] [Google Scholar]
- 33.Langenberg C, Bagshaw SM, May CN, Bellomo R. The histopathology of septic acute kidney injury: a systematic review. Crit Care. 2008;12(2):R38 10.1186/cc6823 [DOI] [PMC free article] [PubMed] [Google Scholar]
- 34.Adrogué HJ, Madias NE. Renal acidification during chronic hypercapnia in the conscious dog. Pflugers Arch. 1986;406(5):520–8. [DOI] [PubMed] [Google Scholar]
- 35.Madias NE, Adrogué HJ. Cross-talk between two organs: how the kidney responds to disruption of acid-base balance by the lung. Nephron Physiol. 2003;93(3):61–6. [DOI] [PubMed] [Google Scholar]
- 36.Brown D, Bouley R, Păunescu TG, Breton S, Lu HA. New insights into the dynamic regulation of water and acid-base balance by renal epithelial cells. Am J Physiol Cell Physiol. 2012;302(10):C1421–33. 10.1152/ajpcell.00085.2012 [DOI] [PMC free article] [PubMed] [Google Scholar]
- 37.Breton S, Brown D. Regulation of luminal acidification by the V-ATPase. Physiology (Bethesda). 2013;28(5):318–29. [DOI] [PMC free article] [PubMed] [Google Scholar]
- 38.Schwartz GJ, Al-Awqati Q. Carbon dioxide causes exocytosis of vesicles containing H+ pumps in isolated perfused proximal and collecting tubules. J Clin Invest. 1985;75(5):1638–44. 10.1172/JCI111871 [DOI] [PMC free article] [PubMed] [Google Scholar]
- 39.Nin N, Muriel A, Peñuelas O, Brochard L, Lorente JA, Ferguson ND, et al. Severe hypercapnia and outcome of mechanically ventilated patients with moderate or severe acute respiratory distress syndrome. Intensive Care Med. 2017 Feb.;43(2):200–8. 10.1007/s00134-016-4611-1 Epub 2017 Jan 20. [DOI] [PMC free article] [PubMed] [Google Scholar]
- 40.Jaber S PC, Futier E, Lefrant JY, Lasocki S, Lescot T, Pottecher J, et al. Sodium bicarbonate therapy for patients with severe metabolic acidaemia in the intensive care unit (BICAR-ICU): a multicentre, open-label, randomised controlled, phase 3 trial. Lancet. 2018;392(10141):31–40. Epub 2018 Jun 14. 10.1016/S0140-6736(18)31080-8 [DOI] [PubMed] [Google Scholar]
Associated Data
This section collects any data citations, data availability statements, or supplementary materials included in this article.
Supplementary Materials
(DOCX)
The kidney slices were obtained in experiments investigating possible biocompatibiltiy reactions between continuous veno-venous hemofiltration (CVVH) and infusion of different colloids1; results and pictures concerning transmission electron microscopy not published). For this, anesthized pigs were exposed to CVVH and infusion of either 4% gelatine 30 kDa (Fig 6A and 6B) or 10% hydroxyethyl starch 200 kDa/0.5 (Fig c), but without exposure to acidemia. Ultra-thin slices (40–50 nm) were photographed at 1600:1 enlargement (Fig 6A and 6C) and 3150:1 enlargement (Fig b). BM marks the basal membrane, M marks a mitochondria, N marks the cell nucleus, ICV marks an intracellular vacuole. Note, multiple vacuoles of about 2,5 μm can be found in the tubular cells of the animal infused with either gelatine (6a, b) or starch (6c). Hence, relevant vacuolization due to starch infusion alone is not likely when compared to gelatine infusion.
(TIF)
Kidney slices were stained in hematoxylin eosin (HE) and photographed at 400:1 enlargement. A shows a slice with little cell damage, arrows indicate proximal tubular cell vacuolization. B and C are exemplary for high tubular cell damage with nucleus pycnosis (B) and cell barrier loss (C) highlighted with arrows. D shows normal morphology in comparison. * renal corpuscles, # proximal tubules, + distal tubules.
(TIF)
- A) Intensity of the signal score 1.
- B) Intensity of the signal score 2.
- C) Intensity of the signal score 3.
- D) Intensity of the signal score 4.
- E) Intensity of the signal score 0.
(TIF)
(DOCX)
Scoring criteria for analyzing kidney cell damage in haematoxylin-eosin (HE) staining.
(DOCX)
The table summarizes which change in percent of a visual field for a certain score criteria equals which score value.
(DOCX)
(DOCX)
The table summarizes the renal structures which were analyzed for immunohistochemical (IHC) staining.
(DOCX)
The table provides details what qualitative IHC staining intensity equals which score value.
(DOCX)
(DOCX)
Data Availability Statement
All relevant data are within the manuscript and its Supporting Information files.


