Abstract
Label-free assays, and particularly those based on the combination of mass spectroscopy with surface chemistries, enable high-throughput experiments of a broad range of reactions. However, these methods can still require the incorporation of functional groups that allow immobilization of reactants and products to surfaces prior to analysis. In this paper, we report a traceless method for attaching molecules to a self-assembled monolayer for matrix-assisted laser desorption and ionization (SAMDI) mass spectrometry. This method uses monolayers that are functionalized with a 3-trifluoromethyl-3-phenyl-diazirine group that liberates nitrogen when irradiated and gives a carbene that inserts into a wide range of bonds to covalently immobilize molecules. Analysis of the monolayer with SAMDI then reveals peaks for each of the adducts formed from molecules in the sample. This method is applied to characterize a P450 drug metabolizing enzyme and to monitor a Suzuki–Miyaura coupling chemical reaction and is important because modification of the substrates with a functional group would alter their activities. This method will be important for high-throughput experiments in many areas, including reaction discovery and optimization.
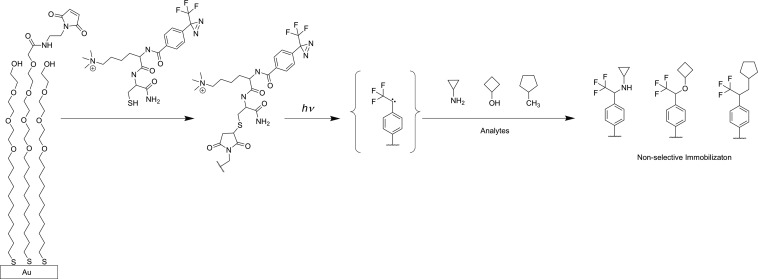
Several recent reports have illustrated the benefits of applying high-throughput experiments to develop, optimize, and understand reactions.1−3 Yet, current methods rely on labels to analyze the reactions, limiting the activities that can be assayed and introducing artifacts, or they rely on chromatographic separations with a significant loss in throughput. Mass spectrometry, particularly when combined with surface chemistries, allows for high-throughput assays of chemical and biochemical reactions.4 Our development of the SAMDI (self-assembled monolayers for matrix-assisted laser desorption and ionization) method uses self-assembled monolayers of alkanethiolates on gold to immobilize analytes that can then be quantitated with mass spectrometry. SAMDI has been particularly important in enabling rapid and quantitative analysis of enzyme activities.5 In the SAMDI method, substrates are either first immobilized to the monolayer and treated with an enzyme,6−13 or treated with the enzyme in a solution-phase reaction and subsequently immobilized to the monolayer prior to analysis by mass spectrometry.7,8,14−16 In either case, the substrate must be modified with a functional group that allows its immobilization.16 While this requirement for an immobilization tag is often not problematic, there are cases where the introduction of the tag is either not straightforward or is incompatible with the activity to be measured. SAMDI has also been used in the discovery and study of reactions, and here too the need for a functional group can interfere with the intended reaction.17,18 To enable assays in a true “label-free” format, here we describe a general strategy termed Traceless Immobilization SAMDI-MS (TI-SAMDI-MS) (Figure 1) that uses a photogenerated carbene to nonselectively attach molecules to the monolayer, where they can then be analyzed by mass spectrometry. We demonstrate the utility of this method in assays of cytochrome P450 activity and monitoring a Suzuki–Miyaura coupling reaction.
Figure 1.
Overview of the TI-SAMDI-MS method. A peptide containing the 3-trifluoromethyl-3-phenyl-diazirine group (TPD) is immobilized to a monolayer presenting maleimide groups against a background of tri(ethylene glycol) groups. Subsequent application of a solution containing analytes and exposure to ultraviolet light results in the photogeneration of a reactive carbene and covalent attachment of analytes, which can subsequently be identified with SAMDI-MS. The analytes can react at multiple bonds to give a mixture of isomeric products.
Our strategy uses monolayers that are functionalized with 3-trifluoromethyl-3-phenyl-diazirine (TPD). Upon irradiation with light near 365 nm, the diazirine liberates molecular nitrogen to generate a highly reactive carbene which then reacts nonselectively with a wide variety of molecules by insertion into various chemical bonds (C(sp3)—H, C(sp2)—H, O—H, C—Cl, N—H, Si—H, and C=C double bonds) to give covalent immobilization.19−21 Hence, this photocapture of analytes does not require that the analyte contain a specific functional group for immobilization and therefore can be broadly applicable in characterizing reaction products. We synthesized the photoaffinity linker using standard routes15 to couple a 4-[3-(trifluoromethyl)-3H-diazirin-3-yl] benzoic acid with a dipeptide of trimethylammonium lysine and cysteine. The trimethylated lysine was included because it enhances the MALDI ionization efficiency22 and the cysteine residue was included for immobilization to self-assembled monolayers presenting maleimide groups.23
We first prepared monolayers presenting a maleimide group at a density of 20% against a background of tri(ethylene glycol) groups on gold-coated metal plates as described previously.24 We applied a solution of the photoaffinity linker (100 μM in 100 mM tris buffer, pH 7.5) for 30 min at 37 °C to immobilize the TPD group. We found that the photoimmobilization reactions were most efficient when the solution of molecule was first evaporated with a vacuum desiccator to leave a dried film on the monolayer prior to irradiation at 365 nm with a UV lamp for 10 min at 1 J/cm2 under a nitrogen atmosphere. Drying the molecules onto the surface increases their concentration and minimizes immobilization of solvent molecules19 whereas the nitrogen gas minimized oxidation of the SAMs.25 After irradiation, the monolayer was rinsed and treated with 2,4,6-trihydroxyacetophenone (THAP) matrix (10 mg/mL in acetone) and analyzed by MALDI mass spectrometry. The resulting spectra reveal mass shifts that correspond to the covalent addition of the small molecule to the TPD terminated alkanethiolate after loss of nitrogen.
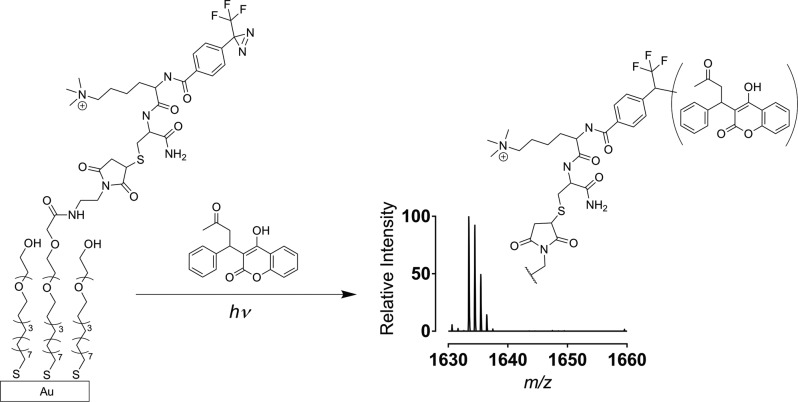
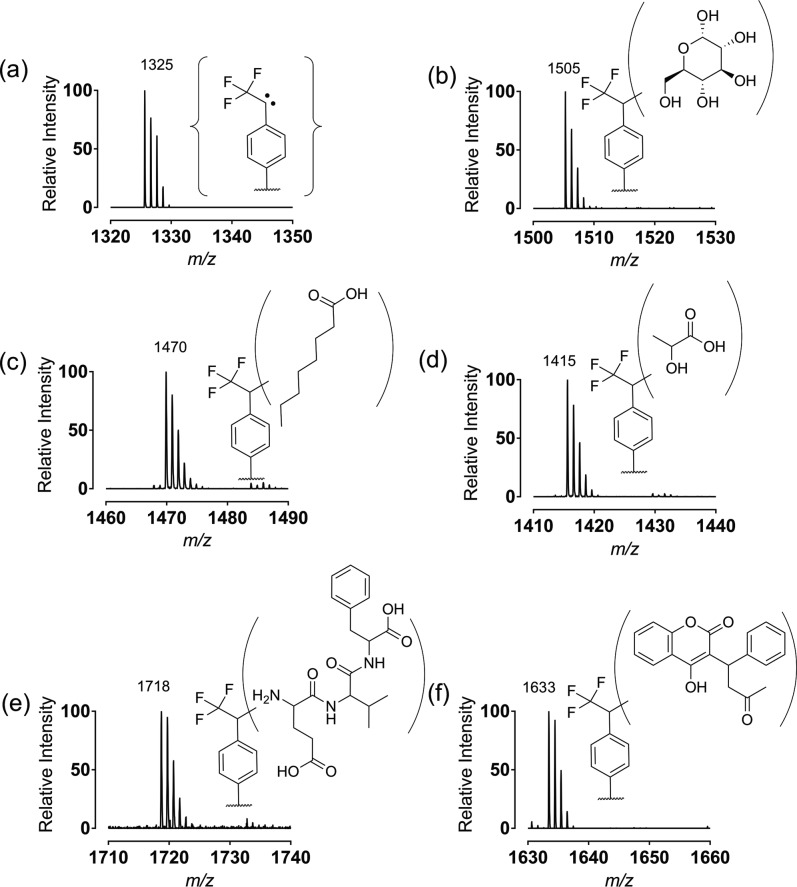
We first obtained a SAMDI spectrum presenting the TPD group in a mixed monolayer that included the tri(ethylene glycol)-terminated alkanethiolate. The spectrum (Figure 2a) showed a peak at m/z 1325 corresponding to the mixed disulfide wherein the diazirine expelled nitrogen, presumably during the laser irradiation. We then demonstrated traceless immobilization of several molecules and analysis by SAMDI. We first immobilized glucose (from a solution 1 mM in 1 μL of water) to the monolayer and obtained a spectrum as described above. The spectrum (Figure 2b) showed a peak at m/z 1505 corresponding to a mass shift consistent with the addition of glucose. Likewise, we demonstrated the immobilization of several other molecules to demonstrate the generality of the technique, including caprylic acid (1 mM in water), lactic acid (1 mM in water), the tripeptide Glu-Val-Phe (1 mM in water) and the drug warfarin (1 mM in water). SAMDI spectra of the photoimmobilized molecules revealed clean peaks at m/z 1470, m/z 1415, m/z 1718, and m/z 1633, respectively (Figure 2). These examples demonstrate that the TI-SAMDI-MS method can covalently capture a broad range of molecular structure types and can be analyzed with SAMDI mass spectrometry. We note that we had first evaluated monolayers presenting either an aryl azide or a benzophenone group and in both cases we observed insufficient reaction with small molecules compared to the diazirine presenting monolayers (Figure S.1).
Figure 2.
Examples of SAMDI spectra for the photoimmobilization of several molecules. (a) The initial monolayer presenting TFD groups; (b) the carbohydrate glucose; (c) the lipid caprylic acid; (d) the metabolite lactic acid; (e) the tripeptide Glu-Val-Phe; (f) and the drug warfarin. The products depict that the molecules immobilize by nonspecific reaction of the carbene with multiple bonds in the molecules, giving a mixture of isomeric products.
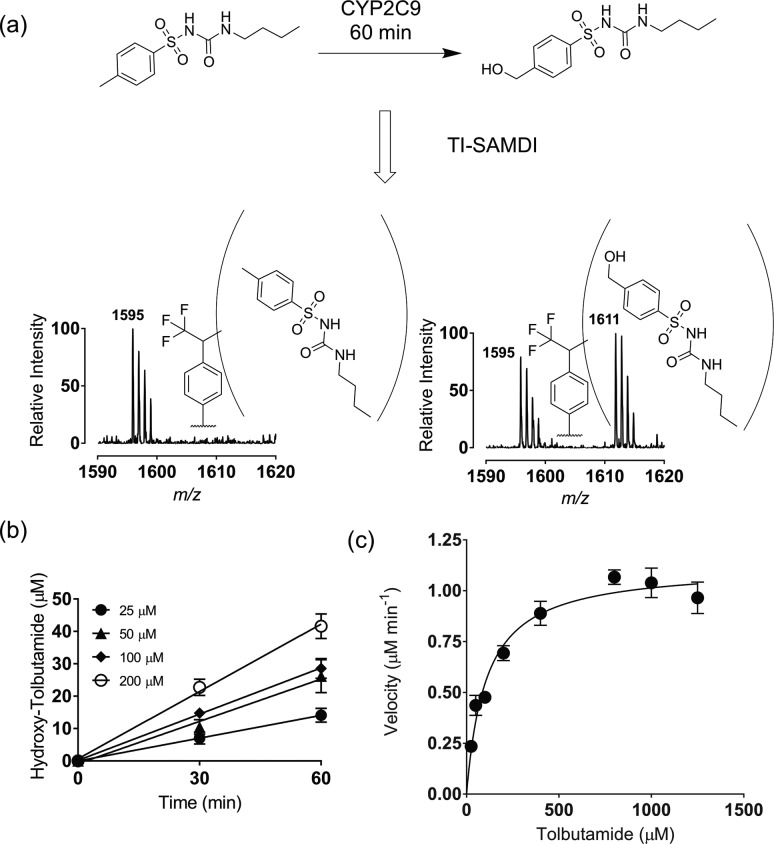
The importance of traceless immobilization of analytes is evident in assays of drug metabolizing enzymes. It is necessary to characterize the activities of various P450 isoforms on molecules to identify drug-enzyme interactions and to determine appropriate doses. The use of an analogue of a drug that is modified to include an immobilization tag carries the risk that the functional group will alter the activity toward a metabolizing enzyme.16 To demonstrate this application, we assayed hydroxylation of the drug tolbutamide by CYP2C9*1, a P450 liver enzyme.16 The enzyme (0.4 μM), and tolbutamide (50 μM) were combined in 15 μL of tris buffer (100 mM, pH 7.5) with the NADPH-regenerating system (1.3 mM NADP+, 3.3 mM glucose-6-phosphate, 3.3 mM magnesium chloride, and 0.4 U/mL glucose-6-phosphate dehydrogenase) and allowed to react for 0 and 60 min at 37 °C. The reactions were stopped with HCl (3 M, 5 μL) and proteins were removed by pelleting with high-speed centrifugation, followed by extraction of tolbutamide and hydroxy-tolbutamide with diethyl ether. The extracted organic phase was reduced to a residue that was reconstituted in acetonitrile: water (1:1, v/v). The samples were then spotted onto the monolayers as described above and analyzed by TI-SAMDI-MS showing the photoimmobilized peak for tolbutamide (m/z 1595) and for the hydroxy-tolbutamide (m/z 1611, Figure 3a). This example demonstrates that the TI-SAMDI-MS method can be used in monitoring biological reactions.
Figure 3.
Quantitative application of TI-SAMDI-MS. (a) Spectra showing before and after CYP2C9 enzyme reaction of tolbutamide to hydroxy-tolbutamide by hydroxylation. (b) Plot showing product yield concentration of hydroxy-tolbutamide to reaction times for calculation of velocity for enzyme kinetics. (c) Michaelis–Menten kinetic plot of reaction as determined by TI-SAMDI-MS.
We next characterized the kinetics for this reaction. A series of reactions were performed for tolbutamide concentrations ranging from 25 μM to 1.25 mM and reaction times of 0, 30, and 60 min. The reactions were quenched and processed as described above to obtain SAMDI spectra. We calculated the yield of the enzymatic conversion by finding the ratio of the peak integration for hydroxy-tolbutamide relative to the sum of the peak areas for hydroxy-tolbutamide (AHTolb) and tolbutamide (ATolb) (percentage yield = AHTolb/[AHTolb + ATolb] × 100). These data were fit with a straight line to obtain the initial rates for the reactions (Figure 3b), which increased smoothly with increasing tolbutamide concentration and reached a maximum as shown in the Michaelis–Menten plot (Figure 3c). We calculated KM and kcat to be 106 μM (95% CI: 59.3 to 153 μM) and 2.8 min–1 (2.5 to 3.1 min–1), respectively. Previous studies found 78 μM (95% CI: 34.2 to 122 μM) and 2.31 min–1 (2.45 to 3.44 min–1) as done by high-performance liquid chromatography (HPLC).16 We note when quantitating yields from the mass spectra that it is important to recognize that the substrate and product may have different rates for immobilization and ionization efficiencies and that the yields may be skewed. To address this possibility, we performed a calibration, where defined mixtures of the substrate and product were photoimmobilized and then quantitated by SAMDI MS and we found that the measured fraction of product was linearly related to the actual values, showing that these molecules had similar immobilization and ionization efficiencies (Figure S.2). These results demonstrate that TI-SAMDI-MS can quantitatively characterize enzyme reactions in a high-throughput format.
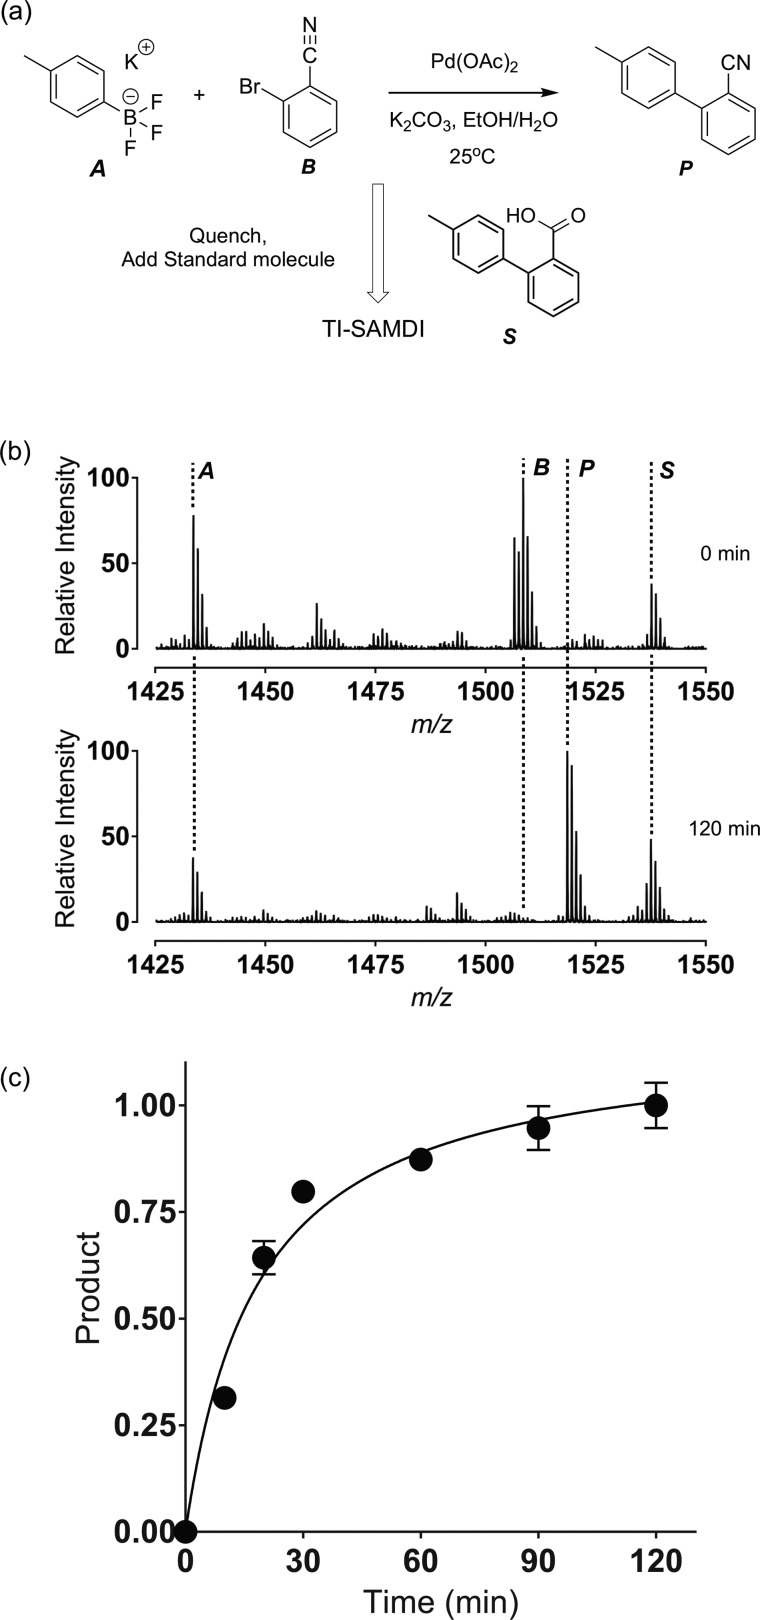
We next demonstrate that TI-SAMDI can be used to characterize chemical reactions. We repeated the Suzuki–Miyaura coupling of 2-bromobenzonitrile (125 mM) and potassium 4-methylphenyltrifluoroborate (150 mM), with a Pd(OAc)2 catalyst (1 mol %) in ethanol/water (4 mL) to give 4′-methyl-2-biphenylcarbonitrile26 (Figure 4a). The reaction was performed at 25 °C for 120 min, but with removal of small volumes (100 μL) at select time intervals that were then terminated with formic acid (10 μL), filtered with cotton and diatomite to remove the palladium catalyst. A standard molecule, 4′-methyl-2-biphenylcarboxylic acid, was added to each sample at a known concentration (125 mM) and serves as a calibrant to permit quantitation of product yields. The samples were photoimmobilized as described earlier and analyzed with TI-SAMDI (Figure 4b). The potassium (4-methyl-phenyl)trifluoroborate degrades to 4-methylphenol and is visible in a peak at m/z 1433 at 0 and 120 min. The 2-bromobenzonitrile appears at m/z 1507 and is consumed after 2 h of reaction. The product appears at m/z 1518 and the standard appears at m/z 1537. Yields were determined from the ratio of peak areas for the product and standard to give a kinetic profile for the reaction (Figure 4c). This example illustrates the utility of TI-SAMDI to rapidly monitor organic chemical reactions in solution.
Figure 4.
TI-SAMDI was used to analyze a Suzuki–Miyaura coupling reaction between potassium (4-methyl-phenyl)trifluoroborate [A] and 2-bromobenzonitrile [B] to give the biphenyl product [P]. A standard [S] molecule was added to the quenched reactions to permit quantitation of the product. (c) TI-SAMDI spectra at 0 and 120 min. (d) The ratio of product to the standard was used to determine the yield at several reaction times.
This work introduces a truly label-free approach for analyzing high-throughput reactions. The ability to photoimmobilize any analyte to a self-assembled monolayer allows the use of SAMDI mass spectrometry to quantitate chemical and biological reactions and is well-suited to performing thousands of experiments per day. This method will be most relevant in studies where reactants are either unknown or cannot be modified with functional groups for subsequent immobilization, as is the case with the cytochrome P450 enzyme demonstrated here. Of course, the TI-SAMDI method requires that the relevant analytes be present at a sufficient molecular fraction (greater than approximately 10%) and that their masses not overlap with those of other components in the reaction mixture. Another benefit of the TI-SAMDI-MS method is that it overcomes the difficulty of MALDI methods to detect low molecular weight compounds, because conjugation of the molecules to the alkanethiolate serves to increase the mass and remove it from the matrix peaks in the spectrum. This method represents a significant extension of the SAMDI assay and addresses prior concerns regarding the need to modify analytes for immobilization.
Acknowledgments
This material is based on research supported by the Air Force Research laboratory under agreement number is FA8650-15-2-5518 and by the National Cancer Institute of the National Institutes of Health under Award Number U54CA199091. K.Y.H. acknowledges the N.S.F. for a graduate research fellowship under Grant No. DGE-1324585. We thank Dr. Yubai Zhou for helpful suggestions with the Suzuki reaction and assistance in collecting NMR spectra.
Supporting Information Available
The Supporting Information is available free of charge on the ACS Publications website at DOI: 10.1021/jacs.8b02918.
Materials and Methods (PDF)
The authors declare no competing financial interest.
Supplementary Material
References
- Shevlin M. ACS Med. Chem. Lett. 2017, 8, 601–7. 10.1021/acsmedchemlett.7b00165. [DOI] [PMC free article] [PubMed] [Google Scholar]
- Selekman J. A.; Qiu J.; Tran K.; Stevens J.; Rosso V.; Simmons E.; Xiao Y.; Janey J. Annu. Rev. Chem. Biomol. Eng. 2017, 8, 525–47. 10.1146/annurev-chembioeng-060816-101411. [DOI] [PubMed] [Google Scholar]
- Krska S. W.; DiRocco D. A.; Dreher S. D.; Shevlin M. Acc. Chem. Res. 2017, 50, 2976–85. 10.1021/acs.accounts.7b00428. [DOI] [PubMed] [Google Scholar]
- de Rond T.; Danielewicz M.; Northen T. Curr. Opin. Biotechnol. 2015, 31, 1–9. 10.1016/j.copbio.2014.07.008. [DOI] [PubMed] [Google Scholar]
- Su J.; Mrksich M. Angew. Chem., Int. Ed. 2002, 41, 4715–8. 10.1002/anie.200290026. [DOI] [PubMed] [Google Scholar]
- Min D. H.; Su J.; Mrksich M. Angew. Chem., Int. Ed. 2004, 43, 5973–7. 10.1002/anie.200461061. [DOI] [PubMed] [Google Scholar]
- Min D. H.; Tang W. J.; Mrksich M. Nat. Biotechnol. 2004, 22, 717–23. 10.1038/nbt973. [DOI] [PubMed] [Google Scholar]
- Ban L.; Pettit N.; Li L.; Stuparu A. D.; Cai L.; Chen W.; Guan W.; Han W.; Wang P. G.; Mrksich M. Nat. Chem. Biol. 2012, 8, 769–73. 10.1038/nchembio.1022. [DOI] [PMC free article] [PubMed] [Google Scholar]
- Gurard-Levin Z. A.; Scholle M. D.; Eisenberg A. H.; Mrksich M. ACS Comb. Sci. 2011, 13, 347–50. 10.1021/co2000373. [DOI] [PMC free article] [PubMed] [Google Scholar]
- Su J.; Rajapaksha T. W.; Peter M. E.; Mrksich M. Anal. Chem. 2006, 78, 4945–51. 10.1021/ac051974i. [DOI] [PubMed] [Google Scholar]
- Gurard-Levin Z. A.; Kilian K. A.; Kim J.; Bahr K.; Mrksich M. ACS Chem. Biol. 2010, 5, 863–73. 10.1021/cb100088g. [DOI] [PMC free article] [PubMed] [Google Scholar]
- Ban L.; Mrksich M. Angew. Chem., Int. Ed. 2008, 47, 3396–9. 10.1002/anie.200704998. [DOI] [PubMed] [Google Scholar]
- Tsubery H.; Mrksich M. Langmuir 2008, 24, 5433–8. 10.1021/la7040482. [DOI] [PubMed] [Google Scholar]
- Patrie S. M.; Roth M. J.; Plymire D. A.; Maresh E.; Zhang J. Anal. Chem. 2013, 85, 10597–604. 10.1021/ac402739z. [DOI] [PubMed] [Google Scholar]
- Kuo H. Y.; DeLuca T. A.; Miller W. M.; Mrksich M. Anal. Chem. 2013, 85, 10635–42. 10.1021/ac402614x. [DOI] [PMC free article] [PubMed] [Google Scholar]
- Anderson L. L.; Berns E. J.; Bugga P.; George A. L. Jr.; Mrksich M. Anal. Chem. 2016, 88, 8604–9. 10.1021/acs.analchem.6b01750. [DOI] [PubMed] [Google Scholar]
- Diagne A. B.; Li S.; Perkowski G. A.; Mrksich M.; Thomson R. J. ACS Comb. Sci. 2015, 17, 658–62. 10.1021/acscombsci.5b00131. [DOI] [PubMed] [Google Scholar]
- Montavon T. J.; Li J.; Cabrera-Pardo J. R.; Mrksich M.; Kozmin S. A. Nat. Chem. 2012, 4, 45–51. 10.1038/nchem.1212. [DOI] [PMC free article] [PubMed] [Google Scholar]
- Kanoh N.; Kumashiro S.; Simizu S.; Kondoh Y.; Hatakeyama S.; Tashiro H.; Osada H. Angew. Chem., Int. Ed. 2003, 42, 5584–7. 10.1002/anie.200352164. [DOI] [PubMed] [Google Scholar]
- Kanoh N.; Kyo M.; Inamori K.; Ando A.; Asami A.; Nakao A.; Osada H. Anal. Chem. 2006, 78, 2226–30. 10.1021/ac051777j. [DOI] [PubMed] [Google Scholar]
- Kanoh N.; Asami A.; Kawatani M.; Honda K.; Kumashiro S.; Takayama H.; Simizu S.; Amemiya T.; Kondoh Y.; Hatakeyama S.; Tsuganezawa K.; Utata R.; Tanaka A.; Yokoyama S.; Tashiro H.; Osada H. Chem. - Asian J. 2006, 1, 789–97. 10.1002/asia.200600208. [DOI] [PubMed] [Google Scholar]
- Roth K. D. W.; Huang Z.-H.; Sadagopan N.; Watson J. T. Mass Spectrom. Rev. 1998, 17, 255–74. . [DOI] [PubMed] [Google Scholar]
- Houseman B. T.; Gawalt E. S.; Mrksich M. Langmuir 2003, 19, 1522–31. 10.1021/la0262304. [DOI] [Google Scholar]
- Yeo W. S.; Min D. H.; Hsieh R. W.; Greene G. L.; Mrksich M. Angew. Chem., Int. Ed. 2005, 44, 5480–3. 10.1002/anie.200501363. [DOI] [PubMed] [Google Scholar]
- Huang J.; Hemminger J. C. J. Am. Chem. Soc. 1993, 115, 3342–3. 10.1021/ja00061a048. [DOI] [Google Scholar]
- Liu C.; Li X.; Gao Z.; Wang X.; Jin Z. Tetrahedron 2015, 71, 3954–9. 10.1016/j.tet.2015.04.041. [DOI] [Google Scholar]
Associated Data
This section collects any data citations, data availability statements, or supplementary materials included in this article.


