Abstract
We present a new test of the hypothesis that synaptic strength is directly related to nerve terminal morphology through analysis of synaptic transmission at Drosophila neuromuscular junctions with a genetically reduced number of nerve terminal varicosities. Synaptic transmission would decrease in target cells with fewer varicosities if there is a relationship between the number of varicosities and the strength of synaptic transmission. Animals that have an extreme hypomorphic allele of the gene for the cell adhesion molecule Fasciclin II possess fewer synapse-bearing nerve terminal varicosities; nevertheless, synaptic strength is maintained at a normal level for the muscle cell as a whole. Fewer failures of neurotransmitter release and larger excitatory junction potentials from individual varicosities, as well as more frequent spontaneous release and larger quantal units, provide evidence for enhancement of transmitter release from varicosities in the mutant. Ultrastructural analysis reveals that mutant nerve terminals have bigger synapses with more active zones per synapse, indicating that synaptic enlargement and an accompanying increase in synaptic complexity provide for more transmitter release at mutant varicosities. These results show that morphological parameters of transmitting nerve terminals can be adjusted to functionally compensate for genetic perturbations, thereby maintaining optimal synaptic transmission.
Keywords: synaptic transmission, neuromuscular junction, electron microscopy, ultrastructure, cell adhesion molecule, Fasciclin II
Understanding the mechanisms that determine the strength of synaptic transmission between a nerve and its target cell is one of the goals of neuroscience (Jessell and Kandel, 1993). One hypothesis for regulation of synaptic transmission postulates that there is a relationship between nerve terminal morphology and synaptic strength (Bailey and Kandel, 1993). This hypothesis holds that the number of contacts between a neuron and its target is a major determinant of synaptic strength, with the corollary that changes in synaptic strength may arise through alterations in nerve terminal morphology.
The relationship between nerve terminal morphology and synaptic transmission has been studied in several model systems. These includeAplysia, goldfish Mauthner cells, hippocampal neurons, and crustacean and frog neuromuscular junctions (NMJs) (Kuno et al., 1971; Korn et al., 1982; Propst and Ko, 1987; Bailey and Kandel, 1993;Lisman and Harris, 1993; Cooper et al., 1995a; Edwards, 1995). Together, these studies indicate a positive relationship between synaptic strength and nerve terminal morphology. However, a common theme of these studies is that physiological measurements of synaptic strength were made first, and later matched with morphological measurements. It is not known whether the reverse is true: does experimentally altered nerve terminal morphology lead to changes in synaptic strength?
The neuromuscular preparation of Drosophila larvae offers several advantages for correlative structure–function studies. The muscle cells are easily identifiable in both the light and electron microscopes, and the innervation pattern is relatively simple, consisting of only 2–4 motoneurons per muscle cell (Johansen et al., 1989; Sink and Whitington, 1991). The chief advantage of the preparation lies in the ability to identify new genes or manipulate known genes using well established genetic and molecular biological approaches. Genetic manipulation of potassium channels and second-messenger systems has been shown to affect arborization of NMJs in Drosophila (Budnik et al., 1990; Zhong et al., 1992; Wang et al., 1994). However, because these mutants are also likely to directly affect synaptic transmission, it is difficult to determine whether the morphological changes also affect transmission.
Drosophila Fasciclin II (Fas II) is a cell adhesion molecule of the immunoglobulin superfamily and is a relative of the vertebrate neural cell adhesion molecule (Grenningloh et al., 1991). Fas II has been shown to be important for axon guidance and target recognition by controlling axon fasciculation in the developing Drosophilaembryo (Lin and Goodman, 1994; Lin et al., 1994). We show here that an extreme Fas II hypomorph, expressing <10% of the normal level of Fas II protein, exhibits a reduced number of nerve terminal varicosities at third instar larval NMJs. We used this morphological phenotype to present a novel test of the idea that synaptic strength and nerve terminal morphology are correlated by assaying synaptic transmission in an animal with a reduction in nerve terminal morphology. Surprisingly, we saw no major alteration in synaptic strength at the whole muscle cell level, and we found evidence to indicate that ultrastructural characteristics of individual synapses are adjusted to counteract the reduction in the number of nerve terminal varicosities, thereby maintaining the physiological properties of transmission.
MATERIALS AND METHODS
Animals and preparation. The animals used in this study were described previously by Grenningloh et al. (1991). e76 (herein termed “mutant”) flies possess a hypomorphic allele of thefasciclin II gene generated by imprecise P-element excision. They express <10% of the normal level of Fas II protein. Null alleles of fasciclin II are lethal in the late embryo or first instar larvae. e93 (herein termed “control”) flies were generated from the same P-element mobilization and are normal for Fas II expression (precise P-element excision). All animals were raised on cornmeal medium at 25°C. Wandering third instar larvae were used in all experiments.
The preparation and solutions used were essentially the same as those described in Stewart et al. (1994). The physiological solution contained (in mm): 70 NaCl, 5 KCl, 20 MgCl2, 10 NaHCO3, 5 trehalose, 115 sucrose, 5 BES. This solution was demonstrated to provide stable recording conditions for electrophysiological experiments. Calcium was added as a chloride salt at the concentrations indicated in the text. The normal level of calcium in haemolymph is currently thought to be ∼1.5 mm (Stewart et al., 1994). Larvae were routinely dissected in physiological solution by making a longitudinal mid-dorsal incision and pinning the cuticle flat. The internal organs were carefully removed to expose the body-wall muscles and the nervous system. The segmental nerves were cut near the ventral ganglion. All experiments were performed at room temperature (20–22°C).
Electrophysiology. Two-electrode voltage-clamp data were collected from muscle fiber 6 using an Axoclamp 2A amplifier (Axon Instruments, Foster City, CA). Voltage recording glass microelectrodes were filled with 3 m KCl and had resistances of 20–40 MΩ. Current-passing electrodes had resistances of 8–12 MΩ when filled with a 3:1 mixture of 2 m potassium citrate and 3 m potassium chloride. Clamp settling times, in response to hyperpolarizing voltage steps, were <2 msec. Signals were low-pass filtered at 1 kHz and collected via A/D interface at a sampling rate of 5 kHz. Pulses were delivered to the appropriate segmental nerve via a 10 μm inside-diameter glass suction electrode at a frequency of 1 Hz. The amplitudes of 25–50 individual excitatory junctional currents (EJCs) were averaged to give a mean value for each muscle fiber sampled. Most of the data were collected from abdominal segment 4, with a small fraction collected from segments 3 and 5.
The frequency of spontaneous transmitter release was measured with intracellular electrodes and a Gould Brush 2200 chart recorder. Miniature excitatory junction potentials (mEJPs) were counted in 1 min epochs to derive an average frequency of spontaneous release. The mEJPs were collected in solutions containing 0 and 1 mmcalcium. Two millimolar EGTA was used in some of the zero calcium experiments to ensure that uncontrolled entrance of calcium into the nerve terminal did not influence our measurements. There was no difference in mEJP frequency found between zero calcium solutions with EGTA and those without. There also were no differences found in 0 and 1 mm Ca2+ solutions within a genotype. The data from the two calcium concentrations within a genotype were pooled.
Focal synaptic currents were recorded by placing extracellular 8- to 10-μm-inside-diameter micropipettes over nerve terminals, as viewed under a 40× water immersion lens and Nomarski optics, as described previously (Mallart, 1993; Kurdyak et al., 1994). In most experiments, 100 stimuli per recording site delivered at 1 Hz were collected and scored for failure or release. In a few experiments, longer data sets were collected (300–800 stimuli) and yielded similar results. Simultaneous intracellular recordings were made to ensure that failure to stimulate the nerve was not scored as a failure to release; if EJP amplitudes did not appear stationary throughout the experiment, the data were not analyzed.
Immunofluorescence. For immunofluorescent labeling of nerve terminals, dissected preparations were fixed and washed as described byAtwood et al. (1993). Preparations were incubated overnight in 1:50 or 1:100 fluorescein isothiocyanate-conjugated anti-horseradish peroxidase (Cappel). After incubation and washing, the preparations were mounted on glass slides in a drop of glycerol or Permafluor (Immunon). NMJs were visualized and reconstructed using a BioRad MRC600 confocal microscope and associated software.
Electron microscopy. We tested several fixation methods to obtain the best possible specimens for analysis. In the protocol that gave the best results (the other variations were simply adjustments made to the ratio of glutaraldehyde: formaldehyde, osmolarity, and calcium content of room temperature solutions), dissected specimens were fixed for 4 hr in 3% glutaraldehyde, 0.5% formaldehyde in 0.1 m phosphate buffer with 4% sucrose, rinsed in the same buffer for 2–2.5 hr, and post-fixed in 1% osmium tetroxide for 30 min, all at 4°C. The specimens were then dehydrated in a graded ethanol series (30–100%, 20 min steps) and propylene oxide (30 min), infiltrated, and embedded with Epon-Araldite resin.
After fixation but before dehydration, the specimens were trimmed to isolate, from abdominal segment 4, a single hemisegment. Mutants and controls were cut in a unique shape so that they could be positively identified. Pairs of mutant and control samples were processed together in the same vial to minimize differential fixation and processing artifacts.
After embedding, muscles 6 and 7 were located and identified in thick sections before ultrathin serial sections were cut (Ultracut; Reichert-Jung), collected, and mounted on Formvar-coated slot grids. The sections were stained with lead citrate and uranyl acetate and then examined and photographed with a Hitachi H7000 transmission electron microscope operated at 75 kV. Typically, 100–150 serial sections, representing ∼8–10 μm of nerve terminal, were photographed, the relevant structures digitized, and then reconstructed on a microcomputer using software from the Laboratory for High Voltage Electron Microscopy at the University of Colorado. From the reconstructed terminals, quantitative data for synapse number, synapse size, and presynaptic dense bodies of active zones were obtained. The data reported here are from all synapses examined; incomplete synapses at the beginning and end of the series did not influence the values reported here (analysis not shown). For synapses with intrasynaptic section loss, synaptic areas were extrapolated for the missing sections, but dense bar counts were not adjusted. Thus, the reported dense bar/synapse ratios likely underestimate slightly the true values. Approximately 93% of all sections were recovered. The worst recovery rate was for one mutant series in which 85% of sections were recovered; recovery was about equal for all other series.
Statistical analysis. Numerical data are presented as mean ± SEM. The Student’s t test (two-tailed) was routinely used for comparison of means between mutant and control groups, withp < 0.05 chosen as the level of significance. When the data violated the assumptions of the parametric t test, the nonparametric equivalent Mann–Whitney U test was used.
RESULTS
Altered nerve terminal morphology in a Fas II mutant
Muscles in larval Drosophila receive innervation from motoneurons, which give rise to two classes of axons called Type I and Type II (Keshishian et al., 1993). Specifically, the ventral longitudinal muscle fibers 6 and 7 receive innervation from two Type I motoneurons, which have recently been subdivided into Types Ib and Is, based on morphological criteria (Atwood et al., 1993). The Ib and Is types are physiologically distinct (Kurdyak et al., 1994). In this study, we follow the convention of Atwood et al. (1993) by calling the axon to muscles 6 and 7 that provides the bigger varicosities (Type Ib) axon 1, and the axon that provides smaller varicosities (Type Is) axon 2.
Nerve terminals of control and mutant NMJs were visualized with fluorescence microscopy to determine the effect of reduced Fas II expression on the larval NMJ (Fig. 1A,B). Qualitatively, the junctions of the mutants appear quite different from controls: there are noticeably fewer synapse-bearing varicosities; there are fewer, and shorter, secondary axon branches; and there are often long intervening stretches of axon terminal between varicosities.
Fig. 1.
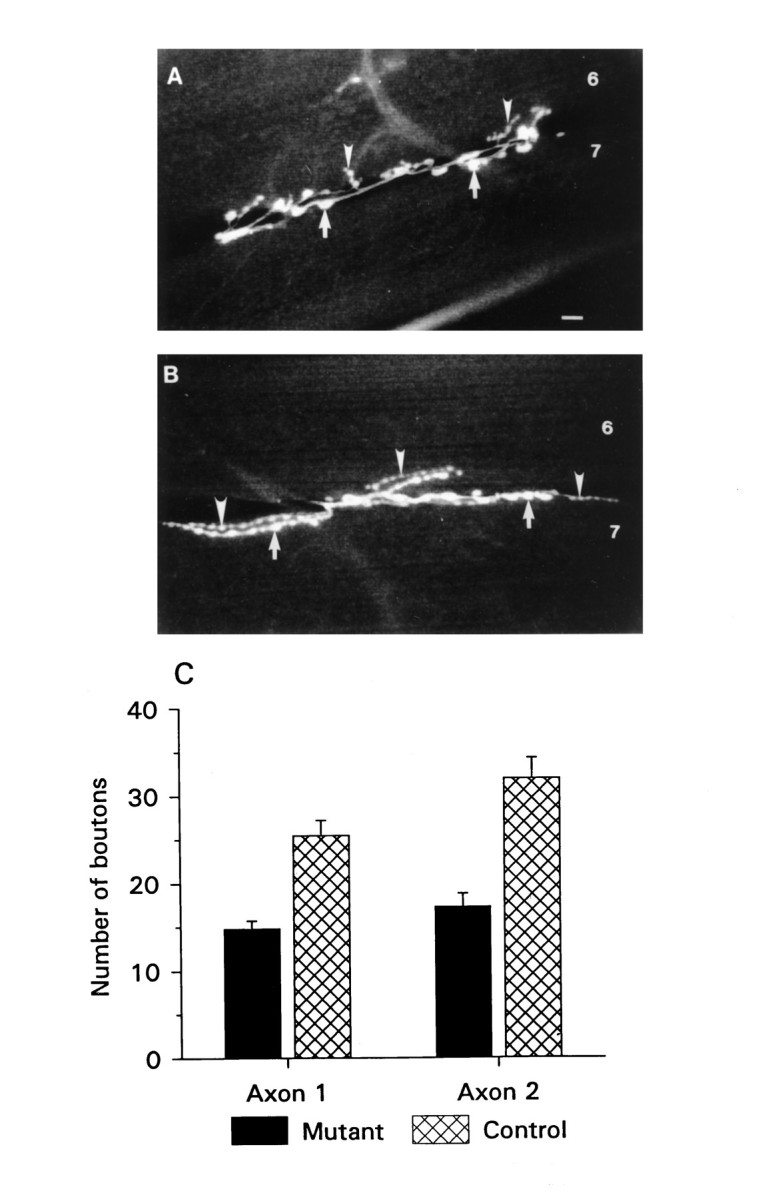
Aberrant neuromuscular morphology in Fas II mutants. A, B, Fluorescence micrographs of NMJs of ventral longitudinal muscles 6 and 7 in mutant (A) and control (B) animals. Arrows point to varicosities of axon 1, and arrowheads point to varicosities of axon 2. Scale bar (shown in A), 10 μm. C, Summary of varicosity counts obtained from 18 mutant and 13 control NMJs from abdominal segment 4. The error bars represent the SEM in this and subsequent figures. Mutant and control animals are from the e76 and e93 P-element excision lines described in Grenningloh et al. (1991).
Because most synapses in this preparation are known to occur in the varicosities (Atwood et al., 1993), the number of varicosities is likely to be the morphological parameter most relevant to synaptic strength. Thus, we counted the number of varicosities in mutants and controls. We found that mutant animals had 40–50% fewer varicosities on muscles 6 and 7 of abdominal segment 4 (Fig. 1C;n = 13 control and 18 mutant abdominal segment 4 NMJs). Varicosities of axon 1 in mutants numbered 15.4 ± 1.4 per NMJ, whereas in controls they numbered 25.4 ± 2.1. Axon 2 showed only 18.8 ± 2.3 varicosities per NMJ in the mutant animals, whereas in controls there were 33.5 ± 2.7. The differences between mutant and control animals are statistically significant (p < 0.001).
Maintenance of whole-muscle cell synaptic strength
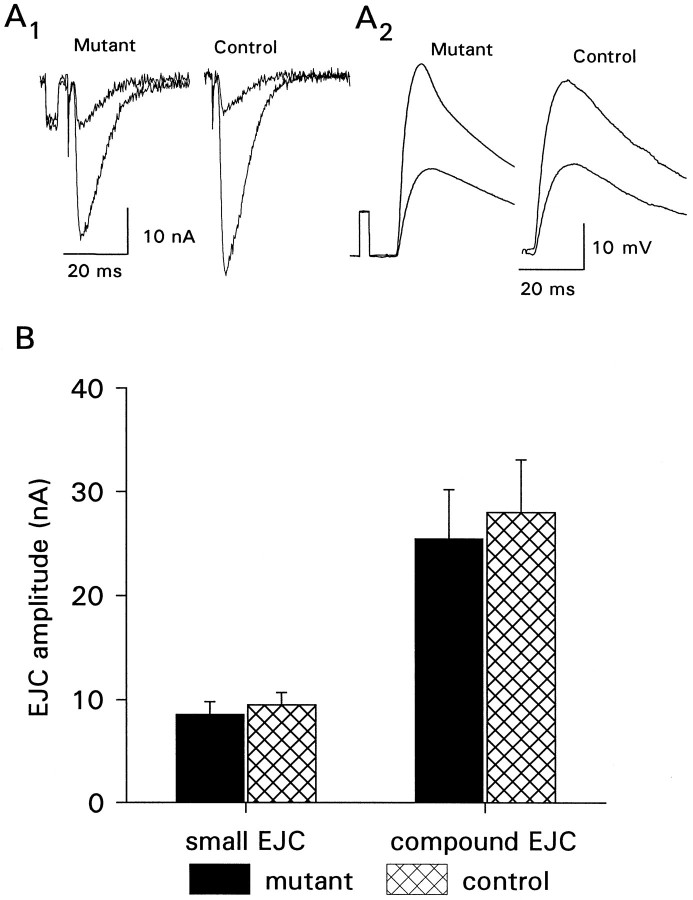
Because the number of contacts between a nerve and its target is thought to be an important determinant of synaptic strength, we asked whether the amplitude of evoked synaptic currents recorded by whole-cell voltage clamp was different in mutant animals and controls. Interestingly, we found that there was no major difference in the strength of transmission between the two genotypes (Fig.2). The smaller EJC, attributable to axon 1 (Kurdyak et al., 1994), in 1.0 mm calcium, was 8.6 ± 1.1 nA in mutants (n = 16 cells) and 9.5 ± 1.2 nA in controls (n = 10 cells). The maximum compound EJC, elicited by a stimulation voltage set to recruit both axons, was 25.5 ± 5.7 nA in the mutant animals and 28.8 ± 4.7 nA in controls. These differences are not significant (p > 0.05) and indicate no major effect of the mutation on overall synaptic strength. Correspondingly, EJP amplitudes were normal in the mutant animals, indicating that depolarization of the muscle cell was unaffected by the mutation. Maximal EJP amplitudes measured in 1.0 mm calcium were 37.3 ± 2.2 mV in mutants (n = 15 cells) and 38.0 ± 1.3 mV in controls (n = 16 cells).
Fig. 2.
Synaptic transmission at the whole muscle level is not affected by aberrant NMJ morphology. A, Examples of single traces showing EJCs (A1) and EJPs (A2). Two thresholds of excitation are shown.B, Summary of EJC amplitudes in mutants and controls measured in 1.0 mm calcium from muscle 6 of abdominal segments 4 and 5 from mutant and control animals (n = 15 mutant cells and 9 control cells). There is no significant difference between controls and mutants.
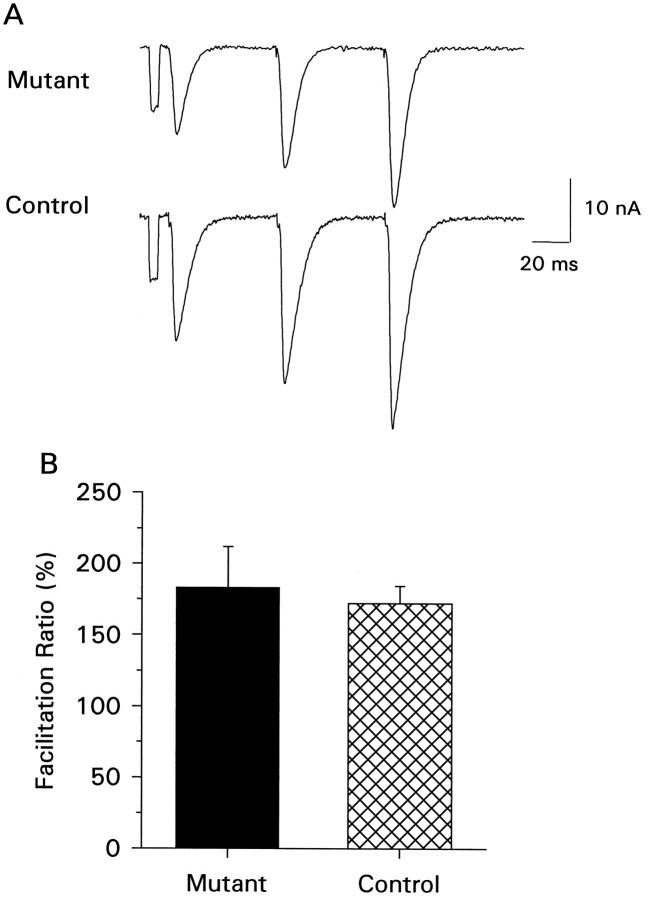
To determine whether the reduced number of varicosities affected frequency-dependent plasticity of transmitter release, we tested short-term facilitation by applying three stimulating pulses with interpulse intervals of 50 msec and measured the ratio of the EJC amplitudes evoked by the third and the first pulse (Fig.3). We did not find any differences between mutants and controls with this protocol. The mean ratio of third to first EJC amplitude in controls was 183 ± 29% (n = 9 cells), whereas in mutants it was 172 ± 12% (n = 6 cells). These measurements were made using the maximal evoked EJC in 0.75 mm external calcium.
Fig. 3.
Short-term facilitation. A, Example of frequency-dependent short-term facilitation of the maximal evoked response for mutant and control animals. The traces show synaptic facilitation observed with a 3 pulse train of 20 Hz stimulation recorded in 0.75 mm calcium and represents the average of five individual traces. B, Summary of facilitation ratios (third pulse amplitude/first pulse amplitude × 100) observed from six mutant and nine control cells. There is no significant difference.
Thus, for the above measurements of synaptic strength at the whole muscle level, the mutant animals with fewer nerve terminal varicosities appeared normal. We did not find any indication that nerve terminal excitability was altered in Fas II mutants, as was recently reported for Fas I mutants (Zhong and Shanley, 1995).
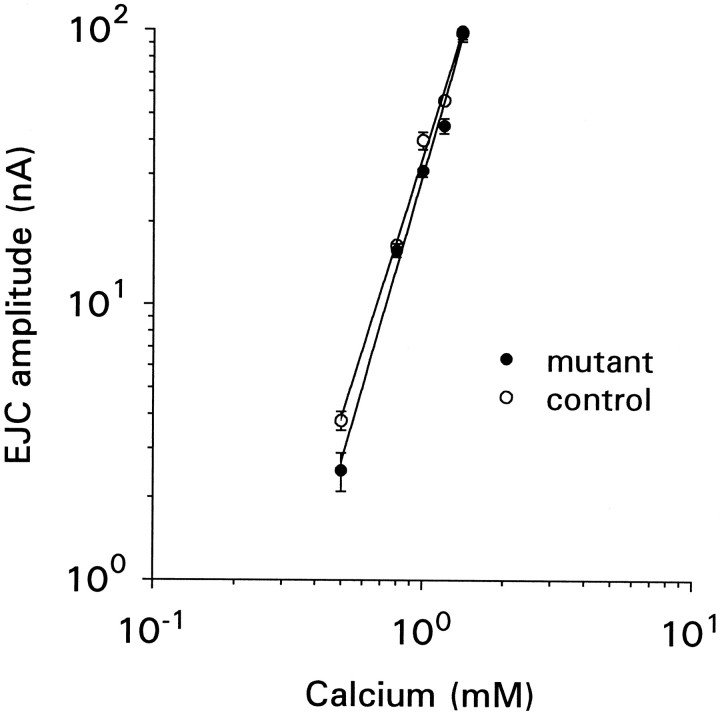
Mutant terminals could maintain normal synaptic efficacy if they were more sensitive to the external calcium concentration. However, the calcium dependency of transmitter release was found to be the same for the mutants and controls (Fig. 4). Maximal EJCs were collected in physiological solutions containing concentrations of calcium ranging from 0.4 to 1.4 mm. The amplitude of these events was plotted on log–log scales, and the slope ± SE of the slope for regression lines fitted to the data were 3.1 ± 0.1 and 3.4 ± 0.2 for the mutants and controls, respectively, showing no difference (p > 0.05) between the two genotypes. The muscle–muscle fiber input resistance was 6.7 ± 0.3 MΩ for mutants (9 cells) and 7.5 ± 0.3 MΩ for controls (6 cells); these values were not significantly different (p > 0.05). The majority of muscle fiber membrane potentials for the two genotypes ranged between −50 and −65 mV for both genotypes, similar to the values reported byStewart et al. (1994).
Fig. 4.
Calcium dependency of transmitter release. Maximal EJC amplitude is plotted as a function of external calcium concentration on log–log scales. Each point is the average of data collected from 10 to 14 muscle fibers.
As a further test to determine whether synaptic transmission had been enhanced in the mutant animals, we analyzed spontaneous release of neurotransmitter with intracellular microelectrodes. A presynaptic modification in the mutant terminals was indicated by their significantly (p < 0.001) higher frequency of spontaneous quantal release (Fig. 5A,B). The mean frequency of spontaneous release in mutants was 4.1 ± 0.3 Hz; in controls it was 2.3 ± 0.2 Hz (n = 10 mutant and 8 control cells). We did not find calcium-dependent increase in the frequency of spontaneous release in these larvae (extracellular calcium range 0–1.0 mm), as has been reported for the embryonic NMJ (Sweeney et al., 1995).
Fig. 5.
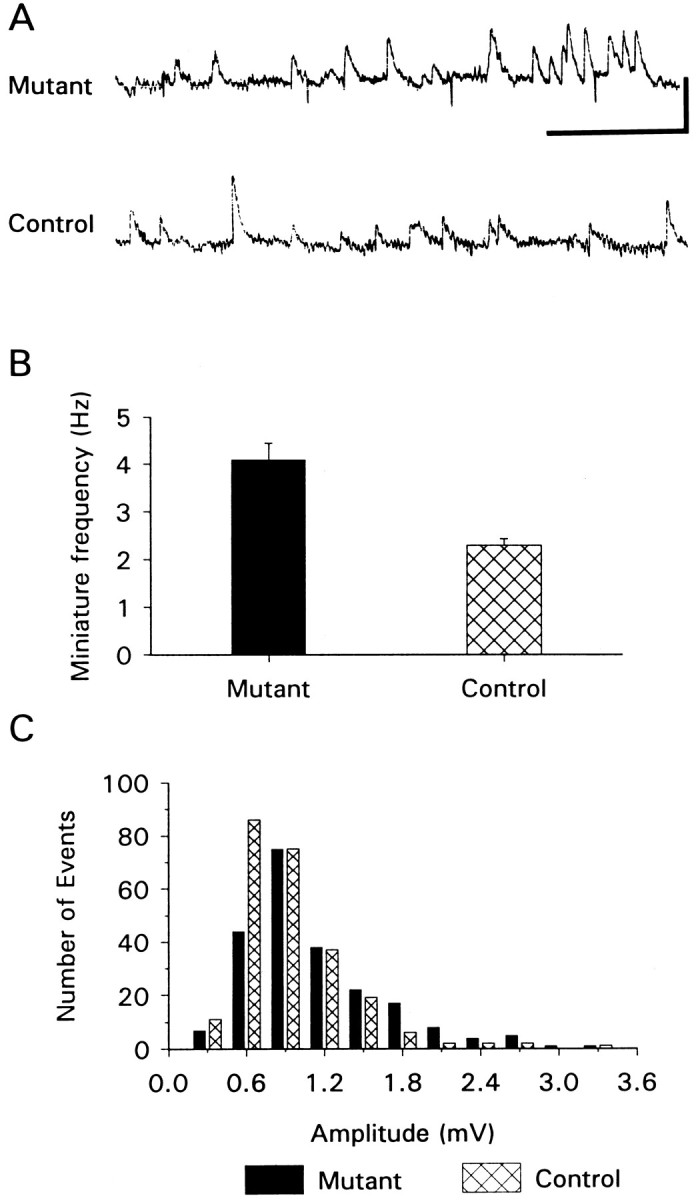
Frequency of spontaneous neurotransmitter release is higher, and amplitude of quantal events is larger, in mutant animals. A, Traces of membrane potential showing spontaneous transmitter release (miniature potentials) in mutants and controls. Calibration bar: 2 mV, 1 sec. The downward deflections in the mutant trace are 1 mV calibration pulses; ∼4 sec of data are shown.B, Summary of frequency of spontaneous miniature potentials from 10 mutant and 8 control cells. C, Amplitude histogram of spontaneous miniature potentials recorded from mutant and control animals. These histograms were constructed from data recorded from four mutant (244 events) and four control (222 events) cells. The data are grouped into 0.3 mV bins.
Interestingly, we also found a small but significant (p < 0.05) increase in the mean amplitude of spontaneous miniature potentials in the mutant animals, suggestive of a possible postsynaptic modification (Fig. 5C). The mean amplitude in the mutants was 1.0 ± 0.07 mV, whereas in controls it was 0.8 ± 0.05 mV (n = 4 control cells, 241 events; n = 4 mutant cells, 222 events; for all cells, Vm was in the range of −63 to −65 mV). The amplitude distributions of mutants and controls are significantly different (Kolmogorov–Smirnov two-sample test; p < 0.01).
Enhanced transmitter release from varicosities
Because whole-muscle cell synaptic transmission appeared normal in the mutant animals despite the reduction in the number of varicosities, we tested the idea that transmitter release is enhanced from the mutant varicosities. To do this, we made recordings of extracellular synaptic events from one or two varicosities at a time by placing focal micropipettes over varicosities visualized with Nomarski optics. We attempted to estimate the quantal content of transmitter release from individual varicosities at normal calcium concentrations (1.5 mm), but we found it difficult to obtain definitive comparisons because of inter-varicosity variability. We also had difficulty obtaining a sufficient number of spontaneous quantal units from several recording sites on each muscle sampled. As an alternative, we counted the number of failures of transmitter release as an index of synaptic strength, with fewer failures taken to be an indication of enhanced synaptic transmission. Counting failures has previously been used to estimate quantal content of release by assuming that a Poisson distribution describes the number of quanta released per impulse (del Castillo and Katz, 1954). However, because we were uncertain of meeting the assumptions of independence and rarity of events required for the Poisson distribution under the conditions of our experiments, we chose to report the frequency of failures as a comparative measure of synaptic efficacy.
In normal external calcium concentrations (1.5 mm), there are rarely failures (see Cooper et al., 1995b); we therefore set the external calcium concentration to give ∼50% failures in the normal animals and asked how many failures occurred in the mutants. With an external calcium concentration of 0.35 mm, 60.3 ± 4.9% (n = 14 recording sites) of stimuli failed to evoke release of neurotransmitter in control animals (Fig. 6), whereas in mutant animals, transmitter release failed for only 25.1 ± 4.2% of stimuli (n = 20 recording sites; p < 0.001). These data show that synaptic transmission, measured at the varicosity level, is greater in mutants than in controls. This then indicates a mechanism by which whole-muscle cell synaptic transmission may be maintained in the mutants: the mutant varicosities release, on average, more transmitter per stimulus.
Fig. 6.
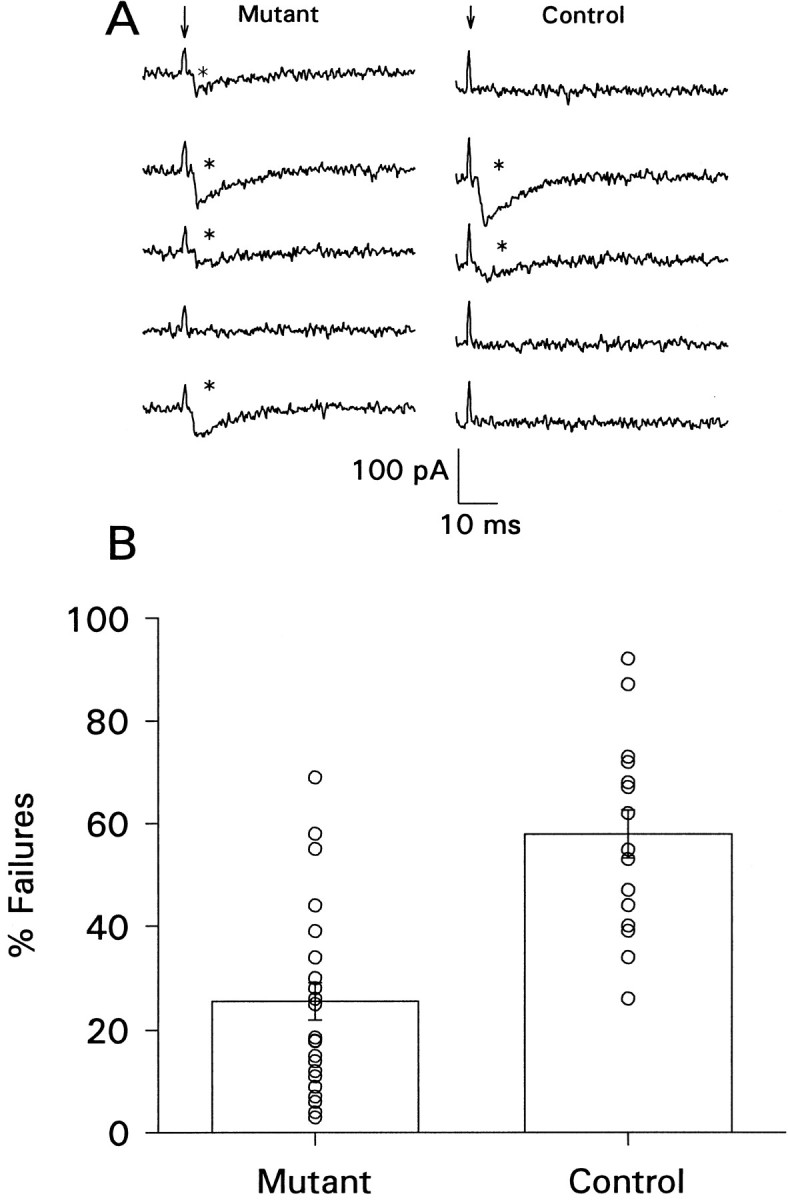
Mutant varicosities have fewer failures of transmitter release. A, Single traces of focally recorded synaptic current from mutant (left) and control (right) animals. Arrows point to stimulus artifacts, and asterisks indicate events scored as release of transmitter. The events in these traces are unitary quantal events, as judged by their similarity to spontaneously occurring events recorded at the same time. In this recording configuration, the current records represent only a fraction of the total membrane current because of the relatively low seal resistance between the micropipette and the muscle; thus, the scale bars do not represent total membrane current.B, Summary of the mean number of failures of evoked release for mutants (n = 20 sites) and controls (n = 17 sites). The symbols show results obtained from each individual recording site. One hundred stimuli from each site were scored for failure or release.
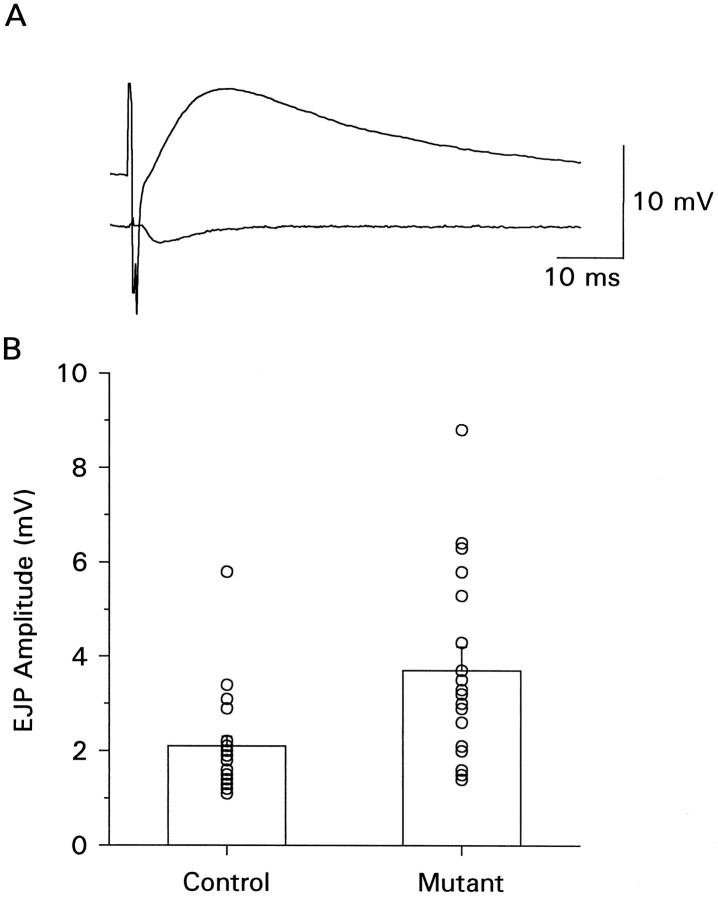
To further substantiate this idea, we focally applied calcium to restricted regions of the nerve terminal (Katz and Miledi, 1965) to measure synaptic strength at higher calcium levels. For these experiments, the bathing solution contained 0 calcium, whereas a micropipette (5–7 μm inside diameter) containing the bathing solution plus 2 mm calcium was placed over nerve terminal varicosities. The calcium-containing micropipette was placed on regions of both varicosity types over several areas of the nerve terminal on each muscle fiber. EJPs were simultaneously recorded with an intracellular electrode when the nerve was stimulated. EJPs could only be recorded when the calcium-containing micropipette was in close contact with a varicosity. Comparable samples were obtained for both mutant and control animals. Summary data of EJP amplitude from mutant and control animals obtained by this method are shown in Figure7. The amplitude of intracellularly recorded EJPs of mutants was 3.7 ± 0.5 mV (n = 18 recording sites), whereas for controls the corresponding value was 2.1 ± 0.2 mV (n = 19 recording sites). These data are significantly different (p < 0.01) and show that mutant varicosities are capable of generating larger EJPs than controls. When these data were normalized for the membrane potential or maximal EJP amplitude of each muscle fiber, the same difference between mutants and controls existed.
Fig. 7.
EJPs recorded with focal calcium application. A micropipette containing 2 mm calcium was placed over several regions of the nerve terminal on each muscle fiber and covered areas of both varicosity types. The segmental nerve was stimulated at a voltage to recruit both axons, and EJPs were recorded with an intracellular electrode. The bathing solution contained 0 calcium. A, Example of raw trace showing evoked EJP (top trace) and synaptic event recorded through the focal pipette (bottom trace). B, The bar graph shows the mean EJP amplitude of data collected from mutant (n = 18) and control (n = 19) sites. The symbolsrepresent the results obtained from individual recording sites.
Ultrastructural adaptation in a Fas II mutant
At the ultrastructural level, nerve terminal varicosities ofDrosophila (Atwood et al., 1993) and other invertebrates (Cooper et al., 1995a) have been shown to contain numerous synapses, each of which may have 0, 1, or multiple active zones per synapse. In larval Drosophila, the active zones are seen as densely stained T-shaped projections from the presynaptic membrane (see Fig.8). In wild-type Drosophila, Atwood et al. (1993) found on muscles 6 and 7 that each varicosity of axon 1 has approximately 40 synapses, whereas each varicosity of axon 2 has approximately 7 synapses. The majority of these synapses have 0 or 1 active zone. In this paper, we follow the convention of defining a synapse as a continuous area of darkly stained pre- and postsynaptic membrane with uniform separation seen with the electron microscope. We apply this definition regardless of the presence or absence of active zones. Simple synapses are defined as those having 0 or 1 active zone, whereas complex synapses are those with multiple active zones.
Fig. 8.
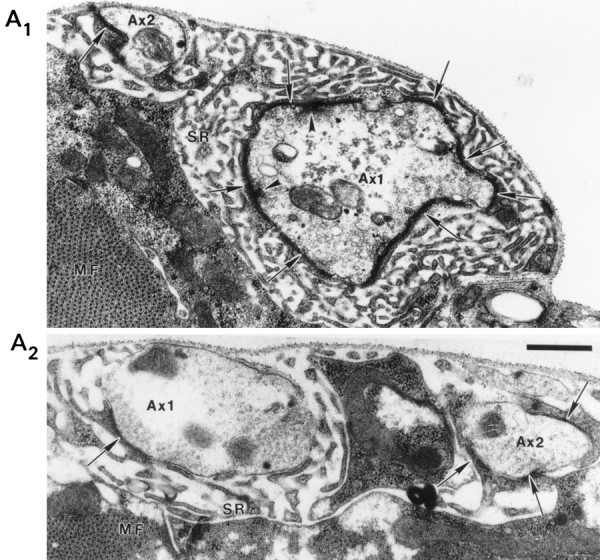
Nerve terminal ultrastructural of a Fas II mutant. Electron micrographs of mutant (A1) and control (A2) larval NMJ from abdominal segment 4 showing densely staining synapses (arrows), presynaptic dense bodies (arrowheads), subsynaptic reticulum (SR), and muscle fibers (MF). Axons 1 and 2 are labeled Ax1 andAx2, respectively. The scale bar is 0.5 μm and applies to both A1 andA2.
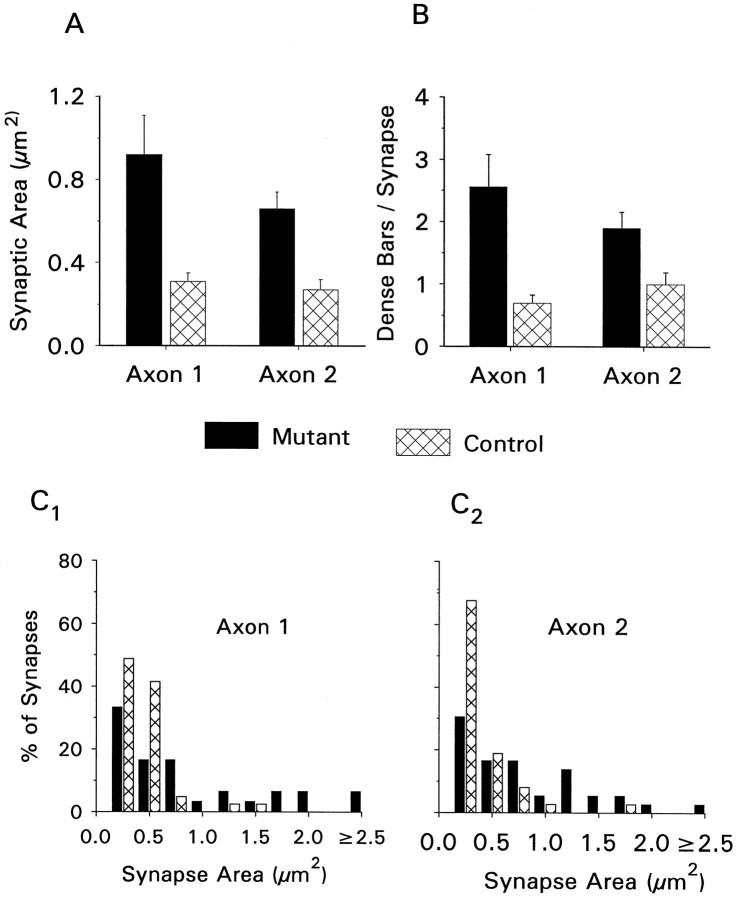
Electron microscopic analysis of serially sectioned nerve terminals from mutant and control animals gave the results shown in Figures 8 and 9 and Table 1. These data were obtained from three mutant series and two control series, each from a different animal (number of synapses examined: mutant axon 1, 44; mutant axon 2, 48; control axon 1, 41; control axon 2, 37). Terminals were identified at the ultrastructural level by previously described criteria (Atwood et al., 1993). We found that the mean synaptic contact area for individual synapses was greatly increased in the mutants (Fig. 9A). For axon 1, mutant synapses had a mean area of 0.92 ± 0.19 μm2, whereas in controls the mean area was 0.31 ± 0.04 μm2. For axon 2, mutant synapses had a mean area of 0.66 ± 0.08 μm2, whereas in controls this value was 0.27 ± 0.05 μm2. The differences for both axon types between mutant and controls are significantly different (p < 0.001). The distribution of synapse sizes is shown in Figure9D. In control animals, 80–90% of all synapses found on axons 1 and 2 are 0.5 μm2 or smaller, whereas in mutant animals this figure is reduced to ∼40–50%, the size distribution being shifted toward larger synapses.
Fig. 9.
Summary of ultrastructural data. Reconstructed nerve terminals were analyzed for synaptic area (A) and the number of presynaptic dense bodies per synapse (B). The frequency distribution of synapse size is shown for axon 1 (C1) and axon 2 (C2).
Table 1.
Nerve terminal ultrastructure for mutant and control samples
| Control | Mutant | |||
|---|---|---|---|---|
| Axon 1 | Axon 2 | Axon 1 | Axon 2 | |
| Terminal length sampled (μm) | 17.0 | 20.0 | 21.3 | 42.6 |
| Surface area sampled (μm2) | 76.8 | 71.0 | 109.1 | 80.8 |
| Number of varicosities sampled | 3 | 5 | 4 | 6 |
| Number of synapses analyzed | 41 | 37 | 44 | 48 |
| Complete | 32 | 31 | 30 | 27 |
| Incomplete | 9 | 6 | 14 | 21 |
| Mean synapse size (μm2) | 0.31 | 0.27 | 0.92 | 0.66 |
| Total number of active zones | 30 | 36 | 113 | 90 |
| Estimated active zones per varicosity | 10 | 7 | 28 | 15 |
| Active zones/terminal surface area (#/μm2) | 0.4 | 0.5 | 1.0 | 1.1 |
| Active zones/terminal length (#/μm) | 1.8 | 1.8 | 3.6 | 2.1 |
| Active zones per synapse | 0.7 | 1.0 | 2.6 | 1.9 |
| Number of synapses with: | ||||
| 0 active zones | 17 (41%) | 13 (35%) | 5 (11%) | 13 (27%) |
| 1 active zone | 20 (49%) | 14 (37%) | 17 (39%) | 10 (21%) |
| 2 active zones | 3 (7%) | 7 (19%) | 6 (14%) | 12 (25%) |
| 3 or more active zones | 1 (2%) | 3 (8%) | 16 (36%) | 13 (27%) |
These data are the mean values obtained from two control and three mutant series of sections from abdominal segment 4. Nerve terminal lengths are different for the two axons within a genotype because of branching of the individual axons.
We also found differences (p < 0.05) in the number of active zone structures (presynaptic dense bodies) per synapse in the mutant animals (Fig. 9C; axon 1: mutant 2.6 ± 0.5, control 0.7 ± 0.1; axon 2: mutant 1.9 ± 0.3, control 1.1 ± 0.2). The distribution of the number of active zones per synapse favors more complex synapses in the mutant animals (Table 1). For axon 1, 10% of all control synapses had more than one active zone, whereas for the mutant animals ∼50% of synapses had multiple active zones. For axon 2, 27% of control synapses had more than one active zone, whereas in mutants ∼52% of synapses were in this category.
When the total number of active zones is compared with the total synaptic contact area, we find a similar ratio for mutant and control samples. For both axons 1 and 2, there are between 2.5 and 3 active zones per square micrometer of synaptic membrane. This indicates that the average density of active zones on individual synapses is not greater in the mutants. However, the relative spacing of active zones is not known, and further analysis of nearest-neighbor distances between active zones may yield more detailed information on the spatial distribution of release sites.
If the total synaptic contact area is expressed as a fraction of the total terminal surface area examined, we find that ∼35% of the terminal area is occupied by synapses in mutant axon 1, whereas in control axon 1 ∼20% of the terminal area is synaptic. For axon 2, 30% of the mutant terminal area is synaptic compared with 15% in the controls. Although the percentage of terminal surface area occupied by synapses is higher in the mutants, the data indicate that, in both cases, a considerable amount of membrane is not occupied by synapses: ∼65% in mutants and 80% in controls.
DISCUSSION
Vertebrate and molluscan molecules related to Fas II have recently received attention regarding their role in mediating physiological changes in synaptic strength (Mayford et al., 1992; Lüthi et al., 1994). In this paper, we have presented data to show that animals that express <10% of the normal amount of Fas II protein have 40–50% fewer nerve terminal varicosities at larval NMJs. Despite this reduction, whole muscle synaptic strength is normal. Ultrastructural data show that the mutants have larger synapses that possess more active zones than controls. These data indicate that ultrastructural parameters of individual varicosities can compensate functionally for a restriction in total varicosity number.
Because mutant animals have half as many varicosities as controls, synaptic efficacy of the individual varicosities in mutants should be double that of controls to maintain normal synaptic strength. Our experiments show that there are about one-half the number of failures of transmitter release in the mutant animals at low calcium concentrations, which is in agreement with the above prediction. This, together with our ultrastructural data, clearly indicates that presynaptic mechanisms are important for the enhancement of transmitter release from individual varicosities and could account for most of the maintenance of whole muscle synaptic strength in the mutants. However, we also found that mEJP amplitude was increased by ∼20% in the mutants. This postsynaptic mechanism would also serve to enhance synaptic efficacy. Our demonstration of a nearly twofold increase in the amplitude of EJPs generated from the varicosities of mutants supports our conclusion that synaptic strength of the whole muscle is maintained by an increase of synaptic strength at the varicosities.
Structure–function relationships of synaptic transmission
The Fas II mutant animals clearly have more active zones per varicosity and per synapse than controls. These features provide an explanation for the release of more neurotransmitters by mutant varicosities. The importance of synapses with multiple active zones has recently been addressed in several experimental systems, including crustacean NMJs. Katz et al. (1993) demonstrated that, depending on the muscle target, a single neuron can show activity-dependent facilitation or depression of transmitter release, and that these properties are correlated with differences in presynaptic ultrastructure. Depressing synapses are larger, with greater numbers of putative release sites.Cooper et al. (1995a) have made direct comparisons of ultrastructure and synaptic strength from individual varicosities of the crayfish NMJ. They found that terminals with higher output of transmitter possess more of the ultrastructurally complex synapses. Our data support the correlation between synaptic complexity and neurotransmitter output because we find fewer failures of transmission at low stimulus frequencies in Fas II mutant animals. Mathematical modeling of localized calcium domains at closely apposed active zones during voltage-gated calcium influx indicates the potential for interaction between these domains, an effect that may enhance neurotransmitter release (Cooper et al., 1996). However, the relative spacing and size of active zones, and the ion channel composition of the zones are likely to be very important for such models and need to be elucidated for Drosophila NMJs.
We also found significantly more frequent releases of spontaneous quantal units in mutants than in controls. This may be attributable to the redistribution of synapse size in the mutants. Because the number of varicosities in the mutants is about one-half that of controls (see Fig. 5), but the fraction of terminal surface area occupied by synapses in the mutants is about double that of the controls (Table 1), the total synaptic surface area for the whole NMJ is likely about the same for the two genotypes; the main difference is a redistribution of synapse size toward larger synapses in the mutants. Therefore, the probability of spontaneous transmitter release is correlated with synapse size. This supports our view that synaptic efficacy is enhanced by the ultrastructural adaptation in fas II mutant animals.
We did not find calcium dependence of mEJP frequency in control or mutant larvae, as was reported for the Drosophila embryonic NMJ (Sweeney et al., 1995). Likewise, Seabrooke et al. (1989) did not find calcium dependence of mEJP frequency in the larvae of the housefly, Musca domestica, but others have reported such dependency in some insect species (Usherwood, 1963; Washio and Inouye, 1978). In Drosophila, the difference in calcium dependence of spontaneous quantal release observed between embryos and larvae may lie in differential calcium channel expression, membrane charge screening, or calcium buffering capabilities in the two developmental stages. That we did not observe calcium dependence of spontaneous release in either mutant or control larvae likely indicates that, at rest, the entry of calcium through presynaptic calcium channels is inconsequential.
A postsynaptic alteration in the mutant animals is indicated by larger spontaneous miniature potential amplitudes. This may be related to the larger synapse size in the mutants. If the density of glutamate receptors on the postsynaptic membrane is constant, but the size of the receptor array is increased, more postsynaptic current could be generated per quantal unit. Freeze-fracture analysis of these junctions to ascertain relative receptor density could provide data to address this question. Alternatively, the fraction of active glutamate receptors or the conductance of the receptors may be altered in the mutants, but we cannot distinguish between these possibilities at present.
Our experiments on short-term facilitation showed no difference between the mutants and controls, indicating that, under the conditions of those experiments, this type of facilitation is independent of synaptic complexity. More detailed experiments using a range of interpulse intervals, duration of stimlus trains, and external calcium concentrations may reveal a more intricate relationship between facilitation and synaptic complexity.
Ultrastructural adaptation
How could the differences we observe in synaptic ultrastructure arise? A relatively simple, passive mechanism that could explain our observations would be that the amount of synaptic material delivered to the terminals is independent of the number of varicosities. Thus, if the number of varicosities is reduced, the normal amount of synaptic material will be delivered to the terminal and would be inserted into fewer varicosities. This could lead to the ultrastructural differences between mutants and controls that we observed.
A second possible mechanism is that active redistribution of synaptic material takes place so that the location of synapses and active zones is optimized to maintain normal synaptic transmission. In control animals, ∼80% of the total surface area is nonsynaptic and the majority of synapses are <0.5 μm2. If we assume that small synapses are the normal condition, there is no a priori reason to expect that large synapses would be favored over small ones if passive accumulation of synaptic material were the operative mechanism, because there appears to be ample space on the nerve terminal to add small synapses. However, we observe a strong bias toward large synapses in the mutant animals, whereas ∼65% of the terminal surface area remains unoccupied by synapses. Although we cannot directly eliminate the possibility of passive mechanisms or a combination of passive and active mechanisms, the difference in the distribution of synapse size between mutants and controls favors the hypothesis of an active mechanism which ensures that the available synaptic material is concentrated into larger synapses with multiple active zones. Determinants of synaptic ultrastructure are also being studied in other parts of the Drosophila nervous system.Meinertzhagen (1994) found in the Drosophila retina that cell enlargement caused an increase in the number of synapses formed.
A final possiblity is that the adhesive properties of Fas II can directly regulate synaptic size. We have no direct evidence to argue for or against this possibility at the present time, but there is no indication that the association of pre- and postsynaptic membranes has been disrupted in the mutant animals. We saw no obvious difference in spacing between membranes at the synaptic cleft, and other structural aspects of the terminals appeared normal. Therefore, we feel this possibility is unlikely. Nevertheless, if Fas II were to positively regulate the number of varicosities and negatively regulate synapse size, a tight homeostatic feedback loop would be established whereby varicosity number and synapse size are inversely related.
Homeostasis of synaptic transmission
The main finding of the present study is that if the number of nerve terminal varicosities is genetically restricted, the remaining varicosities can support normal synaptic transmission. A reduction in synaptic strength does not occur with the reduction in nerve terminal morphology. It appears that ultrastructural parameters can be changed to increase synaptic efficacy from a restricted number of varicosities. These results suggest that synaptic transmission can be regulated in a homeostatic manner. This, in turn, implies that for this system a critical level of basal synaptic transmission exists. Similar conclusions have been drawn from experiments on vertebrate NMJs which show, in some cases, an inverse relationship between the amount of transmitter released per unit length of terminal and total terminal length for muscle fibers of the same size (Nudell and Grinnell, 1982). If a motoneuron’s target field is experimentally reduced, synaptic efficacy is strengthened initially, but then it returns to normal levels, also suggesting that the level of synaptic strength is carefully controlled (Herrera and Grinnell, 1985) (for review, seeGrinnell, 1995). For central neurons, this point is supported by the work of Liu and Tsien (1995), who showed that the synaptic efficacy of individual boutons making synapses onto hippocampal neurons is inversely correlated with the density of active synapses on the target cell.
How a critical level of synaptic transmission may be set remains unknown; it could be through cell-autonomous mechanisms, feedback mechanisms, or a combination. Retrograde signaling is thought be an important determinant of synaptic physiology in many systems (McNaughton, 1993; Connor and Smith, 1994; Davis and Murphey, 1994). The role of cell adhesion molecules in intracellular signaling is also under investigation (Doherty and Walsh, 1994). Good evidence of retrograde feedback from muscle to nerve in crustacean systems comes from the study by Lnenicka and Mellon (1983). They showed that, because of an increase in quantal content at active sites, EJP amplitude remained constant during growth despite a fivefold increase in muscle fiber diameter and a 21-fold decrease in mEJP amplitude. They further showed that if the normal growth of the muscle fiber was experimentally reduced, EJP amplitude was not different from control fibers. These results suggest that the muscle fiber is capable of controlling synaptic strength and that transmission is maintained at a critical level. Current evidence from Drosophila and other systems supports the concept that synaptic transmission tends to be maintained at a level appropriate for a particular synapse.
Footnotes
The financial support of the Natural Sciences and Engineering Research Council of Canada, through grants to H.L.A. and a studentship to B.A.S., is gratefully acknowledged. We thank M. Hegström-Wojtowicz for technical help, Dr. L. Marin for help with electron microscopy, Mr. A. Shayan for help with photography and reconstructions, and Drs. R. Cooper, M. Msghina, and G. Davis for comments on this manuscript. H.L.A. is a member of the Medical Research Council of Canada Group in Nerve Cells and Synapses, University of Toronto.
Correspondence should be addressed to Dr. Harold L. Atwood, Department of Physiology, 1 King’s College Circle, Medical Sciences Building, University of Toronto, Toronto, Ontario, Canada M5S 1A8.
Dr. Stewart’s present address: Department of Molecular and Cellular Physiology, Stanford University, Stanford, CA 94305.
REFERENCES
- 1.Atwood HL, Govind CK, Wu C-F. Differential ultrastructure of synaptic terminals on ventral longitudinal abdominal muscles in Drosophila larvae. J Neurobiol. 1993;24:1008–1024. doi: 10.1002/neu.480240803. [DOI] [PubMed] [Google Scholar]
- 2.Bailey CH, Kandel ER. Structural changes accompanying memory storage. Annu Rev Physiol. 1993;55:397–426. doi: 10.1146/annurev.ph.55.030193.002145. [DOI] [PubMed] [Google Scholar]
- 3.Budnik V, Zhong Y, Wu C-F. Morphological plasticity of motor axons in Drosophila mutants with altered excitability. J Neurosci. 1990;10:3754–3768. doi: 10.1523/JNEUROSCI.10-11-03754.1990. [DOI] [PMC free article] [PubMed] [Google Scholar]
- 4.Connor EA, Smith MA. Retrograde signalling in the formation and maintenance of the neuromuscular junction. J Neurobiol. 1994;25:722–739. doi: 10.1002/neu.480250611. [DOI] [PubMed] [Google Scholar]
- 5.Cooper RL, Marin L, Atwood HL. Synaptic differentiation of a single motor neuron: conjoint definition of transmitter release, presynaptic calcium signals, and ultrastructure. J Neurosci. 1995a;15:4209–4222. doi: 10.1523/JNEUROSCI.15-06-04209.1995. [DOI] [PMC free article] [PubMed] [Google Scholar]
- 6.Cooper RL, Stewart BA, Wojtowicz JM, Wang S, Atwood HL. Quantal measurement and analysis methods compared for crayfish and Drosophila neuromuscular junctions, and rat hippocampus. J Neurosci Methods. 1995b;61:67–78. doi: 10.1016/0165-0270(95)00024-o. [DOI] [PubMed] [Google Scholar]
- 7.Cooper RL, Winslow JL, Govind CK, Atwood HL (1996) Synaptic structural complexity as a factor enhancing probability of calcium-mediated transmitter release. J Neurophysiol, in press. [DOI] [PubMed]
- 8.Davis GW, Murphey RK. Long-term regulation of short-term transmitter release properties: retrograde signalling and synaptic development. Trends Neurosci. 1994;17:9–13. doi: 10.1016/0166-2236(94)90028-0. [DOI] [PubMed] [Google Scholar]
- 9.del Castillo J, Katz B. Quantal components of the end-plate potential. J Physiol (Lond) 1954;124:560–573. doi: 10.1113/jphysiol.1954.sp005129. [DOI] [PMC free article] [PubMed] [Google Scholar]
- 10.Doherty P, Walsh FS. Signal transduction events underlying neurite outgrowth stimulated by cell adhesion molecules. Curr Opin Neurobiol. 1994;4:49–55. doi: 10.1016/0959-4388(94)90031-0. [DOI] [PubMed] [Google Scholar]
- 11.Edwards FA. Anatomy and electrophysiology of fast central synapses lead to a structural model for long-term potentiation. Physiol Rev. 1995;75:759–787. doi: 10.1152/physrev.1995.75.4.759. [DOI] [PubMed] [Google Scholar]
- 12.Grenningloh G, Rehm EJ, Goodman CS. Genetic analysis of growth cone guidance in Drosophila : Fasciclin II functions as a neuronal recognition molecule. Cell. 1991;67:45–57. doi: 10.1016/0092-8674(91)90571-f. [DOI] [PubMed] [Google Scholar]
- 13.Grinnell AD. Dynamics of nerve muscle-interaction in developing and mature neuromuscular junctions. Physiol Rev. 1995;75:789–834. doi: 10.1152/physrev.1995.75.4.789. [DOI] [PubMed] [Google Scholar]
- 14.Herrera AA, Grinnell AD. Effects of changes in motor unit size on transmitter release at the frog neuromuscular junction. J Neurosci. 1985;5:1896–1900. doi: 10.1523/JNEUROSCI.05-07-01896.1985. [DOI] [PMC free article] [PubMed] [Google Scholar]
- 15.Jessell TM, Kandel ER. Synaptic transmission: a bidirectional and self-modifiable form of cell-cell communication. Cell. 1993;72:1–30. doi: 10.1016/s0092-8674(05)80025-x. [DOI] [PubMed] [Google Scholar]
- 16.Johansen J, Halpern ME, Keshishian H. Axonal guidance and the development of muscle fiber-specific innervation in Drosophila embryos. J Neurosci. 1989;9:4318–4332. doi: 10.1523/JNEUROSCI.09-12-04318.1989. [DOI] [PMC free article] [PubMed] [Google Scholar]
- 17.Katz B, Miledi R. The effect of calcium on acetylcholine release from motor nerve terminals. Proc R Soc Lond (Biol) 1965;161:496–503. doi: 10.1098/rspb.1965.0017. [DOI] [PubMed] [Google Scholar]
- 18.Katz PS, Kirk MD, Govind CK. Facilitation and depression at different branches of the same motor axon: evidence for presynaptic differences in release. J Neurosci. 1993;13:3075–3089. doi: 10.1523/JNEUROSCI.13-07-03075.1993. [DOI] [PMC free article] [PubMed] [Google Scholar]
- 19.Keshishian H, Chiba A, Chang TN, Halfon MS, Harkins EW, Jarecki J, Wang L, Anderson M, Cash S, Halpern ME, Johansen J. Cellular mechanisms governing synaptic development in Drosophila melanogaster . J Neurobiol. 1993;24:757–787. doi: 10.1002/neu.480240606. [DOI] [PubMed] [Google Scholar]
- 20.Korn H, Mallet A, Triller A, Faber DS. Transmission at a central inhibitory synapse. II. Quantal description of release, with a physical correlate for binomial n. J Neurophysiol. 1982;48:679–707. doi: 10.1152/jn.1982.48.3.679. [DOI] [PubMed] [Google Scholar]
- 21.Kuno M, Turkanis S, Weakly JN. Correlation between nerve terminal size and transmitter release at the neuromuscular junction of the frog. J Physiol (Lond) 1971;213:545–556. doi: 10.1113/jphysiol.1971.sp009399. [DOI] [PMC free article] [PubMed] [Google Scholar]
- 22.Kurdyak P, Atwood HL, Stewart BA, Wu C-F. Differential physiology and morphology of motor axons to ventral longitudinal muscles in larval Drosophila . J Comp Neurol. 1994;350:463–472. doi: 10.1002/cne.903500310. [DOI] [PubMed] [Google Scholar]
- 23.Lin DM, Goodman CS. Ectopic and increased expression of Fasciclin II alters motoneuron growth cone guidance. Neuron. 1994;13:507–523. doi: 10.1016/0896-6273(94)90022-1. [DOI] [PubMed] [Google Scholar]
- 24.Lin DM, Fetter RD, Kopczynski C, Grenningloh G, Goodman CS. Genetic analysis of Fasciclin II in Drosophila : defasciculation, refasciculation, and altered fasciculation. Neuron. 1994;13:1055–1069. doi: 10.1016/0896-6273(94)90045-0. [DOI] [PubMed] [Google Scholar]
- 25.Lisman JE, Harris KM. Quantal analysis and synaptic anatomy—integrating two views of hippocampal plasticity. Trends Neurosci. 1993;16:141–147. doi: 10.1016/0166-2236(93)90122-3. [DOI] [PubMed] [Google Scholar]
- 26.Liu G, Tsien RW. Properties of synaptic transmission at single hippocampal synaptic boutons. Nature. 1995;375:404–408. doi: 10.1038/375404a0. [DOI] [PubMed] [Google Scholar]
- 27.Lnenicka GA, Mellon DeF DeF. Transmitter release during normal and altered growth of identified muscle fibers in crayfish. J Physiol (Lond) 1983;345:285–296. doi: 10.1113/jphysiol.1983.sp014978. [DOI] [PMC free article] [PubMed] [Google Scholar]
- 28.Lüthi A, Laurent JP, Figurov A, Muller D, Schachner M. Hippocampal long-term potentiation and neural cell adhesion molecules L1 and NCAM. Nature. 1994;372:777–779. doi: 10.1038/372777a0. [DOI] [PubMed] [Google Scholar]
- 29.Mallart A. Calcium dependent modulation of the facilitation of transmitter release at neuromuscular junctions of Drosophila . J Physiol (Paris) 1993;87:83–88. doi: 10.1016/0928-4257(93)90002-b. [DOI] [PubMed] [Google Scholar]
- 30.Mayford M, Barzilai A, Keller F, Schacher S, Kandel ER. Modulation of an NCAM-related adhesion molecule with long-term synaptic plasticity in Aplysia . Science. 1992;256:638–644. doi: 10.1126/science.1585176. [DOI] [PubMed] [Google Scholar]
- 31.McNaughton BL. The mechanism of expression of long-term enhancement of hippocampal synapses: current issues and theoretical applications. Annu Rev Physiol. 1993;55:375–396. doi: 10.1146/annurev.ph.55.030193.002111. [DOI] [PubMed] [Google Scholar]
- 32.Meinertzhagen IA. The early causal influence of cell size upon synaptic number: the mutant gigas of Drosophila . J Neurogenet. 1994;9:157–176. doi: 10.3109/01677069409167277. [DOI] [PubMed] [Google Scholar]
- 33.Nudell BM, Grinnell AD. Inverse relationship between transmitter release and terminal length in synapses on frog neuromuscular fibers of uniform input resistance. J Neurosci. 1982;2:216–224. doi: 10.1523/JNEUROSCI.02-02-00216.1982. [DOI] [PMC free article] [PubMed] [Google Scholar]
- 34.Propst JW, Ko C-P. Correlations between active zone ultrastructure and synaptic function studied with freeze-fracture of physiologically identified neuromuscular junctions. J Neurosci. 1987;7:3654–3664. doi: 10.1523/JNEUROSCI.07-11-03654.1987. [DOI] [PMC free article] [PubMed] [Google Scholar]
- 35.Seabrooke GR, Duce IR, Irving SN. Spontaneous and evoked quantal release at the neuromuscular junction of the larval housefly, Musca domestica . Pflügers Arch. 1989;414:44–51. doi: 10.1007/BF00585625. [DOI] [PubMed] [Google Scholar]
- 36.Sink H, Whitington PM. Location and connectivity of abdominal motoneurons in the embryo and larva of Drosophila melanogaster . J Neurobiol. 1991;22:298–311. doi: 10.1002/neu.480220309. [DOI] [PubMed] [Google Scholar]
- 37.Stewart BA, Atwood HL, Renger JJ, Wang J, Wu C-F. Improved stability of Drosophila larval neuromuscular preparations in haemolymph-like physiological solutions. J Comp Physiol [A] 1994;175:179–191. doi: 10.1007/BF00215114. [DOI] [PubMed] [Google Scholar]
- 38.Sweeney ST, Broadie K, Keane J, Niemann H, O’Kane CJ. Targeted expression of tetanus toxin light chain in Drosophila specifically eliminates synaptic transmission and causes behavioral defects. Neuron. 1995;14:341–351. doi: 10.1016/0896-6273(95)90290-2. [DOI] [PubMed] [Google Scholar]
- 39.Usherwood PNR. Spontaneous miniature potentials from insect muscle fibers. J Physiol (Lond) 1963;169:149–160. doi: 10.1113/jphysiol.1963.sp007246. [DOI] [PMC free article] [PubMed] [Google Scholar]
- 40.Washio HM, Inouye ST. The effect of calcium and magnesium on the spontaneous release of transmitter at insect motor nerve terminals. J Exp Biol. 1978;75:101–112. doi: 10.1242/jeb.75.1.101. [DOI] [PubMed] [Google Scholar]
- 41.Wang J, Renger JJ, Griffith LC, Greenspan RJ, Wu C-F. Concomitant alterations of physiological and developmental plasticity in Drosophila CaM kinase II-inhibited synapses. Neuron. 1994;13:1373–1384. doi: 10.1016/0896-6273(94)90422-7. [DOI] [PubMed] [Google Scholar]
- 42.Zhong Y, Shanley J. Altered nerve terminal arborization and synaptic transmission in Drosophila mutants of cell adhesion molecule Fasciclin I. J Neurosci. 1995;15:6679–6687. doi: 10.1523/JNEUROSCI.15-10-06679.1995. [DOI] [PMC free article] [PubMed] [Google Scholar]
- 43.Zhong Y, Budnik V, Wu C-F. Synaptic plasticity in Drosophila memory and hyperexcitable mutants: role of cAMP cascade. J Neurosci. 1992;12:644–651. doi: 10.1523/JNEUROSCI.12-02-00644.1992. [DOI] [PMC free article] [PubMed] [Google Scholar]


