

Abstract
The responses of projection neurons in the antennal lobe of the locust brain (the functional analog of mitral–tufted cells in the vertebrate olfactory bulb) to natural blends and simple odors were studied with multiple intra- and extracellular recordings in vivo. Individual odors evoked complex temporal response patterns in many neurons. These patterns differed across odors for a given neuron and across neurons for a given odor, but were stable for each neuron over repeated presentations (separated by seconds to minutes) of the same odor. The response of individual neurons to an odor was superimposed on an odor-specific coherent oscillatory population activity. Each neuron usually participated in the coherent oscillations during one or more specific epochs of the ensemble activity. These epochs of phase locking were reliable for each neuron over tens of repeated presentations of one odor. The timing of these epochs of synchronization differed across neurons and odors. Correlated activity of specific pairs of neurons, hence, generally occurred transiently during the population response, at times that were specific to these pairs and to the odor smelled. The field potential oscillations, therefore, fail to reveal a progressive transformation of the synchronized ensemble as the response to the odor unfolds. We propose that (1) odors are represented by spatially andtemporally distributed ensembles of coherently firing neurons, and (2) the field potential oscillations that characterize odor responses in the olfactory system occur, at least in this animal, in parallel with a slower dynamic odor representation.
Keywords: locust, olfaction, coding, cross-correlation, synchronization, oscillation
Natural odors (such as plant fragrances) usually are complex blends of many volatile compounds. The percept that a natural fragrance evokes in us, however, is usually singular (e.g., jasmine, onion, or a skunk). Our brains, therefore, most likely form a unique internal representation of each specific blend from which individual components (such as amylacetate or heptanone) are difficult or impossible to segment. This specific odor representation, in addition, must be sufficiently inclusive to allow like odors (e.g., roses of distinct varieties, or roses smelt in different climatic conditions) to be “recognized” as the same. Finally, this representation must be stable over time; odor memories generally are very long-lasting (Hildebrand, 1995).
A major challenge in the study of olfaction is to understand the computational rules or algorithms used by the brain to encode, store, and retrieve these complex and multidimensional stimuli. Recent remarkable developments in the molecular biology of vertebrate olfaction have shed light on some crucial aspects of the “mapping” of odor signals in the olfactory bulb (Buck and Axel, 1991; Vassar et al., 1994; Axel, 1995; Sullivan et al., 1995). These results complement physiological and imaging studies of odor processing that indicate broad, distributed stimulus representation schemes (Kauer, 1991;Cinelli et al., 1995). Other recent results from physiological studies of molluscan and insect olfaction indicate that the olfactory nervous system of several invertebrates generates oscillations (Gelperin and Tank, 1990; Delaney et al., 1994; Laurent and Naraghi, 1994), a macroscopic feature similar to one described previously in the olfactory brain of vertebrates (Libet and Gerard, 1939; Adrian, 1942;Freeman, 1975, 1978; Gray and Skinner, 1988; Satou, 1990; Gray, 1994). These results, combined with anatomical evidence that arthropod, molluscan, and vertebrate olfactory circuits have very similar designs, suggest that the computational rules used by olfactory systems may be similar (or conserved) across animal phyla.
We focus here on odor processing in the olfactory nervous system of an insect, the locust Schistocerca americana, and examine the properties of individual and ensembles of neurons in response to odor presentation in vivo, continuing the studies of Laurent and Naraghi (1994) and Laurent and Davidowitz (1994). These neurons are the antennal (or olfactory) lobe projection neurons (PNs) whose signals are sent to the mushroom body, a center for learning and memory (Davis, 1993; Hammer and Menzel, 1995). The PNs, thus, are the functional analog of the mitral–tufted cells in the vertebrate olfactory bulb. In this paper, we examine in detail the potential role of time as a variable in the combinatorial representation of sensory stimuli by this part of the brain. We focus on processing of odors to which the animal has been exposed, i.e., we do not consider here the responses evoked by the first one to three presentations of an unfamiliar odor. We find that the temporal firing patterns of individual neurons, as well as the synchronization of firing across groups of neurons, are stimulus specific. In other words, each odor appears to be represented not simply by an ensemble of synchronized neurons but by a progressive and odor-specific transformation of that ensemble, so that each neuron synchronizes with several others only during one or more precise epochs of the ensemble response. We, thus, propose that oscillations in the olfactory nervous system occur, at least here, in parallel with a slower code that is distributed both in time and across many neurons.
MATERIALS AND METHODS
The preparation. Adult locusts were immobilized and dissected as described in Laurent and Naraghi (1994) and Laurent and Davidowitz (1994). The following modifications were applied to the experimental protocol used in this study (see Figs. 5, 6, 7). The gut was left intact, and the head was only intermittently (rather than continuously) superfused with locust physiological saline containing (in mm): 140 NaCl, 5 KCl, 5 CaCl2, 4 NaHCO3, 1 MgCl2, and 6.3 HEPES, pH 7.0.
Fig. 5.

Simultaneous recordings of activity from three PNs and the ipsilateral mushroom body, showing directly the complex and odor-dependent temporal activity patterns. Top trace is the LFP. Traces 2–4 from top are raw extracellular recordings from the three PNs. Traces 5–7 are the raster plots created from traces 2–4 (see Materials and Methods for details) used for data analysis. Traces 8–10 are poststimulus–time histograms created for each PN from n presentations of the same odor (ngiven on right of each bottom trace). Bottom trace, Odor pulse (1 sec). A–D, Data recorded and analyzed in the same conditions and from the same three PNs in response to 4 different odors (of 11 sampled alone and 3 binary combinations). Note the differing temporal response patterns of the three neurons for each odor, and of each neuron for the four odors. Note also the long period of coactivity of PNs 1 and 2 (1.5 sec) in response to strawberry (A).
Fig. 6.

The timing of the synchronization between individual PNs and the field potential oscillations is neuron and odor specific. Cross-correlations calculated between the field potential and each of the three PNs recorded in Figure 5 for responses to strawberry odor (see Materials and Methods for details on color scales). Eachpanel is an average calculated over 27 presentations of the odor. The cross-correlation patterns displayed here, therefore, are consistent over repeated presentations of the same stimulus. Note that the time periods at which each of the three neurons synchronize with the LFP differ and sometimes partially overlap (PN1, 2: A,B; PN1, 3: A, C), indicating that these neuron pairs probably synchronize during these periods (see Fig.7).
Fig. 7.

Synchronized oscillations in pairs of PNs are odor specific and restricted to small temporal windows during the ensemble response. Each panel (A–C) plots the cross-correlation calculated pairwise (PN 1 × 2 in A; 2 × 3 in B; 1 × 3 in C) with a sliding-window method (see Materials and Methods) between the spike trains of the three PNs in Figure 5, in response to strawberry. (Same data files as those used for Fig. 6.) This cross-correlation, thus, is based on action potential data only, and not on intracellularly recorded subthreshold activity, as was shown in Laurent and Davidowitz (1994). It is based here, therefore, on the true axonal output of the PNs during an odor response, but it is calculated using the data accumulated over 27 successive presentations [whereas cross-correlations calculated with intracellular data inLaurent and Davidowitz (1994) were based on single odor presentations]. Time lag of the cross-correlation function is alongx-axis, and time along y-axis. The amplitude of the cross-correlation, which here represents the number of times spikes from each of the two PNs coincided in the same 10-msec-wide bin, is color coded after the scale given at bottom right. Ared area means that 40, 5, and 15 spike pairs (accumulated from the 27 odor presentations) were found to coincide in this time bin in A, B, and C, respectively. Odor delivered between 1 and 2 sec (light blue bar). Note that strawberry led to a short but clear period of synchronized oscillations in PNs 1 and 2, but that this period was shorter than the time during which both neurons were active (Fig. 5A, poststimulus–time histograms). Two neurons, therefore, are not necessarily synchronized when they both fire in response to an odor. Note also that strawberry led to no visible synchronized activity in neurons 2 and 3 (B), but that it did lead to coactivity of neurons 1 and 3 (although less tightly synchronized than that between neurons 1 and 2, A) 2 sec after the odor-pulse onset (C). A neuron, therefore, can synchronize with several others, but at different times during an odor response.
Olfactory stimulation. The open ends of a set of 11 glass capillaries or Teflon-coated steel tubes (0.5 mm inner diameter) were placed 2.5–5.0 cm from the antenna, angled so that they converged onto the antenna. The other end of each capillary was connected via polyethylene tubing to a 5 ml odorant-containing syringe body. Each chamber contained a 1 cm2 piece of filter paper on which was deposited 20 μl of one of the following odors: cherry, citrus, strawberry (Bell Flavor and Fragrances, Northbrook, IL); isoamylacetate, citral, cineole, citralva (Aldrich, Milwaukee, WI); spearmint, peppermint (Flavco); apple (Gilbertie’s Herb Gardens); lilac, lavender (Nuit Unlimited); eugenol, 2-heptanone (Sigma, St. Louis, MO); crushed spinach and wheat leaves or no odorant (control). The chambers were connected to an air pressure injection system via a set of valves so that electronically controlled gentle pressure pulses (insufficient to visibly bend the antenna) could be delivered to the animal. For three of the odor lines, pressure pulses were regulated individually. Pressure-actuated check valves were interposed between the odorant chamber and the animal to prevent passive diffusion of odorant. For the other odor lines, a common pressure line was connected to each odor chamber in parallel. Odors were mixed by applying a simultaneous pressure pulse to each of the selected odor lines. For these experiments, pulses of 1 sec duration were delivered at a minimum interval of 10 sec. Although odor delivery to the antenna always was delayed relative to the command pulse to the air valves (because of the physical nature of the stimulus), the delay between command and delivery was constant from trial to trial. This could be demonstrated simply by averaging successive local field potential (LFP) traces evoked by the delivery of an odorant and locked on the stimulus pulse. In all cases, this produced a clear average field potential signal (one small oscillation cycle or two damped oscillation cycles) at a time corresponding to the onset of the response of any one of the successive trials. (Because the field potential is not a pure and constant periodic signal, however, the average calculated from the oscillation cycles occurring after the first or second one was flat.) The delay between command and delivery also was shown to be constant with the use of a particle velocity microphone.
Intracellular recordings (see Figs. 1, 2, 3, 4). Glass microelectrodes (90–150 MΩ), pulled with a vertical puller (Kopf, Tujunga, CA) and filled with 2–3 m K-acetate, were used to record from the soma of PNs in the antennal lobes, using established techniques (Laurent and Davidowitz, 1994). The antennal lobe contains two types of neurons: local and projection neurons. The antennal lobe local neurons in locusts produce no conventional action potentials but rather TTX-resistant “spikelets” of variable amplitudes, probably caused by voltage-dependent calcium currents (Laurent and Davidowitz, 1994; Laurent and Naraghi, 1994). Neurons, thus, could be identified easily as local or PNs from physiological recordings. Some intracellular fills (using cobalt hexamine, seeLaurent and Naraghi, 1994) also were carried out for confirmation.
Fig. 1.
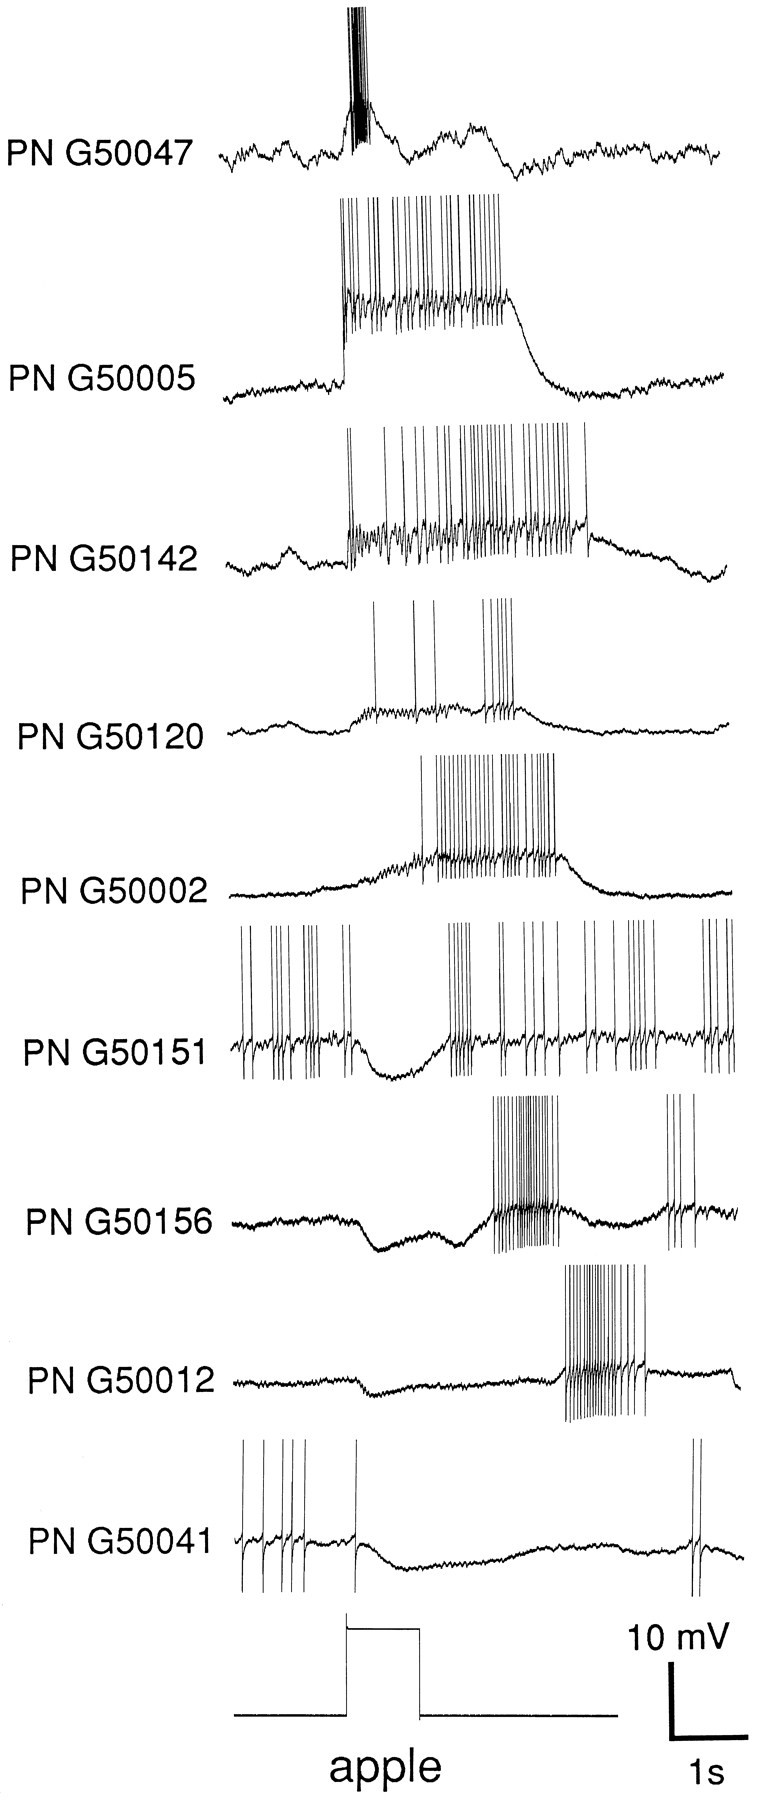
Range of temporal patterns of response to a single odor across neurons. Temporal response patterns of nine different antennal lobe PNs in response to the odor apple. The recordings (all intracellular) were performed sequentially in the same animal over a 3.5 hr period. Traces have been aligned on the odor pulse. (Action potentials clipped.) Note the distribution of response patterns, from short and brisk (trace 1), to prolonged (2,3), delayed firing (4, 5), multiphasic (6–8), and purely inhibitory (9). Note also the subthreshold membrane potential oscillations underlying the periodicity of firing (most noticeable in traces 3–5). These response patterns were consistent for each neuron over tens of responses (see Fig. 2). Not all neurons that responded to this odor, therefore, were active at the same time. Rather, the ensemble response was distributed in time.
Fig. 2.

Consistency of response patterns and odor specificity. A, Two PNs (PN 1, 2) were impaled intracellularly and recorded at the same time as the mushroom body LFP. A pulse of 2-heptanone (pear-like smell) was presented once (t), and presented again 3 min later (t + 3 min). The recordings obtained for these two responses have been aligned on the odor pulse. They demonstrate the consistency of the temporal response patterns over repeated presentations. Note that during the period of the odor response when neither neuron fires, the LFP nevertheless displays oscillations, indicating the existence of other neurons (data not shown) that fired synchronously at that time.B, Odor specificity of the response patterns. PNs usually respond to multiple odors. The response patterns evoked by these multiple odors, however, are generally different. Here, a PN is shown that responded both to spearmint and to citrus odors, but with clearly and consistently different temporal patterns. The traces have been aligned on the odor pulses.
Fig. 3.

Phase representation of PN activity during odor responses (“key” for Fig. 4). The activity of PNs was monitored intracellularly simultaneous with the LFP in the ipsilateral mushroom body (top). The period representing the odor response (the period during which 20 Hz LFP oscillations occurred, after a 1 sec odor pulse) was divided in 12 sequential windows or epochs (shaded areas 1, 2 … ). The phase of all of the action potentials (relative to their respective LFP oscillation cycle) occurring in each epoch then was measured and plotted. The positive peak of the oscillation was defined as 0. The phase of each spike so measured then was represented on a raster (rows 1–23 here), between −π and π (middle). Row 1, for example, plots the phase of the eight spikes that occurred in epoch 4 of the odor-evoked activity for odor presentation 1. Each epoch contained several cycles of the LFP oscillation. The odor pulse was presented to the animal 23 times at 10 sec intervals. Each row (1–23) thus represents the phase of the spikes that occurred in the corresponding epoch (4 here) for each of the 23 presentations. Finally, all rows were summed to create a phase-frequency plot (#, bottom row), which represents the relative frequency of each phase bin (bin width: 2π/32). The peaky structure of this histogram indicates periodic firing of this PN at this time of the response (epoch 4) and shows the mean phase as well as its statistical variations. This phase plot is taken from real data, plotted in full in Figure 4 (first row).
Fig. 4.
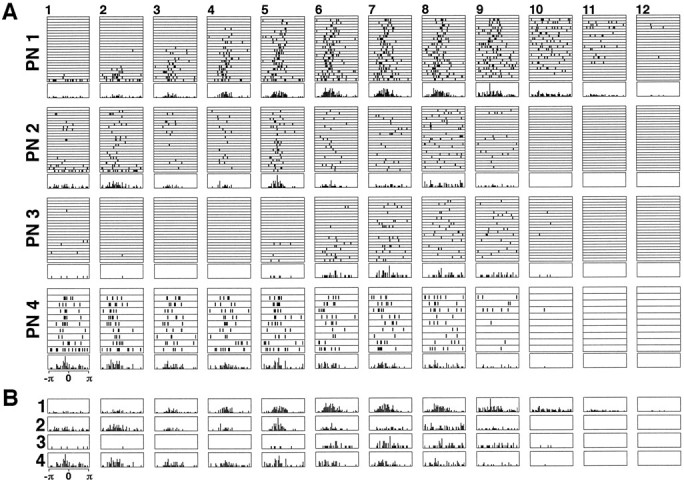
Phase versus time plots representing the odor-evoked activity in four different PNs (PN 1–4), recorded intracellularly, in four different animals. A, Each box has been constructed according to the principles described in Figure 3 and, thus, represents a different epoch of the ensemble response. The phase-locking behavior of each PN, thus, can be followed as the population response unfolds between epochs 1 and 12. PN 1, for example, fired little at the beginning of the population response (epochs 1, 2), phase-locked to the LFP oscillation during epochs 3–8, and continued firing, but in a nonperiodic fashion (epochs 9–11), until the end of the ensemble response (monitored by the LFP oscillation). Number of successive odor presentations (rows): PN 1, 23; PN 2, 24; PN 3, 22; PN 4, 9. B, The phase-frequency histograms from all four PNs inA have been juxtaposed to illustrate the following important points. (1) When PNs phase lock to the field potential, they do so at the same average phase (see epochs 5, 6 across PNs for example). (2) Any pair of PNs will phase-lock and oscillate at different times and for different durations over the ensemble response. (3) The temporal structure of phase locking of individual neurons is stable over repeated presentations of the odor. Indeed, PN 1 always phase-locked during epochs 7 and 8, and PN 2 during epoch 5. Therefore, not only do PNs display reliable temporal firing patterns in response to odors, but the periods of time during which they phase-lock with other PNs (or the field potential) are stable (for a given odor at a given concentration).
Extracellular recordings (see Figs. 5, 6, 7). Extracellular recordings were performed using two to six glass microelectrodes pulled with a horizontal puller (Sutter, Novato, CA). Electrodes for LFP recordings had ∼2 μm tips with a DC resistance of <1 MΩ. Electrodes for single-unit extracellular recording had 0.5–1.0 μm tips with a DC resistance of 1–2 MΩ. Both types of electrodes were filled with locust physiological saline. LFP signals were amplified differentially, band-pass filtered (1–500 Hz), “notch filtered” at 60 Hz (A-M Systems 1700), and stored to digital audio tape (DAT) (Micro Data) (5.5 kHz cutoff). The DAT recorder included an analog Nyquist-frequency low-pass filtering stage before analog-to-digital conversion. Some single-unit extracellular signals were amplified and stored in this manner, with band-pass filtering at 10 Hz to 5 kHz. Other single-unit extracellular signals were amplified using an Axoclamp 2A amplifier (Axon Instruments, Foster City, CA) before storage to DAT. Each PN recording was obtained with an individual extracellular electrode (up to five simultaneously), as was the LFP. No spike sorting was carried out with any of the extracellular single-unit data presented here.
Off-line analysis. The data analyzed and presented here were obtained from animals previously exposed to the odors tested. In other words, we do not consider here the first one to three responses of neurons to unfamiliar odors. Data were redigitized from DAT at 5 kHz (National Instruments; LabVIEW software and NBMIO16L hardware) after AC amplification and low-pass filtering at 3 kHz (Brown Lee Precision 210A amplifier). LFPs were band-pass filtered digitally (5–50 Hz) using MATLAB (The MathWorks) on an Apple Macintosh Quadra 840AV. Single-unit extracellular signals were converted to lists of spike times (rounded to the nearest millisecond) using a threshold discriminator algorithm and confirmed by visual inspection (LabVIEW). Peristimulus–time histograms were constructed by averaging blocks of trials aligned on the odor-pulse command and using bins of 150 msec.
Phase analysis (see Figs. 3, 4). PN spike times were converted to a phase representation with respect to the odor-induced LFP oscillations. Raw LFP traces were band-pass filtered (10–50 Hz) using a “noncausal” digital five-pole Butterworth filter. Peaks, troughs, and zero crossings of the LFP signal were used as phase reference points as follows: peaks of the LFP were assigned a phase of 0 or 2 π; troughs, a phase of π; and zero crossings, a phase of π/2 or 3π/2. The time of a PN spike (tPNspike) then was compared with the nearest peak (tLFPpeak), trough, and/or zero crossing in the simultaneously recorded LFP and assigned a phase by linear interpolation. The phase was calculated by interpolating either between peaks (whole cycle), between nearest peak and trough (half cycle), or between nearest zero crossing and nearest peak or trough (quarter cycle). For example, using the whole-cycle method, the phase of a PN spike was given by:
Phase histograms obtained using these three methods did not differ qualitatively from each other.
Sliding-window cross-correlation analysis (see Figs. 6, 7).Cross-correlation analysis was performed using MATLAB. After converting simultaneously recorded PN traces to rasters (see Fig. 5), pairwise cross-correlation analysis was performed on the rasters on 300 msec windows beginning 1 sec before the onset of the odor pulse and ending 3 sec after the end of the odor pulse (10 msec bins). The first 300 msec window then was slid forward by 100 msec, and a new cross-correlation analysis was performed on the new (overlapping) window. This procedure was carried out with the entire data set. The cross-correlation calculated on each window, thus, could be represented as a row in a matrix in which each column represents a specific time lag of the cross-correlation and each row, a successive time window around the odor pulse. If an odor was presented several times [at 10 (or more) sec intervals], this analysis was performed for each trial and the cross-correlation matrices calculated for all the trials were aligned to the odor pulse and added together. The magnitude of the cross-correlation then was represented using a cool-to-warm color scale, normalized over the entire data set. Thus, a dark blue region (see Fig. 7) indicates that there were no spikes in either PN at that time and time lag. A red region indicates that over all the trials, spikes coincided often at that time lag and time of the trial. The actual number of coincident spikes encoded by red is indicated next to the color scale bar (see Fig. 7). This number (e.g., 15) indicates the number of spikes that each PN fired in the corresponding bin. In an initial attempt to test the significance of periodic patterns in the cross-correlograms, we divided the data for each experiment in several subsets (e.g., from an experiment containing 26 trials: odd trials 1, 3 … 25 in one subset and even trials 2, 4 … 26 in another, or two complementary subsets of 13 randomly selected trials in the entire set) and calculated the cross-correlation on each subset independently, as described above. Any spurious correlation between the two cells analyzed appeared as nonmatching cross-correlation patterns in the different subsets. By contrast, any pair of cell with consistent cross-correlation patterns from subset to subset was considered to show a significant degree of stimulus-induced correlation. In all cases in which this occurred, the cross-correlograms indicated a periodicity identical to that of the corresponding LFP. Cells displaying such cross-correlations were considered synchronized (although it is clear that synchrony does not require periodic firing). In a second series of tests, synthetic data sets were produced to mimic the experimental data, except for periodicity and correlation. Trains of “spikes” for which timing was described by Poisson statistics and for which average frequency matched precisely the experimental data were produced. These synthetic data then were processed in a manner identical to the experimental data, and periodic cross-correlation patterns were sought. Never did any periodic pattern such as those described for the experimental data emerge from these synthetic data sets. The existence of periodic cross-correlations patterns in the data, thus, are not the result of coincident increase in the firing rates of the neuron pairs. A rigorous analysis of the statistics of the experimental data is being carried out presently (M. Wehr and G. Laurent, unpublished observations) and will be published separately.
Pairwise sliding-window cross-correlation analysis also was performed between the rasters of each PN and the simultaneously recorded LFP in the mushroom body (see Fig. 6). Raw LFP traces were band-pass filtered (10–50 Hz) using a “noncausal” (no phase distortion) digital five-pole Butterworth filter. The sliding-window cross-correlation analysis was identical to that described above for pairs of PN rasters. A dark blue region (see Fig. 6) indicates that, on average, there was, at that time of the trial, a trough in the LFP at that time lag relative to a PN spike. Similarly, a red region indicates that, on average, there was, at that time of the trial, a peak in the LFP at that time lag relative to a PN spike. A light blue region indicates that, on average, the LFP was between peak and trough at that time lag relative to a PN spike. A light blue band spanning all time lags at a given time of the trial indicates that no PN spike occurred at that time of the trial. Note that the magnitude of the cross-correlation function assigned to a given color (e.g., red) is here a product of both the LFP amplitude and the coherence between PN spikes and the LFP oscillations. Note also that the magnitude of the cross-correlation between a PN raster and the LFP signal can be positive (red) or negative (dark blue), with zero correlation represented by light blue (see Fig. 6). This is in contrast to the cross-correlation calculated between two PN rasters (see Fig. 7), which was never negative.
RESULTS
Temporal response patterns in projection neurons
The presentation of any odor to the antenna of an animal in vivo typically led to a change in the firing behavior of many PNs in the ipsilateral antennal lobe. The response of each neuron to a stimulus, however, differed from that of other neurons by its duration, its timing relative to the odor delivery, and its temporal structure. Figure 1 shows intracellular recordings from nine different PNs and their responses to an apple scent. All nine neurons were recorded sequentially in the same animal over a 3.5 hr period. Whereas one neuron responded with a short burst of high-frequency action potentials (top trace), others showed a more prolonged depolarization with subthreshold membrane potential oscillations giving rise to sustained (trace 2), occasional, or delayed (traces 3–5) spiking. Others yet responded to the same odor by a period of inhibition (short to long: traces 6–9) preceding delayed spiking. This indicates that if individual odors are represented by an ensemble of neurons, this ensemble is dynamic and that all participating neurons do not participate simultaneously.
The temporal structure of the response of individual PNs to a given odor was consistent and reliable. Figure2A shows the responses of two neurons impaled simultaneously and the LFP in the mushroom body evoked by 1 sec pulses of 2-heptanone. Recordings from each neuron and the field potential were obtained at 3 min intervals and aligned on the odor pulse. Both times, the response of the first projection neuron consisted of a short initial burst of action potentials (riding on a periodic subthreshold pattern synchronized with the field potential), an ∼1 sec period of silence, and a final period of inhibition. Similarly, the response of the second PN consisted, on both occasions, of two bursts of action potentials separated by a period of silence. The duration of the population response in both cases could be estimated from the envelope of the field potential. Note that both neurons were silent during the central part of the population response, although the LFP showed oscillations, indicating synchronized activity of other neurons at that time. The consistency of responses over shorter time intervals also can be seen in another neuron in Figure2B.
Whereas the overall temporal structure of the response of individual neurons was consistent from trial to trial (in identical stimulus conditions), the very fine detail of the response was not. The first PN (Fig. 2A), for example, responded with an action potential at cycles 2, 3, and 5 of the subthreshold oscillatory pattern during the first presentation, but at cycles 1, 3, and 4 of the next presentation, 3 min later. The same variability can be observed between the second bursts of neuron 2. Similarly, knowing the exact sequence of action potentials in one neuron did not allow one to predict what the exact sequence of action potentials in the second neuron would be; the responses of neuron 2 at the onset of the odor pulse were remarkably similar in both cases, whereas they were not for neuron 1. Two neurons, therefore, can be “synchronized” transiently over episodes of 50 to several hundreds of msec, but the occurrence of spiking events during these episodes remained probabilistic. (The fine structure of the synchronization will be further explored below.)
The temporal activity patterns observed in a given neuron in response to an odor stimulus were odor dependent. Individual neurons usually responded to 0 to 4 of the 11 test odors that could be presented to an animal. An example is given in Figure 2B of a neuron that responded to spearmint and citrus fragrances. As can be seen, the response patterns were stable over repeated presentations of each odor, but different for the two odors. Whereas the neuron’s response to spearmint consisted of a short burst of activity, a period of inhibition, and a final, longer burst of action potentials, the response to citrus comprised three blocks of spikes separated by two silent epochs. The central burst of spikes evoked by citrus occurred exactly at the time when the neuron would have been inhibited during its response to spearmint.
Transient odor-specific synchronization between PNs
Knowing that individual neurons show odor-specific firing patterns, we examined next the fine structure and timing of the action potentials evoked during each period of activity. We used the field potential recorded in the mushroom body as a time reference and studied the phase structure of each odor-evoked spike train, i.e., the variations in phase of each action potential (relative to the field potential) over the duration of the response. Consider the hypothetical neuron (PN) in Figure 3. When an odor is presented, the field potential (LFP) shows 20 Hz oscillations (indicating synchronization of a population of neurons) (Laurent and Davidowitz, 1994), and the neuron displays a pattern of action potentials whose structure obeys the macroscopic features described above. We divided the length of the odor-evoked oscillatory response (∼1–3 sec of field potential oscillations for a 1 sec odor pulse) into a series of 12 consecutive windows (or epochs) of equal duration (shaded boxes 1–4). We then considered all the spikes present in each window and calculated their phase relative to their corresponding field potential oscillation cycle. Because the field potential is not a perfect sine wave, we calculated the phase relative to the entire period or to the half period or quarter period and extrapolated linearly (see Materials and Methods). The different methods yielded essentially the same results, and the phases plotted here are calculated relative to the corresponding quarter cycle of the oscillation. Each action potential, thus, was represented by its phase (0 was defined arbitrarily as the peak of the LFP oscillation) in raster plots where each row represented a different trial (Fig. 3, rows 1–23). Each trial was separated from the next by 10 sec. Finally, the events in all the rasters (23 here) were used to generate a phase-frequency histogram (Fig. 3, bottom). In this example, the structure of the histogram indicates that the spikes in this epoch were phase-locked to the field potential.
Using this representation, we could study not only the times during which a given neuron was active in response to an odor, but those during which it was active and synchronized to the oscillating population (and, thus, to other neurons). Figure4A shows phase plots constructed as described above for four different neurons recorded in four different animals. Each row represents one of the four neurons, and each column represents 1 of the 12 consecutive windows or epochs into which the population response was divided. The following features can be extracted:
• Spiking activity during the odor response did not necessarily imply synchronization. PN 1, for example, was clearly synchronized to the field between epochs 3 and 8, but rather suddenly desynchronized between epochs 8 and 10, although it continued firing. Similarly, PN 2 showed very clear synchronization to the field potential only in epochs 2 and 5, although it was active at other times during the odor response.
• The time at which individual neurons synchronized to the field potential was consistent over repeated odor presentations. For example, synchronization always occurred for PN 1 during epoch 7 and for PN 2 during epoch 5.
• From features 1 and 2, it follows that cross-correlation of any two spike trains should only reveal significant periodic synchronization during very specific epochs of the population response. In Figure 4B, the phase-frequency histograms of the four neurons in A have been juxtaposed. One can see, for example, that a cross-correlation of any pair taken from the four neurons should yield a significant periodic function if calculated in epoch 6, but that none would if it were calculated in epochs 1 and 8. This prediction was demonstrated directly in the following set of experiments (Figs. 5, 6).
We recorded the extracellular activity of up to five antennal PNs simultaneously, as well as the field potential in the mushroom body, and presented up to 11 odors to the animal. An example of the response patterns evoked in three PNs by four different odors is shown in Figure5. The poststimulus–time histograms reveal that each odor evoked different response patterns in the three neurons, as shown above for other neurons. Strawberry, for example, evoked an initial increase in the firing rate of PNs 1 and 2, and a decrease in that of PN 3, whereas eugenol initially inhibited all three neurons. The representation used here, however, does not indicate whether any pair of neurons actually oscillated in synchrony during any part of the responses evoked by each odor. We, therefore, calculated the cross-correlation between each PN and the field potential for each odor response. The cross-correlation functions so calculated for the responses evoked by strawberry are seen in Figure 6A–C (see Materials and Methods for details on sliding cross-correlation technique). In these diagrams, the time lag of the cross-correlation function is on thex-axis and time is on the y-axis. The odor was presented between 1 and 2 sec. These plots reveal that each of the three simultaneously recorded neurons phase-locked to the oscillatory field potential at different times around the odor pulse (vertical stripes in cross-correlation displays). This indicates that individual PNs necessarily synchronize to others only for limited durations during their responses to odors. To demonstrate this directly, we calculated the cross-correlation (pairwise) between the spike trains of the three neurons and repeated this analysis for all odors tested. Figure 7 represents these pairwise cross-correlations calculated from the responses to strawberry. This representation reveals immediately that PNs 1 and 2 synchronized briefly and oscillated together for ∼250 msec about half way through the odor pulse (Fig. 7A). This period of synchronization was considerably briefer than the period of coactivity revealed by the poststimulus–time histograms (>1 sec) (Fig. 5A). Cross-correlation between spikes of PNs 2 and 3 revealed no odor-evoked synchronization, whereas cross-correlation between neurons 1 and 3 revealed partial synchronization and coupled periodic firing about 2 sec after the onset of the odor pulse. None of the 11 other odors tested with this animal and these neurons produced any significant oscillatory synchronization between any of the three pairs of neurons (PNs 1–2, 2–3, 1–3). This result demonstrates directly that an individual neuron can synchronize with different neurons at different times during an odor-evoked response, and that each temporal pattern of oscillatory synchronization is odor specific.
DISCUSSION
We demonstrated that odors evoke odor-specific temporal response patterns in PNs in the antennal lobe of the locust, the functional analog of the olfactory bulb of the vertebrate olfactory system. Different neurons responded with different temporal patterns to the same odor, and individual neurons responded with different temporal patterns to distinct odors. (We do not consider in this paper the influence of the concentration of a single odor on the temporal patterns evoked in a single neuron.) In addition, the participation of individual neurons in a synchronized oscillatory ensemble was usually transient, but occurred during one or several precise epochs of an odor response. Repeated presentations of the same odor in the same conditions seconds or minutes later led to the same temporal patterns, and each neuron oscillated in phase with the LFP in the mushroom body during the same epoch of each response. The existence of action potentials in these epochs of synchronization, however, remained probabilistic; in other words, the knowledge of the exactsequence of spikes produced by a neuron in one trial did not allow one to predict the sequence of spikes in the same neuron on the next trial. Finally, our data are not consistent with a phase encoding of sensory stimuli, i.e., a representation in which the delays between the spikes of two neurons, or the phase delays between individual neurons and an average potential (such as the field potential oscillation), vary in a stimulus-specific manner, as suggested in theoretical models of sensory processing (von der Malsburg and Schneider, 1986; Hopfield, 1995). In other words, a neuron was either phase-locked to the field potential during an epoch or it was not. If it was phase-locked, it always fired around a particular phase (Laurent and Davidowitz, 1994). Repeatable and stimulus-specific phase sequences such as those observed in hippocampal place units of rats (O’Keefe and Recce, 1993) were not seen.
Our results are summarized in Figure 8. Here, the PNs are symbolized by an array of 4 × 4 units, which can be in three “states”: silent (which can mean depolarized, but below threshold) or inhibited (white), spiking but not phase-locked to the field potential (blue), spiking and locked to the field potential (orange). Before an odor is presented, a few neurons fire randomly and independently, and the field potential in the mushroom body shows no oscillations (Laurent and Davidowitz, 1994;Laurent and Naraghi, 1994). At the onset of an odor pulse (ton), a group of neurons is activated (blue and orange), some of which only oscillate at 20 Hz and phase-lock to one another, thus giving rise to the field potential oscillation that can be recorded in their target area, the mushroom body. Several 100 msec later (arbitrary time step), however, the ensemble of active neurons differs from what it was earlier. Some neurons that were inactive initially become active, whereas some that were oscillating desynchronize, and yet others only now phase-lock to the oscillating ensemble. The field potential recorded from the mushroom body, although indistinguishable from what it was earlier in its frequency characteristics, therefore is now caused by a new ensemble of synchronized neurons, which overlaps with the starting ensemble. This progressive transformation of the oscillating ensemble occurs in an odor-specific manner, and the number of neurons participating in the oscillation and/or the tightness of their phase locking can vary over the duration of the population response. This leads to variations in the envelope of the field potential, as observed experimentally (Laurent and Naraghi, 1994). When the odor stimulus ends, the ensemble progressively breaks up and the field potential oscillations disappear. We conclude that odor stimuli are represented in the antennal lobes as dynamical ensembles of synchronized and oscillating neurons. These ensembles often make up ∼10–20% of the total complement of neurons (Laurent and Davidowitz, 1994), although their size probably varies with odor concentration, as suggested in other animals by imaging experiments (Cinelli et al., 1995). We, therefore, propose that the macroscopic 20 Hz oscillations are caused by a stimulus-specific message that is distributed in space (the odor-specific sets of synchronized neurons) and in time (the times at which these neurons synchronize and desynchronize, in an odor-specific fashion).
Fig. 8.

Schematic representation of our hypothesis of odor coding in this olfactory system. AL, Antennal lobe;LFP, local field potential; MB, mushroom body;PN, projection neuron. Color code: each smallsphere symbolizes a PN that can be in one of three states, silent or inhibited (white), active (spiking) but not synchronized with the LFP (blue), active and phase-locked with the LFP (orange). The five successivesquares represent the successive states of the system around and during an odor pulse (ton totoff). The LFP oscillations in the mushroom body, therefore, are caused by successive and odor-specific ensembles of synchronized neurons. See Discussion for details.
Practical consequences for the analysis of distributed neuronal representations
The existence of oscillations in an LFP usually is interpreted as implying correlated and phase-locked firing of ensembles of neurons (generally those that terminate and synapse into the area from which the field potential is recorded) (Singer and Gray, 1995). Nothing requires, however, that the oscillating neurons be synchronized over the entire duration of the field potential oscillations (i.e., the population activity). The methods usually employed to study interneuronal synchronization, however, often assume implicitly that this is the case. For example, cross-correlation analysis, which is the method of choice to assess whether two neurons are phase-locked and oscillating, often is carried out and averaged over relatively long stretches of data. Hence, the existence of transient butreliable synchronization between two neurons could become masked in the time-averaged cross-correlation function. Our present results show that two neurons in an oscillating ensemble sometimes phase-lock only for a very brief period (e.g., only a few oscillation cycles), requiring the use of fine-analysis techniques such asdynamic cross-correlation (Laurent and Davidowitz, 1994;Vaadia et al., 1995; this paper). Therefore, one should be careful when concluding that phase locking and oscillations do not exist between neurons in a large and distributed ensemble, especially if the stimulus representation (i.e., the response of a neuronal ensemble) is spread over a significant time period, as often happens in sensory systems.
Are such representations likely to be common to other olfactory systems?
The distributed representation described in the olfactory system of this animal consists of the following three concurrentstimulus-evoked phenomena: (1) temporally structured neuronal responses (odor- and neuron-specific temporal patterns); (2) oscillatory mass activity, for which the frequency characteristics are not odor specific; and (3) transient and dynamic synchronization of neuronal groups in an odor-specific manner. Are these phenomena observed elsewhere, and if so, are they also concurrent?
Temporally structured neuronal responses
All olfactory bulb responses examined to date provide evidence for odor-evoked temporal patterns consisting at least of sequential excitatory and “suppressive” phases of neuronal activity. Such patterns have been observed in amphibians (salamander: Kauer, 1974;Kauer and Shepherd, 1977), in bony fish (goldfish: Meredith and Moulton, 1978; Meredith, 1981), and in mammals (rat, rabbit, and hamster: Chaput and Holley, 1980; Meredith, 1986, 1992). Although suggestions were made that “suppression” patterns arise in certain olfactory bulb neurons of the salamander when odor concentrations are too high (“concentration tuning hypothesis”) (Kauer, 1974), more recent data from mammals indicate that suppression patterns are not more frequent at higher odor concentration and that certain neurons even go from an inhibitory to an excitatory response pattern as odor concentration is raised (Meredith, 1986). In insects, our results provide evidence that general odors evoke odor-specific response patterns in the antennal lobe PNs. Other studies showed that pheromones evoke temporally structured responses in the cockroachPeriplaneta and the moth Manduca (Burrows et al., 1982; Kanzaki et al., 1989). It appears, therefore, that such temporal features of responses to odors are common to neurons in the first olfactory relay of many animal phyla and classes.
Oscillatory mass activity
“Induced waves,” or oscillations in the EEG caused by olfactory stimulation, have been demonstrated in the olfactory bulb of amphibians (frog: Libet and Gerard, 1939), fish (Salmonidae:Thommesen, 1978; carp: Satou, 1990), and mammals (hedgehog: Adrian, 1942; rat, rabbit, cat: Freeman, 1975, 1992; Bressler and Freeman, 1980), including humans (Hughes et al., 1969). More recently, oscillations also were discovered in the olfactory systems of a terrestrial mollusk (Limax maximus: Gelperin and Tank, 1990;Delaney et al., 1994; Kleinfeld et al., 1994) and an insect (locust:Laurent and Davidowitz, 1994; Laurent and Naraghi, 1994). These observations now have been repeated in other insect species, such as cockroaches and honeybees (M. Stopfer and G. Laurent, unpublished observations). In all cases but that of Limax, oscillatory activity appears to be triggered (or dramatically enhanced) by odor stimulation. In Limax, oscillations are present “at rest,” i.e., even in the absence of odors, but odor stimuli cause a collapse of the phase gradient that exists across the procerebral lobe (Delaney et al., 1994). In all cases, the oscillations appear to be the result of local interactions between inhibitory local neurons and excitatory PNs (within the bulb of vertebrates, the procerebral lobe ofLimax, or the antennal lobe of insects) and to reflect the coherent activity of large numbers these neurons.
Transient synchronization of overlapping neuronal groups
The existence both of oscillatory mass activity and of temporal activity patterns in individual neurons in the first olfactory relay of amphibians, fish, mammals, mollusks, and insects suggests that the distributed activity patterns described here for the locust also may exist in many other animals. Our preparation, however, appears to be the only one so far in which all three phenomena have been observed together and seen to “interlock” in a coherent fashion, showing transient synchronization of neuronal sets and progressive transformation of a coherently active neuronal population. The separate pieces of evidence from vertebrates and mollusks seem to be compatible with our hypothesis of stimulus representation and coding in the olfactory system, but it remains to be seen whether they all can be concurrently observed there also. Optical imaging in the salamander (Cinelli et al., 1992, 1995), for example, certainly gives support to the idea that odor representation in the olfactory bulb is distributed and combinatorial.
Footnotes
This work was supported by an Office of Naval Research graduate student fellowship to M.W., and a National Science Foundation (NSF) grant and an NSF–Presidential Faculty Fellow award to G.L.
Correspondence should be addressed to Gilles Laurent, Caltech, Biology Division, 139-74, Pasadena, CA 91125.
Dr. Davidowitz’s present address: NEC Research Institute, Princeton, NJ 07780.
REFERENCES
- 1.Adrian ED. Olfactory reactions in the brain of the hedgehog. J Physiol (Lond) 1942;100:459–473. doi: 10.1113/jphysiol.1942.sp003955. [DOI] [PMC free article] [PubMed] [Google Scholar]
- 2.Axel R. The molecular logic of smell. Sci Am. 1995;273:154–159. doi: 10.1038/scientificamerican1095-154. [DOI] [PubMed] [Google Scholar]
- 3.Bressler SL, Freeman WJ. Frequency analysis of olfactory system EEG in cat, rabbit and rat. Electroencephalogr Clin Neurophysiol. 1980;50:19–24. doi: 10.1016/0013-4694(80)90319-3. [DOI] [PubMed] [Google Scholar]
- 4.Buck L, Axel R. A novel multigene family may encode odorant receptors: a molecular basis for odor recognition. Cell. 1991;65:175–187. doi: 10.1016/0092-8674(91)90418-x. [DOI] [PubMed] [Google Scholar]
- 5.Burrows M, Boeckh J, Esslen J. Physiological and morphological properties of interneurons in the deutocerebrum of male cockroaches which respond to female pheromones. J Comp Physiol [A] 1982;145:447–457. [Google Scholar]
- 6.Chaput M, Holley A. Single unit responses of olfactory bulb neurons to odor presentation in awake rabbits. J Physiol (Paris) 1980;76:551–558. [PubMed] [Google Scholar]
- 7.Cinelli AR, Kauer JS. Voltage-sensitive dyes and functional activity in the olfactory pathway. Annu Rev Neurosci. 1992;15:321–351. doi: 10.1146/annurev.ne.15.030192.001541. [DOI] [PubMed] [Google Scholar]
- 8.Cinelli AR, Hamilton KA, Kauer JS. Salamander olfactory bulb neuronal activity observed by video-rate voltage-sensitive dye imaging. 3. Spatial and temporal properties of responses evoked by odorant stimulation. J Neurophysiol. 1995;73:2053–2071. doi: 10.1152/jn.1995.73.5.2053. [DOI] [PubMed] [Google Scholar]
- 9.Davis RL. Mushroom bodies and Drosophila learning. Neuron. 1993;11:1–14. doi: 10.1016/0896-6273(93)90266-t. [DOI] [PubMed] [Google Scholar]
- 10.Delaney KR, Gelperin A, Fee MS, Flores JA, Gervais R, Tank DW, Kleinfeld D. Waves and stimulus modulated dynamics in an oscillating olfactory network. Proc Natl Acad Sci USA. 1994;91:669–674. doi: 10.1073/pnas.91.2.669. [DOI] [PMC free article] [PubMed] [Google Scholar]
- 11.Freeman WJ. Academic; New York: 1975. Mass action in the nervous system. . [Google Scholar]
- 12.Freeman WJ. Spatial properties of an EEG event in the olfactory bulb and cortex. Electroencephalogr Clin Neurophysiol. 1978;44:586–605. doi: 10.1016/0013-4694(78)90126-8. [DOI] [PubMed] [Google Scholar]
- 13.Freeman WJ. Nonlinear dynamics in olfactory information processing. In: Davis JL, Eichenbaum H, editors. Olfaction, a model system for computational neuroscience. MIT; Cambridge: 1992. pp. 225–249. [Google Scholar]
- 14.Gelperin A, Tank DW. Odor-modulated collective network oscillations of olfactory interneurons in a terrestrial mollusc. Nature. 1990;345:437–440. doi: 10.1038/345437a0. [DOI] [PubMed] [Google Scholar]
- 15.Gray CM. Synchronous oscillations in neuronal systems: mechanisms and functions. J Comput Neurosci. 1994;1:11–38. doi: 10.1007/BF00962716. [DOI] [PubMed] [Google Scholar]
- 16.Gray CM, Skinner JE. Centrifugal regulation of neuronal activity in the olfactory bulb of the waking rabbit as revealed by reversible cryogenic blockade. Exp Brain Res. 1988;69:378–386. doi: 10.1007/BF00247583. [DOI] [PubMed] [Google Scholar]
- 17.Hammer M, Menzel R. Learning and memory in the honeybee. J Neurosci. 1995;15:1617–1630. doi: 10.1523/JNEUROSCI.15-03-01617.1995. [DOI] [PMC free article] [PubMed] [Google Scholar]
- 18.Hildebrand JG. Analysis of chemical signals by nervous systems. Proc Natl Acad Sci USA. 1995;92:67–74. doi: 10.1073/pnas.92.1.67. [DOI] [PMC free article] [PubMed] [Google Scholar]
- 19.Hopfield JJ. Pattern recognition computation using action potential timing for stimulus representation. Nature. 1995;376:33–36. doi: 10.1038/376033a0. [DOI] [PubMed] [Google Scholar]
- 20.Hughes JR, Hendrix DE, Wetzel NS, Johnson JW. Correlations between electrophysiological activity from the human olfactory bulb and the subjective response to odoriferous stimuli. In: Pfaffman C, editor. Olfaction and taste, III. Rockefeller; New York: 1969. [PubMed] [Google Scholar]
- 21.Kanzaki R, Arbas EA, Strausfeld NJ, Hildebrand JG. Physiology and morphology of projection neurons in the antennal lobes of the male Manduca sexta . J Comp Physiol [A] 1989;165:427–453. doi: 10.1007/BF00611233. [DOI] [PubMed] [Google Scholar]
- 22.Kauer JS. Response patterns of amphibian olfactory bulb neurones to odor stimulation. J Physiol (Lond) 1974;243:695–715. doi: 10.1113/jphysiol.1974.sp010772. [DOI] [PMC free article] [PubMed] [Google Scholar]
- 23.Kauer JS. Contributions of topography and parallel processing to odor coding in the vertebrate olfactory pathway. Trends Neurosci. 1991;14:79–85. doi: 10.1016/0166-2236(91)90025-p. [DOI] [PubMed] [Google Scholar]
- 24.Kauer JS, Shepherd GM. Analysis of the onset phase of olfactory bulb unit responses to odour pulses in the salamander. J Physiol (Lond) 1977;272:495–516. doi: 10.1113/jphysiol.1977.sp012056. [DOI] [PMC free article] [PubMed] [Google Scholar]
- 25.Kleinfeld D, Delaney KR, Fee MS, Flores JA, Tank DW, Gelperin A. Dynamics of propagating waves in the olfactory network of a terrestrial mollusc: an electrical and optical study. J Neurophysiol. 1994;72:1402–1419. doi: 10.1152/jn.1994.72.3.1402. [DOI] [PubMed] [Google Scholar]
- 26.Laurent G, Davidowitz H. Encoding of olfactory information with oscillating neural assemblies. Science. 1994;265:1872–1875. doi: 10.1126/science.265.5180.1872. [DOI] [PubMed] [Google Scholar]
- 27.Laurent G, Naraghi M. Odorant-induced oscillations in the mushroom bodies of the locust. J Neurosci. 1994;14:2993–3004. doi: 10.1523/JNEUROSCI.14-05-02993.1994. [DOI] [PMC free article] [PubMed] [Google Scholar]
- 28.Libet B, Gerard RW. Control of the potential rhythm of the isolated frog brain. J Neurophysiol. 1939;2:153–169. [Google Scholar]
- 29.Meredith M. The analysis of response similarity in single neurons of the goldfish olfactory bulb using amino acids as odor stimuli. Chem Senses. 1981;6:277–293. [Google Scholar]
- 30.Meredith M. Patterned response to odor in mammalian olfactory bulb: the influence of intensity. J Neurophysiol. 1986;56:572–597. doi: 10.1152/jn.1986.56.3.572. [DOI] [PubMed] [Google Scholar]
- 31.Meredith M. Neural circuit computation: complex patterns in the olfactory bulb. Brain Res Bull. 1992;29:111–117. doi: 10.1016/0361-9230(92)90014-o. [DOI] [PubMed] [Google Scholar]
- 32.Meredith M, Moulton DG. Patterned response to odor in single neurons of goldfish olfactory bulb: influence of odor quality and other stimulus parameters. J Gen Physiol. 1978;71:615–643. doi: 10.1085/jgp.71.6.615. [DOI] [PMC free article] [PubMed] [Google Scholar]
- 33.O’Keefe J, Recce Phase relationship between hippocampal place units and the EEG theta-rhythm. Hippocampus. 1993;3:317–330. doi: 10.1002/hipo.450030307. [DOI] [PubMed] [Google Scholar]
- 34.Satou M. Synaptic organization, local neuronal circuitry, and functional segregation of the teleost olfactory bulb. Prog Neurobiol. 1990;34:115–142. doi: 10.1016/0301-0082(90)90004-z. [DOI] [PubMed] [Google Scholar]
- 35.Singer W, Gray CM. Visual feature integration and the temporal correlation hypothesis. Annu Rev Neurosci. 1995;18:555–586. doi: 10.1146/annurev.ne.18.030195.003011. [DOI] [PubMed] [Google Scholar]
- 36.Sullivan SL, Bohm S, Ressler KJ, Horowitz LF, Buck LB. Target-independent pattern specification in the olfactory epithelium. Neuron. 1995;15:779–789. doi: 10.1016/0896-6273(95)90170-1. [DOI] [PubMed] [Google Scholar]
- 37.Thommesen G. The spatial distribution of odor-induced potentials in the olfactory bulb of char and trout (salmonidae). Acta Physiol Scand. 1978;102:414–426. doi: 10.1111/j.1748-1716.1978.tb06064.x. [DOI] [PubMed] [Google Scholar]
- 38.Vaadia E, Haalman I, Abeles M, Bergman H, Prut Y, Slovin H, Aertsen A. Dynamics of neuronal interactions in monkey cortex in relation to behavioral events. Nature. 1995;373:515–518. doi: 10.1038/373515a0. [DOI] [PubMed] [Google Scholar]
- 39.Vassar R, Chao SK, Sitcheran R, Nuñez JM, Vosshall LB, Axel R. Topographic organization of sensory projections to the olfactory bulb. Cell. 1994;79:981–991. doi: 10.1016/0092-8674(94)90029-9. [DOI] [PubMed] [Google Scholar]
- 40.Von der Malsburg C, Schneider W. A neural cocktail-party processor. Biol Cybern. 1986;54:29–40. doi: 10.1007/BF00337113. [DOI] [PubMed] [Google Scholar]