

Abstract
Piriform cortex in the rat is highly susceptible to induction of epileptiform activity. Experiments in vivo and in vitro indicate that this activity originates in endopiriform nucleus (EN). In slices, EN neurons are more excitable than layer II (LII) pyramidal cells, with more positive resting potentials and lower spike thresholds. We investigated potassium currents in EN and LII to evaluate their contribution to these differences in excitability. Whole-cell currents were recorded from identified cells in brain slices. A rapidly inactivating outward current (IA) had distinct properties in LII (IA,LII) versus EN (IA,EN). The peak amplitude ofIA,EN was 45% smaller thanIA,LII, and the kinetics of activation and inactivation was significantly slower forIA,EN. The midpoint of steady-state inactivation was hyperpolarized by 10 mV forIA,EN versusIA,LII, whereas activation was similar in the two cell groups. Other voltage-dependent potassium currents were indistinguishable between EN and LII. Simulations using a compartmental model of LII cells argue that different cellular distributions ofIA channels in EN versus LII cells cannot account for these differences. Thus, at least some of the differences are intrinsic to the channels themselves. Current-clamp simulations suggest that the differences between IA,LIIand IA,EN can account for the observed difference in resting potentials between the two cell groups. Simulations show that this difference in resting potential leads to longer first spike latencies in response to depolarizing stimuli. Thus, these differences in the properties of IAcould make EN more susceptible to induction and expression of epileptiform activity.
Keywords: potassium channels, piriform cortex, epilepsy, compartmental models, voltage clamp, membrane excitability
Because of its high sensitivity to convulsant drugs and to electrical kindling in vivo (Piredda and Gale, 1985; McIntyre and Racine, 1986; Racine et al., 1988), piriform cortex has received much attention as a model system for studying temporal lobe epilepsy. In slices of piriform cortex, sustained bursting during treatments with Mg2+-free or low-Cl− saline induces long-lasting alterations in synaptic responses. After induction, weak synaptic stimulation evokes epileptiform excitatory postsynaptic potentials (eEPSPs), which are all-or-none events corresponding to simultaneous firing of large numbers of neurons (Hoffman and Haberly, 1989). Induction of eEPSPs occurs in endopiriform nucleus (EN) and possibly in adjacent “deep” structures. When evoked, eEPSPs originate in EN and spread outward to involve the pyramidal cells in more superficial layers (Hoffman and Haberly, 1991a). These eEPSPs strongly resemble epileptiform activity induced by kindling in vivo (McIntyre and Wong, 1986;Hoffman and Haberly, 1991b; Haberly and Sutula, 1992), suggesting a common mechanism for the two phenomena. Although the reasons are not clear as to why eEPSPs arise in EN rather than the superficial layers, the recurrent excitatory connections that are prominent in EN are likely to play a role (Hoffman and Haberly, 1993).
Differences in intrinsic membrane properties also could contribute to the high seizure susceptibility of EN. Cells in EN have more depolarized resting potentials, lower spike thresholds, and higher input resistances than layer II (LII) pyramidal cells (Tseng and Haberly, 1989a,b). K currents are known to be important regulators of cell excitability (Hille, 1992) and, thus, differences in the properties of K currents could contribute to these differences in excitability. Studies using in situ hybridization have demonstrated laminar patterns in K channel expression in cortex (Drewe et al., 1992; Tsaur et al., 1992; Weiser et al., 1994), but the properties of K currents have not been compared in identified cortical cells from different laminae. We have investigated K currents in cells in EN and LII and have found differences in the properties of a rapidly inactivating K current (A current, or IA) that could contribute to the higher susceptibility of EN to induction and expression of epileptiform activity. A preliminary account of this work has appeared in abstract form (Banks and Jackson, 1995).
MATERIALS AND METHODS
Preparation of slices. Young rats (9–18 d old) were decapitated under CO2 narcosis, and the head immersed immediately in a slicing solution composed of 90% sucrose ACSF (artificial CSF) [composition (in mm): sucrose 250, KCl 1.8, KH2PO4 1.2, NaHCO3 26, Mg2SO4 10, glucose 10] and 10% normal ACSF [composition (in mm): NaCl 125, KCl 1.8, KH2PO4 1.2, NaHCO3 26, Mg2SO4 1, CaCl2 2, glucose 10] saturated with 95% O2/5% CO2 at 4°C. A block of tissue containing the piriform cortex was dissected out with the brain immersed in slicing solution, and the tissue glued to a vibratome tray with cyanoacrylate glue. Slices (400 μm) were cut in a plane ∼15° off the frontal plane to allow for optimal visualization of the cortical laminae and stored at room temperature in normal ACSF saturated with 95% O2/5% CO2. After a 30 min recovery period, a slice was transferred to the recording chamber where it was perfused at 4 ml/min with normal ACSF at 30–32°C.
Patch-clamp electrophysiology. Cells in LII and EN were visualized using an upright microscope (Reichert Jung Diastar) with Nomarski optics and a long working-distance water-immersion objective (Zeiss Achroplan 40×, 0.75 numerical aperture). Patch pipettes were fabricated from thin-walled aluminosilicate glass, fire polished, and coated with Sylgard to reduce electrode capacitance. Tight-seal whole-cell recordings were obtained using standard techniques (Hamill et al., 1981; Edwards et al., 1989). An Axopatch 200 patch-clamp amplifier was used for all recordings. Data were sampled at 5 kHz using pClamp (Axon Instruments, Foster City, CA) interfaced to an IBM-compatible PC.
Recording pipettes were filled with solution containing (in mm): KCl 130, MgATP 4, Na2GTP 0.3, EGTA 0.4, NaCl 10, HEPES 10, pH 7.2. Series resistance and capacitance were determined by optimal cancellation of the capacitative transient, which for a “Rall motoneuron” (Rall, 1977) gives the capacitance of the cell body (Jackson, 1992). After compensation of 60–90%, series resistances were 1.45 ± 0.27 MΩ (mean ± SEM; n = 18) for recordings from LII, and 1.38 ± 0.39 MΩ (n = 22) for recordings from EN. At 0 mV, peak current often exceeded 1 nA/pF (e.g., Fig.4B). In the majority of cells, the series resistance error exceeded 10 mV for voltage commands beyond +15 mV, and data for these voltages were discarded. Average series resistance errors for pulses to −15 mV were 3.66 ± 0.76 mV for LII and 2.91 ± 0.56 mV for EN. The liquid junction potential between the pipette and bath solutions was less than 3 mV, and the data were not corrected for this voltage. Average age of the animals for the two cell groups was 11.8 ± 0.7 d for LII and 11.4 ± 0.6 d for EN.
Fig. 4.
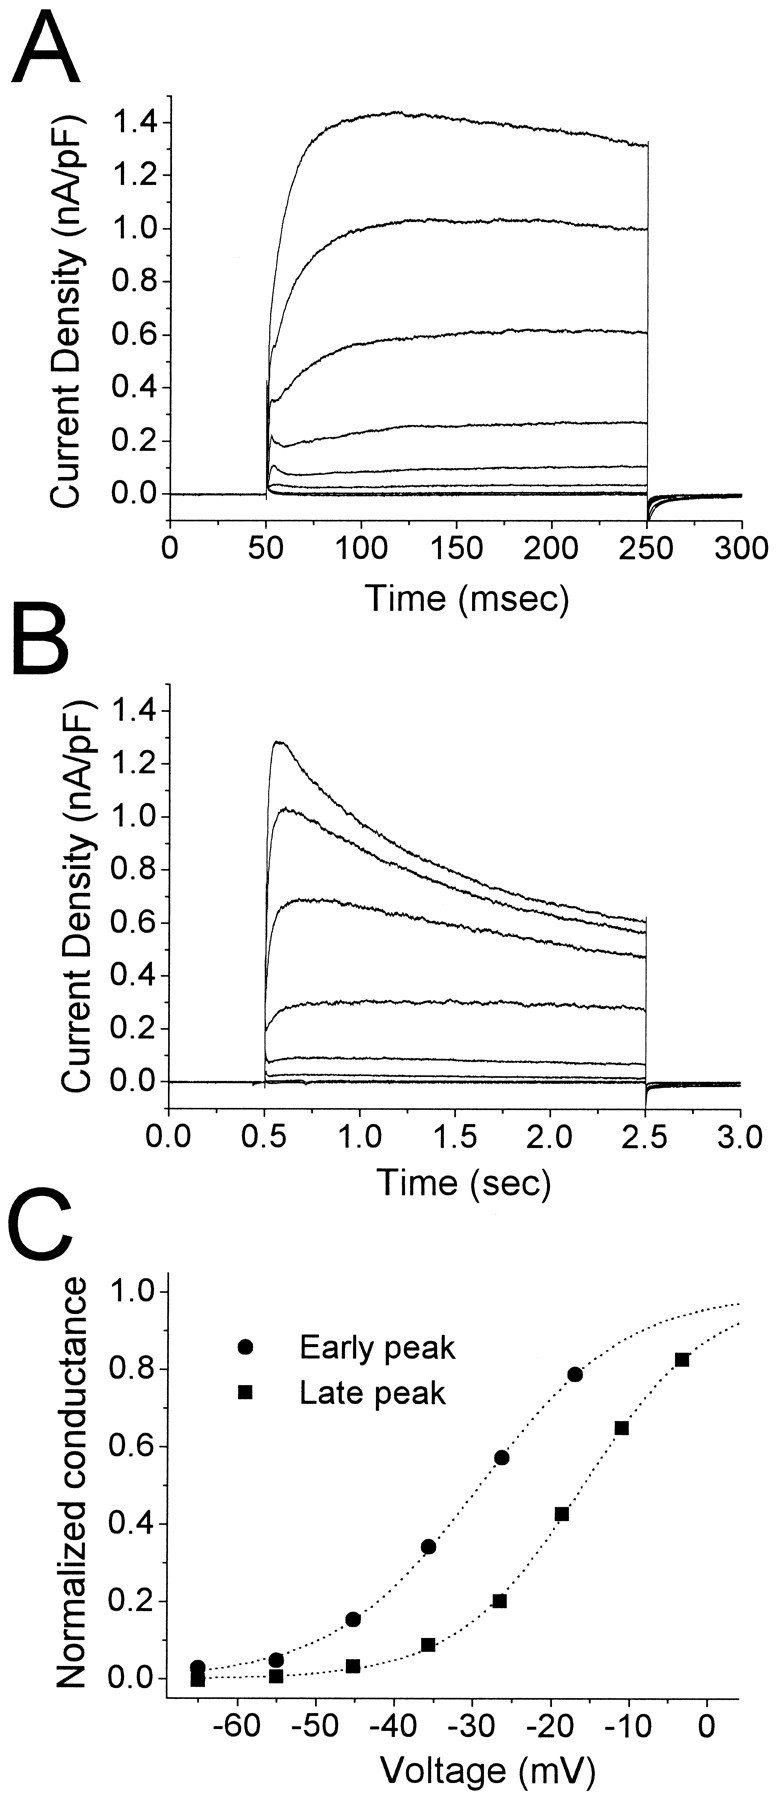
A, B, Outward currents recorded from a cell in endopiriform nucleus. Depolarizing voltage steps to −65, −55, … , +5 mV were applied for 200 msec (A) or 2 sec (B) from a holding potential of −90 mV. Biexponential fit to the 2 sec response to +5 mV (B,top trace) gave time constants of 376 msec (16.4% of total current) and 1530 msec (54.0% of total current). C, Activation functions estimated from the data in A andB. Early and late peak values were divided by the driving force (assuming EK = −98 mV) and normalized using the technique described in Materials and Methods. The early peak was distinguishable only for the responses to voltage steps up to −15 mV. Voltages were corrected for series resistance errors. Boltzmann fit parameters: V0.5 = −29.2 mV,k = 9.35 mV (early peak); V0.5 = −16.0 mV, k = 8.08 mV (late peak).
Isolation of K currents. Potassium currents were isolated using 1 μm tetrodotoxin (TTX) to block Na currents and low-Ca2+ ACSF [composition (in mm): NaCl 125, KCl 1.8, KH2PO4 1.2, NaHCO3 26, Mg2SO4 2.9, CaCl2 0.1, glucose 10] to reduce contamination by Ca currents. In some experiments, a small residual Na current remained unblocked (e.g., Fig. 5), but was fast enough so that it did not affect the analysis of K currents. In initial experiments, Ca currents were blocked using 200 μmCd2+, but it was found thatIA also was partially blocked. Blocking Ca currents by replacing all extracellular Ca2+ with Mg2+ resulted in large, rapid, and irreversible decreases in the somatic capacitance. Changes in capacitance and contamination by Ca currents were not observed with 0.1 mm extracellular Ca2+, and this concentration was used in the standard recording medium.
Fig. 5.

Activation and kinetics ofIA. A,IA currents recorded in an LII pyramidal cell in response to depolarizing voltage steps from −90 mV to −55, … , −15 mV. Currents were isolated using the protocol illustrated in Figure 1. Monoexponential fits are superimposed on the data. Time constants: −45 mV, 9.79 msec; −35 mV, 9.03 msec; −25 mV, 8.71 msec; −15 mV, 8.07 msec. B, IsolatedIA obtained by the same protocol from a cell in EN. Exponential fits are superimposed on the data (dotted lines). Time constants: −45 mV, 11.4 msec; −35 mV, 11.5 msec; −25 mV, 12.2 msec; −15 mV, 10.5 msec. C, Pooled activation data for 11 cells in LII (triangles) and 14 cells in EN (squares). Data were obtained by normalizing the peak currents in response to the activation protocol used in Aand B, and dividing by the driving force (assumingEK = −98 mV). Boltzmann functions were fitted to the data for each cell, then averaged to give the plotted functions (solid lines). Boltzmann fit parameters are given in Table 2. D, E, Voltage dependence ofIA activation (D) and inactivation (E) kinetics for LII (striped bars) and EN (gray bars). Activation kinetics was measured by computing the time to reach 90% of peak (t0.9pk). Inactivation kinetics was measured by fitting single exponentials to decaying currents, as inA and B. For D, n = 18 for EN and 13 for LII. For E, n = 17 for EN and 11 for LII. Statistical comparisons were made between LII and EN at each voltage point using the Student’s t test. Significance level was p ≤ 0.01 for all voltages.
The most reliable method for isolating IAwas the subtraction protocol shown in Figure 1, which exploited differences in the kinetics of inactivation between the high- and low-threshold currents. The protocol used for studying activation of IA (see Fig. 5) is illustrated, but a similar procedure also was used for studying inactivation (see Fig. 6). Currents were recorded in response to depolarizing voltage steps from a holding potential of −90 mV (Fig. 1, trace a). The depolarizing voltage steps were repeated, but preceded by 50 msec prepulses to −30 mV to inactivate IA (Fig.1, trace b). The responses to the steps with prepulses were subtracted from the responses to the steps alone to yield the difference current (Fig. 1, trace a, b), which had an appearance typical of IA in other preparations. In all cells studied in detail, this procedure was reliable for voltages at least up to −15 mV, and in the majority of cells to −5 mV. Beyond these voltages, noninactivating or slowly inactivating components often were apparent in the records possibly because of contamination by other outward currents.
Fig. 1.
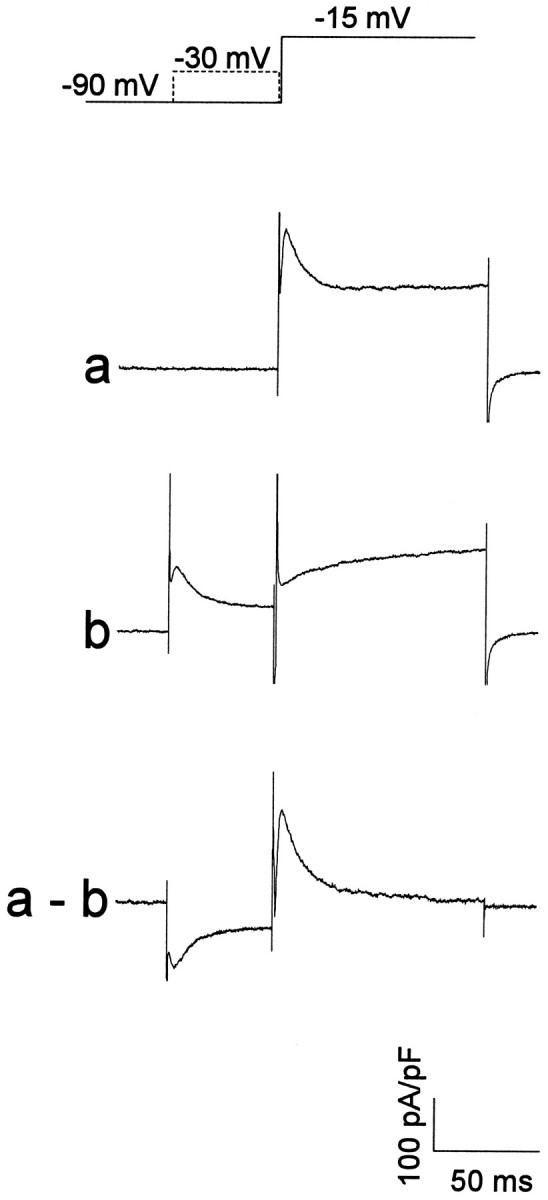
Subtraction protocol used to isolateIA. Shown is the procedure used to study activation of IA. The cell was held at −90 mV and stepped to depolarized voltages (trace a; response at −15 mV). The protocol then was repeated, but with a 50 msec prepulse to −30 mV preceding the depolarizing voltage steps (trace b). The difference current yielded IA(traces a, b). Data from this cell are shown in Figure 5A.
Fig. 6.
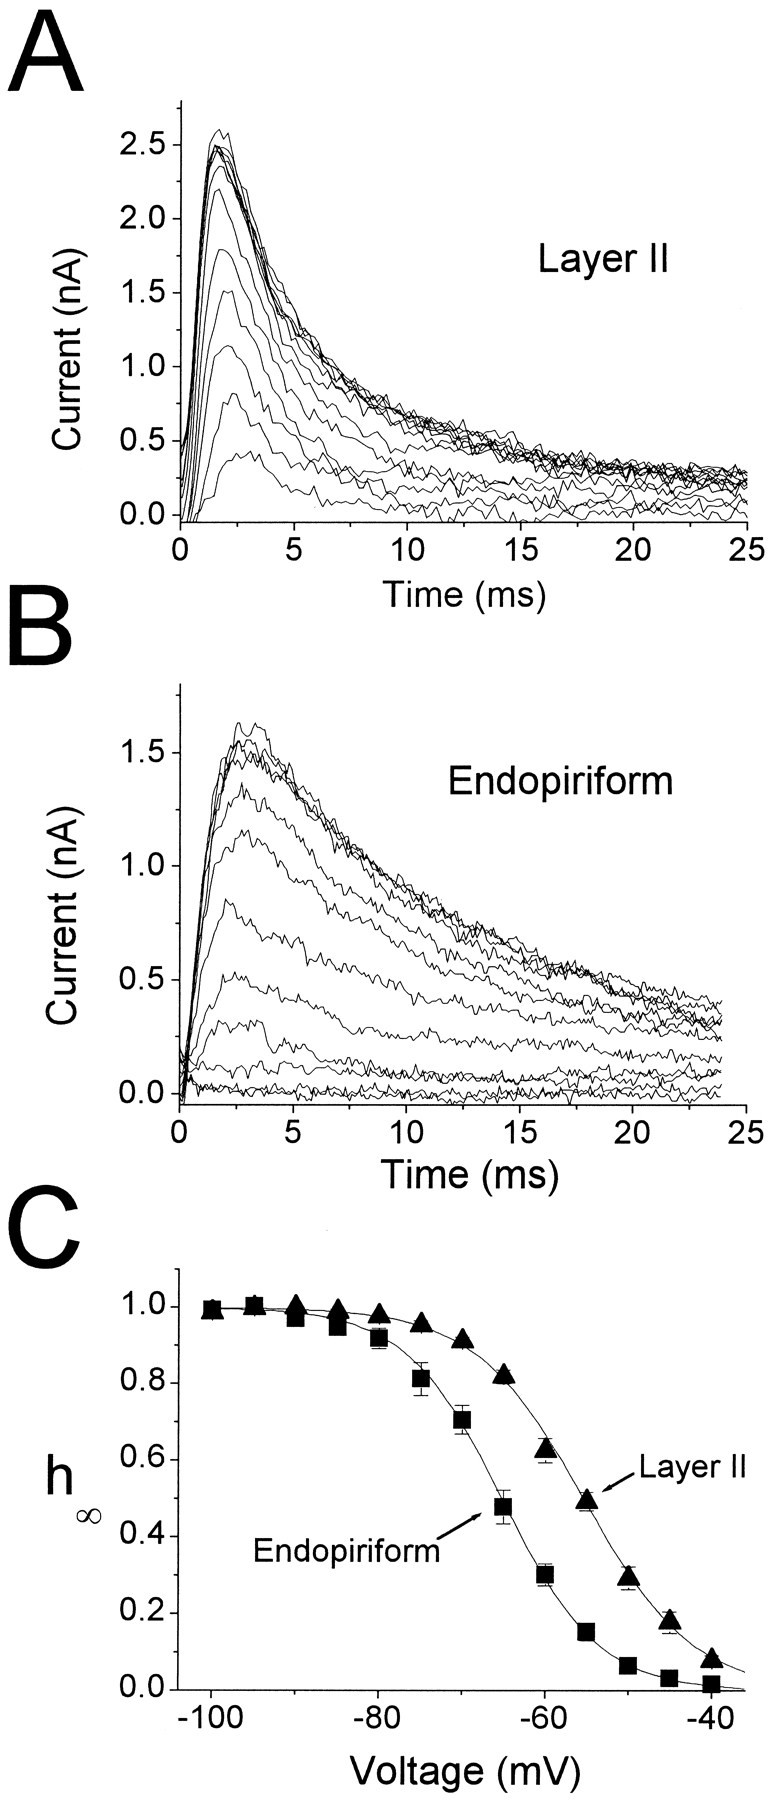
Steady-state inactivation ofIA. A,IA in a LII cell in response to the inactivation protocol. Conditioning voltage steps varying from −100 mV to −40 mV were applied for 500 msec, followed by test steps to 0 mV.IA was isolated using a procedure similar to that illustrated in Figure 1, with the prepulse interposed between the conditioning and test pulses. B,IA recorded from a cell in EN using the same protocol as in A. C, Steady-state inactivation functions for 10 cells in LII (triangles) and 10 cells in EN (squares). Data were obtained by normalizing the peak currents in response to the inactivation protocol used in Aand B. Boltzmann functions were fitted to the data for each cell, and then averaged to give the plotted functions (solid lines). Boltzmann fit parameters are given in Table 2.
Extracellular recordings. Bipolar tungsten electrodes (resistance 5 MΩ) were used to stimulate afferent and association fibers at the border of LIa and Ib or association fibers in LIII. Field potentials were recorded in LII or EN using patch pipettes with tip diameters of ∼10 μm and filled with 1 m NaCl (pipette resistance, 0.2–0.8 MΩ).
Biocytin labeling. Biocytin (0.3%) (Sigma, St. Louis, MO) was included in the patch pipettes to determine the morphologies of cells studied in LII and EN. The procedure for tissue processing was similar to that of Horikawa and Armstrong (1988). After terminating the recording, slices were fixed overnight (4% paraformaldehyde in 0.1 m PBS), then rinsed in PBS and cryoprotected by passage through a series of glycerol–sucrose solutions of increasing concentration. Frozen sections (60 μm) were cut using a microtome, the cryoprotection procedure reversed, and the slices rinsed in PBS. Sections were incubated for 20 min in 0.5% H2O2 in PBS, rinsed in PBS, and incubated overnight in the avidin–biotin–horseradish peroxidase (HRP) reagent (ABC Kit, Vector Laboratories, Burlingame, CA). The sections then were rinsed in PBS and the HRP reacted using the standard DAB-nickel/cobalt intensification method (Adams, 1981). Finally, the sections were mounted, counterstained with cresyl violet, and coverslipped. The recovery rate of stained cells was low (<50%), most likely because the stained cells frequently were near the surface of the slice and were lost during resectioning.
Data analysis. Data were leak-subtracted off-line using pClamp v6.02. Data were fitted to exponentials and Boltzmann functions ({1 + exp[(V − V0.5)/k]}−1) using pClamp or Origin v3.5 (MicroCal). Because it was not possible to depolarize the cells to maximal activation ofIA, gmax was allowed to vary in the Boltzmann fits for these data (in addition toV0.5 and k). Attempts were made to fit isolated A currents to functions of the form A · [1 − exp(−t/τactiv)]n· [exp(−t/τinact)], but the fits to the activation phase often were frustrated by residual fast Na currents remaining in 1 μm TTX. As an alternative, activation kinetics was estimated from the time to 90% of the peak current (t0.9pk). Inactivation was analyzed by fitting the decaying phase to a single exponential. All data are presented as mean ± SE.
Modeling. To test whether the differences betweenIA,EN andIA,LII could be accounted for solely by different channel distributions on the dendrites and somata of the two cell groups, a compartmental model of an LII pyramidal cell was implemented using the program Nodus v3.1 (De Schutter, 1989) on a Macintosh computer (IIsi). The model consisted of a spherical soma connected to a single, variable diameter dendrite with uniform membrane resistivity, divided into 20 compartments of equal electrotonic length (ΔL = 0.05). This scheme has been used successfully in a previous modeling study of LII pyramidal cells (Kapur, 1995). Because the latter model was developed for cells from older animals, the metric dimensions of the tapered dendrite were scaled by a factor of 0.75 for the simulations presented here, which yielded dendritic charging transients similar in size to those observed in the LII cells in our study. The soma diameter (22 μm) was adjusted to give a capacitance of 15 pF, close to the average of LII cells studied here. The passive electrical parameters used were membrane resistivity, 14.5 kΩ/cm2; axial resistivity, 100 Ω-cm; membrane capacitance, 1 μF/cm2.
IA was modeled using a Hodgkin–Huxley scheme, with the conductance gA computed as:
gmax was adjusted to give currents recorded at the soma an amplitude of 265 pA/pF, for a pulse from −100 mV to 0 mV, similar to those observed in whole-cell recordings from LII cells. n was chosen to be 3, the value that gave best fits in the majority of the data with little residual Na current.m and h correspond to the activation and inactivation functions, respectively, and were computed as:
The values for these parameters are given in Table1. For this form of the Hodgkin–Huxley model, the “base rates” αm,0 = βm,0 = [2τactiv(V0.5,m)]−1and αh,0 = βh,0 = [2τinact(V0.5,h)]−1. Measurements for τactiv and τinact were not available at these voltages, so γm, γh, and the base rates were adjusted to give reasonable values fortpk and τinact in the voltage range over which these parameters were measured. The values for km andV0.5,m were determined from the cube root of the measured steady-state activation curve (m∞(V)), and the values ofkh and V0.5,hwere determined from the measured steady-state inactivation curve (h∞(V)).
Table 1.
Model IAparameters
| αm,0, βm,0 | 0.5 msec−1 |
|---|---|
| γm | 0.5 |
| km | 15.4 mV |
| V0.5,m | −39.3 mV |
| αh,0, βh,0 | 0.04 msec−1 |
| γh | 0.9 |
| kh | 6.86 mV |
| V0.5,h | −65.7 mV |
Note that V0.5,m andkm are different from the experimental values (Table 2), because they correspond to m(V) instead of mn(V).
Simulations also were run in current-clamp mode to assess the effects of the differences between IA,LII andIA,EN on cell excitability (see Fig. 11). For these simulations, when IA was located in the dendrites as well as the soma, the current measured at the soma under voltage clamp had slower kinetics than in recordings from LII and EN cells and also exhibited small shifts in the activation and inactivation functions. Because we wished to assess the effects on cell excitability for different distributions ofIA, assuming that these distributions gave rise to the currents recorded in our experiments, we changed the parameters of the underlying model in these simulations to approximate the experimental data. For example, forIA,LII uniformly distributed in the model, it was necessary to increase αm,0 from 0.6 to 1.28 msec−1 and αh,0 from 0.1 to 0.21 msec−1 to match the kinetic parameters given in Table 2. In addition, V0.5,mand V0.5,h both were shifted by −3 mV to match the corresponding parameters in Table 2.
Fig. 11.
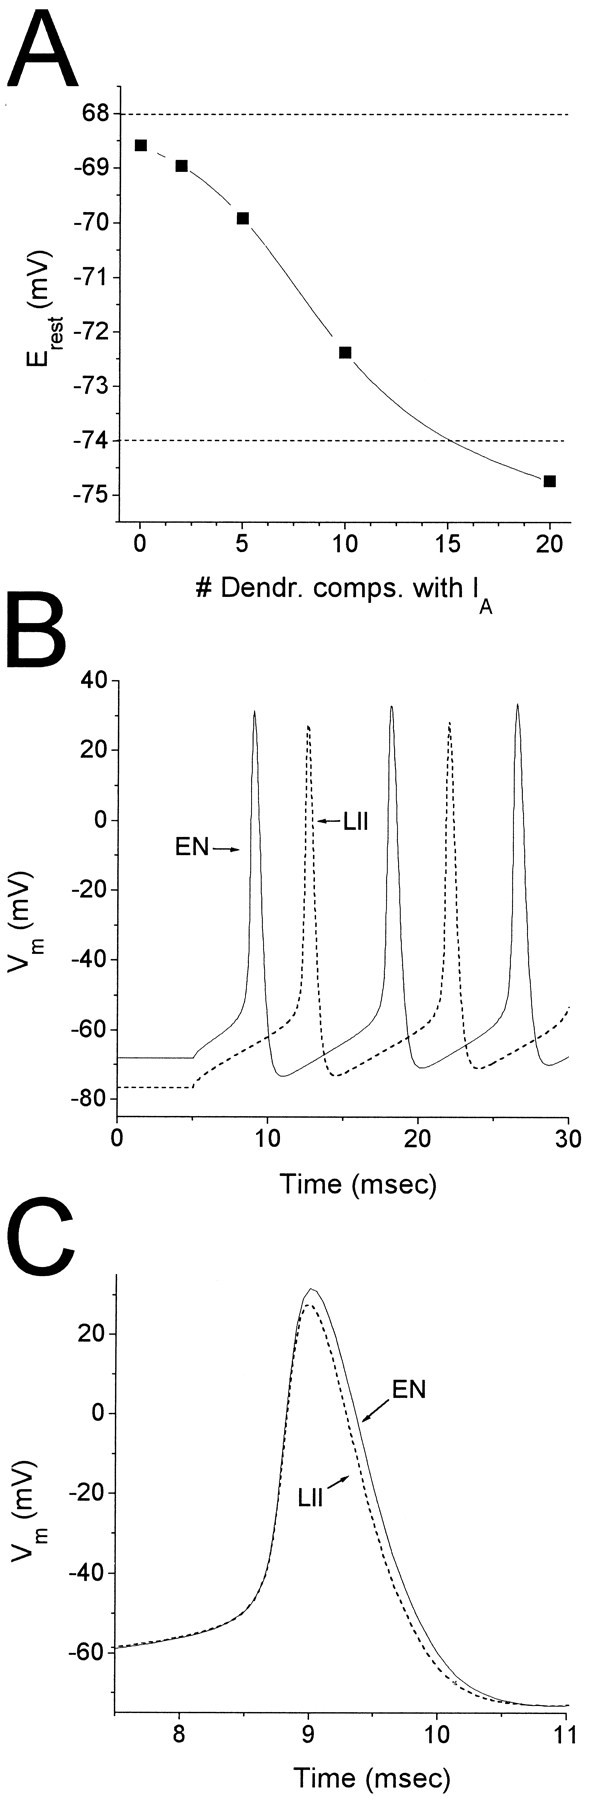
Effect of IA on cell excitability. IA first was placed in the soma, then was added to the first two dendritic compartments, then the first five dendritic compartments, and so on, until it was distributed uniformly throughout the cell. In each case,gmax, V0.5,m,V0.5,h, α0,m, and α0,h were adjusted to give currents measured at the soma under voltage clamp comparable to the experimental data (Table 2). For all distributions, the current decays were reasonably well fit by single exponentials. A, Effect onErest. The resting potential of the model was measured after setting the leak withIA,EN to giveErest = −68 mV, then switching toIA,LII with the same leak.Erest became increasingly hyperpolarized asIA was added to more and more dendritic compartments. The horizontal dotted lines at −68 and −74 mV mark Erest as measured in EN and LII, respectively. B. Effect on first spike latency and interspike interval of switching from IA,EN (solid line) to IA,LII (dashed line) in a model with currents distributed uniformly along the dendritic tree. The model was stimulated with a 25 msec current pulse (0.3 nA) to elicit action potentials. First spike latency increased from 3.83 (EN) to 7.48 (LII) msec, whereas interspike interval increased from 9.1 (EN) to 9.35 (LII) msec. C, Effect on spike width. The traces from B were shifted by ∼3.6 msec to align the first action potentials. Spike width at −10 mV decreased from 0.66 (EN) to 0.57 (LII) msec. Spike amplitude was slightly smaller (4 mV) with IA,LII.
Table 2.
Activation and inactivation parameters forIA
| Endopiriform | Layer II | |
|---|---|---|
| Activation | ||
| V0.5,m(mV) | −22.3 ± 1.5 (14) | −24.4 ± 1.8 (11) |
| km (mV) | 11.9 ± 1.2 (14) | 11.0 ± 0.8 (11) |
| t0.9pk(ms) | 1.89 ± 0.08 (18) | 1.44 ± 0.10* (13) |
| Ipk (pA) | 130 ± 10 (10) | 191 ± 25** (11) |
| Inactivation | ||
| V0.5,h(mV) | −65.4 ± 0.9 (10) | −55.5 ± 1.0*** (10) |
| kh (mV) | 6.15 ± 0.47 (10) | 6.40 ± 0.36 (10) |
| τinact(ms) | 10.7 ± 1.1 (18) | 6.52 ± 0.35*** (13) |
Parameters are presented as mean ± SE, with the number of cells in parentheses. t0.9,pk,Ipk, and τinact were measured at −15 mV. Statistical comparisons were between LII and EN using Student’s t test. *p < 0.0025; **p < 0.025; ***p < 0.0005.
The parameters for the fast, inactivating Na current (INa) and the delayed rectifier K current (IKDR) were taken from the model of Traub et al. (1991) of CA3 hippocampal pyramidal neurons. The conductance density was set at 20 mS/cm2 forINa and 10 mS/cm2 forIKDR, which were the smallest values that gave >30 mV action potentials and repetitive spikes in response to depolarizing current pulses when the currents were distributed uniformly in the model cell.
RESULTS
Cell identification
The photomicrograph of Figure 2Aillustrates that LII and EN are readily located in these slices. Healthy cells had a characteristic appearance (Fig.2B,C, arrowheads) and were typically visualized 1–2 cell diameters below the surface. Although somatic and (usually) proximal dendritic morphologies were clearly visible in the slice, identification of cell type is unreliable using these criteria. To address this issue, a portion of the cells studied were filled with biocytin to determine their morphologies. Of those stained and recovered, all of the cells in LII (8/8) were pyramidal cells (Fig.3A), whereas most of the cells in EN (4/5) had spiny dendrites (Fig. 3B,C). The fifth cell in EN was too lightly stained to determine whether it, too, had spiny dendrites. In LI and LII, as in hippocampus and neocortex, the absence of dendritic spines putatively identifies a cell as GABAergic (Ribak, 1978; Haberly, 1983; Houser et al., 1983; McCormick et al., 1985;Somogyi et al., 1985; Haberly et al., 1987), but this has yet to be shown for EN. It is likely that spiny multipolar cells in EN are glutamatergic and responsible for the recurrent positive feedback that precedes eEPSPs in EN (Hoffman and Haberly, 1991a).
Fig. 2.
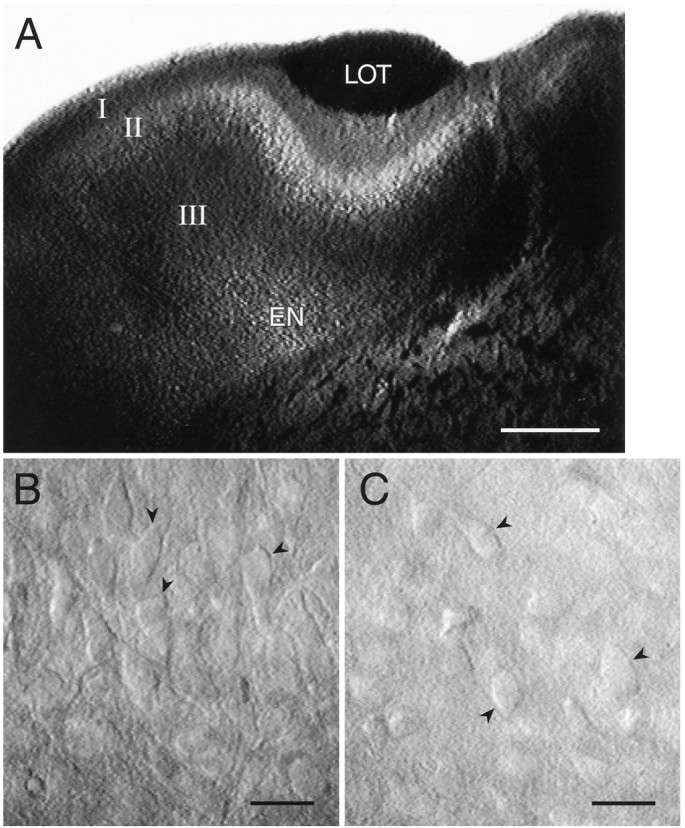
A, Low-power view of a typical piriform cortex slice used in these experiments. LI, LII,LIII, and EN are indicated. LOT, Lateral olfactory tract. B, Pyramidal cells in LII in a live piriform cortex slice. Healthy cells (arrowheads) had a three-dimensional appearance, with smooth, flat surfaces and no noticeable vacuoles. C, Multipolar cells in EN in a live piriform cortex slice. Arrowheads indicate healthy cells. Scale bars: A, 500 μm; B, C, 20 μm.
Fig. 3.

A, Biocytin-filled pyramidal cell in LII of piriform cortex. Distal basal and apical dendrites were out of the plane of focus. The border between LI and LII is visible at thetop right of the picture. B, Biocytin-filled multipolar cell in endopiriform nucleus. Dendrites can be seen extending both within and orthogonal to the plane of section.C, Higher-power view of a distal dendrite from the cell inB, showing dendritic spines (arrowheads). Scale bars: A, B, 50 μm; C, 20 μm.
Properties of outward currents
Recordings were obtained from 30 cells in LII and 49 cells in EN. Average input resistance, somatic capacitance, and specific input resistance for the two cell groups were 178 ± 32 MΩ, 14.3 ± 1.2 pF, and 15.7 ± 3.8 MΩ/pF (LII); 212 ± 35 MΩ, 18.8 ± 1.2 pF, and 13.3 ± 3.1 MΩ/pF (EN). Somatic capacitance was significantly different between LII and EN (p < 0.01), but the differences in input resistance and specific input resistance were not significant (p > 0.1). The latter observation differs from that reported by Tseng and Haberly (1989b) and may be related to differences between the patch and sharp electrode techniques or the age of the animals used.
Outward currents elicited in LII and EN neurons were composed of multiple components distinguished by their threshold and rate of inactivation (Fig. 4). Depolarizing voltage steps from −90 mV elicited a low threshold, rapidly inactivating outward current (IA), as well as higher threshold currents (Fig. 4A). In both EN and LII, the higher threshold current was composed of noninactivating and slowly inactivating components (Fig. 4B), the latter typically with biexponential decay. For the data in Figure 4A and B, approximate activation curves were derived from the early and late peak current amplitudes (Fig. 4C). For the cell illustrated, the two currents differed in their midpoints of activation by ∼13 mV.
Activation of IA
IA was investigated in detail in 18 cells in LII and 22 cells in EN. Depolarizing voltage steps from a holding potential of −90 mV were used to study the voltage dependence of activation and the kinetics of activation and inactivation (Fig.5). Currents from a cell in LII are shown in Figure5A, whereas Figure 5B shows data from a cell in EN. IA was substantially larger in LII than in EN, the difference exceeding 45% at −15 mV (Fig.5A,B; Table 2). Activation functions (mn∞(V)) were estimated using peak currents divided by the driving force (EK = −98 mV) for voltages in the range of −65 to −5 mV (Fig. 5C). No differences were observed between LII and EN for the normalized activation curve (Table 2).
Kinetics of activation and inactivation
In response to depolarizing voltage steps, currents peaked rapidly (<5 msec) and decayed back to zero within ∼50 msec (Fig.5A,B). For voltage steps in the range −55 mV to −15 mV, currents inactivated monoexponentially by >80% (dashed lines in Fig. 5A,B). Beyond this voltage, a slower kinetic component sometimes was observed, possibly reflecting contamination by other outward currents. Because this phenomenon was similar for LII and EN cells, it was not studied further.
IA activated and inactivated more rapidly in LII cells than in EN cells. t0.9pk was used as a measure of the activation kinetics, and the decaying currents were fitted to single exponentials to estimate τinact (Fig. 5A,B). At every voltage compared, both t0.9pk and τinact were significantly faster in LII cells than in EN cells (Fig. 5D,E; Table 2) (significance level p < 0.01 or smaller for each voltage, using Student’s t test). Relative to cells in EN, faster activation kinetics in LII cells would result in a largerIA in response to transient stimuli, consistent with the differences in steady-state properties discussed above, and this effect would be magnified by the larger peak current density observed in LII cells. The faster inactivation kinetics observed for LII cells would tend to counteract this effect.
Steady-state inactivation of IA
Steady-state inactivation of IA was studied using a standard inactivation protocol. Conditioning pulses of 500 msec to voltages ranging from −100 to −40 mV were followed by 50 msec test pulses to 0 mV. The resulting currents for a cell in LII are shown in Figure 6A, and those for a cell in EN are shown in Figure 6B. Conditioning pulses to −40 and −45 mV resulted in a small but easily discernibleIA in LII (Fig. 6A, bottom two traces), but in EN the current was inactivated completely (Fig. 6B, bottom two traces). This is better illustrated in Figure 6C, in which the normalized peak currents are plotted as a function of voltage to give an estimate ofh∞(V), the steady-state inactivation function for IA. The data for LII (triangles) and EN (squares) were well fitted by single Boltzmann functions, and the midpoints of inactivation differed for the two cell groups by ∼10 mV (Fig. 6C; Table2). The slope of h∞(V) did not differ for the two groups (p > 0.25).
To compare the steady-state current between the two cell groups, the product mn∞(V) · h∞(V) was computed for LII and EN cells using the Boltzmann fits shown in Figures 5C and6C. This function is the steady-state open probability at a given voltage. Between −70 and 0 mV,mn∞(V) · h∞(V) is larger for LII cells than for EN cells, the ratio exceeding 720% at −40 mV (Fig.7). However, because the function peaks closer to the resting potential (Erest) for EN than for LII (EN: peak = −65 mV, Erest = −68 mV; LII: peak = −53.5 mV, Erest = −74 mV) (Tseng and Haberly, 1989b), it is slightly larger atErest for EN than for LII (EN, 0.010; LII, 0.0072). These results imply that for small stimuli near the resting potential, IA will hyperpolarize the cell to a similar extent in LII and EN. However, for ongoing depolarizations (e.g., during bursting), IA in LII cells will be larger and will tend to oppose and shorten the depolarization to a greater extent than in EN. These differences in steady-state behavior will be magnified by the larger peak current density observed in LII (Fig. 5; Table 2).
Fig. 7.

mn∞(V) · h∞(V) in LII and EN. The product of the best-fitting activation and inactivation functions from Figures 5C and 6C are shown for LII (solid line) and EN (dashed line) to give the steady-state fraction of active IA channels. Resting potentials are indicated (arrows) on the respective curves for LII (−74 mV) and EN (−68 mV). Resting potential values are fromTseng and Haberly (1989b).
Development of IA and induction of eEPSPs in piriform cortex
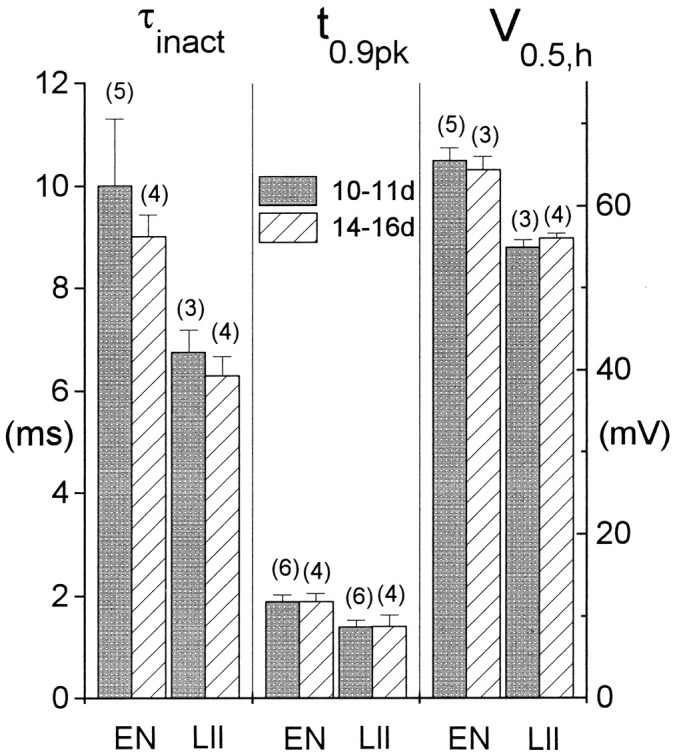
Piriform cortex is not fully mature physiologically and anatomically until the end of the third postnatal week (Schwob and Price, 1984; Schwob et al., 1984; Moriizumi et al., 1995). In addition, neurogenesis differs between LII and EN by ∼1.5 d, with EN cells originating first (Bayer, 1986; Bayer and Altman, 1991), implying that at any given age during the first 3 postnatal weeks, cells in LII and EN could be at different developmental stages. Several studies have shown that the properties of voltage-gated channels change during development (e.g., Bader et al., 1985; Aguayo, 1989; Hamill et al., 1991; Beck et al., 1992; Spigelman et al., 1992; Costa et al., 1994). However, technical limitations necessitated the use of younger animals for these experiments. Thus, it is possible that the differences observed between LII and EN in IA could be attributable to temporal expression patterns in cells at two different developmental ages. To address this issue, theIA data were divided into two age groups, 10–11 d and 14–16 d, and activation and inactivation parameters computed within each group. None of the parameters tested (i.e., those appearing in Table 2) varied with age. Data for τinact, t0.9pk, andV0.5,h are shown in Figure 8. Although τinact decreased slightly with age in both LII and EN, the changes were not statistically significant (p > 0.1). These results suggest that the differences between the two cell types cannot be attributed to differences in developmental state.
Fig. 8.
Development of IA in LII and EN. Shown are τinact (left four bars), t0.9pk (middle four bars), and V0.5,h (right four bars) for recordings from animals 10–11 d old (gray bars) and 14–16 d old (striped bars). Numbers of cells are given in parentheses. None of the parameters varied significantly with age (p ≥ 0.1). τinact and t0.9pkwere measured at −15 mV.
Another potential concern with using young animals is the relevance to induction and expression of epileptiform activity, which has been studied previously in adult animals. Because the exact roleIA plays in the induction process is unclear, it is difficult to address this issue directly. We found, however, that induction and expression of eEPSPs in young animals shared many similarities with the process in adult animals. Slices from animals ranging from 7 d to 20 d were bathed for 20–30 min in either 0 Mg2+ (n = 14) or low-Cl− ACSF (NaCl replaced by Na-isethionate;n = 17). eEPSPs always were present on returning to normal ACSF (data not shown). Before and after induction, synaptic responses in LII and EN were quite similar to those recorded in adult animals (Hoffman and Haberly, 1989; 1991a), although an important difference was observed for treatments with 0 Mg2+, where induction was always transient, lasting on average <1 hr. In slices treated with low Cl−, induction was maintained for the duration of the experiment (typically >4 hr), similar to adult animals after either treatment (Hoffman and Haberly, 1989).
High-threshold K currents
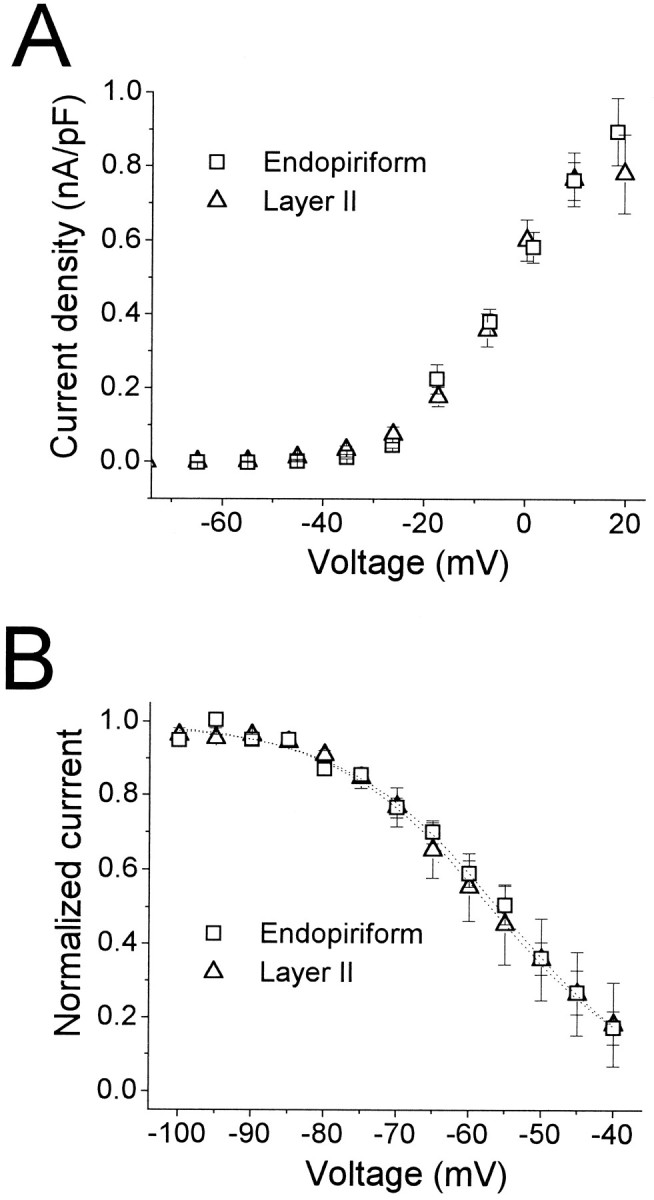
Although other K currents were not studied in detail, comparisons were made between LII and EN cells with regard to activation and inactivation of the total high-threshold current, i.e., the current remaining after the inactivation of IA was complete (Fig. 4). No effort was made to separate the different components of the high-threshold current. Figure9A shows the average current–voltage relationships for 31 cells in EN (squares) and 16 cells in LII (triangles), using the amplitude of the total outward current at the end of a 200 msec pulse. No significant differences were observed between the two cell groups. Differences also were not observed in steady-state inactivation of the slowly inactivating component of the high-threshold current, as illustrated in Figure9B (LII: n = 5; EN: n = 9). Although these two measures do not exclude the possibility of more subtle differences between LII and EN in the high-threshold components, they argue against any disparities that could substantially influence cell excitability in the two cell groups.
Fig. 9.
Properties of high-threshold K currents in LII and EN. A, Current–voltage relationships derived from responses at the end of 200 msec depolarizing voltage steps from −90 mV for cells in EN (squares; n = 31) and LII (triangles; n = 16). Current was averaged over the final 5 msec of the response. Voltages were corrected for series resistance errors and the data binned at approximately equal voltage increments. Voltage within each bin was averaged. In all cases, the horizontal SE bars were smaller than the symbol size. B, Steady-state inactivation data for the slowly inactivating K current recorded from cells in EN (n = 9) and LII (n = 5). The inactivation protocol used was similar to that illustrated in Figure 1, trace b, but the conditioning pulse duration was 10 sec, and the test pulse duration was 200 msec. Boltzmann fit parameters are LII: V0.5 = −57.0 ± 6.8 mV, k = 11.0 ± 2.8 mV; EN: V0.5 = −55.2 ± 3.9 mV, k = 11.2 ± 2.1 mV.
Simulations: inactivation of IA
The voltage-clamp experiments presented here were done on cells with intact dendrites and thus under limited voltage control. Modeling current flow has been used previously to aid in the interpretation of voltage-clamp data obtained under these conditions (Muller and Lux, 1993; White et al., 1995). It is important to investigate whether the differences in IA observed between LII and EN cells could be explained simply by different distributions ofIA channels along the somatic and dendritic membrane. In a passive cell, voltage applied at the soma will be attenuated in the dendrites, and the degree of attenuation will increase with electrotonic distance from the soma. To illustrate the problem with an extreme case, assume that the channels underlyingIA in EN and LII have identical properties, with the IA channels in EN located only at the soma, and the IA channels in LII located in a distal dendritic segment. If the voltage attenuation in this segment is 10 mV for a conditioning pulse to −40 mV, the voltage seen by the channels would be only −50 mV. Such a voltage error could potentially explain the difference observed between the two cell groups in V0.5,h ofh∞(V) (Fig.6C).
This issue was investigated using a simplified compartmental model of an LII cell. The goal was to determine whether placing “EN-like”IA channels (see Materials and Methods, Table 1) on dendritic compartments would produce anIA at the soma similar to that measured in LII cells. The implicit assumption is that the channels in EN all are located at the soma, but the results hold independent of this assumption. The simulations used an inactivation protocol similar to that used in our experiments. Voltage was applied to the soma, with 500 msec conditioning pulses to voltages ranging from −100 mV to −40 mV followed by test pulses to 0 mV. IAchannels were placed in a single compartment, the position for which varied from the soma to the most distal dendritic compartment. A uniform distribution also was tested, consisting ofIA channels located in every compartment. Channel density was adjusted for each configuration to give current amplitudes recorded at the soma for a conditioning pulse of −100 mV comparable to those seen in recordings from LII cells. The results are illustrated in Figure 10.
Fig. 10.
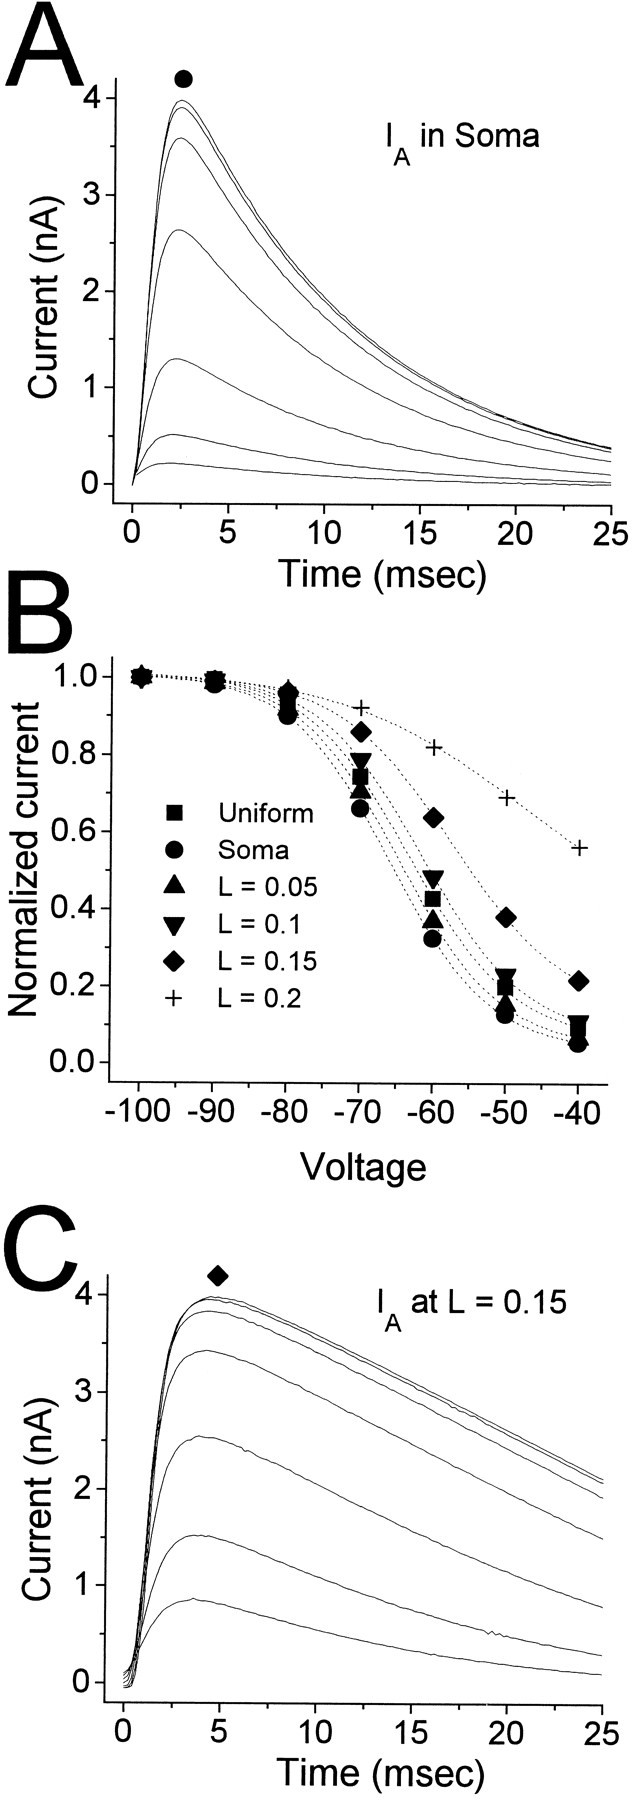
Simulated IAfrom a compartmental model of an LII cell (see Materials and Methods, Table 1). Simulations mimicked the inactivation protocol used in Figure6. A, Response of the model withIA confined to the somatic compartment (L = 0). B, Steady-state inactivation functions derived from the data in A (circles) and C(diamonds), as well as four otherIA distributions. Boltzmann fit parameters (in mV; V0.5,h, kh) are as follows: Uniform: −63.3, 7.15; Soma(L = 0): −65.8, 6.88; L = 0.05: −64.6, 6.93; L = 0.1: −61.5, 7.14; L = 0.15: −57.3, 7.87; L = 0.2: −47.0, 12.9. C, Same asA, but with IA confined to the third dendritic compartment (L = 0.15). Note that decays no longer appear exponential.
As expected, with IA channels located only at L = 0 (i.e., at the soma), the model produced currents in response to the inactivation protocol similar to those recorded in EN cells (Fig. 10A; compare with Fig. 6B), witht0.9pk = 1.60 msec and τinact = 10.0 msec for a conditioning pulse of −100 mV. The estimated h∞(V) function had V0.5,h = −65.8 mV andkh = 6.86 mV (Fig. 10B,circles; compare with Fig. 6C,squares). Placing the IAchannels in progressively more distal dendritic compartments yieldedhr∞(V) functions with more depolarized values for V0.5,h. The uniform case produced an h∞(V) function with an intermediate value of V0.5,h (−63.3 mV) (Fig. 10B, squares). A shift of 8.5 mV, slightly smaller than the difference between EN and LII, was produced by placingIA at L = 0.15 (i.e., dendritic compartment 3) [Fig. 10B (diamonds), C]. However, the slope of h∞(V) also was altered, with kh = 7.87 mV, 14% larger than for the L = 0 case. The kinetics ofIA recorded at the soma was distorted substantially by placing the IA channels in dendritic compartments. For the currents shown in Figure10C, t0.9pk = 2.5 msec, 56% longer than in the L = 0 case. The decay ofIA was no longer exponential for the conditioning pulse of −100 mV, but the time to decay 63% from peak was 31.8 msec, 318% slower than for L = 0. The slower kinetics associated with a depolarizing shift inh∞(V) is in contrast with the data recorded in LII and EN; a depolarizing shift inh∞(V) in LII relative to EN was associated with faster activation and inactivation kinetics (Figs.5D,E, 6C). Furthermore, our data always displayed exponential decays, in contrast to the simulation in Figure 10C.
Simulations: activation of IA
We also performed simulations using an activation protocol similar to that used for Figure 5, withmn∞(V) estimated from the normalized peak conductance. For IA located at the soma (L = 0), the currents produced were similar to those recorded in EN (data not shown) (V0.5,m = −20.4 mV; km = 10.7 mV). The Boltzmann parameters differed slightly from the experimental data (compare with Table 2) because of the limitation of using the peak current as an estimate of maximal activation. Although in our recordingsmn∞(V) did not differ between EN and LII (Fig. 5C; Table 2), moving theIA channels to more distal locations in the model altered both V0.5,m andkm. Interestingly, the shift inmn∞(V) was in the hyperpolarizing direction, contrary to the case forh∞(V). For example, withIA located at L = 0.15, V0.5,m = −26.8 mV, andkm = 13.5 mV. This hyperpolarizing shift occurred because in a partially clamped dendritic segment, activation of IA drove the voltage towardEK (−98 mV) and away from the command voltage at the soma.
Thus, both inactivation and activation parameters were altered by placing IA in dendritic compartments, but the changes were inconsistent with our recordings from LII and EN. For this model, it was not possible to produce currents similar toIA,LII using a model based onIA,EN, arguing strongly that the differences observed between EN and LII were not solely attributable to different spatial distributions of channels in the two cell groups.
Simulations: role of the high-threshold K current
Another issue investigated with the model was whether an unequal distribution of other voltage-activated K channels, in addition toIA, could contribute to the differences between IA,EN andIA,LII. We performed simulations with bothIA and the high-threshold K current shown in Figure 9 located in the same compartments. The subtraction protocol illustrated in Figure 1 was used to isolateIA. With both currents located at L = 0.15, IA never had exponential decay kinetics, contrary to what we observed in LII, and the resulting currents often were inward even for small depolarizing steps (data not shown). The reason for the latter observation is similar to that for the hyperpolarizing shift inmn∞(V). Activation of bothIA and the high-threshold K current drives the membrane potential further from the command potential than activation of the high-threshold current alone (because the total current is larger) and, thus, results in a smaller high-threshold current. When the subtraction protocol is used to isolateIA, the resulting current is inward. These results indicate that other K currents located in the dendrites cannot account for the differences we found betweenIA,EN andIA,LII.
Simulations: IA and cell excitability
To assess the contribution of IA to cell excitability in LII and EN, we also ran simulations with the model in current-clamp mode. Cells in EN and LII are known to have to have different resting potentials (EN: Erest = −68 mV; LII: Erest = −74 mV) (Tseng and Haberly, 1989b), and we first determined whether the differences between IA,EN andIA,LII could account for this observation. For each channel distribution, simulations initially were run usingIA,EN, and the leak adjusted to setErest = −68 mV.IA,LII then was substituted forIA,EN and the model allowed to reach a steady resting potential. Switching toIA,LII always resulted in a hyperpolarizing shift in the resting potential, but the magnitude of the shift was highly dependent on the channel distribution (Fig.11A). With channels located only at the soma (i.e., no dendritic compartments with IA), the difference in resting potential solely attributable to switching from IA,EN toIA,LII was ∼0.5 mV, <10% of the difference in Erest between EN and LII. However, with channels distributed uniformly throughout the model cell (i.e., IA in the soma and in all 20 dendritic compartments), the difference in resting potential was >6 mV, thus accounting for the difference observed inErest between LII and EN. We note that a uniform distribution of IA altered only slightly the simulated h∞(V) function (Fig. 10B) and gating kinetics (data not shown). Thus, the uniform distribution is consistent with our voltage-clamp data and will be used further in evaluating the effect of channel differences on excitability.
The previous simulations show that the differences betweenIA,EN andIA,LII could have substantial effects on the membrane potential of these cells in the steady state. BecauseIA is a rapid, inactivating current, its role usually is associated with more dynamic situations such as action potential repolarization, and we assessed howIA,EN andIA,LII might differentially affect spike width, latency, and interval during excitatory stimuli. There is little information available on the properties of other voltage- and Ca2+-dependent ion channels present in these two cell types. Therefore, we constructed the simplest model that was able to generate trains of action potentials in response to current pulses, using a fast, inactivating Na current (INa) and a delayed rectifier K current (IKDR) from a model of CA3 hippocampal pyramidal neurons (Traub, 1991) (see Materials and Methods). With the IA,EN,INa, and IKDRdistributed uniformly throughout the model cell, the resting potential was set to −68 mV by adjusting the leak conductance, and then the model stimulated with a 25 msec current pulse (0.3 nA) (Fig.11B, solid line).IA,LII then was substituted forIA,EN, the model was allowed to reach its new resting potential, and the current stimulation was repeated (Fig.11B, dashed line). The largest effect was on the first spike latency, which increased from 3.8 msec (EN) to 7.5 msec (LII) because of the difference in Erest. Interestingly, the interspike interval was increased by <3% when switching from IA,EN toIA,LII, and the effect on action potential width also was modest, with IA,EN resulting in a 17% increase in duration (width at half amplitude) relative toIA,LII (Fig. 11C).
These current-clamp simulations suggest that the presence ofIA,LII versusIA,EN will have the strongest effect when the channels are distributed widely in the cell. The primary influence on cell excitability is via steady-state behaviors such as the resting potential. We wish to emphasize, however, that no attempt was made to investigate the model dependence of the simulations onINa and IKDR, and the effects on action potential parameters should be interpreted only qualitatively until more complete biophysical descriptions can be made of these two cell types.
DISCUSSION
We have observed differences in IAbetween cells in LII and EN in slices of piriform cortex. Biocytin labeling in a subset of these experiments confirms that most, if not all, of the recordings came from superficial pyramidal cells in LII and deep, spiny multipolar cells in EN. Because EN is the site of origin for eEPSPs, the observed layer-specific properties ofIA may be functionally relevant to epileptogenesis in piriform cortex. IA,ENhas a smaller peak amplitude than IA,LII, and its steady-state inactivation function is shifted to hyperpolarized potentials. These differences combine to make the steady-stateIA,EN smaller in amplitude at any given voltage, and also make it less available to counteract transient depolarizing stimuli. Both of these effects would contribute to the enhanced excitability in deep cells described in previous studies on piriform cortex (Tseng and Haberly, 1989b). Simulations with a simplified action potential generator show that the differences in kinetics may be less important, because the effects of slower activation tend to counteract the effects of slower inactivation. The result with τinact (Fig. 5E) was unexpected within the framework of the Hodgkin–Huxley model, in which a hyperpolarizing shift in steady-state inactivation for EN (Fig. 6) would be accompanied by faster inactivation kinetics, not slower as observed here. This suggests either that recovery from inactivation is much slower in EN than in LII or that the process of inactivation is not a two-state process, as in the Hodgkin–Huxley model.
Comparisons to other systems
IA has been found in numerous cell types in nearly all invertebrates and vertebrates studied (Rogawski, 1985), including most cells in hippocampus and neocortex. Steady-state inactivation of IA,LII was similar to that observed in neocortical pyramidal cells, in whichV0.5,h ranged from approximately −50 to −60 mV (Spain et al., 1991; Foehring and Surmeier, 1993), but was different from that observed in CA1 pyramidal neurons, in whichV0.5,h was more negative than −80 mV (Numann et al., 1987; Ficker and Heinemann, 1992; Wu and Barish, 1992). The value for V0.5,h for IA,EN(−65.2 mV) was similar to that reported for dentate gyrus neurons (−65 mV) (Beck et al., 1992). Conversely, the kinetics of inactivation was slower in both LII and EN neurons than in neocortical cells (Spain et al., 1991; Foehring and Surmeier, 1993), but similar to hippocampal (Numann et al., 1987; Wu and Barish, 1992), thalamic (Huguenard et al., 1991), and sensory neurons (McFarlane and Cooper, 1991), when differences in the temperature at which the experiments were performed are taken into account.
Previous studies have provided evidence for layer-specific differences in the membrane properties of cortical neurons under current clamp (McCormick et al., 1985; Kawaguchi, 1993, 1995; Connors, 1994), but there have been very few studies of voltage-gated channels in identified cortical cells. In isolated neocortical cells, Hamill et al. (1991) found differences between pyramidal and nonpyramidal neurons in sodium, potassium, and calcium currents. Interestingly, the most striking difference observed was that nonpyramidal cells did not express IA. Thus, variations inIA may constitute an important mechanism for differential regulation of membrane excitability in cortical neurons.
Space-clamp issues
Immunohistochemical and in situ hybridization studies of the intracellular distribution of IAchannels cloned from mammalian brain suggest that the channels can be localized to axonal and dendritic processes (Sheng et al., 1992;Maletic-Savatic et al., 1995), regions that are under variable voltage-clamp control in our recordings. Compounding this problem,IA has relatively fast kinetics, and would be subject to substantial distortion attributable to dendritic filtering in regions electrically remote from the soma (Rall, 1977). For these reasons, the quantitative analysis presented here may not reflect accurately the properties of IAchannels in the two cell types. However, the differences observed strongly imply that there are differences in the channels underlyingIA,LII andIA,EN. Simulations showed that the observed properties were inconsistent with these differences being solely attributable to differences in space-clamp errors in the two cell types (Fig. 10). Although moving the IA channels to more distal locations in the model resulted in a depolarizing shift in the steady-state inactivation curve, as observed forIA,LII relative toIA,EN, the shift was associated with slower kinetics and nonexponential current decays, as well changes in the activation function mn∞(V). This stands in contrast to what we observed in LII neurons. We cannot exclude the possibility that differences in channel distribution also contributed to the observed differences inIA. For example, ifIA,LII had even faster activation and inactivation kinetics than we observed, but was located distally, a 10 mV difference in steady-state inactivation might be possible. Under these conditions, however, we would not expect the recorded currents to have the observed exponential inactivation kinetics (Fig.10C)
Molecular basis of channel differences
The differences between IA,LII andIA,EN could arise from many possible sources, including subunit composition and post-translational modification. At least three α subunit mRNAs have been cloned from mammalian brain that encode fast-inactivating K channels when expressed as homomultimers (Stuhmer et al., 1989; Tseng-Crank et al., 1990;Baldwin et al., 1991; Pak et al., 1991; Schroter et al., 1991). Heteromultimeric combinations of α subunits within K-channel families can form fast-inactivating channels with properties distinct from their corresponding homomultimeric components (Isacoff et al., 1990;Ruppersberg et al., 1990). Coexpression of α and β subunits also can dramatically alter the inactivation properties of K channels (Rettig et al., 1994; McCormack et al., 1995; Morales et al., 1995). Potential mechanisms of post-translational modification include phosphorylation (Walsh and Kaas, 1988; Augustine and Bezanilla, 1990;Moran et al., 1991; Covarrubias et al., 1994), cysteine oxidation (Ruppersberg et al., 1991), and direct modulation by lipid metabolites (Ordway et al., 1989; Bowlby and Levitan, 1995), all of which have been shown to modulate K channels in other systems. Additional experiments on the laminar distribution of K channels in piriform cortex and electrophysiological studies using patches pulled from cells in EN and LII would help to distinguish among these different mechanisms.
Implications for circuit behavior
The properties of IA,LII andIA,EN could have relevance to epileptogenesis in piriform cortex, because intrinsic membrane properties are believed to play a role in determining epileptic foci elsewhere in the brain (Connors, 1994). For example, burst firing is more pronounced in hippocampal cells in regions prone to generating epileptiform behavior (Jefferys, 1990), and alterations in intrinsic excitability may contribute to the development of epileptiform behavior in neocortex and thalamus in vivo and in vitro(Mody et al., 1990; Vreugdenhil and Wadman, 1992; Prince and Tseng, 1993; Barkai et al., 1994; Tsakiridou et al., 1995). Although no substantial differences were observed in IAbefore and after induction of eEPSPs in piriform cortex (M. Banks, L. Haberly, and M. Jackson, unpublished observations), differences in the properties of IA,LII andIA,EN could contribute to the susceptibility of EN to induction. IA has been shown to play prominent roles in regulating excitability in other systems, from invertebrates to mammalian central neurons (Connors and Stevens, 1971a,b; Neher, 1971; Daut, 1973; Segal et al., 1984; Kaang et al., 1992). Particularly relevant are studies in sympathetic ganglia of guinea pigs, in which differences in steady-state inactivation ofIA were shown to contribute to differences in the firing properties and synaptic responses of phasic and tonic cells (Cassell and McLachlan, 1986; Cassell et al., 1986). In tonic cells, IA is more prominent at rest, allowing for regular, repetitive firing in response to sustained stimuli. IA also shortens excitatory synaptic potentials significantly, reducing the excitability of tonic neurons in response to synaptic stimuli.
Our simulation results indicate that the primary effects of the differences in the steady-state properties ofIA (Fig. 6C) and the smaller current density observed in EN (Table 2) are via alterations in steady-state behavior (e.g., resting potential). Although not tested with the model, we also would expect larger and more sustained steady-state depolarizations in EN relative to LII, for example, during the bursting behavior that induces eEPSPs. Induction of eEPSPs is dependent on Ca2+ influx through NMDA receptors (Hoffman and Haberly, 1989), and depolarization enhances this influx because of the intrinsic voltage dependence of NMDA receptors. Thus, the differences between LII and EN in the density and steady-state inactivation of IA would result in greater influxes of Ca2+ in EN cells than in LII cells during bursting. If intracellular [Ca2+] must exceed some threshold level for induction to occur, then EN could be more susceptible to induction than LII because of a less prominentIA at depolarized voltages. Expression of eEPSPs also would be enhanced in EN, in whichIA,EN would be less able to counter the reverberative excitation that immediately precedes eEPSPs at their site of origin. The more depolarized resting potentials in EN cells, in part attributable to IA,EN, would allow for more rapid responses to excitatory input, as reflected in the shorter latencies observed in our model (Fig. 11B). These results suggest that biophysical differences between cell types may contribute to layer-specific plasticity in cortex.
Footnotes
Received Nov. 11, 1995; revised March 19, 1996; accepted March 21, 1996.
This work was supported by National Research Service Award (National Institute of Neurological Disorders and Stroke) NS09307 as well as the American Epilepsy Foundation with support from the Milken Family Medical Foundation (I.M.), and National Institutes of Health Grant NS19865 (L.B.). We thank R. Pearce for comments on this manuscript; J. Bartfeld and S. Deyo for help with the statistical calculations; R. Demir and E. Dent for assistance with the video images of live slices; and I. Sigglekow, J. Eckleberry, and J. Meister for histological processing of the tissue.
Correspondence should be addressed to Matthew I. Banks, University of Wisconsin, Department of Anesthesiology, 1300 University Avenue, Room 43 Bardeen Labs, Madison, WI 53706.
REFERENCES
- 1.Adams JC. Heavy metal intensification of DAB-based HRP reaction product. J Histochem Cytochem. 1981;29:775. doi: 10.1177/29.6.7252134. [DOI] [PubMed] [Google Scholar]
- 2.Aguayo LG. Postnatal development of K+ currents studied in isolated rat pineal cells. J Physiol (Lond) 1989;414:283–300. doi: 10.1113/jphysiol.1989.sp017688. [DOI] [PMC free article] [PubMed] [Google Scholar]
- 3.Augustine CK, Bezanilla F. Phosphorylation modulates potassium conductance and gating current of perfused giant axons of squid. J Gen Physiol. 1990;95:245–271. doi: 10.1085/jgp.95.2.245. [DOI] [PMC free article] [PubMed] [Google Scholar]
- 4.Bader CR, Bertrand D, Dupin E. Voltage-dependent potassium currents in developing neurones from quail mesencephalic neural crest. J Physiol (Lond) 1985;366:129–151. doi: 10.1113/jphysiol.1985.sp015789. [DOI] [PMC free article] [PubMed] [Google Scholar]
- 5.Baldwin TJ, Tsaur ML, Lopez GA, Jan YN, Jan LY. Characterization of a mammalian cDNA for an inactivating voltage-sensitive K+ channel. Neuron. 1991;7:471–483. doi: 10.1016/0896-6273(91)90299-f. [DOI] [PubMed] [Google Scholar]
- 6.Banks MI, Jackson MB. Superficial and deep neurons in piriform cortex differ in the inactivation of IA. Soc Neurosci Abstr. 1995;21:506. [Google Scholar]
- 7.Barkai E, Grossman Y, Gutnick MJ. Long-term changes in neocortical activity after chemical kindling with systemic pentylenetetrazole: an in vitro study. J Neurophysiol. 1994;72:72–83. doi: 10.1152/jn.1994.72.1.72. [DOI] [PubMed] [Google Scholar]
- 8.Bayer SA. Neurogenesis in the rat primary olfactory cortex. Int J Dev Neurosci. 1986;4:251–271. doi: 10.1016/0736-5748(86)90063-8. [DOI] [PubMed] [Google Scholar]
- 9.Bayer SA, Altman J. Development of the endopiriform nucleus and the claustrum in the rat brain. Neuroscience. 1991;45:391–412. doi: 10.1016/0306-4522(91)90236-h. [DOI] [PubMed] [Google Scholar]
- 10.Beck H, Ficker E, Heinemann U. Properties of two voltage-activated potassium currents in acutely isolated juvenile rat dentate gyrus granule cells. J Neurophysiol. 1992;68:2086–2099. doi: 10.1152/jn.1992.68.6.2086. [DOI] [PubMed] [Google Scholar]
- 11.Bowlby MR, Levitan IB. Block of cloned voltage-gated potassium channels by the second messenger diacylglycerol independent of protein kinase C. J Neurophysiol. 1995;73:2221–2229. doi: 10.1152/jn.1995.73.6.2221. [DOI] [PubMed] [Google Scholar]
- 12.Cassell JF, McLachlan EM. The effect of a transient outward current (IA) on synaptic potentials in sympathetic ganglion cells of the guinea-pig. J Physiol (Lond) 1986;374:273–288. doi: 10.1113/jphysiol.1986.sp016079. [DOI] [PMC free article] [PubMed] [Google Scholar]
- 13.Cassell JF, Clark AL, McLachlan EM. Characteristics of phasic and tonic sympathetic ganglion cells of the guinea-pig. J Physiol (Lond) 1986;372:457–483. doi: 10.1113/jphysiol.1986.sp016020. [DOI] [PMC free article] [PubMed] [Google Scholar]
- 14.Connors BW. Intrinsic neuronal physiology and the functions, dysfunctions and development of neocortex. Prog Brain Res. 1994;102:195–203. doi: 10.1016/S0079-6123(08)60540-3. [DOI] [PubMed] [Google Scholar]
- 15.Connor JA, Stevens CF. Voltage clamp studies of a transient outward membrane current in gastropod neural somata. J Physiol (Lond) 1971a;213:21–30. doi: 10.1113/jphysiol.1971.sp009365. [DOI] [PMC free article] [PubMed] [Google Scholar]
- 16.Connor JA, Stevens CF. Prediction of repetitive firing behaviour from voltage clamp data on an isolated neurone soma. J Physiol (Lond) 1971b;213:31–53. doi: 10.1113/jphysiol.1971.sp009366. [DOI] [PMC free article] [PubMed] [Google Scholar]
- 17.Costa PF, Santos AI, Ribeiro MA (1994) Potassium currents in acutely isolated maturing rat hippocampal CA1 neurones. Brain Res 216–223. [DOI] [PubMed]
- 18.Covarrubias M, Wei A, Salkoff L, Vyas TB. Elimination of rapid potassium channel inactivation by phosphorylation of the inactivation gate. Neuron. 1994;13:1403–1412. doi: 10.1016/0896-6273(94)90425-1. [DOI] [PMC free article] [PubMed] [Google Scholar]
- 19.Daut J. Modulation of the excitatory synaptic response by fast transient K+ current in snail neurones. Nature New Biol. 1973;246:193–196. doi: 10.1038/newbio246193a0. [DOI] [PubMed] [Google Scholar]
- 20.De Schutter E. Computer software for development and simulation of compartmental models of neurons. Comput Biol Med. 1989;19:71–81. doi: 10.1016/0010-4825(89)90001-2. [DOI] [PubMed] [Google Scholar]
- 21.Drewe JA, Verma S, Frech G, Joho RH. Distinct spatial and temporal expression patterns of K+ channel mRNAs from different subfamilies. J Neurosci. 1992;12:538–548. doi: 10.1523/JNEUROSCI.12-02-00538.1992. [DOI] [PMC free article] [PubMed] [Google Scholar]
- 22.Edwards FA, Konnerth A, Sakmann B, Takahashi T. A thin slice preparation for patch clamp recordings from neurones of the mammalian central nervous system. Pflügers Arch. 1989;414:600–612. doi: 10.1007/BF00580998. [DOI] [PubMed] [Google Scholar]
- 23.Ficker E, Heinemann U. Slow and fast transient potassium currents in cultured rat hippocampal cells. J Physiol (Lond) 1992;445:431–455. doi: 10.1113/jphysiol.1992.sp018932. [DOI] [PMC free article] [PubMed] [Google Scholar]
- 24.Foehring RC, Surmeier DJ. Voltage-gated potassium currents in acutely dissociated rat cortical neurons. J Neurophysiol. 1993;70:51–63. doi: 10.1152/jn.1993.70.1.51. [DOI] [PubMed] [Google Scholar]
- 25.Haberly LB. Structure of the piriform cortex of the opossum. I. Description of neuron types with Golgi methods. J Comp Neurol. 1983;213:163–187. doi: 10.1002/cne.902130205. [DOI] [PubMed] [Google Scholar]
- 26.Haberly LB, Sutula TP. Neuronal processes that underlie expression of kindled epileptiform events in the piriform cortex in vivo. J Neurosci. 1992;12:2211–2224. doi: 10.1523/JNEUROSCI.12-06-02211.1992. [DOI] [PMC free article] [PubMed] [Google Scholar]
- 27.Haberly LB, Hansen DJ, Feig SL, Presto S. Distribution and ultrastructure of neurons in opossum piriform cortex displaying immunoreactivity to GABA and GAD and high-affinity tritiated GABA uptake. J Comp Neurol. 1987;266:269–290. doi: 10.1002/cne.902660211. [DOI] [PubMed] [Google Scholar]
- 28.Hamill OP, Marty A, Neher E, Sakmann B, Sigworth FJ. Improved patch-clamp techniques for high-resolution current recording from cells and cell-free membrane patches. Pflügers Arch. 1981;391:85–100. doi: 10.1007/BF00656997. [DOI] [PubMed] [Google Scholar]
- 29.Hamill OP, Huguenard JR, Prince DA. Patch-clamp studies of voltage-gated currents in identified neurons of the rat cerebral cortex. Cereb Cortex. 1991;1:48–61. doi: 10.1093/cercor/1.1.48. [DOI] [PubMed] [Google Scholar]
- 30.Hille B. Sinauer; Sunderland, MA: 1992. Ionic channels of excitable membranes. [Google Scholar]
- 31.Hoffman WH, Haberly LB. Bursting induces persistent all-or-none EPSPs by an NMDA-dependent process in piriform cortex. J Neurosci. 1989;9:206–215. doi: 10.1523/JNEUROSCI.09-01-00206.1989. [DOI] [PMC free article] [PubMed] [Google Scholar]
- 32.Hoffman WH, Haberly LB. Bursting-induced epileptiform EPSPs in slices of piriform cortex are generated by deep cells. J Neurosci. 1991a;11:2021–2031. doi: 10.1523/JNEUROSCI.11-07-02021.1991. [DOI] [PMC free article] [PubMed] [Google Scholar]
- 33.Hoffman WH, Haberly LB. Epileptiform potentials in slices of piriform cortex from kindled rats originate in deep structures. Soc Neurosci Abstr. 1991b;17:511. [Google Scholar]
- 34.Hoffman WH, Haberly LB. Role of synaptic excitation in the generation of bursting-induced epileptiform potentials in the endopiriform nucleus and piriform cortex. J Neurophysiol. 1993;70:2550–2561. doi: 10.1152/jn.1993.70.6.2550. [DOI] [PubMed] [Google Scholar]
- 35.Horikawa K, Armstrong WE. A versatile means of intracellular labelling: injection of biocytin and its detection with avidin conjugates. J Neurosci Methods. 1988;25:1–11. doi: 10.1016/0165-0270(88)90114-8. [DOI] [PubMed] [Google Scholar]
- 36.Houser CR, Crawford GD, Barber RP, Salvaterra PM, Vaughn JE. Organization and morphological characteristics of cholinergic neurons: an immunocytochemical study with a monoclonal antibody to choline acetyltransferase. Brain Res. 1983;266:97–119. doi: 10.1016/0006-8993(83)91312-4. [DOI] [PubMed] [Google Scholar]
- 37.Huguenard JR, Coulter DA, Prince DA. A fast transient potassium current in thalamic relay neurons: kinetics of activation and inactivation. J Neurophysiol. 1991;66:1304–1315. doi: 10.1152/jn.1991.66.4.1304. [DOI] [PubMed] [Google Scholar]
- 38.Isacoff EY, Jan YN, Jan LY. Evidence for the formation of heteromultimeric potassium channels in Xenopus oocytes. Nature. 1990;345:530–534. doi: 10.1038/345530a0. [DOI] [PubMed] [Google Scholar]
- 39.Jackson MB. Cable analysis with the whole-cell patch clamp: theory and experiment. Biophysiol J. 1992;61:756–766. doi: 10.1016/S0006-3495(92)81880-5. [DOI] [PMC free article] [PubMed] [Google Scholar]
- 40.Jefferys JG. Basic mechanisms of focal epilepsies. Exp Physiol. 1990;75:127–162. doi: 10.1113/expphysiol.1990.sp003390. [DOI] [PubMed] [Google Scholar]
- 41.Kaang BK, Pfaffinger PJ, Grant SG, Kandel ER, Furukawa Y. Overexpression of an Aplysia shaker K+ channel gene modifies the electrical properties and synaptic efficacy of identified Aplysia neurons. Proc Natl Acad Sci USA. 1992;89:1133–1137. doi: 10.1073/pnas.89.3.1133. [DOI] [PMC free article] [PubMed] [Google Scholar]
- 42.Kapur A (1995) GABAergic regulation of the NMDA component and synaptic plasticity in piriform cortex. PhD thesis, University of Wisconsin-Madison.
- 43.Kawaguchi Y. Groupings of nonpyramidal and pyramidal cells with specific physiological and morphological characteristics in rat frontal cortex. J Neurophysiol. 1993;69:416–431. doi: 10.1152/jn.1993.69.2.416. [DOI] [PubMed] [Google Scholar]
- 44.Kawaguchi Y. Physiological subgroups of nonpyramidal cells with specific morphological characteristics in layer II/III of rat frontal cortex. J Neurosci. 1995;15:2638–2655. doi: 10.1523/JNEUROSCI.15-04-02638.1995. [DOI] [PMC free article] [PubMed] [Google Scholar]
- 45.Maletic-Savatic M, Lenn NJ, Trimmer JS. Differential spatiotemporal expression of K+ channel polypeptides in rat hippocampal neurons developing in situ and in vitro. J Neurosci. 1995;15:3840–3851. doi: 10.1523/JNEUROSCI.15-05-03840.1995. [DOI] [PMC free article] [PubMed] [Google Scholar]
- 46.McCormick DA, Connors BW, Lighthall JW, Prince DA. Comparative electrophysiology of pyramidal and sparsely spiny stellate neurons of the neocortex. J Neurophysiol. 1985;54:782–806. doi: 10.1152/jn.1985.54.4.782. [DOI] [PubMed] [Google Scholar]
- 47.McCormack K, McCormack T, Tanouye M, Rudy B, Stuhmer W. Alternative splicing of the human Shaker K+ channel β1 gene and functional expression of the β2 gene product. FEBS Lett. 1995;370:32–36. doi: 10.1016/0014-5793(95)00785-8. [DOI] [PubMed] [Google Scholar]
- 48.McFarlane S, Cooper E. Kinetics and voltage dependence of A-type currents on neonatal rat sensory neurons. J Neurophysiol. 1991;66:1380–1391. doi: 10.1152/jn.1991.66.4.1380. [DOI] [PubMed] [Google Scholar]
- 49.McIntyre DC, Racine RJ. Kindling mechanisms: current progress on an experimental epilepsy model. Prog Neurobiol. 1986;27:1–12. doi: 10.1016/0301-0082(86)90010-9. [DOI] [PubMed] [Google Scholar]
- 50.McIntyre DC, Wong RK. Cellular and synaptic properties of amygdala-kindled pyriform cortex in vitro. J Neurophysiol. 1986;55:1295–1307. doi: 10.1152/jn.1986.55.6.1295. [DOI] [PubMed] [Google Scholar]
- 51.Mody I, Reynolds JN, Salter MW, Carlen PL, MacDonald JF. Kindling-induced epilepsy alters calcium currents in granule cells of rat hippocampal slices. Brain Res. 1990;531:88–94. doi: 10.1016/0006-8993(90)90761-y. [DOI] [PubMed] [Google Scholar]
- 52.Morales MJ, Castellino RC, Crews AL, Rasmusson RL, Strauss HC. A novel beta subunit increases rate of inactivation of specific voltage-gated potassium channel alpha subunits. J Biol Chem. 1995;270:6272–6277. doi: 10.1074/jbc.270.11.6272. [DOI] [PubMed] [Google Scholar]
- 53.Moran O, Dascal N, Lotan I. Modulation of a Shaker potassium A-channel by protein kinase C activation. FEBS Lett. 1991;279:256–260. doi: 10.1016/0014-5793(91)80162-v. [DOI] [PubMed] [Google Scholar]
- 54.Moriizumi T, Sakashita H, Furukawa M, Kawano J, Okoyama S, Kitao Y, Kudo M. Electron microscopic study of synaptogenesis and myelination of the olfactory centers in developing rats. Exp Brain Res. 1995;103:385–392. doi: 10.1007/BF00241497. [DOI] [PubMed] [Google Scholar]
- 55.Muller W, Lux HD. Analysis of voltage-dependent membrane currents in spatially extended neurons from point-clamp data. J Neurophysiol. 1993;69:241–247. doi: 10.1152/jn.1993.69.1.241. [DOI] [PubMed] [Google Scholar]
- 56.Neher E. Two fast transient current components during voltage clamp on snail neurons. J Gen Physiol. 1971;58:36–53. doi: 10.1085/jgp.58.1.36. [DOI] [PMC free article] [PubMed] [Google Scholar]
- 57.Numann RE, Wadman WJ, Wong RK. Outward currents of single hippocampal cells obtained from the adult guinea-pig. J Physiol (Lond) 1987;393:331–353. doi: 10.1113/jphysiol.1987.sp016826. [DOI] [PMC free article] [PubMed] [Google Scholar]
- 58.Ordway RW, Walsh JV, Jr, Singer JJ. Arachidonic acid and other fatty acids directly activate potassium channels in smooth muscle cells. Science. 1989;244:1176–1179. doi: 10.1126/science.2471269. [DOI] [PubMed] [Google Scholar]
- 59.Pak MD, Baker K, Covarrubias M, Butler A, Ratcliffe A, Salkoff L. mShal, a subfamily of A-type K+ channel cloned from mammalian brain. Proc Natl Acad Sci USA. 1991;88:4386–4390. doi: 10.1073/pnas.88.10.4386. [DOI] [PMC free article] [PubMed] [Google Scholar]
- 60.Piredda S, Gale K. A crucial epileptogenic site in the deep prepiriform cortex. Nature. 1985;317:623–625. doi: 10.1038/317623a0. [DOI] [PubMed] [Google Scholar]
- 61.Prince DA, Tseng GF. Epileptogenesis in chronically injured cortex: in vitro studies. J Neurophysiol. 1993;69:1276–1291. doi: 10.1152/jn.1993.69.4.1276. [DOI] [PubMed] [Google Scholar]
- 62.Racine RJ, Mosher M, Kairiss EW. The role of the pyriform cortex in the generation of interictal spikes in the kindled preparation. Brain Res. 1988;454:251–263. doi: 10.1016/0006-8993(88)90825-6. [DOI] [PubMed] [Google Scholar]
- 63.Rall W. Core conductor theory and cable properties of neurons. In: Brookhart JM, Mountcastle VB, editors. Handbook of physiology: the nervous system. Cellular biology of neurons. American Physiological Society; Bethesda, MD: 1977. pp. 39–97. [Google Scholar]
- 64.Rettig J, Heinemann SH, Wunder F, Lorra C, Parcej DN, Dolly JO, Pongs O. Inactivation properties of voltage-gated K+ channels altered by presence of beta-subunit. Nature. 1994;369:289–294. doi: 10.1038/369289a0. [DOI] [PubMed] [Google Scholar]
- 65.Ribak CE. Aspinous and sparsely-spinous stellate neurons in the visual cortex of rats contain glutamic acid decarboxylase. J Neurocytol. 1978;7:461–478. doi: 10.1007/BF01173991. [DOI] [PubMed] [Google Scholar]
- 66.Rogawski MA. The A-current: how ubiquitous a feature of excitable cells is it? Trends Neurosci. 1985;8:214–219. [Google Scholar]
- 67.Ruppersberg JP, Schroter KH, Sakmann B, Stocker M, Sewing S, Pongs O. Heteromultimeric channels formed by rat brain potassium-channel proteins. Nature. 1990;345:535–537. doi: 10.1038/345535a0. [DOI] [PubMed] [Google Scholar]
- 68.Ruppersberg JP, Stocker M, Pongs O, Heinemann SH, Frank R, Koenen M. Regulation of fast inactivation of cloned mammalian IK(A) channels by cysteine oxidation. Nature. 1991;352:711–714. doi: 10.1038/352711a0. [DOI] [PubMed] [Google Scholar]
- 69.Schroter KH, Ruppersberg JP, Wunder F, Rettig J, Stocker M, Pongs O. Cloning and functional expression of a TEA-sensitive A-type potassium channel from rat brain. FEBS Lett. 1991;278:211–216. doi: 10.1016/0014-5793(91)80119-n. [DOI] [PubMed] [Google Scholar]
- 70.Schwob JE, Price JL. The development of axonal connections in the central olfactory system of rats. J Comp Neurol. 1984;223:177–202. doi: 10.1002/cne.902230204. [DOI] [PubMed] [Google Scholar]
- 71.Schwob JE, Haberly LB, Price JL. The development of physiological responses of the piriform cortex in rats to stimulation of the lateral olfactory tract. J Comp Neurol. 1984;223:223–237. doi: 10.1002/cne.902230206. [DOI] [PubMed] [Google Scholar]
- 72.Segal M, Rogawski MA, Barker JL. A transient potassium conductance regulates the excitability of cultured hippocampal and spinal neurons. J Neurosci. 1984;4:604–609. doi: 10.1523/JNEUROSCI.04-02-00604.1984. [DOI] [PMC free article] [PubMed] [Google Scholar]
- 73.Sheng M, Tsaur ML, Jan YN, Jan LY. Subcellular segregation of two A-type K+ channel proteins in rat central neurons. Neuron. 1992;9:271–284. doi: 10.1016/0896-6273(92)90166-b. [DOI] [PubMed] [Google Scholar]
- 74.Somogyi P, Freund TF, Hodgson AJ, Somogyi J, Beroukas D, Chubb IW. Identified axo-axonic cells are immunoreactive for GABA in the hippocampus and visual cortex of the cat. Brain Res. 1985;332:143–149. doi: 10.1016/0006-8993(85)90397-x. [DOI] [PubMed] [Google Scholar]
- 75.Spain WJ, Schwindt PC, Crill WE. Two transient potassium currents in layer V pyramidal neurones from cat sensorimotor cortex. J Physiol (Lond) 1991;434:591–607. doi: 10.1113/jphysiol.1991.sp018488. [DOI] [PMC free article] [PubMed] [Google Scholar]
- 76.Spigelman I, Zhang L, Carlen PL. Patch-clamp study of postnatal development of CA1 neurons in rat hippocampal slices: membrane excitability and K+ currents. J Neurophysiol. 1992;68:55–69. doi: 10.1152/jn.1992.68.1.55. [DOI] [PubMed] [Google Scholar]
- 77.Stuhmer W, Ruppersberg JP, Schroter KH, Sakmann B, Stocker M, Giese KP, Perschke A, Baumann A, Pongs O. Molecular basis of functional diversity of voltage-gated potassium channels in mammalian brain. EMBO J. 1989;8:3235–3244. doi: 10.1002/j.1460-2075.1989.tb08483.x. [DOI] [PMC free article] [PubMed] [Google Scholar]
- 78.Traub RD, Wong RKS, Miles R, Michelson H. A model of a CA3 hippocampal pyramidal neuron incorporating voltage-clamp data on intrinsic conductances. J Neurophysiol. 1991;66:635–650. doi: 10.1152/jn.1991.66.2.635. [DOI] [PubMed] [Google Scholar]
- 79.Tsakiridou E, Bertollini L, de Curtis M, Avanzini G, Pape HC. Selective increase in T-type calcium conductance of reticular thalamic neurons in a rat model of absence epilepsy. J Neurosci. 1995;15:3110–3117. doi: 10.1523/JNEUROSCI.15-04-03110.1995. [DOI] [PMC free article] [PubMed] [Google Scholar]
- 80.Tsaur ML, Sheng M, Lowenstein DH, Jan YN, Jan LY. Differential expression of K+channel mRNAs in the rat brain and down-regulation in the hippocampus following seizures. Neuron. 1992;8:1055–1067. doi: 10.1016/0896-6273(92)90127-y. [DOI] [PubMed] [Google Scholar]
- 81.Tseng GF, Haberly LB. Deep neurons in piriform cortex. I. Morphology and synaptically evoked responses including a unique high-amplitude paired shock facilitation. J Neurophysiol. 1989a;62:369–385. doi: 10.1152/jn.1989.62.2.369. [DOI] [PubMed] [Google Scholar]
- 82.Tseng GF, Haberly LB. Deep neurons in piriform cortex. II. Membrane properties that underlie unusual synaptic responses. J Neurophysiol. 1989b;62:386–400. doi: 10.1152/jn.1989.62.2.386. [DOI] [PubMed] [Google Scholar]
- 83.Tseng-Crank JC, Tseng GN, Schwartz A, Tanouye MA. Molecular cloning and functional expression of a potassium channel cDNA isolated from a rat cardiac library. FEBS Lett. 1990;268:63–68. doi: 10.1016/0014-5793(90)80973-m. [DOI] [PubMed] [Google Scholar]
- 84.Vreugdenhil M, Wadman WJ. Kindling-induced long-lasting enhancement of calcium current in hippocampal CA1 area of the rat: relation to calcium-dependent inactivation. Neuroscience. 1994;59:105–114. doi: 10.1016/0306-4522(94)90102-3. [DOI] [PubMed] [Google Scholar]
- 85.Walsh KB, Kass RS. Regulation of a heart potassium channel by protein kinase A and C. Science. 1988;242:67–69. doi: 10.1126/science.2845575. [DOI] [PubMed] [Google Scholar]
- 86.Weiser M, Vega-Saenz de Miera E, Kentros C, Moreno H, Franzen L, Hillman D, Baker H, Rudy B. Differential expression of Shaw-related K+ channels in the rat central nervous system. J Neurosci. 1994;14:949–972. doi: 10.1523/JNEUROSCI.14-03-00949.1994. [DOI] [PMC free article] [PubMed] [Google Scholar]
- 87.White JA, Sekar NS, Kay AR. Errors in persistent inward currents generated by space-clamp errors: a modeling study. J Neurophysiol. 1995;73:2369–2377. doi: 10.1152/jn.1995.73.6.2369. [DOI] [PubMed] [Google Scholar]
- 88.Wu RL, Barish ME. Two pharmacologically and kinetically distinct transient potassium currents in cultured embryonic mouse hippocampal neurons. J Neurosci. 1992;12:2235–2246. doi: 10.1523/JNEUROSCI.12-06-02235.1992. [DOI] [PMC free article] [PubMed] [Google Scholar]