

Abstract
Two important objectives in the neuroscience of memory are (1) identification of neural pathways involved in memory processes; and (2) characterization of the pattern of interactions between these pathways. Functional neuroimaging can contribute to both of these goals. Using image subtraction analysis of regional cerebral blood flow data measured with positron emission tomography, we identified brain regions that changed activity during episodic memory retrieval (visual word recognition). Relative to a baseline reading task, decreased activity was observed in bilateral prefrontal, bilateral anterior and posterior temporal, and posterior cingulate cortices. Brain regions showing increased activity were the right prefrontal (different from deactivated regions), left anterior cingulate, and left occipital cortices, and vermis of cerebellum. We then performed a network analysis with structural equation modeling to test the hypothesis that regional decreases came about through active inhibition by regions showing increased activity during retrieval. This analysis demonstrated that the influence of activated regions on deactivated regions was more negative during retrieval than during reading, confirming the inhibition hypothesis. Such confirmation could not have been made from the subtraction analysis alone because decreases can come about, at the very least, through reduction of functional influences as well as by active inhibition. The concepts of ensemble excitation and inhibition, as defined through network analysis, are introduced. We argue that it is critical to examine the combined pattern of excitatory and inhibitory influences to fully appreciate the neural basis of episodic memory.
Keywords: human, episodic memory, positron emission tomography, neuroimaging, network, inhibition, structural equation modeling, covariances
In the past several years, functional neuroimaging studies with positron emission tomography (PET) regional cerebral blood flow (rCBF) have consistently identified several brain areas, the activity of which seems to be linked to the retrieval of personally experienced events, termed episodic memory retrieval (Tulving, 1983). These areas likely represent components of the neural pathways engaged in episodic retrieval. Areas showing increased activity during episodic retrieval include portions of the right prefrontal lobe, anterior cingulate, bilateral medial temporal and parietal lobes, and cerebellum (Squire et al., 1992; Tulving et al., 1994a; Andreasen et al., 1995;Buckner et al., 1995; Grady et al., 1995; Kapur et al., 1995, 1996; Nyberg et al., 1995; Roland and Gulyas, 1995; Schacter et al., 1995a, 1996; Shallice et al., 1995). Episodic retrieval has also been found to be associated with decreased activity in some brain areas (Moscovitch et al., 1995; Haxby et al., 1996), such as parts of the superior temporal lobe. The interpretation of regional activations is seemingly straightforward given the logic of the cognitive activation paradigm (Posner et al., 1988), but the exact interpretation of decreased activity is less clear. Typically, the baseline and experimental tasks are designed to differ only with respect to the process of interest, in this case episodic retrieval, with all other secondary processes (e.g., stimulation and response mode) held constant. If the control over these secondary processes is successful, it is likely that decreased activity may be a result of the instructions to retrieve.
Some researchers have suggested that decreased activity during episodic retrieval reflects task-related inhibitory influences from other brain regions (Andreasen et al., 1995). However, it is possible that decreases can arise from other sources, such as reduced influences from other areas, rather than inhibitory influences, so differences in mean activity provide only tentative evidence for such a view (cf. Frith et al., 1991). To formally explore these alternatives requires that neural interactions during episodic retrieval be explored. The purpose of the present study was to identify brain regions showing decreased activity during episodic recognition and to evaluate the hypothesis that these decreases result from inhibitory influences by regions that show increased activity during episodic recognition.
To identify brain regions showing decreased activity during episodic retrieval, we compared the pattern of brain activity in three different episodic recognition conditions with that of a closely matched baseline reading task. This subtraction analysis revealed brain areas showing decreased activity during episodic retrieval regardless of retrieval success. We analyzed the pattern of covariances between brain regions showing differential increased and decreased activity using structural equation modeling (for an introduction to structural equation modeling of PET rCBF data, see McIntosh and Gonzalez-Lima, 1994). We predicted more negative influences of brain regions showing increased activity on brain regions showing decreased activity during retrieval than during reading.
MATERIALS AND METHODS
Experimental procedures
Eleven right-handed healthy volunteers, screened to ensure that none suffered from a medical, neurological, or psychiatric disorder, underwent eight PET scans (60 sec data acquisition scans using a GEMS-Scanditronix PC2048–15B head scanner and bolus injections of 30 mCi of 15O-H2O). The experiment involved one baseline condition and three episodic retrieval conditions (the subjects were scanned twice per condition). The instructions were the same in all three retrieval conditions: to recognize visually presented words from either of two audibly presented study lists. With their right hand, subjects pressed the left button of a computer mouse if they recognized a word and the right button if they did not. The only difference between the recognition conditions was the type of words presented during the 60 sec scan interval: words that had been studied with respect to meaning, words that had been studied with respect to the speakers voice, or nonstudied words. Before and after the list of words given during the scan interval, a mixture of studied and nonstudied words were presented. The baseline condition involved silent reading of nonstudied words, and subjects pressed any of two mouse buttons after reading a word. In all conditions, words were presented every 3 sec in the center of a computer screen and remained on the screen for 2 sec. The study was approved by the Human Subjects Use Committee of Baycrest Centre. Written informed consent was obtained from the subjects.
Subtraction analysis
The data were analyzed with statistical parametric mapping (SPM94, Wellcome Department of Cognitive Neurology, London, UK) implemented in Matlab (Mathworks, Sherborn, MA). All images were realigned to the subjects’ first scan, transformed into a standard space (Talairach and Tournoux, 1988), and smoothed using an (15 mm FWHM) isotropic Gaussian kernel. Linear contrasts were used to test hypothesis of differences in activity between the baseline and experimental conditions (Friston et al., 1995). The set of voxel values for each contrast constitutes a statistical parametric map of thet statistic, SPM[t]. The SPM[t] values were transformed to the unit normal distribution (SPM[Z]) and thresholded at 3.09 (p = 0.001 uncorrected).
Covariance analysis
A full description of covariance analysis of PET data using structural equation modeling has appeared before (McIntosh and Gonzalez-Lima, 1994; McIntosh et al., 1994). Briefly, the covariances are decomposed in the context of an anatomical network, which is made up by the regions included in the analysis and their anatomic connections, to assign a numerical weight, or path coefficient, to each connection. This path coefficient reflects how much a unit change in activity in one region will change activity in the region(s) to which it projects. Because the coefficients are based on functional activity measured across subjects and integrated across time, they can be seen as representing averaged functional influences (McIntosh et al., 1995). The analysis involves four major steps: (1) construction of the network; (2) computation of inter-regional correlations; (3) computation of path coefficients; and (4) assessment of significant differences between conditions.
Construction of the network. All brain regions that showed differential activation across conditions, increases (Nyberg et al., 1995) as well as decreases (present subtraction analysis), were included in the network analysis. Each brain region was represented by the voxel where the maximum difference in activity was observed in the subtraction analysis. Connections between brain regions were specified on the basis of neuroanatomical knowledge (Petrides and Pandya, 1988,1994; Pandya and Yeterian, 1990; Felleman and Van Essen, 1991; Ungerleider et al., 1993; Van Hoesen et al., 1993). In keeping with the purpose of the covariance analysis, to examine whether decreased regional activity is a result of inhibition by regions showing increased activity, only influences between brain regions showing increased and decreased activity were considered. We acknowledge that this simplifies the network with respect to the connectivity. However, simulations conducted by McIntosh and Gonzalez-Lima (1994) suggested that the general pattern of results are not altered by the addition of further areas or connections. The full anatomical model is presented in Figure 1.
Fig. 1.
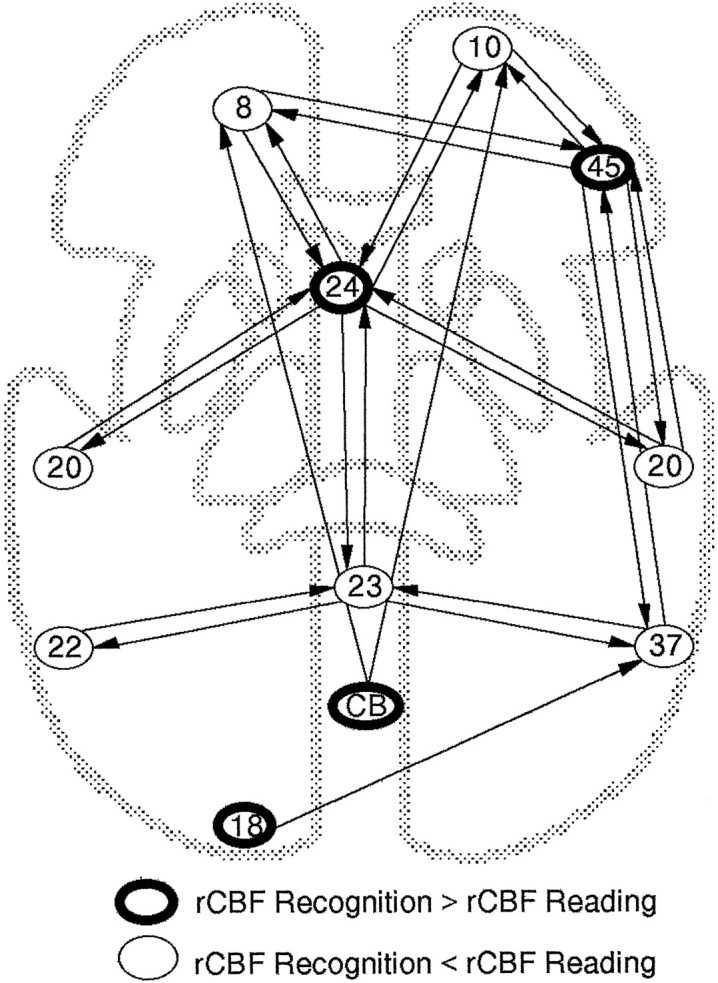
Anatomical model for the network analysis. Brain regions, indicated by approximate Brodmann numbers, are enclosed incircles. Regions enclosed in thin circles showed higher activity during reading than during recognition. For exact localization of these regions, see Table 2 (“Read-new”). Regions enclosed in bold circles showed higher activity during recognition than during reading. The exact localization, expressed asTalairach and Tournoux (1988)x, y, zcoordinates, of the right prefrontal region (45) was 28,24,8; anterior cingulate (24) −10,18,28; cerebellum (CB) 4,−92,−20; and left occipital cortex (18) −14,−102,−16 (Nyberg et al., 1996). The arrows represent anatomic connections between brain regions.
Computation of inter-regional correlations. The computation of inter-regional correlations was performed within-task, rather than across the reading and retrieval conditions, to test our hypothesis of greater inhibitory effects during memory retrieval. It would not be possible to examine this hypothesis by computing correlations across task because the change in correlations would reflect the difference in the means between the two conditions. The hypothesis is that the inhibitory effects occur within the retrieval task and, therefore, the correlations must be computed within-task. It should be emphasized that deactivations, as assessed between-tasks, do not necessarily mean that deactivated areas will have a predictable correlation within-task because relative deactivations can come about via more than one mechanism. We will expand on this issue in the Discussion.
The data from the recognition condition involving nonstudied words were used to represent episodic retrieval in the covariance analysis. Comparison of this recognition condition with the reading condition would reduce the ambiguity of interpretation because the conditions are similar with respect to the novelty of the stimuli—a factor that has been shown to affect blood flow (Tulving et al., 1994b, 1996). In this sense, the term “recognition” does not refer to the process of actually recognizing something as familiar from a particular study episode, or ecphory, but rather the process of trying to decide whether the cue was old or new, or retrieval mode (Tulving, 1983). We compared the correlation matrices for regions selected for the models between the three retrieval conditions. Overall, the matrices were not statistically different from one another, suggesting that, for these areas, the relations were equivalent across all retrieval conditions [χ2(132) = 92.83, p > 0.10].
Before extracting the data for computing the correlations, the stereotaxically normalized images were smoothed with a 10 mm Gaussian kernel, rather than 15 mm. This use of a smaller filter size minimized the inflation of the correlations between adjacent regions and also the attenuation of within-condition covariances (McIntosh et al., 1995). Whole-brain ratio-adjusted voxel values were used to compute inter-regional correlations within conditions. The two runs of each task were not averaged for the network analysis to increase the number of observations for the covariance structure, and the correlations were corrected for the run effects introduced by the repeated-measures design using a regression procedure (Pedhazur, 1982). The correlations between the brain regions included in the network analysis are displayed in Table 1.
Table 1.
Pearson correlations between brain regions showing differential activity in reading and recognition conditions
| Brain region (increase/decrease) | 1 | 2 | 3 | 4 | 5 | 6 | 7 | 8 | 9 | 10 | 11 |
|---|---|---|---|---|---|---|---|---|---|---|---|
| Right medial frontal cortex (d) | 1.00 | 0.14 | 0.11 | 0.04 | 0.08 | 0.38 | 0.11 | −0.58 | −0.08 | 0.02 | 0.08 |
| Right prefrontal cortex (i) | 0.19 | 1.00 | −0.17 | −0.29 | −0.48 | 0.40 | −0.15 | 0.34 | −0.01 | −0.34 | −0.04 |
| Right inferior temporal gyrus (d) | 0.18 | −0.14 | 1.00 | 0.43 | 0.06 | −0.48 | −0.27 | −0.08 | 0.04 | 0.29 | 0.29 |
| Right middle temporal gyrus (d) | −0.16 | −0.32 | 0.44 | 1.00 | −0.06 | −0.51 | −0.26 | 0.02 | −0.15 | −0.06 | −0.13 |
| Left middle frontal gyrus (d) | 0.22 | −0.58 | 0.07 | 0.20 | 1.00 | −0.07 | 0.19 | −0.33 | 0.06 | −0.05 | 0.45 |
| Anterior cingulate (i) | 0.04 | 0.27 | −0.49 | 0.34 | −0.01 | 1.00 | 0.34 | −0.12 | −0.04 | −0.18 | 0.02 |
| Posterior cingulate (d) | −0.15 | −0.10 | −0.14 | 0.27 | 0.42 | 0.40 | 1.00 | −0.39 | 0.11 | −0.11 | −0.09 |
| Cerebellum (i) | −0.49 | 0.25 | 0.07 | 0.05 | −0.42 | −0.17 | −0.07 | 1.00 | −0.26 | 0.05 | 0.24 |
| Left occipital cortex (i) | −0.04 | −0.44 | −0.05 | −0.33 | 0.13 | 0.05 | 0.10 | −0.47 | 1.00 | −0.22 | 0.01 |
| Left inferior temporal gyrus (d) | 0.10 | 0.03 | 0.50 | 0.10 | −0.34 | −0.43 | −0.38 | 0.49 | −0.24 | 1.00 | 0.40 |
| Left superior temporal gyrus (d) | 0.13 | −0.10 | 0.11 | 0.06 | 0.12 | −0.01 | −0.27 | 0.13 | −0.07 | 0.22 | 1.00 |
The upper diagonal matrix (in bold) is based on data from the reading condition; the lower diagonal matrix on data from recognition of nonstudied words. After residual correcting for run effects, the intercorrelations were computed based on 22 observations per region. i, Increase; d, decrease.
Computation of path coefficients. The correlation matrix was used as input to compute path coefficients for the relevant connections with LISREL 8 (Jöreskog and Sörbom, 1993). The total number of path coefficients was in excess of the total number of correlations. To obtain more stable estimates, the coefficients were estimated in two steps (McIntosh and Gonzalez-Lima, 1992). First, the coefficients for influences of activated regions in the recognition condition on deactivated regions were computed (this step also included the influence of area 23 on areas 22 and 37). In the second step, the estimates from step 1 were fixed and the coefficients for feedback connections from deactivated regions on activated regions were computed (step 2 also included feedback from areas 22 and 37 to area 23). These steps were reversed, and the statistical assessment was performed again to ensure a stable solution.
Assessment of significant differences between conditions.Omnibus comparisons in steps 1 and 2 were used to examine significant changes in functional influences between conditions. This involved constraining the estimate of the path coefficients to be equal across tasks and testing how well these coefficients reproduced the correlations from each condition (expressed as a χ2 value for the null model), and then allowing the estimates to differ and comparing the improvement in fit of this alternative model to the null model (expressed as a χ2 difference value with a number of degrees of freedom equaling the number of paths estimated). If the improvement in fit was significant, it was concluded that there was a significant difference in functional influences between conditions. Of particular interest for our hypothesis was whether, given a significant statistical outcome, the total functional influence of activated regions in the experimental (retrieval) condition was more negative on deactivated regions compared with the same interactions in the baseline (reading) condition.
RESULTS
Subtraction analysis
The pattern of activity within each of the three recognition conditions was compared with the baseline reading condition. Brain regions showing significantly lower activity during recognition than during reading in all three comparisons are shown in Table2. Decreased activity in the recognition conditions was observed in the left middle and right medial frontal cortex, bilateral anterior and posterior temporal cortex, and posterior cingulate. These differences between recognition and reading were independent of how the information had been acquired (semantic or nonsemantic encoding) and the retrieval success (Hit Rate-Meaning = 0.58; Hit Rate-Voice = 0.30; False Alarm Rate-Nonstudied = 0.17). Results from other studies that have found decreased activity in the same regions in comparisons of an episodic retrieval task with a nonmemory baseline task are included in Table 2 for the sake of comparison. The spatial extent of the deactivations in the recognition condition involving nonstudied words, which was used in the covariance analysis, is shown in Figure2. As we have reported elsewhere (Nyberg et al., 1995), areas showing higher activity during recognition were right prefrontal cortex (Talairach coordinates x = 28, y = 24, z = 8), left anterior cingulate (x = −10,y = 18, z = 28), left occipital cortex (x = −14, y = −102, z = −16), and cerebellum (x = 4, y = −92,z = −20).
Table 2.
Brain regions showing higher activity in the reading condition than in the recognition conditions
| Brain area (Brodmann number) | Comparison | |||
|---|---|---|---|---|
| Read-meaning | Read-voice | Read-new | Related findings | |
| x, y, z | x, y, z | x, y, z | x, y, z (study) | |
| Right medial frontal cortex (10) | 6, 48, 16 | 6, 48, 16 | 4, 50, 12 | 2, 56, 12 (Moscovitch et al., 1995) |
| Right inferior temporal gyrus (20) | 56, −8, −16 | 52, −8, −20 | 54, −6, −20 | 54, −5, −17 (Andreasen et al., 1995) |
| Right middle temporal gyrus (37) | 54, −56, 4 | 52, −64, −4 | 52, −58, 4 | 46, −60, 4 (Fletcher et al., 1995) |
| Posterior cingulate (23) | 4, −48, 16 | 4, −48, 32 | 0, −54, 16 | −2, −48, 20 (Moscovitch et al., 1995) |
| Left middle frontal cortex (8) | −26, 26, 40 | −34, 26, 40 | −22, 38, 40 | −30, 34, 36 (Haxby et al., in press) |
| Left superior temporal gyrus (22) | −56, −34, 20 | −54, −38, 20 | −50, −56, 20 | −50, −52, 20 (Moscovitch et al., 1995) |
| Left inferior temporal gyrus (20) | −52, −24, −24 | −60, −10, −16 | −60, −16, −16 | −50, −12, −16 (Moscovitch et al., 1995) |
Each voxel is reported as its x (right/left),y (anterior/posterior), and z (superior/inferior) coordinates in millimeters (Talairach and Tournoux, 1988). Read-meaning, recognition of words after encoding with respect to meaning; Read-voice, recognition of words after encoding with respect to speaker’s voice; Read-new, recognition of nonstudied words; Related findings, studies that have found decreased activity in the same vicinity in a comparison of an episodic retrieval task with a nonmemory baseline task.
Fig. 2.

Brain regions showing decreased activity during episodic retrieval. The figure presents transverse, sagittal, and coronal projections of brain regions that were found to show significantly (p < 0.005) higher rCBF during the baseline reading task than during recognition of nonstudied words. The anatomical space refers to the atlas of Talairach and Tournoux (1988). Numbers placed superior–inferior on sagittal and coronal projections refer to distances (in millimeters) from the plane at 0 connecting the anterior and posterior commissures (AC, PC), numbers placed rostral–caudal on the sagittal and transverse projections are relative to AC, and numbers placed medial–lateral on the coronal and transverse planes are relative to the midline. Right (R) is right in the projections.
Covariance analysis
The first omnibus comparison (the effects from activated on deactivated areas) revealed a significant difference in functional influences between conditions [χ2diff(14) = 24.96, p < 0.05]. Figure 3 shows the path coefficients associated with each connection in the two conditions. As can be seen from the figure, the pattern of effective connectivity generally was more negative in the recognition condition than in the reading condition.
Fig. 3.

Functional models for reading and recognition. Standardized path coefficients, computed from data given in Table 2, are presented for all connections included in the analysis.Thicker arrows in the recognition condition signals a stronger negative influence than in the reading condition.
The second omnibus comparison (effects of deactivated areas on activated areas) showed no significant difference between conditions [χ2diff(11) = 2.22, p > 0.05]. This was true also when step 2 was performed first [χ2diff(11) = 15.43, p > 0.05], showing that the result was not a function of order of analysis. The network analysis shows that the pattern of rCBF differences between recognition and reading arose, at least in part, from inhibition by activated areas on other regions that showed deactivations. This is not to say that all the differences in rCBF patterns resulted from the interactions in the present network, as it is possible for areas to show large changes in functional influences without a net increase or decrease in rCBF (Horwitz, 1989; McIntosh and Gonzalez-Lima, 1994). Rather, we have demonstrated that even within this limited network, the pattern of activity is a result of the interactions between brain areas.
DISCUSSION
The focus of the present article is on brain regions showing less activity during episodic recognition than during a closely matched baseline word-reading task. Whether these decreases were attributable to active inhibition or to reduced functional influences during recognition could not be assessed from the image subtraction analysis alone. Using network analysis, we tested and confirmed the hypothesis that relative decreases in rCBF during episodic recognition results from active inhibitory influences from areas showing relative increases. Below, we expand on these points and conclude by suggesting that the interpretation of rCBF decreases gains an important level of specificity through the use of network analysis.
Regional deactivations
A set of seven brain regions, located in bilateral frontal and temporal cortices and in posterior cingulate, was identified in three different comparisons. A critical question is whether this finding truly reflects a reduction of rCBF in the retrieval conditions rather than increased rCBF in the baseline condition. Two pieces of evidence support an explanation in terms of reduced rCBF.
First, the network analysis revealed that the interactions among areas were generally weaker in the baseline condition, whereas they were stronger and more negative during recognition. If it were the case that the areas were more active during baseline, stronger positive interactions would be expected in the network (see McIntosh et al., 1994, 1995, for an example of activations from stronger network interactions). Second, the regions identified with decreased rCBF correspond well with previous findings of deactivations during episodic retrieval. These studies have included different baseline tasks than that used in the present study, and some have included nonverbal stimuli (Moscovitch et al., 1995; Haxby et al., 1996). Taken together, this suggests that episodic retrieval tasks are associated with decreased activity in some brain areas.
Functional influences
Previous findings of decreased regional activity during episodic retrieval have been proposed to reflect inhibitory influences from other brain regions (Grasby et al., 1993; Andreasen et al., 1995). To more directly test this proposal, we analyzed the pattern of interactions between areas showing increased and decreased relative activity. The network analysis revealed that influences from activated regions generally were stronger and more negative on regions showing relative deactivations in the retrieval condition. Specifically, for six of the seven regions showing decreased activity, the total influence was more negative in the recognition condition than in the reading condition. Importantly, all four brain regions showing increased activity during recognition contributed to this effect. This outcome of the network analysis supports an explanation that the observed decreases in activity during episodic retrieval resulted from inhibition by regions showing increased activity.
It should be emphasized that deactivations need not always result from inhibition. They can also arise from weaker (less positive) interactions between brain regions (McIntosh et al., 1995). Both of these outcomes are illustrated schematically in Figure4. In the present case, however, the network analysis showed very good agreement between the areas showing relative deactivation and those that were inhibited in the network by regions showing increased activity in the retrieval condition. It is unlikely that this good agreement is artefactual (i.e., a result of the fact that only regions showing relative increased and decreased activity were included in the model). Because the covariances were computed within tasks, they are independent of the relative changes between tasks (Fig. 4). It is also unlikely that deactivations and changes in the covariances resulted from limited blood supply (shunting) because of blood-flow increases in some brain regions in the retrieval condition. When there are changes in covariances related to blood flow, the pattern of differences follows the blood supply distribution, especially in regions of overlap (Mentis et al., 1994). In addition, it seems unlikely that such a systematic pattern of inter-regional covariances would arise from a simple shunting of blood.
Fig. 4.

Illustration of the differences in the procedure in a conventional image subtraction versus a network analysis based on within-task covariances. The black peaks with the two “brain images” (top) represent measured activity in three areas in a hypothetical baseline and experimental task. Themiddle image identifies statistical differences in the two images after subtraction. Note that the activity of the right frontal and posterior areas within the retrieval condition is equal, but that these areas show differential relative changes when their activity is compared between tasks. The network analysis works on the within-task covariances without reference to whether a particular area shows greater or lesser activity compared with another condition. The hypothetical functional networks in the bottom of the figure illustrate that the relative deactivations during retrieval resulted from two influences. Decreased relative activity in the right posterior region arose from an inhibitory effect from the right prefrontal region (indicated by a segmented arrow). Conversely, decreased relative activity in the contralateral side arose from a reduced influence from the frontal region (indicated by a thinner arrow). Both of these outcomes were possible for the present study. A third alternative, that the deactivations arose from the influence of areas not included in the analysis, is not presented. None of the outcomes necessarily follows from the between-task subtraction analysis.
The focus of this article has been on areas of relative decrease, but we also note that, although less troublesome, the same ambiguity in interpretation of regional decreases also holds for regional increases. Activations can arise from either stronger influences on a region or stronger influence of a region. Moreover, the interpretation of the label “activated” or “deactivated” depends greatly on the reference task. Structural equation modeling can aid in distinguishing the several potential sources of changes in rCBF by examining interactions within a task and then allowing comparison of the interactions between tasks (Fig. 4).
Ensemble inhibition
Given that the outcome of the network analysis reflects inhibition, excitatory and inhibitory effects at the present level of investigation need to be distinguished from effects at finer levels of exploration. PET rCBF data reflect increases and decreases in activity in populations of neurons (henceforth referred to as ensembles). The network analysis can therefore be thought of as reflecting ensemble excitation or inhibition, with a positive path coefficient representing influences that result in excitation and a negative coefficient representing influences that result inhibition. Whereas ensemble excitation or inhibition are statements about the nature of the interactions between brain areas as defined by the pattern of covariances in their rCBF, they do not necessarily map exactly onto the level of individual neurons or columns of neurons. This follows from demonstrations that the emergent pattern of influences on one level of organization may not correspond directly to another level (Douglas et al., 1995; Somers et al., 1995). The exact relation between neuronal events and metabolic maps continues to be an important question (Horwitz and Sporns, 1994; Tagamets et al., 1995). Nevertheless, it is reasonable to assume some correspondence between excitation and inhibition at lower levels of organization and rCBF.
Functional significance of ensemble inhibition
It seems clear that the functional significance of decreases is as great as that of increases (Buckner and Tulving, 1995). For example, bilateral decreases in superior temporal regions, observed during a word fluency task, have been proposed to reflect inhibition of activity in these regions to prevent unwanted spread of activation in a network of distributed words (Frith et al., 1991). Preventing activation of irrelevant responses is also important in episodic memory retrieval, in which only responses from the relevant spatio-temporal context are valid. This could explain the present finding of bilateral temporal decreases during recognition (Andreasen et al., 1995) resulting from inhibitory effects from anterior cingulate and right frontal cortex. Similarly, Fletcher et al. (1995) suggested that their findings of bitemporal activations during encoding and bitemporal deactivations during retrieval may reflect a reduction of language-related processing when there is a memory demand. In this sense, ensemble inhibition could be seen as reflecting attentional processes, which is in line with the previous suggestion that much of the attentional effect manifests as inhibition of connections (Hernandez-Peon et al., 1956; Donald, 1983;Chelazzi et al., 1993; Tsotsos, 1995). Such attentional effects would be expected in other contexts that do not involve episodic retrieval but in which the processing demands are high.
Thus, by the present view, both excitation and inhibition are important components of task performance. This view is in good agreement with the assumption that brain function results from changes in the covariances among neural elements (McIntosh and Gonzalez-Lima, 1994). In our previous analysis of the present data set (Nyberg et al., 1995), we arrived at the conclusion that the regions with increased activity during recognition constitute components of a general episodic retrieval network underlying retrieval mode (Tulving, 1983) or retrieval attempt (Kapur et al., 1996; Schacter et al., 1996). The present subtraction analysis added components that showed decreased activity to this network, and the network analysis revealed how regions showing increased and decreased activity interacted during episodic retrieval. Looking at this total pattern of brain regions and their mutual influences is essential for a full understanding of the neural circuitry of human episodic memory (Horwitz et al., 1995).
Conclusion
The present study has shown that episodic memory retrieval is associated with decreased activity in several brain regions. That decreased activity associated with episodic retrieval is observed in similar regions within and across studies indicates that regional reductions in neural activity constitute an important aspect of episodic retrieval. On a cognitive level of analysis, it seems plausible that this aspect may have to do with the inhibition of task-irrelevant processing. By showing that the regional deactivations resulted, at least in part, from more negative influences from activated regions, the network analysis provided support for the existence of inhibitory influences on the neuronal ensemble level. This outcome of the network analysis relates inhibition on the cognitive level with inhibition on the physiological level, thereby illustrating how a network approach to the analysis of functional neuroimaging data can serve as a bridge between different levels of analysis and can be used to explicitly test hypotheses about the interactions that underlie cognitive operations.
Footnotes
This work was supported by the Swedish Council for Research in the Humanities and Social Sciences and the Natural Sciences and Engineering Research Council of Canada (Grant A8632). We thank the staff at the PET Centre for technical assistance and Drs. S. Kapur, T. Picton, and J. Toth for comments on a previous version of this manuscript.
Correspondence should be addressed to Anthony R. McIntosh, Rotman Research Institute, Baycrest Centre, 3560 Bathurst Street, Toronto, Ontario, Canada M6A 2E1.
REFERENCES
- 1.Andreasen NC, O’Leary DS, Arndt S, Cizaldo T, Hurtig R, Rezai K, Watkins GL, Boles Ponto LL, Hichwa RD. Short-term and long-term verbal memory: a positron emission tomography study. Proc Natl Acad Sci USA. 1995;92:5111–5115. doi: 10.1073/pnas.92.11.5111. [DOI] [PMC free article] [PubMed] [Google Scholar]
- 2.Buckner RL, Tulving E. Neuroimaging studies of memory: theory and recent PET results. In: Boller F, Grafman J, editors. Handbook of neuropsychology, Vol. 10. Elsevier; Amsterdam: 1995. pp. 439–466. [Google Scholar]
- 3.Buckner RL, Petersen SE, Ojemann JG, Miezin FM, Squire LR, Raichle ME. Functional anatomical studies of explicit and implicit retrieval tasks. J Neurosci. 1995;15:12–29. doi: 10.1523/JNEUROSCI.15-01-00012.1995. [DOI] [PMC free article] [PubMed] [Google Scholar]
- 4.Chelazzi L, Miller EK, Duncan J, Desimone R. A neural basis for visual search in inferior temporal cortex. Nature. 1993;363:345–347. doi: 10.1038/363345a0. [DOI] [PubMed] [Google Scholar]
- 5.Donald MW. Neural selectivity in auditory attention: sketch of a theory. In: Gaillard AWK, Ritter W, editors. Tutorials in ERP research: endogenous components. North Holland; Amsterdam: 1983. pp. 37–54. [Google Scholar]
- 6.Douglas RJ, Koch C, Mahowald M, Martin KAC, Suarez HH. Recurrent excitation in neocortical circuits. Science. 1995;269:981–985. doi: 10.1126/science.7638624. [DOI] [PubMed] [Google Scholar]
- 7.Felleman DJ, Van Essen DC. Distributed hierarchical processing in the primate cerebral cortex. Cereb Cortex. 1991;1:1–47. doi: 10.1093/cercor/1.1.1-a. [DOI] [PubMed] [Google Scholar]
- 8.Fletcher PC, Frith CD, Grasby PM, Shallice T, Frackowiak RSJ, Dolan RJ. Brain systems for encoding and retrieval of auditory–verbal memory: an in vivo study in humans. Brain. 1995;118:401–416. doi: 10.1093/brain/118.2.401. [DOI] [PubMed] [Google Scholar]
- 9.Friston KJ, Holmes AP, Worsley KJ, Poline J-P, Frith CD, Frackowiak RSJ. Statistical parametric maps in functional imaging: a general linear approach. Hum Brain Mapping. 1995;2:189–210. [Google Scholar]
- 10.Frith CD, Friston KJ, Liddle PF, Frackowiak RSJ. A PET study of word finding. Neuropsychologia. 1991;29:1137–1148. doi: 10.1016/0028-3932(91)90029-8. [DOI] [PubMed] [Google Scholar]
- 11.Grady CL, McIntosh AR, Horwitz B, Maisog JM, Ungerleider LG, Mentis MJ, Pietrini P, Schapiro MB, Haxby JV. Age-related reductions in human recognition memory involve altered cortical activation during encoding. Science. 1995;269:218–221. doi: 10.1126/science.7618082. [DOI] [PubMed] [Google Scholar]
- 12.Grasby PM, Frith CD, Friston KJ, Bench C, Frackowiak RSJ, Dolan RJ. Functional mapping of brain areas implicated in auditory–verbal memory functions. Brain. 1993;116:1–20. doi: 10.1093/brain/116.1.1. [DOI] [PubMed] [Google Scholar]
- 13.Haxby JV, Ungerleider LG, Horwitz B, Maisog JM, Rapoport SL, Grady CL (1996) Face encoding and recognition in the human brain. Proc Natl Acad Sci USA, in press. [DOI] [PMC free article] [PubMed]
- 14.Hernandez-Peon R, Scherrer H, Jouver M. Modification of electrical activity in the cochlear nucleus during ‘attention’ in unanesthetized cat. Science. 1956;123:331–332. doi: 10.1126/science.123.3191.331. [DOI] [PubMed] [Google Scholar]
- 15.Horwitz B. Functional neural systems analyzed by use of interregional correlations of glucose metabolism. In: Ewert J-P, Arbib MA, editors. Visuomotor coordination: amphibians, comparisons, models and robots. Plenum; New York: 1989. pp. 873–892. [Google Scholar]
- 16.Horwitz B, Sporns O. Neural modeling and functional neuroimaging. Hum Brain Mapping. 1994;1:269–283. doi: 10.1002/hbm.460010405. [DOI] [PubMed] [Google Scholar]
- 17.Horwitz B, McIntosh AR, Haxby JV, Grady CL. Network analysis of brain cognitive function using metabolic and blood flow data. Behav Brain Res. 1995;66:187–193. doi: 10.1016/0166-4328(94)00139-7. [DOI] [PubMed] [Google Scholar]
- 18.Jöreskog KG, Sörbom D. Erlbaum; Hillsdale, NJ: 1993. LISREL VIII: structural equation modeling with the simplis command language. [Google Scholar]
- 19.Kapur N, Friston KJ, Young A, Frith CD, Frackowiak RSJ. Activation of human hippocampal formation during memory for faces: a PET study. Cortex. 1994;31:99–108. doi: 10.1016/s0010-9452(13)80108-6. [DOI] [PubMed] [Google Scholar]
- 20.Kapur S, Craik FIM, Brown GM, Houle S, Tulving E (1996) Functional role of the prefrontal cortex in memory retrieval. NeuroReport, in press. [DOI] [PubMed]
- 21.McIntosh AR, Gonzalez-Lima F. Structural modeling of functional visual pathways mapped with 2-deoxyglucose: effects of patterned light and footshock. Brain Res. 1992;578:75–86. doi: 10.1016/0006-8993(92)90232-x. [DOI] [PubMed] [Google Scholar]
- 22.McIntosh AR, Gonzalez-Lima F. Structural equation modeling and its application to network analysis in functional brain imaging. Hum Brain Mapping. 1994;2:2–22. [Google Scholar]
- 23.McIntosh AR, Grady CL, Ungerleider LG, Haxby JV, Rapoport SI, Horwitz B. Network analysis of cortical visual pathways mapped with PET. J Neurosci. 1994;14:655–666. doi: 10.1523/JNEUROSCI.14-02-00655.1994. [DOI] [PMC free article] [PubMed] [Google Scholar]
- 24.McIntosh AR, Grady CL, Haxby JV, Ungerleider LG, Horwitz B (1996) Changes in limbic and prefrontal functional interactions in a working memory task for faces. Cereb Cortex, in press. [DOI] [PubMed]
- 25.Mentis MJ, Salerno JA, Horwitz B, Grady CL, Schapiro MB, Murphy DGM, Rapoport SI. Loss of correlated brain metabolic activity in long-term treated hypertension. Stroke. 1994;25:601–607. doi: 10.1161/01.str.25.3.601. [DOI] [PubMed] [Google Scholar]
- 26.Moscovitch M, Kapur S, Köhler S, Houle S. Distinct neural correlates of visual long-term memory for spatial location and object identity: a positron emission tomography (PET) study in humans. Proc Natl Acad Sci USA. 1995;92:3721–3725. doi: 10.1073/pnas.92.9.3721. [DOI] [PMC free article] [PubMed] [Google Scholar]
- 27.Nyberg L, Tulving E, Habib R, Nilsson L-G, Kapur S, Houle S, Cabeza R, McIntosh AR. Functional brain maps of retrieval mode and recovery of episodic information. NeuroReport. 1996;7:249–252. [PubMed] [Google Scholar]
- 28.Pandya DN, Yeterian EH. Prefrontal cortex in relation to other areas in rhesus monkey: architecture and connections. Prog Brain Res. 1990;85:63–94. doi: 10.1016/s0079-6123(08)62676-x. [DOI] [PubMed] [Google Scholar]
- 29.Pedhazur EJ. Holt, Reinhart and Winston; New York: 1982. Multiple regression in behavioural research: explanation and prediction, 2nd Ed. . [Google Scholar]
- 30.Petrides M, Pandya DN. Association fibers to the frontal cortex from the superior temporal region in the rhesus monkey. J Comp Neurol. 1988;273:52–66. doi: 10.1002/cne.902730106. [DOI] [PubMed] [Google Scholar]
- 31.Petrides M, Pandya DN. Comparative architectonic analysis of the human brain and the macaque frontal cortex. In: Boller F, Grafman J, editors. Handbook of neuropsychology. Elsevier; Amsterdam: 1994. pp. 17–58. [Google Scholar]
- 32.Posner MI, Petersen SE, Fox PT, Raichle ME. Localization of cognitive operations in the human brain. Science. 1988;240:1627–1631. doi: 10.1126/science.3289116. [DOI] [PubMed] [Google Scholar]
- 33.Roland PE, Gulyas B. Visual memory, visual imagery, and visual recognition of large field patterns by the human brain: functional anatomy by positron emission tomography. Cereb Cortex. 1995;5:79–93. doi: 10.1093/cercor/5.1.79. [DOI] [PubMed] [Google Scholar]
- 34.Schacter DL, Reiman E, Uecker A, Polster MR, Sheng Yun L, Cooper LA. Brain regions associated with retrieval of structurally coherent visual information. Nature. 1995;376:587–590. doi: 10.1038/376587a0. [DOI] [PubMed] [Google Scholar]
- 35.Schacter DL, Alpert NM, Savage CR, Rauch SL, Albert MS (1996) Conscious recollection and the human hippocampal formation: evidence from positron emission tomography. Proc Natl Acad Sci USA, in press. [DOI] [PMC free article] [PubMed]
- 36.Shallice T, Fletcher P, Frith CD, Grasby P, Frackowiak RSJ, Dolan RJ. Brain regions associated with acquisition and retrieval of verbal episodic memory. Nature. 1994;368:633–635. doi: 10.1038/368633a0. [DOI] [PubMed] [Google Scholar]
- 37.Somers DC, Nelson SB, Sur M. An emergent model of orientation selectivity in cat visual cortical simple cells. J Neurosci. 1995;15:5448–5465. doi: 10.1523/JNEUROSCI.15-08-05448.1995. [DOI] [PMC free article] [PubMed] [Google Scholar]
- 38.Squire LR, Ojemann JG, Miezin FM, Petersen SE, Videen TO, Raichle ME. Activation of the hippocampus in normal humans: a functional anatomical study of memory. Proc Natl Acad Sci USA. 1992;89:1837–1841. doi: 10.1073/pnas.89.5.1837. [DOI] [PMC free article] [PubMed] [Google Scholar]
- 39.Tagamets M-A, Horwitz B, Reggia JA. A large-scale neural model linking local neuronal dynamics to positron emission tomography (PET) regional cerebral blood flow (rCBF) data. Soc Neurosci Abstr. 1995;21:1988. [Google Scholar]
- 40.Talairach J, Tournoux P. Thieme; Stuttgart: 1988. Co-planar stereotaxic atlas of the human brain. . [Google Scholar]
- 41.Tsotsos JK. Computation, PET images, and attention. Behav Brain Sci. 1995;18:372. [Google Scholar]
- 42.Tulving E. Clarendon; Oxford: 1983. Elements of episodic memory. . [Google Scholar]
- 43.Tulving E, Kapur S, Markowitsch HJ, Craik FIM, Habib R, Houle S. Neuroanatomical correlates of retrieval in episodic memory: auditory sentence recognition. Proc Natl Acad Sci USA. 1994a;91:2012–2015. doi: 10.1073/pnas.91.6.2012. [DOI] [PMC free article] [PubMed] [Google Scholar]
- 44.Tulving E, Markowitsch HJ, Kapur S, Habib R, Houle S. Novelty encoding networks in the human brain: positron emission tomography data. NeuroReport. 1994b;5:2525–2528. doi: 10.1097/00001756-199412000-00030. [DOI] [PubMed] [Google Scholar]
- 45.Tulving E, Markowitsch HJ, Craik FIM, Habib R, Houle S (1996) Novelty and familiarity activations in PET studies of memory encoding and retrieval. Cereb Cortex, in press. [DOI] [PubMed]
- 46.Ungerleider LG, Gaffan D, Pelak VS. Projections from the inferior temporal cortex to prefrontal cortex via the uncinate fascicle in rhesus monkeys. Exp Brain Res. 1989;76:473–484. doi: 10.1007/BF00248903. [DOI] [PubMed] [Google Scholar]
- 47.Van Hoesen GW, Morecraft RJ, Vogt BA. Connections of the monkey cingulate cortex. In: Vogt BA, Gabriel ME, editors. Neurobiology of cingulate cortex and limbic thalamus: a comprehensive handbook. Birkhauser; Boston: 1993. pp. 249–284. [Google Scholar]