

Abstract
To study the behavior of optic axons to continuously changing concentrations of their substrate, explants from embryonic retina were placed across gradients of retinal basal lamina proteins and merosin. The following growth patterns of axons in response to the substrate gradients were found: (1) Axons that grew up gradients, i.e., from low to high substrate concentrations, became longer and less fasciculated with increasing concentration of the substrate. On shallow basal lamina gradients, the axons also showed a directional response that resulted in guidance to higher substrate concentrations. (2) Axons that grew down gradients, i.e., from high to low substrate concentrations, became shorter and more fasciculated with decreasing concentrations of the substrate. On gradients of merosin, a significant alteration in the axonal growth direction toward higher substrate concentrations was detected. Axons heading down gradients never U turned to higher substrate concentrations. (3) Axons confronted with discontinuous substrates were confined to the borders of the substrate exclusively, whereas axons confronted with substrate gradients were able to cross into the territory beyond the substrate. (4) The growth patterns of axons on substrate gradients of basal lamina proteins and merosin were similar but not identical, indicating that axons may respond to substrate gradients dependent on its chemical composition. The present results show that substrate gradients can regulate length and fasciculation of neurites and have a limited capability to direct axons to higher substrate concentrations.
Keywords: axonal guidance, substrate gradients, optic axons, basal lamina, extracellular matrix, merosin
Despite remarkable progress in elucidating biochemical components that regulate the pathfinding of growing axons (for review, see Dodd and Jessel, 1988; Hynes and Lander, 1992; Keynes and Cook, 1995), a conclusive explanation of why axon populations grow in defined directions to reach their specific targets still is missing. An axonal tract that serves as a classic model to study axonal pathfinding is the developing visual pathway (for review, see Udin and Fawcett, 1988; Stirling, 1991; Holt and Harris, 1993; Sanes, 1993). Experiments to study axonal guidance have focused on its various segments, such as the navigation of optic axons in the retina to the optic disk (Goldberg and Coulombre, 1972; Grant and Rubin, 1980;Halfter et al., 1985; Brittis and Silver, 1995), their sorting at the optic chiasm (Guillery, 1983; Godemont et al., 1990; Sretavan and Reichardt, 1993), and the mechanisms underlying the topographic innervation of defined areas in the brain (Hankin and Lund, 1991). In particular, studies examining the navigation of optic axons in the retina have led to several hypotheses about how axons might be guided in embryos. For example, Ramon y Cajal (1892) postulated that the retinal axons are attracted by chemotactic factors secreted by the optic disk. Additionally, axonal guidance to the optic disk was thought to be the result of a repulsion of axons by an inhibitory chondroitin sulfate proteoglycan in the retinal periphery (Snow et al., 1991;Brittis et al., 1992), a mechanical funneling along extracellular channels in the presumptive optic fiber layer (Silver and Sidman, 1980;Krayanek and Goldberg, 1981), or a chemical guidance along membrane-bound molecules that serve as local cues along the axonal pathway (Sperry, 1963).
A popular idea of how a restricted number of chemical signals may guide axons to their targets is to assume that these components are distributed as gradients, and axons are capable by means of cell surface receptors to read the concentrations of the gradients as continuous attractive or repulsive cues (Fraser, 1980; Gierer, 1983;Bonhoeffer and Gierer, 1984). The importance of substrate proteins in axonal growth has been tested in several neurite outgrowth assaysin vitro, showing that axons are capable of preferring or avoiding stripes or spots of supportive versus nonsupportive substrate proteins (Letourneau, 1975; Gundersen, 1987; Walter et al., 1987; Clark et al., 1993). Additionally, neurite outgrowth assays on substrate gradients showed that axons are able to respond to increasing concentrations of repulsive proteins by slowing their growth rate (Baier and Bonhoeffer, 1992; Snow and Letourneau, 1992). However, the potential of substrate gradients to guide axonal growth into a particular direction has not been demonstrated in vitro as yet. Rather, a previous study suggested that gradients of laminin are unable to influence the orientation of axonal growth at all (McKenna and Raper, 1988).
Here, I describe the preparation of substrate gradients that allow the study of the responses of nerve fibers to continuous changes in the substrate concentrations in vitro.
MATERIALS AND METHODS
Substrate gradient production. As a substrate, a basal lamina extract was generated by incubating embryonic day 10 (E10) chick retinal inner-limiting membranes with 2 mguanidine hydrochloride and reconstituting the solubilized proteins to a fine matrix suspension by dialysis against Ca2+and Mg2+-free Hank’s solution (CMF) (Halfter and von Boxberg, 1992). As an alternative substrate, merosin from human placenta (Ehrig et al., 1990) (Gibco, Grand Island, NY) was used.
Basal lamina extract (80 μl) from 100 E10 chick eyes with a protein concentration between 25 and 30 μg/ml or 80 μl of merosin at a concentration of 50 μg/ml was mixed with 5 μl of 0.25 μ and 2.5 μl of 1 μ green fluorescent beads (Polysciences, Warrington, PA), 5 μl phenol red (Gibco), and 10 μg of sucrose. The fluorescent beads were blocked in 1% BSA/CMF, and washed in CMF and centrifuged at 10,000 rpm twice before mixing with the basal lamina extract. The substrate gradients were produced by injecting 0.2–0.5 μl of the basal lamina extract or merosin including sucrose, beads, and dye into a drop of 10 μl of CMF sitting on a square of about 1 cm2 white nitrocellulose/cellulose acetate membrane filter (0.45 μ, catalog #11 306–47-N, Sartorius, Göttingen, Germany). The filter had been pretreated with 20 μg/ml of poly-lysine hydrobromide (molecular weight ≥ 300 kDa) (Sigma, St. Louis, MO) for 10 min and washed five times in CMF. Most experiments were performed using the poly-lysine-treated mixed cellulose ester membrane filters; however, plain nitrocellulose membrane filters (Trans-Blot, catalog #162–0116, Bio-Rad Laboratories, Hercules, CA) also were successfully used as support for the gradients. Because of the high sucrose concentration, the basal lamina extract sank through the drop of saline to the surface of the filter and diffused out in radial direction (Fig. 1b). The development of the gradients was monitored under the dissection microscope along the diffusion of the phenol red in the extract. Approximately 30 sec to 1 min after injection of the extract/merosin, the gradients were immobilized onto the membrane filters by touching an underlying layer of moist, black membrane filters (0.45 μ, catalog #13 006–47-N, Sartorius, Bohemia, NY) with filter paper, which caused the drops of CMF to dissipate concentrically. The second layer of membrane filters was important to allow an even suction for the immobilization of the substrate gradients. Immediately after immobilizing the substrate proteins onto the membrane filters, the approximate outline of the substrates was marked by puncturing the membrane filters with forceps. This was necessary, because the phenol red in the basal lamina extract was washed away eventually and served only as a temporary marker for the outer borders of the gradients. The filters with the gradients were washed five times in CMF, and the remaining protein binding sites were blocked with 10 mg/ml of BSA (Sigma) in CMF for 1 hr. Four to five moist membrane filters, each carrying a gradient, were placed in a 5 cm Petri dish, sterilized by exposure to UV light for 2 min, and used as substrates for the retinal explant strips.
Fig. 1.

Diagrams (a, b,d), bright-field micrograph (c), and fluorescent micrographs (e, f) showing the production of basal lamina gradients on membrane filters. The gradients were prepared by injecting a suspension of basal lamina proteins (BL) or fluorescent antibodies by means of a capillary (C) into a drop of Hank’s solution (CMF) that is sitting on a white membrane filter (MF). Because of the high sucrose concentrations, the proteins sink to the bottom of the membrane filter and diffuse out in radial direction (arrows ina, b). Another black membrane filter (bMF) served as a support for the membrane filter that carried the gradient. The gradient that develops by diffusion at the outer margin of the injected extracellular matrix was immobilized onto the filter by placing a filter paper (FP) onto the black membrane filter, which sucks the CMF drop with the substrate gradient into the membrane filter (arrowheads in a). The diagram (b) and the micrograph (c) show the membrane filter with the drop of CMF and the injected basal lamina extract that diffuses in radial direction (arrowheads inb). The placement of retinal explant strips (E) halfway and across the substrate border is shown in d. Fluorescence micrographs (e, f) show the distribution of a substrate of fluorescent antibody on a membrane filter as generated with the technique described above. The circular area of fluorescent antibody on the surface of the membrane filter has a diffusion gradient of protein at its outer perimeter. The gradient is delineated by the maximum and minimum concentration of protein in the center (C) and the outer margin (M) of the substrate. The direction from high to low and from low to high concentrations of the substrate is defined as up (U) and down (D) the gradient (e, f). Scale bars: c, 5 mm; d, 1 mm; e, 300 μm.
The lengths and slopes of the gradients were quantified after culturing and silver staining of the retinal explants (see below) by counting the number of the 1 μ beads per unit areas of 120 × 120 μm from peripheral to central direction until a constant level of beads was reached. To obtain a comparable measure for gradients from different experiments, the numbers of beads per unit area were expressed in percent, taking the maximum and minimum concentrations of the beads in the central and outer margin of the substrate as 100 and 0%, respectively. The slope of the gradients was determined by calculating the percent increase in bead numbers per 100 μm of the gradients. To determine whether the distribution of the fluorescent beads represented the distribution of the substrate proteins, laminin, which is a major component of the basal lamina extract, was visualized with an anti-laminin mAb. The merosin substrate was visualized with a polyclonal antiserum to EHS-mouse tumor laminin. To this end, the filters were incubated with the hybridoma supernatant from the 3H11 anti-laminin mAb or a polyclonal anti-laminin antiserum (Gibco), diluted 1:100, for 1 hr. After three rinses, the filters were incubated with a fluorophor-labeled secondary antibody for another hour. As a secondary antibody, an affinity-purified goat/anti-mouse or goat/anti-rabbit antibody labeled with Cy3 was used (Jackson Immuno Research, West Grove, PA). After two final rinses, the distribution of the green fluorescent beads and the red fluorescent laminin staining was compared with an epifluorescence microscope using filter sets for rhodamine and fluorescein (Zeiss, Thornwood, NY).
Neurite outgrowth assays. Strips from E6 retinal whole mounts (Halfter et al., 1983) were placed halfway across or parallel to the outer margin of the gradients by using the punctures in the filters as marker for the outer perimeter of the substrates (Fig.1d). The retina strips were from retinal whole mounts on membrane filters cut with a McIlwain tissue chopper (Mickle Laboratories Engineering, Gomshall Surrey, England) perpendicular to the optic disk (Halfter et al., 1983). After 1 hr of incubation to allow the attachment of the explants to the substrate, 100 μl of medium [DMEM/10% of FCS (Gibco) or serum-free DMEM/50 μg/ml of BSA] was added to each of the filters. After 36 hr of culture at 37°C and 4% CO2, the explants were fixed by adding 1 ml of 4% formalin/0.2% glutaraldehyde in CMF to the medium. The retinal explants and the optic axons on the filter were visualized by silver staining using a modified version of the technique devised byBodian (1936) (Rager et al., 1979). Briefly, the formaldehyde-fixed preparations were post-fixed in 0.05% chromic acid in CMF for 30 min and washed five times in CMF. Batches of 10 filters were incubated overnight in 70 ml of 0.5% Protargol (Roboz Surgical Instruments, Rockville, MD) plus 2.5 gm nitric acid-cleaned copper wire. The filters were washed in three changes of 0.5% acetic acid for a total of 30 min, followed by three changes of distilled water. The silver staining was developed in a 10:7:3:1 mixture of the following four solutions: (1) 5% sodium carbonate; (2) 0.2% ammonium nitrate, 0.2% silver nitrate, and 1% tungstosilic acid (Electron Microscopy Sciences, Fort Washington, PA); (3) same as 2, but also including 0.O25% formaldehyde; and (4) 1% Triton X-100. The development of the staining was followed under a dissection microscope. The staining was stopped by washing in two changes of 0.5% acetic acid/0.1% Triton X-100. The evaluation of length and orientation of axons in relationship to the length and slope of the substrate gradients was done with a camera lucida. For the final photography of the silver-stained explants, the filters were dehydrated in isopropanol, dried for 1 min, and embedded in immersion oil, which caused the filters to become transparent. Because the immersion oil dissolves the fluorescent beads, the evaluation of axon growth lengths in relation to the gradient parameters was done before the mounting.
RESULTS
The production of substrate gradients
The method to prepare substrate gradients was worked out initially using fluorescent antibodies as a test substrate. Antibody solutions, which included 10% sucrose and phenol red to follow the development of the gradients, were injected into drops of Hank’s solution (Fig.1a). Membrane filters served as a support for the substrate. Because of the high sucrose concentration, the fluorescent antibody sank through the drops of Hank’s solution to the surface of the filters and diffused out in radial direction (Fig.1b,c). The protein gradients were immobilized by sucking the drops of Hank’s solution with the gradients into the membrane filters, which bound the protein firmly to its filter matrix. The length and slope of the gradients could be regulated by increasing or lowering the concentration of sucrose in the antibody solutions or, more conveniently, by terminating the diffusion of the injected matrix proteins at different time points. Examination of the membrane filters showed circular areas of fluorescent antibody with diminishing gradients of protein at their outer borders (Fig.1e,f). The gradients were delineated by relatively large concentrical areas with high protein concentration (C in Fig.1e,f) and an outer circular margin with the minimum protein concentration (M in Fig.1e,f). The direction of the gradients from high to low concentrations was defined as downhill (D in Fig. 1e,f) and from low to high concentrations as uphill (U in Fig.1e,f). Gradients of basal lamina proteins and merosin were generated in exactly the same way as with the fluorescent antibodies. Previous investigations showed that the basal lamina extract from purified retinal inner-limiting membranes is a complex mixture of extracellular matrix proteins that includes laminin, collagen type IV, the heparan sulfate proteoglycan (HSPG) agrin, another unidentified HSPG of 250 kDa, a basal lamina chondroitin sulfate proteoglycan of 300 kDa, nidogen, and ∼10 unidentified extracellular matrix components (Halfter and von Boxberg, 1992). Initially, only the basal lamina extract was used as a substrate, because it was at that time the only substrate that reliably promoted neurite extension from chick retinal explants (Halfter et al., 1987;Halfter and von Boxberg, 1992). Later in this study, it was found that retinal axons also grow well on merosin, and a series of neurite outgrowth assays on gradients of merosin substrates was performed.
After the quantification method for gradients devised by Baier and Bonhoeffer (1992), fluorescent beads were included into the substrate mixture. Two types of beads were used: 1 μ beads allowed the quantification of the slope of the gradients by counting the number of beads in units of 120 × 120 μm over the entire length of the gradient. With setting the maximum concentration of beads in the central position of the substrate as 100%, and at the outer margin of the substrate as 0%, the slopes of the gradients were calculated in percent increase of beads per 100 μm. To verify that the beads reflected the distribution of basal lamina proteins correctly, the distribution of the beads was compared with that of laminin, a major component of the basal lamina extract. Results showed that the 1 μ beads were 50–100 μm short of the outer margin of the laminin. The smaller 0.25 μ beads, which also were included into the matrix but which were to small and too numerous to be counted over the entire gradient length, indicated precisely the edge of the gradient as demonstrated by their colocalization with laminin immunoreactivity (Fig. 2d,e). The combination of 1 μ and 0.25 μ beads allowed the reliable determination of slope, length, and extent of the gradients. It was found that the lengths of the gradients from lowest to maximum substrate concentration ranged from 200 to 1000 μm (Fig. 2). Steep gradients had a length between 200 and 400 μm and slopes between 50 and 25%; shallow gradients had a length between 600 and 1000 μm and slopes between 17 and 10%. The use of fluorescent beads to quantify the gradients was advantageous, because the beads retained their fluorescence even after silver staining (see Figs.5c,d, 8c,d), stayed fluorescent for months, and did not bleach even after prolonged investigation under the epifluorescence microscope.
Fig. 2.

Fluorescent micrographs showing the edges of basal lamina substrate gradients on membrane filters. The basal lamina extract for the substrates in a, b, andc contained 1 μ fluorescent beads to quantify the slopes of the gradients. The substrate in a had a discontinuous gradient, the substrate in b a steep gradient, and the substrate in c a shallow gradient. The support for the gradients was poly-lysine-treated nitrocellulose/cellulose acetate membrane filters. A scale on the right of c was photographed at the same magnification to show the lengths of the gradients. The outer margin (M) and the center (C) of the gradients are indicated. High-power views (d, e) of the border of a basal lamina gradient included 1 and 0.25 μ beads. The 0.25 μ beads (d) colocalized with the outer margin of the laminin immunoreactivity (e), whereas the 1 μ beads were ∼50 μm short of the outer margin of the gradient. The graph in f shows the increase of beads along basal lamina gradients counted in unit areas of 120 × 120 μm. The upper curve (1) shows a discontinuous gradient similar to that shown in a, the steep curve (2) shows a gradient with a length of 360 μm, similar to the gradient shown in b, and the shallow curve (3) shows a gradient of 600 μm, slightly shorter than the gradient shown in c. Scale bar: d, e, 50 μm.
Fig. 5.
Bright-field micrographs (a,b) and fluorescent bright-field micrographs (c,d) showing two silver-stained retinal explants placed over a shallow (a, c) and a steep (b,d) gradient of basal lamina proteins. The explants were cultured for 36 hr. The outer margin of the substrate is indicated bywhite dotted lines, the length and the orientation up the gradients is indicated by the white arrows, and the inner border of the gradient is indicated by the stippled lines. The support for the gradients was poly-lysine-treated, nitrocellulose/cellulose acetate membrane filters. Axons were shorter at the outer border of the substrates than they were in the center of the substrate. In addition, the shallow gradient (a) caused a change in the orientation of the axons in that axons entered the substrate in a much wider angle than in the center of the substrate. No change in axon orientation was observed when the axons entered the steep gradient (b). High-power micrographs of the borders of the substrate show both axons and the fluorescent beads and demonstrate that axons and substrate colocalize. The angle (β) of axon outgrowth from the explants at the outer margin of the gradient and in the central part of the substrate also is shown. The open white arrowhead in c indicates a puncture mark that indicated the outline of the substrate on the membrane filter. Scale bars:a, b, 1 mm; c, d, 300 μm.
Fig. 8.

Silver-stained retinal explants showing the response of axons placed across a discontinuous substrate and a gradient of basal lamina proteins. The explants were cultured for 36 hr. The explants were placed across the substrate borders as outlined in Figure 3d, so that axons grew from high substrate concentration into the outer margin of the substrate, i.e., downhill the gradients. The extent of the explant strips is indicated byarrowheads. The outer margin (M), the central part of the gradient (C), and the length and orientation down the gradient are indicated by the black dots, thestippled line, and the arrow, respectively. The support for the gradients was poly-lysine-treated, nitrocellulose/cellulose acetate membrane filters. When axons are confronted with a discontinuous substrate, they obey the borders of the substrate exactly, whereas confronted with a gradient, they overrun the substrate borders and may even invade the territory beyond the substrate. High-power bright-field fluorescent micrographs of axons growing down gradients are shown in c and d. The fluorescent beads indicate the outer margin of the gradient (arrowheads). Note that axons overrun the substrate by ∼200 μm and then form a border of highly fasciculated nerve fibers. Scale bars: b, 1 mm; c, d, 300 μm.
Inherent growth patterns of retinal axons in vitro
On a continuous substrate, the majority of axons from explants strips of retinal whole mounts that were cut perpendicular to the optic fissure (Fig. 3a) grow out in a predictable pattern from the former ventral edge of the tissue (Fig.3a,b) (Halfter et al., 1983). Furthermore, axons on a continuous substrate have a tendency to grow in a clockwise orientation as shown in the diagram in Figure 3b (Halfter and von Boxberg, 1992) and exit the explants on a substrate of basal lamina proteins with an average angle of 108 ± 11° (n = 21 explants) (see Figs. 4, 5, 6, 7, 8) and on a substrate of merosin with an average angle of 107 ± 12° (n = 21 explants) (see Fig. 10).
Fig. 3.

Diagrams showing the origin of the retinal explants from an E6 retinal whole mount (a, R). The retina was mounted on a membrane filter (MF) that served as support for the retinal explant strips and was cut perpendicular to the optic fissure (OF). The outgrowth pattern of axons from these explant strips in vitro on a continuous substrate with an abundance of axons emerging preferentially from the former ventral side of the explant is shown in b. Note that the axons have a tendency to grow in a clockwise orientation. The two ways of placing the explants over the substrate gradients are shown in c and d. Inc, the majority of axons grow up the gradient, i.e., from low to high concentrations of the substrate, and in d, the majority of axons grow down the gradient, i.e., from high to low concentrations of the substrate.
Fig. 4.

Silver-stained retinal explants that were placed across shallow gradients of basal lamina proteins and cultured for 36 hr. The white dotted lines and the black stippled lines outline the outer margins (M) and the central perimeters (C) of the substrate gradients. The direction up the gradients is indicated by the black arrows. Note that the silver staining stains the filter outside the substrate darker than inside. The explants were placed over the substrate so that the majority of axons grew up the gradient as outlined in Figure3c. The support for the gradients was poly-lysine-treated, nitrocellulose/cellulose acetate membrane filters. Outside the substrate, few and short axons are visible, whereas inside the substrate, the axons were long and abundant. The course of axons was altered by the gradient as the nerve fibers entered the gradient in an angle that was greater compared with that in more central areas of the substrate. The course of axons growing up (U) shallow gradients at higher power is shown in b andc. The angles of axon growth from the explants at the margin and the center of the gradients is indicated by β. Scale bars:a, 1 mm; b, c, 0.5 mm.
Fig. 6.

Angle and length measurements of axon outgrowth from the retinal explants on gradients of basal lamina proteins. Angles were measured at the outer margin and in the center of a basal lamina gradient as outlined in Figures 4, b and c, and5, c and d. The preferred direction of axon outgrowth from the explant is indicated by the arrowheads on the abscissa. Results showed that axons grew into shallow gradients with a wider angle at the outer margin (stippled line) as compared with the center of the substrate (a, C,solid line). The measurements show the mean values from 8 and 21 experiments, respectively. When the angle of axon outgrowth from a single explant was measured along the entire length of a shallow gradient and plotted against gradient length (b), the angles at the very beginning of the gradient are the widest. Farther into the gradient (360 μm), the angles are close to the angles measured in the center of the substrate. In the case of steep gradients (c), the angles of axon outgrowth at the outer margin (stippled line) are very similar to the angles measured in the center of the substrate (C, solid arrow). The measurements show mean values from 12 and 21 preparations with gradients of the same length. The axon length along steep gradients is plotted ind. The graph shows that the length of axons increased with increasing concentration of the substrate. The increase in length is more dramatic at the beginning than at the high range of the gradient. The values are means from four explants of identical gradient length.
Fig. 7.

Silver-stained retinal explants cultured for 36 hr across substrate gradients of basal lamina proteins. The explants were placed across the gradients as outlined in Figure 3d, so that axons grew from high to low substrate concentrations, i.e., down the gradients. The outer margins of the gradients are indicated by thedotted lines, the inner borders of the gradients by thestippled lines. The direction downhill (D) the gradients is indicated by the black arrow. The support for the gradients was poly-lysine-treated, nitrocellulose/cellulose acetate membrane filters. As the concentration of the substrates diminishes, the axons become shorter and more fasciculated, but they do not change their growth direction. A graph showing the angles (β) of axon outgrowth from the explants growing down basal lamina substrate gradients is shown in c. The orientation of axons at the outer margin of the gradient (stippled line) (97 ± 11°) and in the center of the substrate (C, solid line) (108 ± 11°) were slightly but not significantly different. The blot was based on averaged values from 15 and 21 experiments, respectively. The preferred direction of axon outgrowth from the explant is indicated by the arrowheads on the abscissa. Scale bars: a, 1 mm; b, 0.5 mm.
Fig. 10.

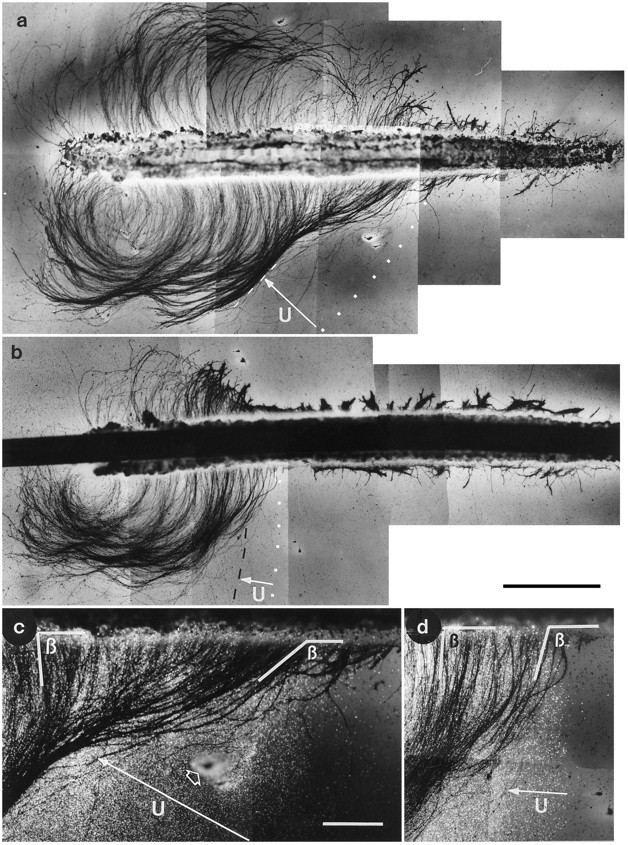
Silver-stained retinal explants cultured for 36 hr across substrate gradients of merosin. The outer margins of the gradients are indicated by the dotted lines and the inner borders of the gradients by the stippled lines. The direction uphill (U) or downhill (D) the gradients is indicated by the arrows. The support for the gradient in a was a poly-lysine-treated nitrocellulose/cellulose acetate membrane filter, and in band c, a plain nitrocellulose membrane filter. A high-power view (c) shows the area indicated by an arrowheadin b. As shown in a–c, the length and the fasciculation of retinal axons decreased as the concentration of merosin diminished. It also was observed that the growth direction of axons that grew downhill the gradients is pointed toward higher substrate concentrations at the outer margin of the gradients (b, c). Angle measurements showed that axons growing down merosin gradients (d) have a growth orientation in the center of the substrate (C, solid line) of 107 ± 12° (n = 21), whereas axons at the outer margin of the gradients (stippled line) have a growth direction of 61 ± 12° (n = 21). The preferred direction of axon outgrowth from the explant is indicated by thearrowheads on the abscissa. Scale bars: a,b, 1 mm; c, 0.5 mm.
Retinal explant strips were placed across the outer perimeter of the gradient substrata (n = 130 experiments) so that approximately one third of the axons from the explants grew out on maximum substrate concentration in a central part of the substrate, another third on a continuously diminishing concentration gradient at the margin of the substrate, and the final third outside the substrate. Taking the predictable clockwise outgrowth pattern of retinal axons into consideration, the explants were placed across the substrate borders so that the majority axons grew either from low to high substrate concentrations, thus up the gradient (n = 68) (Fig. 3c), or so that the majority of axons grew from high to low substrate concentrations, thus down the gradient (n = 39) (Fig. 3d).
Axonal growth patterns on gradients of basal lamina proteins
When retinal explants were placed across gradients of basal lamina extract, the axons that grew over the gradients became shorter and more fasciculated as the substrate concentration diminished (n = 107) (see Figs. 4, 5, 6, 7). A change in the orientation of axons in response to the gradient was observed only when axons were headed up the gradients (Figs. 4,5a,c); the axons grew into and up the gradient in an unusual wide angle, suggesting a guidance of axons toward higher substrate concentrations. However, it was found that the change in axonal growth orientation was obvious only when the axons grew up shallow gradients, suggesting that the response of axons with respect to growth orientation was dependent on the length and slope of the gradients.
The dependency of axon orientation on gradient length and slope was investigated in further detail. When axons grew up a shallow gradient that was longer than 600 μm and had a slope smaller than 17%, a change in the orientation of axons at the outer margin of the gradient was observed consistently (n = 41) (Figs. 4,5a,c). For example, in a gradient of 700–1000 μm in length and slopes between 15 and 10%, the axons grew out from the explants at the outer margin of the gradient with an angle of 149 ± 9° (n = 8 explants measured) (Fig.6a) compared with an angle of axon growth in the center of the substrate of 108 ± 11° (n = 21 explants measured) (Fig. 6a). To monitor the change of angles relative to the position of the gradient, the angles of axon outgrowth from the retinal explants were measured in 120 μ steps along the entire length of the gradients. As shown in the case depicted in Figure 6b, the widest angle of axon growth was measured at the beginning of the gradient, whereas 300 μm farther into the gradient, the angles were close to the growth orientation of axons in the center of the substrate. The wide angle of axon growth at the outer margin of the gradient and the steeper angle of axon orientation in a slightly more central position caused the formation of a thick axon fascicle that curved into the substrate and give these preparations their characteristic appearance (Figs. 4, 5a,c). The increase in axon length could not be measured in shallow substrate gradients, because the alteration of axon orientation into higher concentrations of the substrate caused the axons to form thick axons bundles that precluded the measurements of individual axons. Furthermore, because of the reorientation of axons to high substrate concentrations, axons reached maximum length despite starting out at the outermost border of the substrate.
When axons grew up a steep gradient, only the length but not the growth orientation of axons was affected (n = 27) (Fig.5b,d). In a gradient of up to 400 μm in length and a slope of 25%, the axons exited the explants at the outer margin of the gradient with an angle of 116 ± 7° (n = 12 explants measured) (Fig. 6c) compared with an angle of axon growth in the center of the substrate of 108 ± 11° (n = 21 explants measured) (Fig. 6c). Thus, when axons grew up a steep gradient, no significant difference in the angles of axonal growth in the periphery and the center of the substrate was detectable. Because axons had only a slight oblique orientation and an approximately straight growth direction, the increase in length of axons along the gradients could be quantified. It was found that axon length paralleled approximately the increase of substrate concentration in the gradient. However, the most dramatic increase in axon length was detected at the outer margin rather than the center of the gradients (Fig. 6d).
When the growth of axons was directed down the gradients, the growth orientation of axons was not affected significantly by the substrate gradients. The major effects of the gradients were that the axons became shorter and more fasciculated as the substrate concentration diminished (n = 39) (Figs.7a,b, 8b). When the angle of axon outgrowth from the explants at the outer margin of the gradient was measured (94 ± 11°, n = 15 explants measured) (Fig. 7c) and compared with the angle of axon outgrowth in the center of the substrate (108 ± 11°,n = 21 explants measured) (Fig. 7c), a slight but not significant alteration in the direction of axonal growth was detected.
By comparing the behavior of axons facing abrupt, discontinuous substrates and the behavior of axons facing gradient borders, it was observed that axons growing down gradients obeyed their borders less precisely than axons of discontinuous substrates. As shown in Figure8a, axons facing discontinuous substrate borders were confined precisely to the outlines of the substrata. Very few, if any, axons were able to grow over the substrate borders. In gradients, however, axons were able to cross into the territory beyond the basal lamina substrata (Figs. 7a,b,8b) and formed much less well-defined axonal growth borders. Consistently, the axons overran the outer margins of gradient substrates by as much as 200 μm (Fig. 8c,d). A similar situation was observed when axons grew directly downhill substrate gradients from explants that were placed parallel to the substrate borders; axons finally stopped after exiting the gradient substrate borders. Nevertheless, a considerable number of axons were able to grow even farther and invaded the territory beyond the basal lamina as thick axons bundles, probably using each other as a growth substrate (Fig. 9a,b). In contrast, very few axons were able to grow over abrupt, discontinuous substrate borders (Figs. 8a, 9c).
Fig. 9.

Silver-stained retinal explants showing the behavior of axons heading straight downhill a gradient (a,b) and a discontinuous substrate border (c). The outer margin (M), the central part of the gradient (C), and the direction down the gradient are indicated by the dotted line, the stippled line, and thearrow, respectively. The support for the substrates was poly-lysine-treated, nitrocellulose/cellulose acetate membrane filters. In the case of the gradient, the axons finally stop; however, numerous nerve fibers grew beyond the substrate and formed thick fascicles. In the case of a discontinuous substrate, very few axons were able to ignore the substrate border. Scale bars: a, 1 mm;b, c, 300 μm.
Axonal growth patterns on substrate gradients of merosin
To see how axons behave on substrate gradients of a defined extracellular matrix protein, retinal explants were placed across gradients of merosin. Merosin is a member of the laminin protein family (Ehrig et al., 1990) and has been shown to support the outgrowth of embryonic retinal axons (Cohen and Johnson, 1991). As shown in Figure 10, a and b, optic axons that grew up gradients of merosin substrates became longer and less fasciculated as the merosin concentration increased. However, in contrast to axons growing up basal lamina gradients, the direction of axonal growth at the outer margin and in the center of merosin substrates was not significantly different (data not shown).
When axons grew downhill merosin gradients (Fig.10b,c), the retinal axons became shorter and more fasciculated with diminishing substrate concentrations (Fig. 10). Furthermore, it was found that the direction of axonal outgrowth at the outer margin of the merosin gradients pointed toward higher merosin concentrations. This directional effect was most obvious in shallow gradients with slopes of 20% and smaller and gradient lengths of 500 μm and longer (Fig. 10b,c). Angle measurements showed that axons grew out from retinal explants in the center of merosin substrates with an angle of 107 ± 12° (n = 21), whereas axons grew out from the explants at the outer margin of shallow merosin gradients with an angle of 61 ± 12° (n = 21) (Fig. 10d). It was never observed that axons that grew down a merosin gradient U turned to higher concentrations of the substrate.
DISCUSSION
The present study shows that retinal axons are able to register substrate gradients by altering the advance and fasciculation of neurites and, under certain conditions, by growing in the direction of higher concentrations of the substrate.
Technical considerations for the preparation of substrate gradients
Extracellular matrix gradients were prepared by injecting a fine suspension of basal lamina proteins or a solution of human merosin into drops of Hank’s solution sitting on membrane filters. Because of the higher buoyant density, the basal lamina proteins or the merosin sank through the saline onto the surface of the membrane filters and diffused out in radial direction. After a short diffusion time, the substrate proteins with the diffusion zones at their outer perimeters were immobilized by sucking the drops of saline with the matrix proteins onto and into the membrane filters. The only conceivable way to immobilize the gradients was by suction; therefore, porous membrane filters were the only possible carriers for the substrates. The technique is simple, uses standard laboratory equipment, and produced reliably extracellular matrix protein gradients in the range between 200 and 1000 μm. A disadvantage of the preparation is that the opacity of the membrane filters does not allow continuous monitoring of the axons as they grow out on the substrate. Rather, the axons have to be visualized after the experiments by either silver staining or immunostaining using anti-neurofilament antibodies.
For most of the present experiments, a fine suspension of reconstituted basal lamina proteins from the embryonic retinal inner-limiting membrane was used as a substrate. Previous studies have demonstrated that growing axons in the developing CNS often are found next or close to basal laminae, suggesting that basal lamina proteins might play a role in axonal extension in vivo (Easter et al., 1984; Cohen et al., 1987; Halfter and Fua, 1987; Condic and Bentley, 1989). The basal lamina extract used in the present study, therefore, may resemble the complex extracellular matrix environment that axons encounter as they grow to their targets. The supportive nature of basal lamina proteins is highlighted by the fact that the basal lamina extract promoted axon outgrowth from chick retinal explants much more reliably than the commonly used EHS mouse tumor laminin or collagen gels (Halfter et al., 1987; Halfter and von Boxberg, 1992). It currently is unknown which components of the basal lamina extract are responsible for its neurite outgrowth-promoting effect. Candidates for this activity and major constituents of the retinal inner-limiting membrane are the members of the laminin protein family. Because several components of the basal lamina still are unidentified, it is well possible that beside the laminins, other extracellular matrix proteins from retinal basal lamina promote neurite outgrowth as well.
Later in the course of the study, it was found that merosin supports neurite outgrowth from retinal explants as well as the basal lamina extracts. Because merosin, a member of the family of the laminin proteins, is a defined protein, the pattern of axon outgrowth also was investigated on substrate gradients of merosin. The growth behavior of retinal axons on gradients of merosin was similar but not identical to that on basal lamina gradients. On both substrates, the neurites became shorter and more fasciculated as the concentration of the substrates diminished. However, a significant change in the direction of axons growing uphill gradients was only observed using retinal basal lamina extract as a substrate. On the other hand, a significant change in growth direction for axons growing downhill gradients was significant only when using merosin as a substrate. Obviously, gradients of different protein composition may have different effects on the navigation of axons.
Axonal growth in response to the substrate gradients
In all present experimental paradigms, whether the gradients were steep or shallow or axons headed up or down the gradients, diminishing concentration of the substrates consistently caused axons to become shorter and more fasciculated. A directional response of growing axons to the substrate gradients was observed only when the gradients were shallow and had a slope smaller than 15% per 100 μm. Consistently, changes in the direction of axonal growth were observed at the outer margins of the gradients, indicating that small changes in the substrate concentration in the low-concentration range of the gradients have more obvious effects on the navigation of axons than large changes in substrate concentration or changes in the upper concentration range of the gradients. This may be attributable to the fact that differences in substrate concentrations can be registered only by axons for which ligand receptors operate under nonsaturating conditions and have free receptor sites available for additional extracellular matrix binding. The fact that gradients only have an effect on axon orientation in the low-concentration range also would mean that the little changes in the concentration of the substrate that are sufficient to elicit a directional response may be difficult to detect in vivo.
The present data demonstrate that the most obvious directional responses of axons to higher substrate concentrations occurred with gradient slopes between 15 and 10% per 100 μm, which is in the same range as gradients of tectal growth inhibitors that caused retinal axons to reduce their growth rate in vitro (Baier and Bonhoeffer, 1992). Furthermore, following the hypothesis that retinal growth cones can sample an area with a diameter of ∼25 μm (Baier and Bonhoeffer, 1992), differences in substrate concentrations between 4 and 2.5% per 25 μm (i.e., 15–10% per 100 μm) resulted in a decrease in the rate of axonal advance and in a turning response to higher substrate concentrations in the present experiments.
When axons were growing down gradients, a significant directional effect on growing axons was observed on substrate gradients of merosin but not on gradients of basal lamina extract, indicating that the directional potency of basal lamina gradients cannot override any given growth orientation. The restricted potency of the basal lamina gradients to direct axon growth also may explain why a previous study investigating the growth of sympathetic axons on gradients of laminin was not able to detect any guidance function of the substrate at all (McKenna and Raper, 1988). An obvious directional response of axons growing downhill gradients, however, was observed when the explants were placed over shallow gradients of merosin. In these cases, the outgrowth direction of retinal axons from the explants at the outer margin of the gradients was in the direction of higher substrate concentrations, indicating that increasing concentrations of some substrates, i.e., merosin, can have a directional effect on growing axons that is dominant over the inherent clockwise growth of retinal axons. The directional effect of merosin gradients, however, only affected the initial growth direction of axons from the explants, but was not able to exert axon-turning responses. For example, it was never observed that axons heading downhill gradients were redirected to higher substrate concentrations by U turning.
The idea that gradients of membrane proteins or extracellular matrix proteins are responsible for the oriented growth of axons has been postulated for several years (Fraser, 1980; Gierer, 1983; Bonhoeffer and Gierer, 1984; Harris, 1989). Based on the classical studies byLetourneau (1975) showing the preference of growing axons to adhesive over nonadhesive substrates, it was assumed that increasing concentration of neurite outgrowth-promoting molecules may have a guiding role for growing axons. Despite the existence of potential guidance molecules as gradients (Trisler et al., 1981;Constantin-Patton et al., 1986; Gardner et al., 1988; McCaffery et al., 1991; Savitt et al., 1995), the only effect of substrate gradients with respect to axonal growth observed thus far is a reduction of the growth rate of axons with increasing concentrations of growth inhibitors (Baier and Bonhoeffer, 1992; Snow and Letourneau, 1992). A positive chemotropic response of axons to a substrate gradient in a collagen-free, two-dimensional substrate environment, however, never has been documented. The present study confirms previous findings (Baier and Bonhoeffer, 1992; Snow and Letourneau, 1992) showing that substrate gradients have an effect on the rate of axon outgrowth. In addition, the present data show that gradients affect axon fasciculation and, under certain conditions, may even orient growing axons in the direction of higher substrate concentrations. However, the present experiments do not support the idea that substrate gradients provide the dominant axon guidance cues as suggested previously. Rather, the experimental data suggest that substrate gradients have a synergistic effect on other parameters that regulate axonal guidance, such as the structural environment along axonal pathways or the intracellular organization of the cytoskeleton of the parent neurons. The present and previous data showing the inability of gradients to redirect axons, however, also may indicate the inability of in vitro neurite outgrowth assays to replicate axonal guidancein vivo. Two major problems in the tissue culture experiments exist. First, the assumption that the molecules that promote neurite extension also are the molecules that are responsible for the orientation of axonal growth (Letourneau, 1975) may not be correct. It may well be that substrate proteins, such as the laminins, provide a permissive environment for axonal growth but have no neurotropic functions. Rather, different classes of molecules that by themselves may not necessarily promote neurite outgrowth could be the classes of molecules that regulate the direction of axonal growth. Second, the exact parameters of possible substrate gradients in vivo, such as slopes, lengths, and concentration ranges, are unknown. Whereas the lengths of the gradients in vitrobetween 200 and 1000 μm are in the same range as the distances of parent neurons to their targets (Tessier-Lavigne and Placzek, 1991), data on the concentrations of potential guidance proteins in the embryonic tissue are not available. The present experiments, therefore, are meant to attempt to assess the potential importance of substrate gradients on axonal guidance and to provide a basis for additional experiments.
Footnotes
This work was supported by National Science Foundation Grant IBN-9511298. I thank B. Schurer for technical help in the isolation of retinal basal laminae and Dr. Robert Oakley for critical reading of this manuscript.
Correspondence should be addressed to Willi Halfter, Department of Neurobiology, University of Pittsburgh, 1414 West Biological Science Tower, Pittsburgh, PA 15261.
REFERENCES
- 1.Baier H, Bonhoeffer F. Axon guidance by gradients of a target-derived component. Science. 1992;255:472–475. doi: 10.1126/science.1734526. [DOI] [PubMed] [Google Scholar]
- 2.Bodian A new method for staining nerve fibers and nerve endings in mounted paraffin sections. Anat Rec. 1936;65:318–321. [Google Scholar]
- 3.Bonhoeffer F, Gierer A. How do retinal axons find their target on the tectum? Trends Neurosci. 1984;7:378381. [Google Scholar]
- 4.Brittis PA, Silver J. Multiple factors govern intraretinal axon guidance: a time lapse study. Mol Cell Neurosci. 1995;6:413–432. doi: 10.1006/mcne.1995.1031. [DOI] [PubMed] [Google Scholar]
- 5.Brittis PA, Cannings DR, Silver J. Chondroitin sulfate as a regulator of neuronal patterning in the retina. Science. 1992;255:733–736. doi: 10.1126/science.1738848. [DOI] [PubMed] [Google Scholar]
- 6.Clark P, Britland S, Connolly P. Growth cone guidance and neuron morphology on micropatterned laminin surfaces. J Cell Sci. 1993;105:203–212. doi: 10.1242/jcs.105.1.203. [DOI] [PubMed] [Google Scholar]
- 7.Cohen J, Johnson AR (1991) Differential effects of laminin and merosin on neurite outgrowth by developing retinal ganglion cells. J Cell Sci 15[Suppl]:1–7. [DOI] [PubMed]
- 8.Cohen J, Burne JF, McKinley C, Winter J. The role of laminin and the laminin/fibronectin receptor complex in the outgrowth of retinal ganglion cell axons. Dev Biol. 1987;122:407–418. doi: 10.1016/0012-1606(87)90305-8. [DOI] [PubMed] [Google Scholar]
- 9.Condic ML, Bentley D. Removal of the basal lamina in vivo reveals growth cone-basal lamina adhesive interactions and axon tension. J Neurosci. 1989;9:2678–2686. doi: 10.1523/JNEUROSCI.09-08-02678.1989. [DOI] [PMC free article] [PubMed] [Google Scholar]
- 10.Constantin-Patton M, Blum AS, Mendez-Otero R, Barnstable CJ. A cell surface molecule distributed in a dorso-ventral gradient in the perinatal rat retina. Nature. 1986;324:459–462. doi: 10.1038/324459a0. [DOI] [PubMed] [Google Scholar]
- 11.Dodd J, Jessel TM. Axon guidance and the patterning of neuronal projections in vertebrates. Science. 1988;242:692–699. doi: 10.1126/science.3055291. [DOI] [PubMed] [Google Scholar]
- 12.Easter SS, Bratton B, Scherer Growth-related order of the retinal fiber layer in goldfish. J Neurosci. 1984;4:2173–2190. doi: 10.1523/JNEUROSCI.04-08-02173.1984. [DOI] [PMC free article] [PubMed] [Google Scholar]
- 13.Ehrig K, Leivo I, Agraves WS, Ruoslahti E, Engvall E. Merosin, a tissue specific basement membrane protein, is a laminin-like protein. Proc Natl Acad Sci USA. 1990;87:3264–3268. doi: 10.1073/pnas.87.9.3264. [DOI] [PMC free article] [PubMed] [Google Scholar]
- 14.Fraser SE. A differential adhesion approach to the patterning of nerve connections. Dev Biol. 1980;79:453–464. doi: 10.1016/0012-1606(80)90130-x. [DOI] [PubMed] [Google Scholar]
- 15.Gardner CA, Darnell DK, Poole SJ, Ordahl CP, Barald KF. Expression of an engrailed-like gene during development of the early embryonic chick nervous system. J Neurosci Res. 1988;21:426–437. doi: 10.1002/jnr.490210234. [DOI] [PubMed] [Google Scholar]
- 16.Gierer A. Model for the retino-tectal projection. Proc R Soc Lond [Biol] 1983;218:77–93. doi: 10.1098/rspb.1983.0027. [DOI] [PubMed] [Google Scholar]
- 17.Godemont P, Salaün J, Mason C. Retinal axon pathfinding in the optic chiasm: divergence of crossed and uncrossed fibers. Neuron. 1990;5:173–186. doi: 10.1016/0896-6273(90)90307-2. [DOI] [PubMed] [Google Scholar]
- 18.Goldberg S, Coulombre AJ. Topographical development of the nerve fiber layer in the chick retina. A whole mount study. J Comp Neurol. 1972;146:507–517. doi: 10.1002/cne.901460406. [DOI] [PubMed] [Google Scholar]
- 19.Grant P, Rubin E. Ontogeny of the retina and optic nerve in Xenopus laevis . II. Ontogeny of the optic fiber pattern in the retina. J Comp Neurol. 1980;189:671–698. doi: 10.1002/cne.901890405. [DOI] [PubMed] [Google Scholar]
- 20.Guillery RW. The optic chiasm of the vertebrate brain. Contrib Sens Physiol. 1983;7:39–73. [Google Scholar]
- 21.Gundersen RW. Response of sensory neurites and growth cones to patterned substrata of laminin and fibronectin in vitro. Dev Biol. 1987;121:423–431. doi: 10.1016/0012-1606(87)90179-5. [DOI] [PubMed] [Google Scholar]
- 22.Halfter W, Fua CS. Immunohistochemical localization of laminin, NCAM, collagen type IV and T-61 antigen in the embryonic retina of the Japanese quail by in vivo injection of antibodies. Cell Tissue Res. 1987;249:487–496. doi: 10.1007/BF00217320. [DOI] [PubMed] [Google Scholar]
- 23.Halfter W, von Boxberg Y. Axonal growth on solubilized and reconstituted matrix from the embryonic chicken inner limiting membrane. Eur J Neurosci. 1992;4:840–852. doi: 10.1111/j.1460-9568.1992.tb00194.x. [DOI] [PubMed] [Google Scholar]
- 24.Halfter W, Newgreen D, Sauter J, Schwarz U. Oriented axon outgrowth from avian embryonic retinae in culture. Dev Biol. 1983;95:56–64. doi: 10.1016/0012-1606(83)90006-4. [DOI] [PubMed] [Google Scholar]
- 25.Halfter W, Deiss S, Schwarz U. The formation of the axonal pattern in the embryonic avian retina. J Comp Neurol. 1985;232:466–480. doi: 10.1002/cne.902320405. [DOI] [PubMed] [Google Scholar]
- 26.Halfter W, Reckhaus W, Kroeger S. Nondirectional growth on basal lamina from avian embryonic neural retina. J Neurosci. 1987;7:3712–3722. doi: 10.1523/JNEUROSCI.07-11-03712.1987. [DOI] [PMC free article] [PubMed] [Google Scholar]
- 27.Hankin M, Lund RD. How do axons find their target in the brain? Trends Neurosci. 1991;14:224–228. doi: 10.1016/0166-2236(91)90118-e. [DOI] [PubMed] [Google Scholar]
- 28.Harris WA. Local positional cues in the neuroepithelium guide retinal axons in the embryonic Xenopus brain. Nature. 1989;339:218–221. doi: 10.1038/339218a0. [DOI] [PubMed] [Google Scholar]
- 29.Holt CE, Harris WA. Position, guidance and mapping in the developing visual system. J Neurobiol. 1993;24:1400–1422. doi: 10.1002/neu.480241011. [DOI] [PubMed] [Google Scholar]
- 30.Hynes RO, Lander AD. Contact and adhesive specificities in the association, migration and targeting of cells and axons. Cell. 1992;68:303–322. doi: 10.1016/0092-8674(92)90472-o. [DOI] [PubMed] [Google Scholar]
- 31.Keynes R, Cook GMW. Axon guidance molecules. Cell. 1995;83:161–169. doi: 10.1016/0092-8674(95)90157-4. [DOI] [PubMed] [Google Scholar]
- 32.Krayanek S, Goldberg S. Oriented extracellular channels and axonal guidance in the embryonic chick retina. Dev Biol. 1981;84:41–50. doi: 10.1016/0012-1606(81)90368-7. [DOI] [PubMed] [Google Scholar]
- 33.Letourneau P. Cell-to-substratum adhesion and guidance of axonal elongation. Dev Biol. 1975;44:92–101. doi: 10.1016/0012-1606(75)90379-6. [DOI] [PubMed] [Google Scholar]
- 34.McCaffery P, Tempst P, Lara G, Draeger UC. Aldehyde dehydrogenase is a positional marker in the retina. Development. 1991;112:693–702. doi: 10.1242/dev.112.3.693. [DOI] [PubMed] [Google Scholar]
- 35.McKenna MP, Raper JA. Growth cone behavior on gradients of substratum bound laminin. Dev Biol. 1988;130:232–236. doi: 10.1016/0012-1606(88)90429-0. [DOI] [PubMed] [Google Scholar]
- 36.Rager Lausman S, Gallyas F. An improved silver stain for developing nervous system. Stain Technol. 1979;54:193–200. doi: 10.3109/10520297909112682. [DOI] [PubMed] [Google Scholar]
- 37.Ramon y Cajal S. La Retine des Vertebrates. La Cellule. 1892;9:119–258. [Google Scholar]
- 38.Sanes JR. Topographic maps and molecular gradients. Curr Opin Neurobiol. 1993;3:67–74. doi: 10.1016/0959-4388(93)90037-y. [DOI] [PubMed] [Google Scholar]
- 39.Savitt JM, Trisler D, Hilt CD. Molecular cloning of TOPAP, a topographically graded protein in the developing chick visual system. Neuron. 1995;14:253–261. doi: 10.1016/0896-6273(95)90283-x. [DOI] [PubMed] [Google Scholar]
- 40.Silver J, Sidman RL. A mechanism for the guidance and topographic projection of retinal ganglion cell axons. J Comp Neurol. 1980;189:101–111. doi: 10.1002/cne.901890106. [DOI] [PubMed] [Google Scholar]
- 41.Snow DM, Letourneau PC. Neurite outgrowth on a step gradient of chondroitin sulfate proteoglycan. J Neurobiol. 1992;23:322–336. doi: 10.1002/neu.480230311. [DOI] [PubMed] [Google Scholar]
- 42.Snow DM, Watanabe M, Letourneau PC, Silver J. A chondroitin sulfate proteoglycan may influence the direction of retinal ganglion cell outgrowth. Development. 1991;113:1473–1485. doi: 10.1242/dev.113.4.1473. [DOI] [PubMed] [Google Scholar]
- 43.Sperry RW. Chemoaffinity in the orderly growth of nerve fiber patterns and connections. Proc Natl Acad Sci USA. 1963;50:703–710. doi: 10.1073/pnas.50.4.703. [DOI] [PMC free article] [PubMed] [Google Scholar]
- 44.Sretavan DW, Reichardt LF. Time-lapse video analysis of retinal ganglion cell axon pathfinding at the mammalian optic chiasm: growth cone guidance using extrinsic chiasm cues. Neuron. 1993;10:761–777. doi: 10.1016/0896-6273(93)90176-r. [DOI] [PubMed] [Google Scholar]
- 45.Stirling RV. Molecules, maps and gradients in the retinotectal system. Trends Neurosci. 1991;14:509–512. doi: 10.1016/0166-2236(91)90001-b. [DOI] [PubMed] [Google Scholar]
- 46.Tessier-Lavigne M, Placzek M. Target attraction—are developing axons guided by chemotropism? Trends Neurosci. 1991;14:303–310. doi: 10.1016/0166-2236(91)90142-h. [DOI] [PubMed] [Google Scholar]
- 47.Trisler GD, Schneider MD, Nierenberg M. A topographic gradient of molecules in retina can be used to identify neuron position. Proc Natl Acad Sci USA. 1981;78:2145–2149. doi: 10.1073/pnas.78.4.2145. [DOI] [PMC free article] [PubMed] [Google Scholar]
- 48.Udin SB, Fawcett JW. Formation of topographic maps. Annu Rev Neurosci. 1988;11:289–327. doi: 10.1146/annurev.ne.11.030188.001445. [DOI] [PubMed] [Google Scholar]
- 49.Walter J, Kern-Veits B, Huf J, Stolze B, Bonhoeffer F. Recognition of position-specific properties of tectal cell membranes by retinal axons in vitro. Development. 1987;101:685–696. doi: 10.1242/dev.101.4.685. [DOI] [PubMed] [Google Scholar]