Abstract
Huntington’s disease (HD) is caused by a genetic mutation that results in a polyglutamine expansion in huntingtin. The time course of neuronal loss in the HD striatum and other affected brain regions before the onset of symptoms is unknown. To determine the potential influence of huntingtin on brain development, we examined its expression in the developing mouse and in human control and HD brain. By Western blot, huntingtin was detected throughout the adult mouse brain and at all stages of embryonic and postnatal brain development. The protein increased significantly between postnatal day 7 (P7) and P15, which marks a period of active neuronal differentiation and enhanced sensitivity to excitotoxic injury in the rodent striatum. Immunoreactivity was found in neurons throughout the brain and localized mostly to the somatodendritic cytoplasm and to axons in fiber bundles. Staining was variable in different groups of neurons and within the same cell population. In developing brain, huntingtin was limited primarily to neuronal perikarya. Increased immunoreactivity in large neurons followed the gradient of neurogenesis and appeared in the basal forebrain and brainstem by embryonic days 15–17, in regions of cortex by P0–P1, and in the striatum by P7. In human brain at midgestation (19–21 weeks), huntingtin was detected in all regions. The brain of a 10-week-old infant with the expanded HD allele expressed a higher molecular weight mutant form of huntingtin at levels comparable to those of the wild-type protein. Thus, mutant huntingtin is expressed before neuronal maturation is complete. Results suggest that huntingtin has an important constitutive role in neurons during brain development, that heterogeneity in neuronal expression of the protein is developmentally regulated, and that the intraneuronal distribution of huntingtin increases in parallel with neuronal maturation. The presence of mutant huntingtin in the immature HD brain raises the possibility that neurons may be affected during brain development and possibly in the postnatal period when vulnerability to excitotoxic injury is at its peak.
Keywords: huntingtin, mutant huntingtin, Huntington’s disease, striatum embryonic brain, postnatal brain
Huntington’s disease (HD) is a genetic neurodegenerative disorder that causes severe motor and cognitive impairment and a marked brain atrophy and neuronal loss. The disease has a late onset, with a 15–20 year course in adults; a rarer form of HD in children has a faster progression and a more severe course (Folstein, 1989; Young, 1994). A trinucleotide repeat (CAG) expansion in the coding region of the HD gene is the basis for the genetic mutation (Huntington’s Disease Collaborative Research Group, 1993). Larger CAG expansions are associated with early onset in HD (Andrew et al., 1993; Duyao et al., 1993; Snell et al., 1993; Stine et al., 1993). Huntingtin, the protein encoded by the HD gene, has no known function. It is expressed most abundantly throughout the brain but is also detected in other mammalian tissues (Aronin et al., 1995; Sharp et al., 1995; Trottier et al., 1995). Immunohistochemical studies in human, monkey, and rat brain indicate that huntingtin is localized throughout the neuronal cytoplasm and is enriched in some nerve endings (DiFiglia et al., 1995; Gutekunst et al., 1995; Sharp et al., 1995).
In HD heterozygotes, both a normal and a higher molecular weight mutant form of huntingtin are detected in brain (Aronin et al., 1995), pointing to a gain of function by an aberrant protein as the basis for the disease. The mutant protein is widespread, with no difference in expression in the striatum (Aronin et al., 1995), the region most affected in HD. Multiple increased sizes of the mutant protein appear in forebrain regions of juvenile onset cases, however, suggesting that heterogeneity in mutant protein expression may contribute to increased pathology. The delayed onset and slow progression of disease is a hallmark of HD and a key to understanding its pathogenesis. Neuronal loss and metabolic alterations are known to occur in the adult HD brain before the onset of symptoms (Mazziotta et al., 1987; Albin et al., 1992), but the precise timetable for the onset of neuronal degeneration is unknown. Cells expressing the huntingtin gene mRNA are seen byin situ hybridization in normal human 20- to 23-week fetal brain (Dure et al., 1994), suggesting strongly that huntingtin is present in the immature brain. Deletion of the mouse homolog of the huntingtin gene is lethal in the embryo before the brain is formed, thus providing no clues to the role of the protein in the brain (Duyao et al., 1995; Nasir et al., 1995; Zeitlin et al., 1995). Interestingly, heterozygote mice with one intact huntingtin gene develop normally (Duyao et al., 1995; Zeitlin et al., 1995) or exhibit motor learning deficits and cell loss in the basal ganglia (Nasir et al., 1995). Clearly, a clarification of the time course and regional expression of huntingtin in the developing brain would be valuable in assessing the earliest possible influence of mutant huntingtin in HD pathogenesis as well as the potential importance of the protein in normal brain development. In this study, we sought to determine by biochemical and immunohistochemical methods the presence and regional distribution of huntingtin in the embryonic and early postnatal mouse and in the human fetal brain. In addition, we examined the brain of a 10-week-old infant who inherited the HD gene allele to determine whether the mutant protein was expressed in the early postnatal period.
MATERIALS AND METHODS
Acquisition and preparation of mouse and human brain.Embryos [embryonic day 10 (E10)–E17, six per age group] from CD1 pregnant mice were removed by hysterotomy of dams anesthetized with a mixture of ketamine (50 mg/kg body weight) and xylazine (10 mg/kg body weight); the body temperature of the embryos was reduced before brain dissection. Postnatal [postnatal day 0 (P0)–P30] pups (six per group) and adult mice (8- to 12-weeks-old, n = 8) were anesthetized with ketamine/xylazine as described above, and the brain was dissected from each animal, cut in half (animals P7–adult), and frozen in liquid nitrogen. For immunohistochemistry, adult animals (8- to 12-weeks-old) were anesthetized and perfused through the heart with 150 ml of 4% paraformaldehyde. The brains were removed and placed in fixative for several hours. Some brains were then immersed in 30% sucrose for 1–2 d and frozen in liquid nitrogen; others were cut on a vibratome into phosphate buffer and used immediately for immunohistochemistry (see below). In two additional adult mice, the brain was removed after anesthesia and fixed by immersion in 4% paraformaldehyde. Brains from animals E10–P30 (four per group) were removed and placed in the same fixative overnight, sucrose-protected, and frozen in liquid nitrogen. Two human fetal brains (19 and 21 weeks) were obtained 2 hr after elective termination of pregnancy. Different brain regions were dissected and frozen to −70° until further biochemical analysis. The cortex and cerebellum from a 10-week-old postnatal brain of an HD gene carrier was also dissected and frozen. The cause of death was an infection. CAG repeat length was determined using a PCR assay as described in Aronin et al. (1995) to confirm the presence of an expanded allele. The normal allele had 17 CAG repeats, and the expanded HD allele had 39 CAG repeats.
Protein extractions. Frozen brain samples were weighed and then homogenized on ice in 10 vol of a Tris buffer (50 mm Tris base, 120 mm NaCl, pH 7.4) containing protease inhibitors (0.5 mmPMSF, 0.5 mm DTT, 1 μg/ml pepstatin, 70 μg/ml TPCK, and 0.5 μg/ml leupeptin). Homogenates were spun at 15,000 × g for 10 min at 4°C, and the supernatants were removed and placed in a separate tube. The Bradford assay was used to determine protein concentrations. All samples were stored at −70°.
Protein separation and Western blot analysis. Protein extracts (5–35 μg/lane) were submitted to SDS-PAGE using a 10% acrylamide gel containing 0.05% bis-acrylamide. After transfer to nitrocellulose, blots were probed with Ab1 (0.5 μg/ml), which recognizes the N-terminal 1–17 amino acids of huntingtin. The specificity of this antisera for human and rat huntingtin has been described previously, including the use of blocking experiments in Western blot analysis (DiFiglia et al., 1995). Enhanced chemiluminescence (ECL, Amersham, Arlington Heights, IL) was used to detect immunoreactivity with autoradiography film exposed from 2 sec to 1 hr.
To compare huntingtin expression in postnatal and adult animals, protein extracts at different concentrations (5, 10, 20, and 35 μg) from adult (n = 4) and postnatal animals were separated by SDS-PAGE, transferred to nitrocellulose, and immunoblotted. The adult animals were compared with P0, P7, P15, and P30 mice (four animals/group). After the detection of immunoreactivity by ECL, the films were exposed and evaluated by densitometry (IS-1000 Digital Imaging System, Alpha Innotech). Each immunoblot contained the results for one adult animal paired with one young animal. The signal intensity for each protein concentration was compared in the two animals and expressed as the percentage of the younger animal to the adult. This procedure was repeated for all protein concentrations. Ratio values were subjected to a one-sample nonparametric analysis (Mann–WhitneyU test) to determine significant differences of the median values for a two-tailed comparison. Values different from 1.0 were considered significant at p ≤ 0.05.
Immunohistochemistry. Methods for the immunohistochemical detection of huntingtin have been described previously for rat and human brain tissue (DiFiglia et al., 1995). Mounted 20–50 μm frozen sections of E10–P15, adult mouse, and vibratome-cut 50 μm sections of adult mouse were used. Sections were blocked in 0.3% H202, 2% normal goat serum, and 5% bovine serum albumin for 1 hr, washed 3× 10 min in PBS, and incubated for 40 hr in anti-huntingtin antisera. The optimal antibody concentration was predetermined by performing a dilution series in the immature and adult tissue. Optimal concentrations of the primary antisera (Ab1) were 0.25–0.5 μg for adult mouse tissue and 1–2 μg for the developing brain. After washing 3× 10 min in PBS, sections were treated with biotinylated secondary antibody (1:200–1:400) followed by the ABC reagent (Vectastain, Vector Labs, Burlingame, CA) and visualization of the immunoreactive product with diaminobenzidine in the presence of 0.003% H202. Frozen slide-mounted 10 μm sections from immersion-fixed adult brain were used for some experiments. The immunohistochemistry protocol was modified to include a 5 min preblocking step in which the sections were exposed to 10% methanol. Omission of the primary antibody produced no staining in the sections. Inclusion of 50 μg of peptide antigen with Ab1 significantly reduced the staining of neurons (see Fig.4b,c).
Fig. 4.
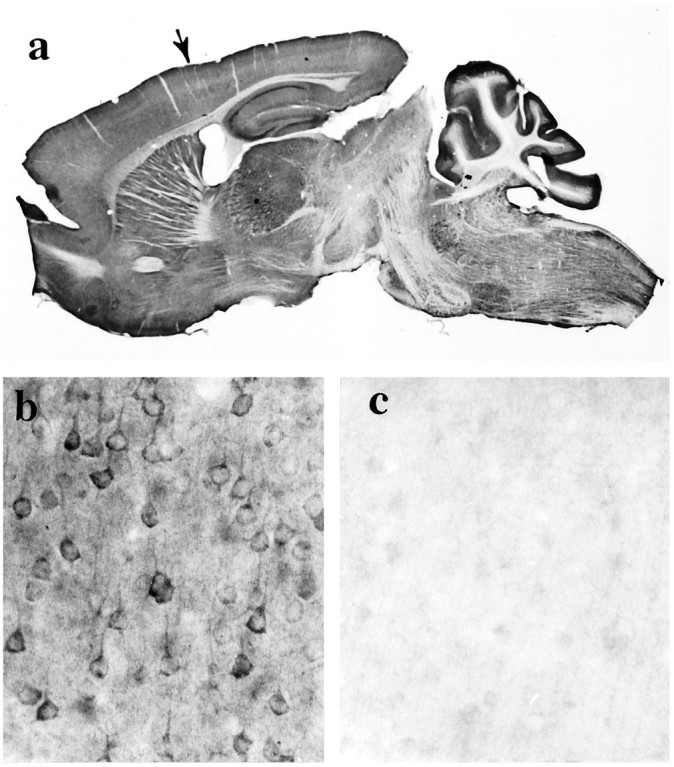
Huntingtin immunoreactivity in the adult mouse brain. a, Sagittal section shows huntingtin labeling throughout the brain and more prominently in the gray matter than the white matter because of the preferential staining of neuronal somata and dendrites. Some folds are present in the cortex of the cerebellum.Arrow identifies the area of cortex shown in band c. Magnification, 4×. b, Huntingtin immunoreactivity is seen in neurons throughout the cortical gray matter. c, Preadsorption control: neuronal staining in cortex is reduced significantly when peptide antigen is added to the anti-huntingtin antisera. Residual huntingtin labeling, which is faintly observed in some perikarya, is probably in neurons that normally express the highest levels of the protein.
RESULTS
Developmental and regional expression of huntingtin in mouse brain
Western blots
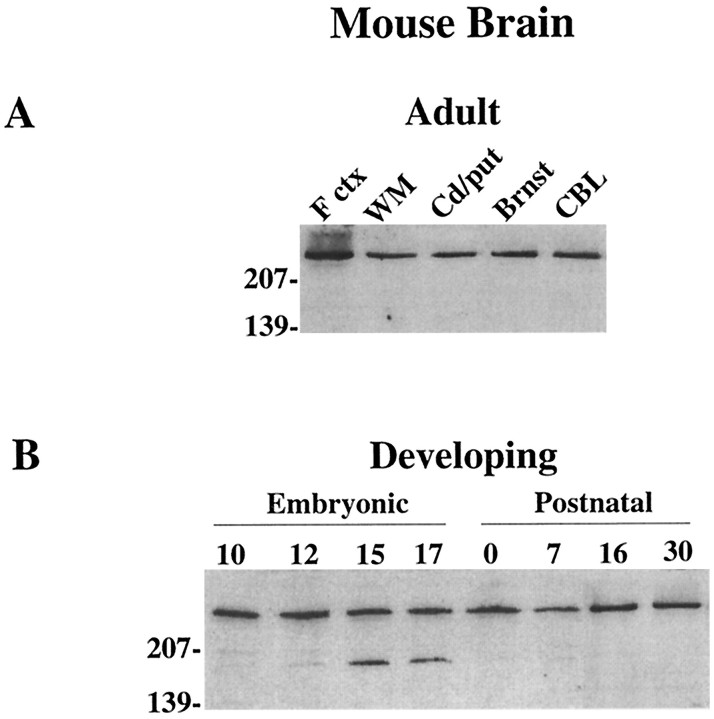
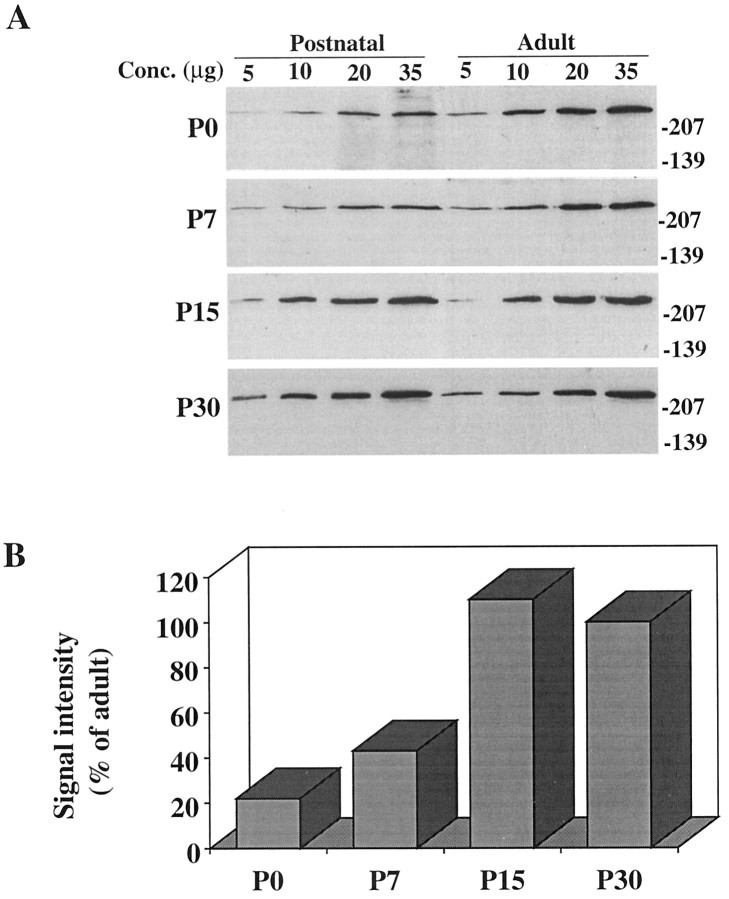
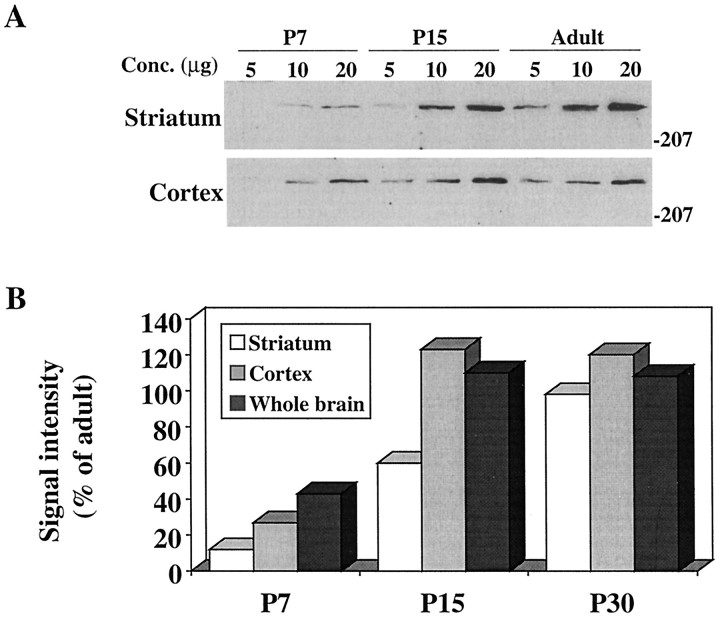
Recent studies in human and rat brain (Aronin et al., 1995;Gutekunst et al., 1995; Sharp et al., 1995; Trottier et al., 1995) show a widespread distribution of huntingtin. To establish that expression was similar in the adult mouse brain, protein extracts from different brain areas were assayed with an antibody directed to the N-terminal (Ab1) of the protein. Huntingtin was detected as a single high molecular weight band of ∼320 kDa in all regions examined (cortex, striatum, brainstem, and cerebellum), and as in human brain (Aronin et al., 1995), it also was detected readily in isolated subcortical white matter (Fig. 1A). Analysis of whole-brain protein extracts from E10–E17 and P0–P30 mice demonstrated that huntingtin was expressed at all stages of brain development (Fig. 1B). To evaluate quantitatively huntingtin expression in the postnatal mouse, we compared protein extracts from P0, P7, P15, and P30 and adult mouse brain. Results showed that huntingtin levels rose from ∼20% of adult levels at P0 to slightly >100% of adult levels at P15 (Fig.2A,B). The most marked rise (∼60%) occurred between P7 and P15. No significant change in huntingtin expression from adult levels was seen between P15 and P30 in whole-brain extracts. To determine whether huntingtin increased in the cortex and striatum in parallel with total brain protein, these regions were analyzed separately. Similar to those in whole brain, huntingtin levels in the cortex increased between P7 and P15 and reached adult levels by P15; in the striatum, huntingtin levels also rose significantly (∼50%) during the second postnatal week, but in contrast to the cortex, reached 60% of adult levels by P15 and adult levels by P30 (Fig. 3A,B).
Fig. 1.
Western blot analysis of huntingtin in adult and developing mouse brain. A, Protein extracts (15 μg/lane) from different areas of the adult mouse brain show that all regions express the huntingtin protein. F ctx, Cortex;WM, subcortical white matter; Cd/put, caudate/putamen; Brnst, brainstem; CBL, cerebellum. B, Protein extracts from whole brain at E10–E17 (Embryonic) and P0–P30 (Postnatal) show the presence of huntingtin at all stages of brain development. The lower molecular weight band that appears in lanes for E15 and E17 may be a degraded product of huntingtin proteolysis. Molecular weight markers are shown on the left.
Fig. 2.
Comparison of huntingtin expression in whole-brain extracts of the postnatal and adult mouse. A, Each Western blot compares huntingtin immunoreactivity in a P0–P30 (Postnatal) and an adult animal. Different adult mice were used in each blot. Note the lower signal intensity at each protein concentration in the P0 and P7 animals relative to the adults.B, Signal intensity of huntingtin immunoreactivity in postnatal animals relative to adult. Each bar represents the median score of all ratio values obtained in comparisons of four young animals with four adult animals. Huntingtin immunoreactivity increases between P0 and P15 and shows the most marked rise between P7 and P15. P0 and P7 less than adult at p < 0.001. Molecular weight markers are shown on the right.
Fig. 3.
Comparison of huntingtin expression in the postnatal cortex and striatum. A, Western blots of striatum (top panel) and cortex (bottom panel) from P7, P15, and adult mice. Note that signal intensity is significantly lower at P7 than in the adult brain in both regions. B, Signal intensity (median score of ratio values for each protein concentration) for huntingtin expression in P7, P15, and P30 striatum, cortex, and whole brain relative to the adult. Note that huntingtin expression increases markedly between P7 and P15 in both the striatum and the cortex in parallel with the increases seen in whole brain. Huntingtin expression reaches adult levels in cortex by P15 and in striatum by P30. Mann–Whitney nonparametric analysis: P7 cortex less than adult cortex at p < 0.01. P7 and P15 striatum less than adult striatum at p < 0.01. Molecular weight markers are shown on the right.
Immunohistochemistry
Immunohistochemical analysis of huntingtin in the adult mouse brain showed labeling of the entire gray matter (Fig.4a). Neuronal labeling occurred in all regions, including the cortex (Figs. 4b,5a), basal forebrain, hippocampus, brainstem, thalamus, and cerebellum (Fig. 5b–h). The intensity of immunoreactivity varied considerably in different neuronal populations and within the same cell population. In the cortex, intensely labeled neurons could be found throughout all cortical lamina, and similar neurons large and small within the same lamina had marked heterogeneous expression of huntingtin. In the cerebellar cortex, Purkinje cells showed intense staining, whereas granule cells, Golgi II cells, and basket cells were labeled minimally (Fig. 5h). In well stained neurons, secondary and tertiary dendritic branches were also labeled. In the striatum, large neurons were more immunoreactive than the medium-sized striatal neurons (see Fig. 11d). A patch-matrix pattern was not evident with huntingtin in the mouse striatum.
Fig. 5.
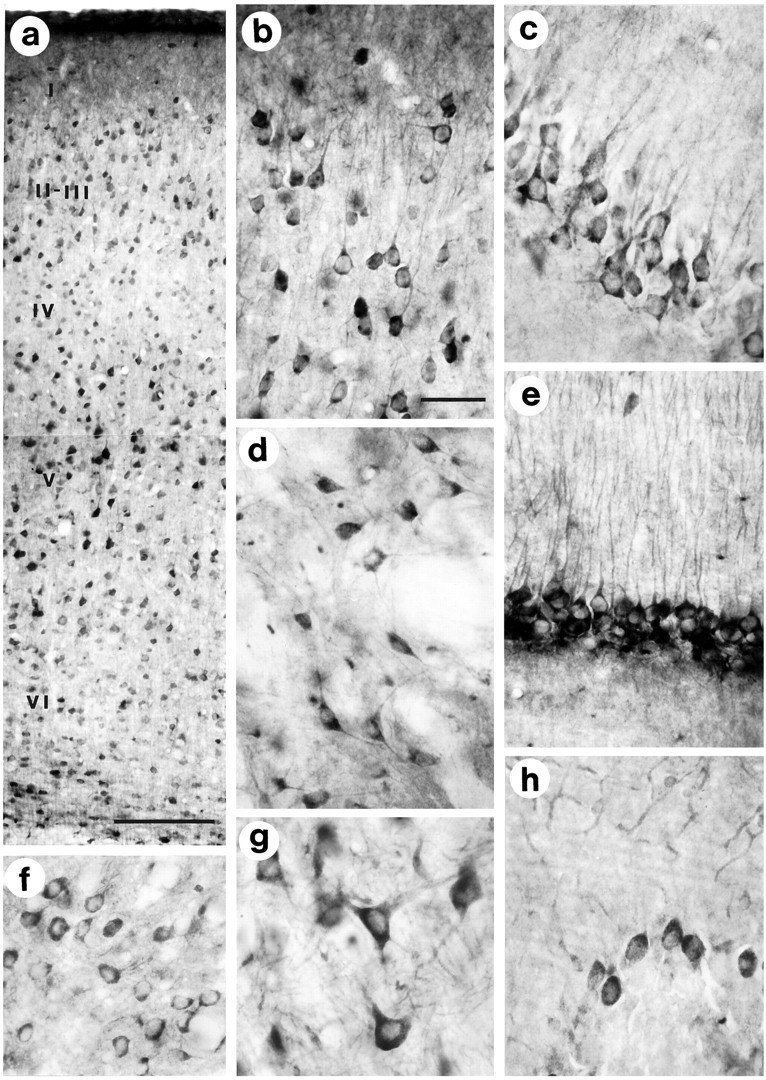
Huntingtin immunoreactivity in the adult mouse brain is localized to the cytoplasm of neurons. Neuronal perikarya and dendrites are labeled in all regions of the brain.a, b, The cerebral cortex: neurons throughout layers II–VI are labeled, and the perikarya and proximal dendrites of layer II/III (shown in b) and layer V pyramidal neurons show especially strong immunoreactivity. c, e, The hippocampal region: pyramidal cells in the CA1 region (c) and perikarya and dendrites of granule cells in the dentate gyrus (e) are strongly immunoreactive. A similar pattern of immunoreactivity of neuronal perikarya and dendrites is present in the thalamus (f), globus pallidus (d), brainstem (g), and cerebellar Purkinje cell layer (h). In the cerebellum cortex, Purkinje cells are stained more prominently than other neurons. All photographs were taken from the same vibratome-cut tissue section. Scale bars: a, 100 μm; b (for b–h), 50 μm.
Fig. 11.
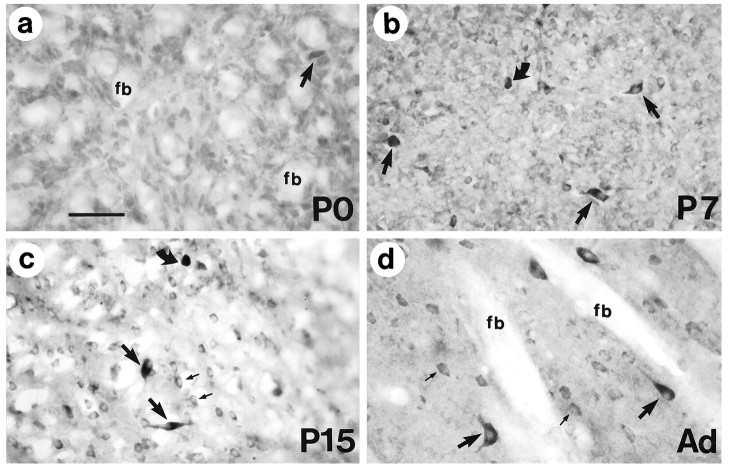
Ontogeny of huntingtin immunoreactivity in the mouse corpus striatum. a, On the day of birth (P0), immunoreactivity in the striatum is uniformly weak, and fiber bundles (fb) appear unlabeled. A few large cells are slightly more labeled (arrow).b, By P7, the labeling of most cell bodies is more distinct than at P0 (compare a withb). The cell bodies and proximal processes of some large cells (arrows) and small cells (curved arrow) become intensely immunoreactive. c, A pattern of heterogeneous immunoreactivity, wherein large cells (arrows) show intense immunoreactivity of the perikarya and proximal processes and smaller cells are less intensely immunoreactive (small arrows), is seen on P15. Note that some of the cells with intense staining have not reached a large size (curved arrow). d, Adult striatum (Ad) shows the marked difference in expression of huntingtin in medium (small arrows) and large neurons (large arrows). Primary antibody was diluted fourfold compared with sections shown ina–c. Fiber bundles (fb) are unlabeled because of the low concentration of the primary antibody used in the immunohistochemistry. Scale bar: a, 50 μm, and applies tob–d.
To assess further the extent of neuronal labeling and the degree of heterogeneity in labeling, regions of the cortex (Fig.6A–D) and striatum (Fig.7A,B) were examined with Nomarski interference microscopy (Figs. 6, 7). Analysis of the focal planes at the upper and lower surfaces in the same microscopic field revealed the great extent of neuronal labeling in each focal plane and even more so when labeled cells from both surfaces were taken into account. The striking variability in neuronal staining was also evident, particularly in the cortical neurons (Fig. 6a, cells 1, 2, and 3). Some of the large pyramidal cells were among those with the strongest labeling. When the surface of the section was compared with a plane of focus deeper into the section (Fig. 6, c andd, respectively), some faintly labeled and unlabeled neurons appeared in the intermediate focal plane. This suggested that the presence of some unlabeled neurons may be attributable to poor penetration of the antisera deeper into the section. Given the variable staining of huntingtin in neurons, the extent of neuronal labeling cannot be known with certainty; however, the great extent of neuronal staining observed with Nomarksi imaging at the surfaces of the section suggest that the vast majority of neurons is labeled.
Fig. 6.
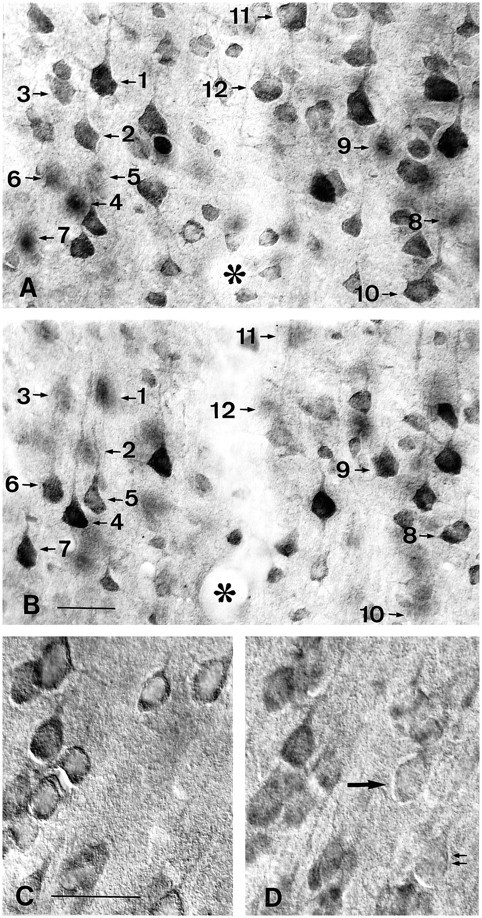
Demonstration of the extent and variability of huntingtin staining in adult cortical neurons with Nomarski imaging.a, b, The same cortical field photographed at the surfaces of the upper and lower focal planes of the section. Note that different neurons are labeled in each focal plane. For example, neurons 1–3 and 10–12 are visible in a but not in b, and neurons 4–6 and 8 and 9 are visible in b but not in a. Staining is also variable in neurons within the focal plane (compare1, 2, and 3 in a and4 and 5 in b). c, d, The same field photographed at the upper surface in c and deeper in the section (d) to show the effect of antibody penetration on neuronal labeling. Note that in the superficial plane (c) all cells are immunoreactive, whereas in the intermediate focal plane faintly labeled (single arrow) and unlabeled (double arrow) cells are seen. Asteriskidentifies the lumen of a capillary passing through the center of the field. Scale bars: b, 50 μm, and also applies toa; c, 50 μm, and also applies tod.
Fig. 7.
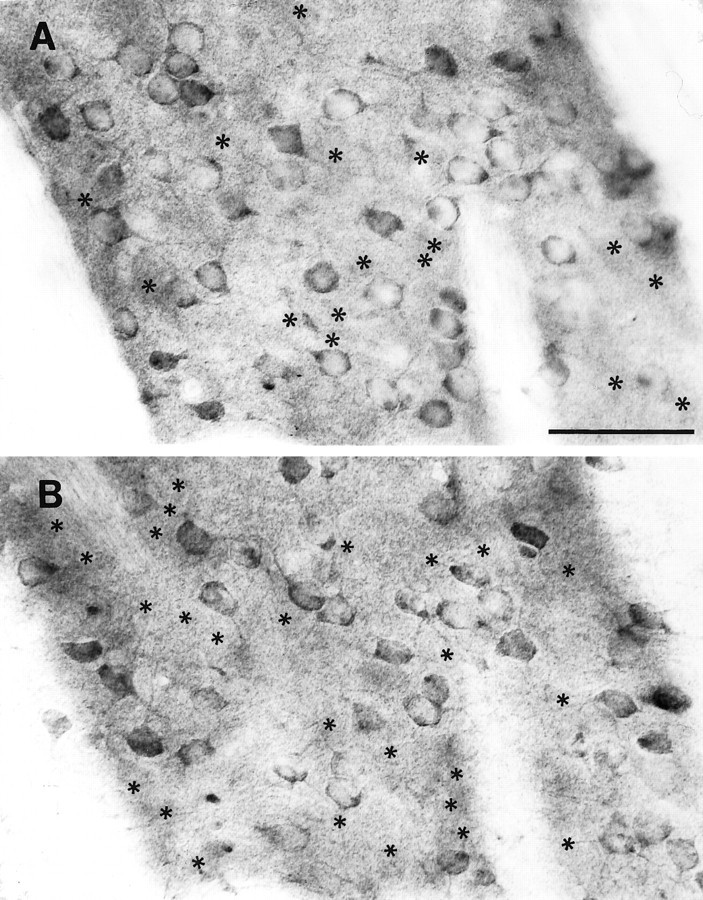
Demonstration of the extent of huntingtin labeling in medium-sized striatal neurons of the adult mouse.A, B, The upper and lower focal planes of the same field. Asterisks in A identify the position of labeled neurons seen only in B, and asterisksin B identify the position of labeled neurons seen only inA. Not all cells are identified. Many more neurons are labeled when both planes of section are taken into account. The intensity of staining is also variable. Scale bar (shown inA): 50 μm, also applies to B.
Axon fibers in regions of the fimbria fornix, internal capsule (Fig.8a), cerebral peduncle, brainstem, and cerebellar peduncles (Fig. 8b) were labeled moderately with low antibody concentrations and labeled more prominently when concentrations of the primary antisera were increased two- to fourfold. Immunoreactive axon terminals were not detected in mouse brain using our standard protocol (see Materials and Methods). When 10 μm frozen sections were fixed by immersion in 4% paraformaldehyde and pretreated with 10% methanol before the blocking step, however, punctate labeling characteristic of axon terminals was visible in some regions and was particularly strong in the thalamus (Fig. 8c) and hypothalamus. The somatodendritic staining in neurons remained the predominant location of huntingtin immunoreactivity in most brain areas, including the striatum.
Fig. 8.
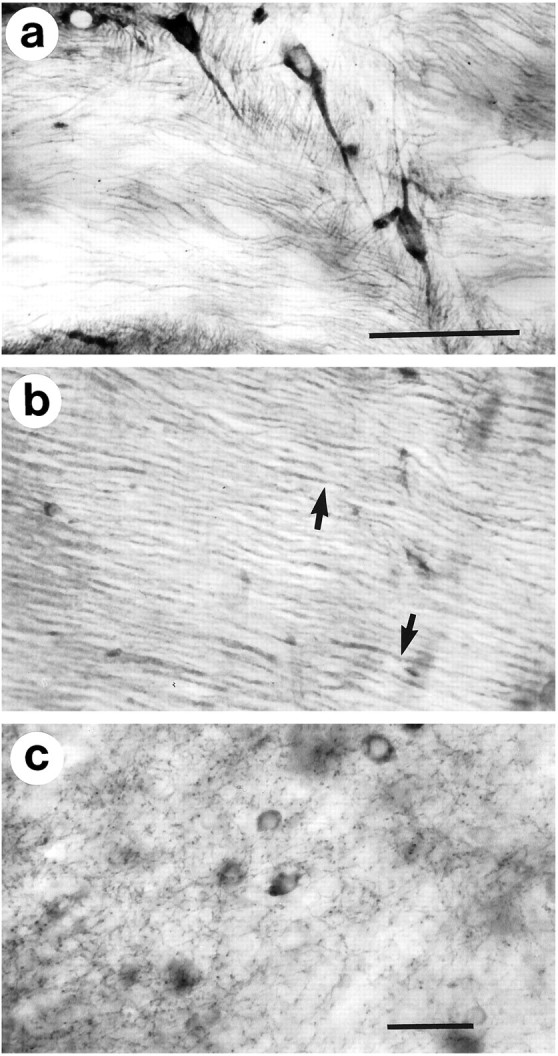
Huntingtin immunoreactivity in axon trunks and terminals in the adult mouse brain. Axon trunks are labeled in the internal capsule (a) and the cerebellar peduncle (b). Individual axons can be distinguished in the cerebellar peduncle (arrows in b). Immunoreactive puncta interpreted to be axon terminals appear in the thalamus when minimally fixed frozen sections are pretreated with methanol (see Materials and Methods). c, Neuronal cell bodies are also labeled. Scale bars: a, 50 μm, and applies to b; c, 50 μm.
Immunohistochemical staining in the developing brain usually required higher concentrations of primary antisera than in the adult brain. In the E12–E15 mouse brain, homogeneous reaction product appeared within the cytoplasm of cell bodies throughout the brain. For the most part, neuronal processes were not labeled. Postmitotic neurons of the E15 basal forebrain, probably belonging to cholinergic cell groups, were among the first to show a marked increase in immunoreactivity (Fig.9a) relative to most neurons. The huntingtin-enriched somata varied in size and were similar or slightly larger than the surrounding, more modestly labeled cells. Postmitotic neurons in the ventral brainstem exhibited an elevation in huntingtin immunoreactivity at E17 (Fig. 9b,c). Most of these huntingtin-positive neurons had completed their migration to motor nuclear groups. By P1, the huntingtin-immunoreactive brainstem motor neurons were organized into well defined nuclei (Fig. 9d) and showed some staining in their emerging processes (Fig.9e). Heterogeneity in huntingtin expression in the cortex was apparent at P0–P1, as pyramidal neurons in the neocortex (Fig.10a–c) and more strikingly in the pyriform cortex (Fig. 10d,g) (layer 2) exhibited increased huntingtin immunoreactivity in cell bodies and proximal dendrites. By P7, huntingtin in the cortex was distributed to neurons in all layers (Fig. 10e,f) but was still largely confined to neuronal somata and the proximal portions of apical dendrites.
Fig. 9.
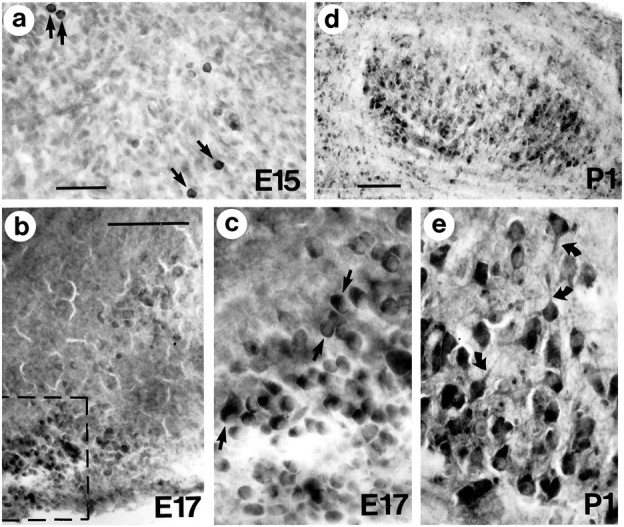
Huntingtin immunoreactivity in embryonic and early postnatal mouse brain. a, By E15, the perikarya of some basal forebrain neurons acquire intense immunoreactivity (arrows in a). Note that cells of comparable or smaller size located near the intensely labeled cells are still weakly immunoreactive. b, Clusters of brainstem neurons show increased labeling in E17 mouse brain. c, Enlargement of framed area in b. Note the intense staining of the cytoplasm (arrows) but the absence of labeling in processes.d, By P1, huntingtin-positive neurons contribute to the segregated clusters of brainstem nuclei. e, Brainstem neurons at higher magnification show robust labeling in perikarya and emerging processes (curved arrows). Scale bars:a, 50 μm, and applies to c and e;b, 100 μm; d, 200 μm.
Fig. 10.
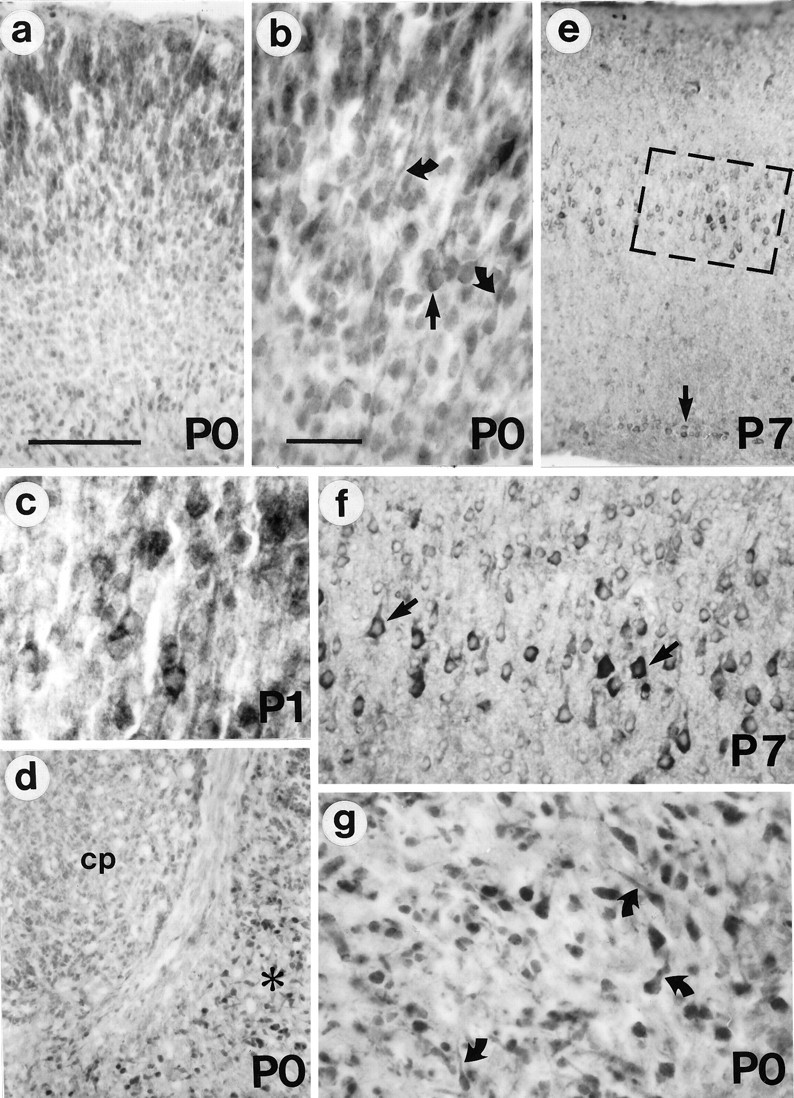
Huntingtin immunoreactivity in neonatal mouse brain. a, By P0, the cerebral cortex exhibits immunoreactivity in all neurons. b, In the upper cortical layers, the somata (arrow) and leading processes of some of the labeled cells show the characteristic morphology of migrating neurons (curved arrows). c, P1 pyramidal neurons become more intensely labeled than other cortical cells. d, Some cells in the P0 pyriform cortex (asterisk) are intensely stained, but the caudate/putamen (cp) is stained more weakly. e, f, In the P7 cortex, the labeling of layer V pyramidal neurons is striking (boxed area is enlarged inf). At this age, some layer VI neurons are also intensely labeled (arrow in e). g, P0 pyriform cortex. Note the increased staining in pyramidal somata and emerging processes (curved arrows). Scale bars:a, 100 μm, and also applies to d ande; b, 50 μm, and also applies to c,f, g.
In contrast to the increased staining that appeared in some neurons of the brainstem, basal forebrain, and cortex, the striatum at P0 (Fig.11a) was stained homogeneously except for an occasional cell with slightly more immunoreactivity. This pattern was markedly changed at P7 (Fig. 11b), when a subset of intensely labeled cells of small to medium size appeared throughout the striatum. By P15 (Fig. 11c), some of the heavily labeled striatal cells had taken on the larger globular morphology characteristic of cholinergic neurons in the adult striatum (Fig.11d).
Expression of normal and mutant huntingtin in developing human brain
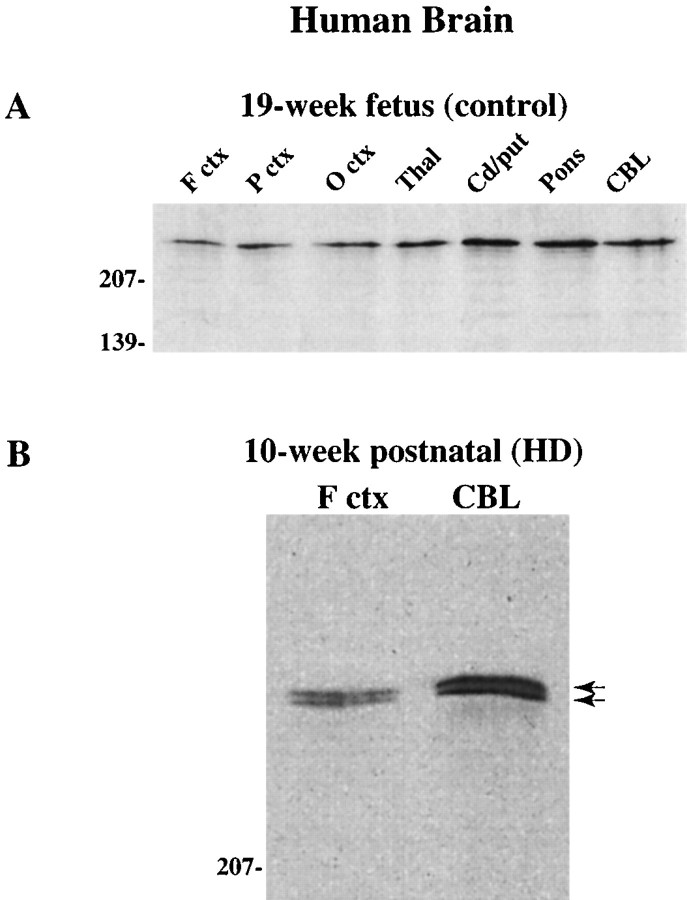
Huntingtin was examined by Western blot in human fetal control brains of 19 and 21 weeks with antisera Ab1 (Fig.12A shows results for the 19-week fetal brain). Immunoblot analysis of frontal cortex, parietal cortex, occipital cortex, thalamus, caudate/putamen, pons, and cerebellum revealed huntingtin expression in all regions in both control cases. Examination of the cortex and cerebellum of a 10-week-old HD gene carrier was also performed. In both regions, a higher molecular mass mutant protein equivalent in signal intensity to the normal protein was seen (Fig. 12B), indicating that an abnormal huntingtin protein is expressed during brain development.
Fig. 12.
Huntingtin expression in human control and HD brain. A, Western blot of 19-week fetal human control brain probed with Ab1 shows expression in all brain regions. For identification of regions, see legend to Figure 1. B, Brain of 10-week-old infant genotyped for a normal allele of 17 CAG repeats and an expanded HD allele of 39 repeats. Note that normal and mutant huntingtin (arrows) are detected in the cortex and cerebellum of this patient.
DISCUSSION
The results of this study show that the expression of huntingtin occurs early and throughout brain development, increases in parallel with the maturation of neurons in the postnatal period, and is regulated developmentally. The ubiquitous distribution of huntingtin in the somatic cytoplasm of developing mouse brain neurons suggests that the protein has a constitutive role important for neuron survival. Huntingtin is also present throughout the human 19- to 21-week fetal brain, a finding consistent with previous evidence for the expression of IT15 mRNA by in situ hybridization throughout the midgestation human fetal brain (Dure et al., 1994). Most significantly, our observation that mutant huntingtin is expressed at levels comparable to those of the wild-type protein in the HD infant cortex and cerebellum indicates that there is a potential for the abnormal protein to influence neuronal development.
Huntingtin expression develops in parallel with neuronal maturation
Two features of huntingtin expression in the developing brain correlate with neuronal maturation. First, huntingtin immunoreactivity is distributed throughout the dendrites and axons of adult mouse brain neurons, whereas it is confined primarily to neuronal somata in immature neurons. Second, huntingtin expression in the whole brain increases markedly between P7 and P15, during which it rises from ∼40% to 100% of adult levels. By this time, neurogenesis is complete in most brain areas, axonal elaborations are being pruned, and dendrites, spines, and synapses are forming (Jacobson, 1991). The slower rise of huntingtin expression in striatum compared with that in cortex in the postnatal mouse may reflect a delayed maturation of striatal neurons compared with cortical neurons.
Huntingtin immunoreactive axons were seen in adult brain but not in developing brain. This result suggests that huntingtin is not involved specifically in developmental events associated with axon elongation and migration. Western blot analysis demonstrates the presence of huntingtin in white matter regions of the adult mouse (this study) and human (Aronin et al., 1995) brain. The emergence of huntingtin expression in the axons of mature neurons is relevant to HD pathogenesis. Projection neurons in both the cortex (Cudkowicz and Kowall, 1990; Hedreen et al., 1991; Sotrel et al., 1991) and the striatum (Graveland et al., 1985; Ferrante et al., 1985) are more affected than interneurons in the disease (see below). A reduction in subcortical white matter contributes significantly to brain atrophy in HD (De La Monte et al., 1988) and is consistent with the loss of projection cells. Moreover, specific changes in striatal projection pathways have been observed in the HD brain (Reiner et al., 1988; Sapp et al., 1995). A recently proposed role for huntingtin in vesicle trafficking has been suggested on the basis of biochemical evidence for the codistribution of huntingtin with other vesicle-associated proteins in membrane-enriched synaptosomal fractions and immunohistochemical observations that show an association of huntingtin with vesicles (DiFiglia et al., 1995; Gutekunst et al., 1995; Sharp et al., 1995). The prominent expression of huntingtin in cell bodies and dendrites, where it is associated with vesicles and microtubules (DiFiglia et al., 1995; Gutenkunst et al., 1995), suggests that the protein may also participate in vesicle recycling in somatodendritic regions. One important vesicle-related function for huntingtin in dendrites might involve ligand-receptor internalization through the endocytic pathway (Faure et al., 1995). The developmental and adult expression of huntingtin in neurons has features strikingly similar to those of dynamin, a vesicle-associated GTPase involved in endocytosis (Damke et al., 1994; McPherson et al., 1994). Similar to huntingtin, dynamin is widespread and more abundant in adult than in developing brain (Nakata et al., 1991; Faire et al., 1992; Noda et al., 1993). Dynamin also increases markedly in the postnatal period of the rat between P9 and P23 (Nakata et al., 1991; Faire et al., 1992). This time period overlaps that in mouse when huntingtin exhibits a sharp rise in expression.
Heterogeneity in the neuronal expression of huntingtin is regulated developmentally
Huntingtin immunoreactivity was detected at variable levels of intensity in adult mouse brain neurons. A similar observation was made in the normal human brain, where large neurons are labeled more intensely than small neurons (Gutekunst et al., 1995). Heterogeneity in the neuronal expression of huntingtin is consistent with observations of IT15 (the gene for huntingtin) mRNA localization by Landwehrmeyer et al. (1995). In the latter study, variability was found in the density of silver grains over individual neurons in different brain regions, with large neurons showing the highest grain counts. Even when corrected for cell size, large neurons in some regions (substantia nigra and globus pallidus) had significantly more silver grains per unit area than other cells. Our results in young animals show that heterogeneity in the neuronal expression of huntingtin emerges in the embryonic period. The appearance of this feature follows a caudal to rostral and ventral to dorsal gradient for neurogenesis and neuronal maturation (Bayer and Altman, 1987; Jacobson, 1991). Thus, brainstem and basal forebrain neurons are the first to show increased levels of huntingtin (E15–E17), whereas levels in cortical and striatal cells rise later (P0–P7). This timetable suggests that an important factor regulating the increased expression of huntingtin may relate to the formation of target connections during and after the completion of neuronal migration. Neuron type appears to be unrelated to the rise in huntingtin, because both projection cells (cortical pyramidal cells, basal forebrain neurons, and brainstem motor neurons) and interneurons (large aspiny striatal cells) exhibited increases. Also, neurons with increased labeling usually had not reached their adult somatic size, suggesting that cell body diameter alone was not responsible for the rise in huntingtin expression. The birthdate of neurons may also have little to do with increased huntingtin expression. Large striatal interneurons become postmitotic during a restricted period early in neurogenesis (rat, E13–E16) (Bayer, 1984; Semba et al., 1988), but show a relatively late rise in huntingtin expression around P7.
The expression of huntingtin in relation to striatal development
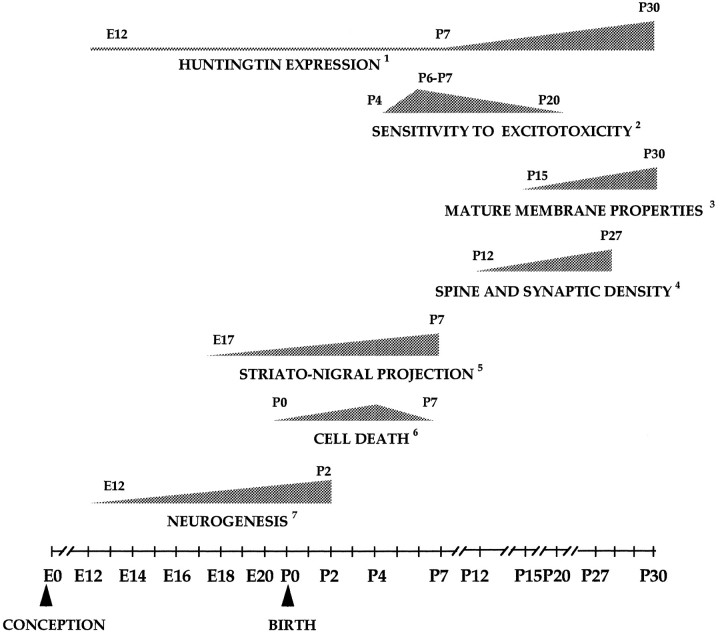
Between P7 and P15, huntingtin expression increases significantly in the striatum and the cortex. Adult levels of the protein are reached in the cortex by P15. In the striatum, huntingtin rises more slowly and achieves adult protein levels by P30. This is a period of active neuronal differentiation in both regions and includes the development of spines, the formation of synapses, and the maturation of cortical-striatal connections. As shown in Figure 13, the postnatal increase in huntingtin overlaps with a number of important maturational events in the striatum. Spine density increases significantly between P11 and P27 and most markedly in the third postnatal week (Tepper and Trent, 1993). Also during this period, the electrophysiological properties of striatal cells undergo maturation. These electrophysiological changes coincide with the maturation of cortical and thalamic inputs to the striatum (Tepper and Trent, 1993).
Fig. 13.
Temporal relationship between huntingtin expression and other developmental events in the rodent corpus striatum between embryonic day 0 (E0, the day of conception) and postnatal day 30 (P30). The temporal progression of a given event is depicted by the stippled triangular icons. For each icon, the days of onset and completion of the particular event are indicated. The slope of an icon is an approximation and not an accurate representation of the rate of progression of the corresponding event. Where possible, the peak incidence of a given event is also indicated.1The depiction of increasing huntingtin expression in the postnatal striatum is based on observations in this study obtained from Western blots and immunohistochemistry in mice. All other data are from studies on rats and were obtained from the following sources:2MacDonald et al., 1988; Ikonomidou et al., 1989; Trescher et al., 1994; 3Tepper and Trent, 1993; 4Tepper and Trent, 1993;5Fishell and Van der Kooy, 1987, 1991;6Fentress et al., 1981; Fishell and Van der Kooy, 1991; 7Bayer, 1984; Van der Kooy and Fishell, 1986; Bayer and Altman, 1987; Fishell and Van der Kooy, 1991.
Huntingtin expression in the postnatal brain in relation to HD pathogenesis
Views vary on when cell death begins in the HD striatum in relation to the onset of symptoms. Most evidence suggests that neurons begin to degenerate in significant numbers in the years just before the onset of symptoms in midlife (for review, see Wexler et al., 1991). Neurons in the striatum and cortex, which are the most affected in HD, show compensatory responses such as the growth of dendrites and spines and increased levels of calcium-binding protein (Graveland et al., 1985; Ferrante et al., 1991; Sotrel et al., 1991, 1993; Huang et al., 1995). These compensatory responses may be sufficient to maintain neuronal function and thus delay the onset of symptoms until other events occur that precipitate cell death. One widely held view is that the normal decline in energy metabolism that comes with increasing age reduces the threshold of sensitivity to excitotoxic injury below a critical level in affected neurons of the HD brain, leading to their ultimate demise (Beal et al., 1993; Coyle and Puttfarcken, 1993). The loss of neurons (as much as 50% in medial and dorsal striatum) and the increased numbers of oligodendroglia present in low grade and presymptomatic cases have lent support to the idea that abnormalities in the HD brain may derive from changes during development (Myers et al., 1991). An effect of the HD mutation on striatal development has been suspected because of the striking gradient of pathogenesis, which suggests a greater vulnerability of striatal projection neurons that mature later in development (Vonsattel et al., 1985). The presence of mutant huntingtin in the postnatal HD brain gives support to the idea that the maturation of striatal neurons might be affected in HD. Mutant huntingtin is comparable in expression to wild-type huntingtin in both the postnatal (this study) and adult HD brain (Aronin et al., 1995), suggesting that the expression of normal and mutant proteins is regulated similarly throughout neuronal development and maturation.
Neurodegeneration in HD has been strongly linked to an excitotoxic mechanism mediated through NMDA receptors, either directly or as a secondary event associated with altered metabolism (DiFiglia, 1990; Beal et al., 1991, 1993; Albin and Greenmayre, 1992). How might the expression of mutant huntingtin influence the fate of differentiating striatal cells and lead to an excitotoxic process? Striatal cells in the postnatal period are significantly more susceptible to NMDA receptor-induced excitotoxicity and hypoxic–ischemic injury (MacDonald et al., 1988; Ikonomidou et al., 1989; Trescher et al., 1994) than in the adult. The period of hypersensitivity to NMDA receptors extends from approximately P2 to P21, with a maximal response at P6–P7 (Ikonomidou et al., 1989;Trescher et al., 1994). A marked rise in mutant huntingtin during the postnatal period may interfere with striatal cell differentiation, the formation of normal corticostriatal connections, and the maturation of striatal cell physiology, particularly in relation to the function of NMDA receptors (see above). Such changes might raise the energy demands of striatal neurons sufficiently to reach a toxic threshold in some neurons, particularly striatal projection neurons maturing late in development. For other neurons surviving the initial stress, the decline in energy metabolism with age might reduce the threshold of sensitivity to glutamate resulting in the delayed effects on cell survival.
The greater expression of huntingtin in large neurons of the mouse striatum is particularly noteworthy, because the large cholinergic neurons are relatively spared in HD (Ferrante et al., 1987). The robust staining of large striatal neurons has also been seen in the human striatum (Gutekunst et al., 1995; E. Sapp and M. DiFiglia, unpublished observations). Although both medium and large neurons are responsive to excitatory stimulation, large cells differ from medium-sized cells in that they have few if any cortical connections and receive excitatory inputs primarily from the thalamus (Lapper and Bolam, 1992). Decortication is known to reduce the neuronal damage produced by excitotoxic agents on the adult striatum (Beal et al., 1991). The lack of cortical innervation might be a factor in mitigating the adverse effects of the mutant protein in large neurons of the HD striatum.
Summary
The mechanism and timetable of cell death in Huntington’s disease is unknown. A genetic mutation involving the expansion of a polyglutamine region in the huntingtin gene causes widespread expression of a mutant protein in the HD brain. Our results show that the mutant protein is expressed in the developing HD brain. The neuronal distribution and expression of mutant huntingtin during embryonic and postnatal development most likely parallels that seen for huntingtin in the developing mouse brain. The marked rise in huntingtin postnatally and the more extensive distribution of the protein in mature neurons suggest that huntingtin is important in neuronal differentiation and in the function of adult brain neurons. In the HD brain, mutant huntingtin may interfere with the normal maturation of striatal neurons at a time when they are more sensitive to excitotoxic injury, and this could lead to immediate or delayed effects on cell survival.
Footnotes
This work was supported by National Institutes of Health Grants NS16367 and NS 31579 to M.D. and NS32657 to P.G.B.
Correspondence should be addressed to Dr. Marian DiFiglia, Laboratory of Cellular Neurobiology, Massachusetts General Hospital, 149 13th Street, 6th Floor, Charlestown, MA 02129.
REFERENCES
- 1.Albin R, Greenmayre JT. Alternative excitotoxic hypotheses. Neurology. 1992;42:733–738. doi: 10.1212/wnl.42.4.733. [DOI] [PubMed] [Google Scholar]
- 2.Albin RL, Reiner A, Anderson KD, Dure LS, IV, Handelin B, Balfour R, Whetsell WO, Jr, Penney JB, Young AB. Preferential loss of striato-external pallidal projection neurons in presymptomatic Huntington’s disease. Ann Neurol. 1992;31:425–430. doi: 10.1002/ana.410310412. [DOI] [PubMed] [Google Scholar]
- 3.Andrew SE, Goldberg YP, Kremer B, Telenius H, Theilmann J, Adam S, Starr E, Squitieri F, Lin B, Kalchman MA, Graham RK, Hayden MR. The relationship between trinucleotide (CAG) repeat length and clinical features of Huntington’s disease. Nature Genet. 1993;4:398–403. doi: 10.1038/ng0893-398. [DOI] [PubMed] [Google Scholar]
- 4.Aronin N, Chase K, Christine Y, Sapp E, Schwarz C, Matta N, Kornreich R, Landwehrmeyer B, Bird E, Beal MF, Vonsattel JP, Smith T, Carraway R, Boyce FM, Young AB, Penney JB, DiFiglia M. CAG expansion affects the expression of mutant huntingtin in the Huntington’s disease brain. Neuron. 1995;15:1193–1201. doi: 10.1016/0896-6273(95)90106-x. [DOI] [PubMed] [Google Scholar]
- 5.Bayer SA. Neurogenesis in the rat neostriatum. Int J Dev Neurosci. 1984;2:163–175. doi: 10.1016/0736-5748(84)90008-X. [DOI] [PubMed] [Google Scholar]
- 6.Bayer SA, Altman J. Directions in neurogenetic gradients and patterns of anatomical connections in the telencephalon. Prog Neurobiol. 1987;29:57–106. doi: 10.1016/0301-0082(87)90015-3. [DOI] [PubMed] [Google Scholar]
- 7.Beal MF, Swartz KJ, Hyman BT, Storey E, Finn SF, Koroshetz W. Aminooxyacetic acid results in excitotoxin lesions by a novel indirect mechanism. J Neurochem. 1991;57:1068–1073. doi: 10.1111/j.1471-4159.1991.tb08258.x. [DOI] [PubMed] [Google Scholar]
- 8.Beal MF, Hyman BT, Koroshetz W. Do defects in mitochondrial energy metabolism underlie the pathology of neurodegenerative diseases? Trends Neurosci. 1993;16:125–131. doi: 10.1016/0166-2236(93)90117-5. [DOI] [PubMed] [Google Scholar]
- 9.Coyle JT, Puttfarcken P. Oxidative stress, glutamate, and neurodegenerative disorders. Science. 1993;262:689–695. doi: 10.1126/science.7901908. [DOI] [PubMed] [Google Scholar]
- 10.Cudkowicz M, Kowall NS. Degeneration of pyramidal projection neurons in Huntington’s disease cortex. Ann Neurol. 1990;27:200–204. doi: 10.1002/ana.410270217. [DOI] [PubMed] [Google Scholar]
- 11.Damke H, Baba T, Warnock DE, Schmid SL. Induction of mutant dynamin specifically blocks endocytic coated vesicle formation. J Cell Biol. 1994;127:915–934. doi: 10.1083/jcb.127.4.915. [DOI] [PMC free article] [PubMed] [Google Scholar]
- 12.De La Monte SM, Vonsattel J-P, Richardson EP., Jr Morphometric demonstration of atrophic changes in the cerebral cortex, white matter, and neostriatum in Huntington’s disease. J Neuropathol Exp Neurol. 1988;47:516–525. doi: 10.1097/00005072-198809000-00003. [DOI] [PubMed] [Google Scholar]
- 13.DiFiglia M. Excitotoxicity model of Huntington’s disease. Trends Neurosci. 1990;13:286–289. doi: 10.1016/0166-2236(90)90111-m. [DOI] [PubMed] [Google Scholar]
- 14.DiFiglia M, Sapp E, Chase K, Schwarz C, Meloni A, Young C, Martin E, Vonsattel J-P, Carraway R, Boyce FM, Aronin N. Huntingtin is a cytoplasmic protein associated with vesicles in human and rat brain neurons. Neuron. 1995;14:1075–1081. doi: 10.1016/0896-6273(95)90346-1. [DOI] [PubMed] [Google Scholar]
- 15.Dure LS, IV, Landwehrmeyer BG, Golden J, McNeil SM, Ge P, Aizawa H, Huang Q, Ambrose CM, Duyao MP, Bird ED, DiFiglia M, Gusella JF, MacDonald ME, Penney JB, Young AB, Vonsattel J-P. IT15 gene expression in fetal human brain. Brain Res. 1994;659:33–41. doi: 10.1016/0006-8993(94)90860-5. [DOI] [PubMed] [Google Scholar]
- 16.Duyao M, Ambrose C, Myers R, Novelletto A, Persichetti F, Frontali M, Ross C, Franz M, Abbott M, Gray J, Conneally P, Young A, Penney J, Hollingsworth Z, Shoulson I, Lazzarini A, Falek A, Koroahetz W, Sax D, Bird E, Vonsottel J, Bonilla E, Alvir J, Bickham Conde J, Cha J-H, Dure L, Gomez F, Ramos M, Sachez-Ramos J, Snodgrass S, de Young M, Wexler N, Moscowitz C, Penchaszadeh G, MacFarlane H, Anderson M, Jenkins B, Srinidhi J, Barnes G, Gusella J, MacDonald M. Trinucleotide repeat length instability and age of onset in Huntington’s disease. Nature Genet. 1993;4:387–392. doi: 10.1038/ng0893-387. [DOI] [PubMed] [Google Scholar]
- 17.Duyao MP, Auerbach AB, Ryan A, Persichetti F, Barnes FT, McNeill SM, Ge P, Vonsattel JP, Gusella JF, Joyner AL, MacDonald ME. Inactivation of the mouse Huntington’s disease gene homolog Hdh . Science. 1995;269:407–409. doi: 10.1126/science.7618107. [DOI] [PubMed] [Google Scholar]
- 18.Faire K, Trent F, Tepper JM, Bonder EM. Analysis of dynamin isoforms in mammalian brain: dynamin-1 expression is spatially and temporally regulated during postnatal development. Proc Natl Acad Sci USA. 1992;89:8376–8380. doi: 10.1073/pnas.89.17.8376. [DOI] [PMC free article] [PubMed] [Google Scholar]
- 19.Faure M-P, Alonso A, Nouel D, Gaudriault G, Dennis M, Vincent J-P, Beaudet A. Somatodendritic internalization and perinuclear targeting of neurotensin in the mammalian brain. J Neurosci. 1995;15:4140–4147. doi: 10.1523/JNEUROSCI.15-06-04140.1995. [DOI] [PMC free article] [PubMed] [Google Scholar]
- 20.Fentress JC, Stanfield BB, Cowan WM. Observations on the development of the striatum in mice and rats. Anat Embryol. 1981;163:275–298. doi: 10.1007/BF00315705. [DOI] [PubMed] [Google Scholar]
- 21.Ferrante RJ, Kowall NW, Beal MF, Richardson EP, Jr, Bird ED, Martin JB. Selective sparing of a class of striatal neurons in Huntington’s disease. Science. 1985;230:561–563. doi: 10.1126/science.2931802. [DOI] [PubMed] [Google Scholar]
- 22.Ferrante RJ, Kowall NW, Beal MF, Martin JB, Bird ED, Richardson EP., Jr Morphologic and histochemical characteristics of a spared subset of striatal neurons in Huntington’s disease. J Neuropathol Exp Neurol. 1987;46:12–27. doi: 10.1097/00005072-198701000-00002. [DOI] [PubMed] [Google Scholar]
- 23.Ferrante RJ, Kowall NW, Richardson EP., Jr Proliferative and degenerative changes in striatal spiny neurons in Huntington’s disease: a combined study using the section-Golgi method and calbindin D28k immunocytochemistry. J Neurosci. 1991;11:3877–3887. doi: 10.1523/JNEUROSCI.11-12-03877.1991. [DOI] [PMC free article] [PubMed] [Google Scholar]
- 24.Fishell G, Van der Kooy D. Pattern formation in the striatum: developmental changes in the distribution of striatonigral neurons. J Neurosci. 1987;7:1969–1978. doi: 10.1523/JNEUROSCI.07-07-01969.1987. [DOI] [PMC free article] [PubMed] [Google Scholar]
- 25.Fishell G, Van der Kooy D. Pattern formation in the striatum: neurons with early projections to the substantia nigra survive the cell death period. J Comp Neurol. 1991;312:33–42. doi: 10.1002/cne.903120104. [DOI] [PubMed] [Google Scholar]
- 26.Folstein SE. Johns Hopkins UP; Baltimore: 1989. Huntington’s disease: a disorder of families. . [Google Scholar]
- 27.Graveland GA, Williams RS, DiFiglia MA. Evidence for degenerative and regenerative changes in neostriatal spiny neurons in Huntington’s disease. Science. 1985;227:770–773. doi: 10.1126/science.3155875. [DOI] [PubMed] [Google Scholar]
- 28.Gutekunst CA, Levey AI, Heilman DJ, Whaley WL, Yi H, Nash NR, Rees HD, Madden JJ, Hersch SM. Identification and localization of huntingtin in brain and human lymphoblastoid cell lines with anti-fusion protein antibodies. Proc Natl Acad Sci USA. 1995;97:8710–8714. doi: 10.1073/pnas.92.19.8710. [DOI] [PMC free article] [PubMed] [Google Scholar]
- 29.Hedreen JC, Peyser CE, Folstein SE, Ross CA. Neuronal loss in layers V and VI of cerebral cortex in Huntington’s disease. Neurosci Lett. 1991;133:257–261. doi: 10.1016/0304-3940(91)90583-f. [DOI] [PubMed] [Google Scholar]
- 30.Huang Q, Zhou D, Sapp E, Aizawa H, Ge P, Bird ED, Vonsattel J-P, DiFiglia M. Quinolinic acid-induced increases in calbindin D28k immunoreactivity in rat striatal neurons in vivo and in vitro mimic the pattern seen in Huntington’s disease. Neuroscience. 1995;65:397–407. doi: 10.1016/0306-4522(94)00494-p. [DOI] [PubMed] [Google Scholar]
- 31.Huntington’s Disease Collaborative Research Group. A novel gene containing a trinucleotide repeat that is expanded and unstable on Huntington’s disease chromosomes. Cell. 1993;72:971–983. doi: 10.1016/0092-8674(93)90585-e. [DOI] [PubMed] [Google Scholar]
- 32.Ikonomidou D, Mosinger JL, Salles K, Olney J. Sensitivity of developing brain to hypobaric/ischemic damage parallels sensitivity to NMDA. J Neurosci. 1989;9:2809–2818. doi: 10.1523/JNEUROSCI.09-08-02809.1989. [DOI] [PMC free article] [PubMed] [Google Scholar]
- 33.Jacobson M. Plenum; New York: 1991. Developmental neurobiology. . [Google Scholar]
- 34.Lapper SR, Bolam JP. Input from the frontal cortex and the parafascicular nucleus to cholinergic interneurons in the dorsal striatum of the rat. Neuroscience. 1992;51:533–545. doi: 10.1016/0306-4522(92)90293-b. [DOI] [PubMed] [Google Scholar]
- 35.Landwehrmeyer GB, McNeil SM, Dure LS, Ge P, Aizawa H, Huang Q, Ambrose CM, Duyao MP, Bird ED, Bonilla E, de Young M, Avila-Gonzales AJ, Wexler NS, DiFiglia M, Gusella JF, MacDonald ME, Penney JB, Young AB, Vonsattel J-P. Huntington’s Disease gene: regional and cellular expression in brain of normal and affected individuals. Ann Neurol. 1995;37:218–230. doi: 10.1002/ana.410370213. [DOI] [PubMed] [Google Scholar]
- 36.MacDonald JW, Silverstein FS, Johnston MV. Neurotoxicity of NMDA is markedly enhanced in developing rat central nervous system. Brain Res. 1988;459:200–203. doi: 10.1016/0006-8993(88)90306-x. [DOI] [PubMed] [Google Scholar]
- 37.Mazziotta JC, Phelps ME, Pahl JJ, Huang SC, Baxter LR, Riege WH, Hoffman JM, Kuhl DE, Lanto AB, Wapenski JA, Markham CH. Reduced cerebral glucose metabolism in asymptomatic subjects at risk for Huntington’s disease. N Engl J Med. 1987;316:357–362. doi: 10.1056/NEJM198702123160701. [DOI] [PubMed] [Google Scholar]
- 38.McPherson PS, Takei K, Schmid SL, DeCamilli P. p145, a major GRB2-binding protein in brain is co-localized with dynamin in nerve terminals where it undergoes activity-dependent dephosphorylation. J Biol Chem. 1994;269:30132–30139. [PubMed] [Google Scholar]
- 39.Myers RH, Vonsattel JP, Paskevich PA, Kiely DK, Stevens TJ, Cupples LA, Richardson EP, Jr, Bird ED. Decreased neuronal and increased oligodendroglial densities in Huntington’s disease caudate nucleus. J Neuropathol Exp Neurol. 1991;50:729–742. doi: 10.1097/00005072-199111000-00005. [DOI] [PubMed] [Google Scholar]
- 40.Nakata T, Iwamoto A, Noda Y, Takemura R, Yoshikura H, Hirokawa N. Predominant and developmentally regulated expression of dynamin in neurons. Neuron. 1991;7:461–469. doi: 10.1016/0896-6273(91)90298-e. [DOI] [PubMed] [Google Scholar]
- 41.Nasir J, Floresco SB, O’Kusky JR, Diewert VM, Richman JM, Zeisler J, Borowski A, Marth JD, Phillips AG, Hayden MR. Target disruption of the Huntington’s disease gene results in embryonic lethality and behavioral and morphological changes in heterozygotes. Cell. 1995;81:811–823. doi: 10.1016/0092-8674(95)90542-1. [DOI] [PubMed] [Google Scholar]
- 42.Noda Y, Nakata T, Hirokawa N. Localization of dynamin: widespread distribution in mature neurons and association with membranous organelles. Neuroscience. 1993;55:113–127. doi: 10.1016/0306-4522(93)90459-s. [DOI] [PubMed] [Google Scholar]
- 43.Reiner A, Albin RL, Anderson KD, D’Amato DJ, Penney JB, Young AB (1988) Differential loss of striatal projection neurons in Huntington’s disease. Proc Natl Acad Sci USA 5733–5737. [DOI] [PMC free article] [PubMed]
- 44.Sapp E, Ge P, Aizawa H, Bird E, Penney J, Young AB, Vonsattel JP, DiFiglia M. Evidence for a preferential loss of enkephalin immunoreactivity in the external globus pallidus in low grade Huntington’s disease using high resolution image analysis. Neuroscience. 1995;64:397–404. doi: 10.1016/0306-4522(94)00427-7. [DOI] [PubMed] [Google Scholar]
- 45.Semba K, Vincent SR, Fibiger HC. Different time of origin of choline acetyltransferase- and somatostatin-immunoreactive neurons in the rat striatum. J Neurosci. 1988;8:3937–3944. doi: 10.1523/JNEUROSCI.08-10-03937.1988. [DOI] [PMC free article] [PubMed] [Google Scholar]
- 46.Sharp AH, Loev SJ, Schilling G, Li S-H, Li X-J, Bao J, Wagster MV, Kotzuk JA, Steiner JP, Lo A, Hedreen J, Sisodia S, Snyder SH, Dawson TM, Ryugo DK, Ross CA. Widespread expression of Huntington’s disease gene (IT15) protein product. Neuron. 1995;14:1065–1074. doi: 10.1016/0896-6273(95)90345-3. [DOI] [PubMed] [Google Scholar]
- 47.Snell RG, MacMillan JC, Cheadle JP, Fenton I, Lazarou LP, Davies P, MacDonald M, Gusella JF, Harper PS, Shaw DJ. Relationship between trinucleotide repeat expansions and phenotypic variation in Huntington’s disease. Nature Genet. 1993;4:393–397. doi: 10.1038/ng0893-393. [DOI] [PubMed] [Google Scholar]
- 48.Sotrel A, Paskevich PA, Kiely DK, Bird ED, Williams RS, Myers RH. Morphometric analysis of the prefrontal cortex in Huntington’s disease. Neurology. 1991;41:1117–1123. doi: 10.1212/wnl.41.7.1117. [DOI] [PubMed] [Google Scholar]
- 49.Sotrel A, Williams RS, Kaufmann WE, Myers RH. Evidence for neuronal degeneration and dendritic plasticity in cortical pyramidal neurons of Huntington’s disease: a quantitative Golgi study. Neurology. 1993;43:2088–2096. doi: 10.1212/wnl.43.10.2088. [DOI] [PubMed] [Google Scholar]
- 50.Stine OC, Pleasant N, Franz ML, Abbott MH, Folstein SE, Ross CA. Correlations between the onset age of Huntington’s disease and length of the trinucleotide repeat in IT15. Hum Mol Genet. 1993;2:1547–1549. doi: 10.1093/hmg/2.10.1547. [DOI] [PubMed] [Google Scholar]
- 51.Tepper JM, Trent F. In vivo studies of the postnatal development of rat neostriatal neurons. Prog Brain Res. 1993;99:35–50. doi: 10.1016/s0079-6123(08)61337-0. [DOI] [PubMed] [Google Scholar]
- 52.Trescher WH, McDonald JW, Johnston MV. Quinolinate induced injury is enhanced in developing rat brain. Dev Brain Res. 1994;83:224–232. doi: 10.1016/0165-3806(94)00141-3. [DOI] [PubMed] [Google Scholar]
- 53.Trottier Y, Devys D, Imbert G, Saudou F, An I, Luta Y, Weber C, Agid Y, Hirsch EC, Mandel J-L. Cellular localization of the Huntington’s disease protein and discrimination of the normal and mutated form. Nature Genet. 1995;10:104–110. doi: 10.1038/ng0595-104. [DOI] [PubMed] [Google Scholar]
- 54.Van der Kooy D, Fishell D. Neuronal birthdate underlies the development of the striatal compartments. Brain Res. 1986;401:155–161. doi: 10.1016/0006-8993(87)91176-0. [DOI] [PubMed] [Google Scholar]
- 55.Vonsattel JP, Myers RH, Stevens TJ, Ferrante RJ, Bird ED, Richardson EP. Neuropathological classification of Huntington’s disease. J Neuropathol Exp Neurol. 1985;44:559–577. doi: 10.1097/00005072-198511000-00003. [DOI] [PubMed] [Google Scholar]
- 56.Wexler NS, Rose EA, Housman DE. Molecular approaches to hereditary diseases of the nervous system: Huntington’s disease as a paradigm. Annu Rev Neurosci. 1991;14:503–529. doi: 10.1146/annurev.ne.14.030191.002443. [DOI] [PubMed] [Google Scholar]
- 57.Young AB (1994) Huntington’s disease: lessons from and for molecular neuroscience. The Neuroscientist, November, preview issue, pp 30–37.
- 58.Zeitlin S, Liu JP, Chapman DL, Papaioannou VE, Efstratiadis A. Increased apoptosis and early embryonic lethality in mice nullizygous for the Huntington’s disease homologue. Nature Genet. 1995;11:155–163. doi: 10.1038/ng1095-155. [DOI] [PubMed] [Google Scholar]


