

Abstract
Reactive astrocytes form a scar after injury to the CNS that many investigators believe contributes to the lack of functional regeneration. In the present study, we identify an astrocytic membrane protein that appears to play an important role in reactive gliosis and scar formation. Cultures of rat astrocytes were used as a model system to produce and to screen monoclonal antibodies that would alter cell growth. One antibody, AMP1, was identified that depresses the mitotic activity of cultured glial cells and alters their morphology. Expression cloning reveals that the antigen on the external surface of the cultured glial cells has a high degree of homology with the human lymphocyte protein called Target of the Anti-Proliferative Antibody (TAPA-1; this rat protein will be referred to as rTAPA). rTAPA is a member of the tetramembrane-spanning superfamily of proteins and, as with other members of this family of proteins, rTAPA is associated with the regulation of cellular interactions and mitotic activity. After an injury to the cerebral cortex, there is a dramatic increase in AMP1 immunoreactivity that is spatially restricted to the reactive astrocytes at the glial scar. This change represents an upregulation of a membrane protein, rTAPA, that is approximately equal to the increase observed for glial fibrillary acidic protein. The high levels of rTAPA at the site of CNS injury and the AMP1 antibody perturbation studies indicate that rTAPA may play a prominent role in the response of astrocytes to injury and in glial scar formation.
Keywords: astrocyte, regeneration, cell adhesion, brain, reactive gliosis, injury, rat, TAPA, α actinin
After traumatic injury to the brain or spinal cord, a complex series of cellular responses occurs as the CNS attempts to heal itself. In many cases, one consequence of this process is a loss of neural function associated with damaged axonal pathways. This lack of functional regeneration appears to be attributable to multiple factors. As glial cells mature, there is a reduction in the expression of molecules known to promote axonal outgrowth (Smith et al., 1993). Furthermore, several molecules have been identified in the adult mammalian CNS that block or inhibit axonal growth (Caroni and Schwab, 1988; McKeon et al., 1991; Geisert and Bidanset, 1993; McKerracher et al., 1994; Mukhopadhyay et al., 1994). In addition, local factors unique to the site of injury also may play a role in the lack of axonal regrowth.
In the immediate vicinity of the injury, astrocytes become reactive, dramatically elevating the levels of cytoskeletal elements, membrane proteins, and extracellular matrix components (Eng et al., 1971;Bignami and Dahl, 1976; Liesi and Sliver, 1988; Geisert et al., 1990;Rudge and Silver, 1990; Laywell et al., 1992; Le Gal La Salle et al., 1992). As with other healing processes, the reactive astrocytes are believed to reestablish a protective barrier, the glial limiting membrane (Reier, 1986). However, in the injured CNS, this barrier, a gliotic scar, is located deep within the parenchyma of the brain or spinal cord. This glial scar and its immediate environment are believed to contribute to the lack of functional axonal regeneration (Reier and Houle, 1988). The glial scar may represent a physical barrier in that it disrupts continuity of previously established axonal pathways. In addition, the molecules expressed by the reactive astrocytes may represent a molecular barrier to regenerating axons (Geisert and Stewart, 1991; McKeon et al., 1991; Laywell et al., 1992). An examination of the glial scar at the light and electron microscopic levels reveals that the astrocytic processes appear to recognize each other, running in parallel arrays to form a scar. Defining the molecules that regulate astrocyte interactions during scar formation is critical to an understanding of the role of the glial scar in CNS wound healing and its potential contribution to the lack of axonal regeneration after injury.
One approach to defining the molecules regulating glial scar formation is to use cultured astrocytes as a model system. We reasoned that antibodies recognizing cell surface molecules regulating astrocyte growth might alter the function of these molecules. The antibodies then could be used to isolate and characterize membrane proteins involved in regulating astrocyte interactions during scar formation. This approach led to the monoclonal antibody AMP1, which modulates cellular interactions between astrocytes (Geisert et al., 1991). This antibody recognizes an astrocytic membrane protein called Target of the Anti-Proliferative Antibody (TAPA), which after injury is upregulated to the same extent as glial fibrillary acidic protein (GFAP) and which plays a role in regulating the growth of cultured glial cells. The results of the present study indicate that the rat protein rTAPA is involved in the cascade of molecular events governing glial scar formation.
MATERIALS AND METHODS
A functional tissue culture assay was used to define surface antigens regulating astrocyte growth. We began a series of studies using a polyclonal antiserum directed against rat CNS white matter (Darongsuwan, 1987). The same assay was used to produce a monoclonal antibody that would block the mitotic activity and alter the morphology of cultured astrocytes. Initially, antibodies from the anti-white matter antiserum were affinity-isolated from selected molecular weight ranges of immunoblots of reduced membrane proteins and tested on cultures of rat astrocytes (Geisert et al., 1986). Monoclonal antibodies were produced against astrocytic membrane proteins and screened to identify antibodies that would alter the growth of cultured astrocytes. One antibody, AMP1, bound to the external surface of cultured astrocytes and altered the growth of these cells (Geisert et al., 1991).
Production and isolation of AMP1 antibody. The results of the present study center on a monoclonal antibody that alters the mitotic activity and morphology of cultured rat astrocytes. Previous studies using a polyclonal antibody (Darongsuwan, 1987) revealed that an antiserum developed against rat white matter would depress mitotic activity and alter the morphology of rat astrocytes. To define the specific antigens involved in this altered astrocytic growth, monoclonal antibodies were produced. Cultures of astrocytes were collected from T225 flasks by scraping and disrupted using a nitrogen bomb. The subcellular fractions were separated by differential centrifugation with spins at 1000 × g, 10,000 × g, and 100,000 × g. The 100,000 × g pellet was used as a crude preparation of astrocyte membranes. This fraction was boiled in reducing sample buffer, and the proteins were separated by SDS-PAGE. Proteins were cut from the gel and used to immunize mice. One monoclonal antibody, AMP1, was identified that depressed the mitotic activity of cultured astrocytes and altered the morphology in a manner similar to that of the original polyclonal antiserum directed against white matter.
Antibody purification and immunohistochemistry. Several different antibodies were used in the present study. The polyclonal antibody directed against GFAP was obtained from Lipshaw. The monoclonal antibodies TED1 (directed against GFAP) and 13-38 (directed against an extracellular epitope on N-CAM) were produced in our laboratory (Geisert et al., 1991). To stain α actinin, the affinity-purified anti-α actinin antiserum 592 was used (a gift from Dr. Keith Burridge). When purified IgG was required, the antibodies were isolated using a protein G-Sepharose affinity isolation column (Pharmacia). Frozen sections (50 μm) were stained by immunoperoxidase methods as described previously (Geisert et al., 1990). Secondary antibodies included fluorescein- or peroxidase-labeled goat anti-mouse IgG, with minimal cross-reaction to rat, human, bovine, and horse serum proteins (Jackson ImmunoResearch, West Grove, PA), and a peroxidase-labeled goat anti-rabbit IgG, with minimal cross-reaction to human serum proteins (Jackson ImmunoResearch).
Surgery. Male Sprague–Dawley rats (200 gm) were anesthetized with sodium pentobarbital (60 mg/kg), were placed in a stereotaxic head holder, and underwent sterile surgery (Geisert and Alley, 1985). A slot was made in the skull, 1 mm lateral to the midsagittal suture, and a lesion was made by lowering a scalpel blade to a depth of ∼3 mm below the cortical surface, cutting through the cortex and underlying white matter. After the survival period of 1, 3, 7, or 14 d, the rats were deeply anesthetized with sodium pentobarbital (100 mg/kg) and perfused through the heart with saline followed by 4% paraformaldehyde in phosphate buffer, pH 7.3. For biochemical analysis, 10 60-d-old rats were used. Six animals were deeply anesthetized, and three parallel stab wounds were made in the right cortex ∼1 mm apart. After a survival time of 14 d, the rat was deeply anesthetized, the brain was removed from the skull, and the cortical stab wound along with adjacent tissue was free-hand dissected. The remaining four animals were deeply anesthetized, and a sample of cortical tissue was taken.
Gel electrophoresis and immunoblot method. Samples containing equal amounts of protein were dissolved in nonreducing sample buffer (2% SDS, 10% glycerol in 0.05 m Tris-HCl buffer, pH 6.8) or in reducing sample buffer (with the addition of 5% 2-β-mercaptoethanol), and run on 4–16% SDS-PAGE, following procedures described previously (Geisert et al., 1990). After electrophoresis, the gels were transferred to nitrocellulose for immunoblot analysis. The blots then were blocked in 5% nonfat dry milk, probed with the primary antibody, rinsed in borate buffer, pH 8.5, incubated in HRP-labeled secondary antibody, and reacted with diaminobenzidine and hydrogen peroxide. The level of immunoreaction product was determined by scanning the blots and analyzing these scans with the National Institutes of Health image program.
To define the antigen recognized by AMP1, cultures of astrocytes were labeled with [35S]methionine, and the proteins were solubilized with Triton X-100. The solubilized antigen then was immunoprecipitated using the AMP1 antibody linked to G-protein Sepharose (Pharmacia). The proteins were separated by SDS-PAGE, and the radiolabeled protein was detected by exposure to X-Omat film (Eastman Kodak, Rochester, NY).
Astrocyte cultures and doubling time calculations. To examine the effects of the AMP1 antibody on astrocyte growth and morphology, we chose to use low-density cultures to facilitate the quantitative analysis. Astrocytes were cultured by a modification of the procedure described previously (McCarthy and de Vellis, 1980), using BME with 10% fetal calf serum. The cultures were treated with 0.1% trypsin in 5 mm EDTA for 10 min to create a suspension of single cells. The astrocytes then were plated at a density of 3 × 10³ cells/cm2 onto 35-mm-diameter culture dishes with a marked grid placed onto the center of each plate. All of the cultures were maintained in BME with 2% heat-inactivated fetal calf serum. One day after the initial plating, the cells were transferred into one of the experimental media containing 2% fetal calf serum plus the treatments: no antibodies added; 1.0 mg/ml of the monoclonal antibody 13-38; 1.0 mg/ml of AMP1; 0.1 mg/ml of AMP1; and 1.0 mg/ml of TED1. The cells remained in these media for the next 6 d. For each treatment condition, five different locations in each of two plates were counted, covering a total surface area of 5 mm2. Each of the fields was videotaped, allowing us to follow individual cells over the 7 d period of the experiment.
To examine the effects of the AMP1 antibody on the morphology of cultured astrocytes, cells were plated onto 18 mm poly-l-lysine-coated glass coverslips. Primary cultures of astrocytes were allowed to reach confluence, and the cells were released from the cultures by 0.1% trypsin with 5 mm EDTA in serum-free BME. These cells then were plated at a density of 3 × 10³ cells/cm2 onto glass coverslips in a 12-well culture plate. After 1 d in culture, the cells were transferred from medium containing 10% fetal calf serum to medium with 2% serum. Four of the wells were treated with 0.1 mg/ml of AMP1 and four wells were treated with 0.1 mg/ml of 13-38. The cells were allowed to stay in the treatment medium for 2 d. With a 48 hr treatment, the astrocytic processes did not grow over each other, and this facilitated the measurement of process length. All of the wells were fixed and stained for GFAP (rabbit anti-GFAP, Lipshaw), followed by a peroxidase-conjugated secondary antibody specific for rabbit IgG (Jackson ImmunoResearch). Each coverslip was analyzed to identify individual type 2 astrocytes that were separated from other cells. In the 13-38-treated cultures, 98 cells were measured, and in the AMP1-treated cultures, a total of 108 cells were measured. The cells were drawn with a camera lucida, and the number and length of the processes were measured. These populations of cells in the AMP1-treated cultures were compared with those treated with the antibody 13-38 using a Student’s t test.
Purification and amino acid sequences. Amino acid sequences were determined using methods described previously (Peduzzi et al., 1994). The 26 kDa protein was immunoprecipitated with AMP1 from cultured astrocytes solubilized in magnesium-free buffer [0.14m NaCl, 4 mm KCl, 0.4 mmNaH2PO4, 12 mm NaHCO3, 0.2 mm KH2PO4, 11 mmd(+)-glucose] with 0.05% Triton X-100 added. The immunoprecipitated proteins were separated from the AMP1 antibody by SDS-PAGE run under nonreducing conditions. The samples were transferred to Immobilon membrane (Immobilon-Psq, Millipore, Bedford, MA), rinsed briefly in H2O, and stained with 0.1% Coomassie brilliant blue. The 26 kDa band was cut from the membrane and sent to the Glycoprotein Analysis Facility of the University of Alabama at Birmingham (Dr. John Baker, director) for amino acid sequence determination.
Because the 106 kDa antigen could not be isolated using immunoaffinity-based methods, standard biochemical methods were used. The 106 kDa protein was isolated from membrane preparations of cultured astrocytes using a DEAE-trisacryl column (Sepracor, Marlborough, MA) as described previously (Peduzzi et al., 1994). Fractions were examined by immunoblots, and fractions containing the 106 kDa antigen were pooled. The proteins were separated by SDS-PAGE, and the AMP1-positive band was cut out of the gel. This protein then was electroeluted from the gel. The purified protein was digested with the endoprotease Glu-C (Sigma, St. Louis, MO) for 6 hr at 37°C. The resulting peptides were separated on a 20% acrylamide gel and transferred to Immobilon membrane and sent to the Glycoprotein Analysis Facility of the University of Alabama at Birmingham for sequencing.
Expression cloning. Two different λgt11 libraries, C6 glioma (Clontech, Cambridge, UK) and rat cortical astrocytes (Clontech), were screened with the AMP1 monoclonal antibody. More than 106 independent clones were screened from each library. Host E. coli, Y1090r–, were transfected with the cDNA λgt 11 libraries, placed in top agar, and transferred to lauryl broth agar plates. After the plates were incubated for 3.5 hr at 37°C, nitrocellulose filters soaked in 10 mm isopropyl β-d-thiogalactopyranoside (IPTG, Sigma) were placed on the plates and incubated for an additional 4 hr at 37°C. The nitrocellulose membranes were removed from plates and blocked with 5% nonfat dried milk in 0.01 m borate buffer, pH 8.0, and reacted with 1:10 dilution of a tissue culture supernatant containing the AMP1 antibody at 4°C for overnight. After rinsing with borate buffer, the membranes were incubated in 1:1000 diluted HRP-labeled goat anti-mouse IgM and IgG secondary antibody (Pierce, Rockford, IL) for 2 hr at room temperature, rinsed, and developed in diaminobenzidine and hydrogen peroxide in 0.1 m Tris-HCl, pH 7.4. The immunopositive plaques were picked and diluted for second subscreening at 200 pfu/plate. Clones were picked from the second subscreening and used for the subsequent analysis. To obtain the 5′ end of both α actinin and TAPA, the RACE protocol and the 5′ Amplifinder RACE kit (Clontech) were used. All PCR reactions were run with theTaq Extender PCR additive (Stratagene), and the resultant PCR products were placed into a plasmid vector using the TA cloning kit (Invitrogen).
Two different methods were used for DNA sequencing, Sequenase dideoxynucleotide chain-termination sequencing (version 2.0, United States Biochemical, Cleveland, OH) and cycle-based sequencing with the Prism kit (Applied Biosystems, Foster City, CA). Cycle-based sequencing was used to provide an initial identification of all clones. The samples were analyzed on an Applied Biosystems 373A DNA sequencer at the Molecular Resource Center, University of Tennessee, Memphis, TN (Dr. Mike Dockter, director).
For all of the clones used to obtain sequence information, the positive clones were grown and the insert DNA was isolated. The inserts were subcloned into pBluscript KS+ (Stratagene, La Jolla, CA). The plasmids containing inserts were grown and isolated using the Qiagen Midi-Prep. Some of the inserts were sequenced using double- and single-stranded dideoxynucleotide chain-termination sequencing (Sequenase version 2.0, United States Biochemical). All of the samples also were sequenced using the Prism Ready Reaction DyeDeoxy Terminator Cycle Sequencing kit. For all of the clones, both the plus and minus strands were sequenced.
All of the manipulations of DNA sequences and the comparisons to known sequences were performed using a Macintosh Quadra 840 and the MacVector 4.1.4 program (International Biotechnologies, New Haven, CT) in conjunction with the Database Entrez (National Center for Biotechnology Information, Bethesda, MD). For the final alignment of DNA sequences and for comparing the plus and minus strands, the program Assembly Lign from International Biotechnologies was used.
RESULTS
Antibody-mediated effects on astrocyte growth
When cultured astrocytes are treated with the AMP1 antibody, the mitotic activity of the cells is depressed (Fig. 1), and the cells display an altered morphology (Figs. 2,3). A series of experiments were designed to determine whether the depressed mitotic activity observed in cultured astrocytes was antibody-mediated. Primary cultures of astrocytes were treated with two different monoclonal antibodies of the same isotype (IgG1): AMP1 and 13-38, a monoclonal antibody directed against the extracellular domain on N-CAM (Fig. 4). When the AMP1 antibody was added to cultures of astrocytes at a concentration of 1 mg/ml, there was no increase in the number of astrocytes over the next 7 d (Fig. 1). In cultures that had no antibody added or in cultures with TED1 added (data not shown), there was a normal increase in cell number. When the 13-38 antibody was added to the culture medium, there appeared to be a slight decrease in the mitotic rate; however, this was not significantly different from control cultures with no antibody added (Fig. 1). To further define the effects of the AMP1 antibody, cells were treated with a lower concentration of the antibody (100 μg/ml). As shown in Figure 1, the lower concentration of the AMP1 antibody depressed the mitotic activity of the astrocytes, indicating that this concentration of antibody was sufficient to achieve the maximum effect. After 7 d in culture, the number of astrocytes in the control cultures had increased to become ∼75% confluent. At this point, the cultures were rinsed several times with normal medium and returned to the incubator. In all cases, the number of astrocytes increased over the next several days, demonstrating that the astrocytes still were viable. To determine whether the suppression of cell number was attributable to cell death, individual cells were followed over the 7 d culture period using videotaped images. In the AMP1-treated cultures, 74% of the 147 cells could be followed throughout the experiment, and no cell division was observed. After the AMP1 antibody was removed from the culture medium, 93% of these cells were observed to undergo cell division, indicating that they remained viable during the AMP1 treatment. Thus, treating rat astrocytes with AMP1 depressed the mitotic activity of the cells, and this antibody-induced effect was reversible.
Fig. 1.

The effect of the AMP1 antibody on the mitotic activity of cultured astrocytes is illustrated in a bar graph defining the relative growth of the cells over a 7 d period. The mean and SE of cells in the different culture conditions are represented byopen bars, indicating untreated control cultures;diagonal hatching, 1 mg/ml of 13-38; cross hatching, 0.1 mg/ml of AMP1; and black bars, 1 mg/ml of AMP1. All cultures were maintained in 2% fetal calf serum. One day after plating, five defined areas in each of two culture plates were videotaped, and the number of cells was counted. The number of cells in the identified areas was counted over the next 6 d. The relative increase in cell number (number of cells divided by the number of cells counted on day 1 for each of the fields) was plotted for the 6 d of the experiment. In the control and 13-38-treated cultures, there was a gradual increase in the relative number of cells within the cultures, whereas no increase in cell number was observed in cultures treated with AMP1. Furthermore, the mitotic activity was completely blocked by 0.1 mg/ml of AMP1 antibody. This difference between control and AMP1-treated cultures is statistically significant beginning at day 5 (p < 0.01, Student’s ttest).
Fig. 2.

The AMP1 antibody alters the morphology of cultured astrocytes. In A, the cells were exposed to 0.1 mg/ml of AMP1, and in B, the cells were exposed to 0.1 mg/ml of 13-38 for 48 hr. The cells were fixed and stained for GFAP. Notice that the type 2 astrocytes in A have longer processes than those in B, and that fewer and larger type 1 astrocytes are found in the AMP1-treated cultures. Scale bar, 100 μm.
Fig. 3.
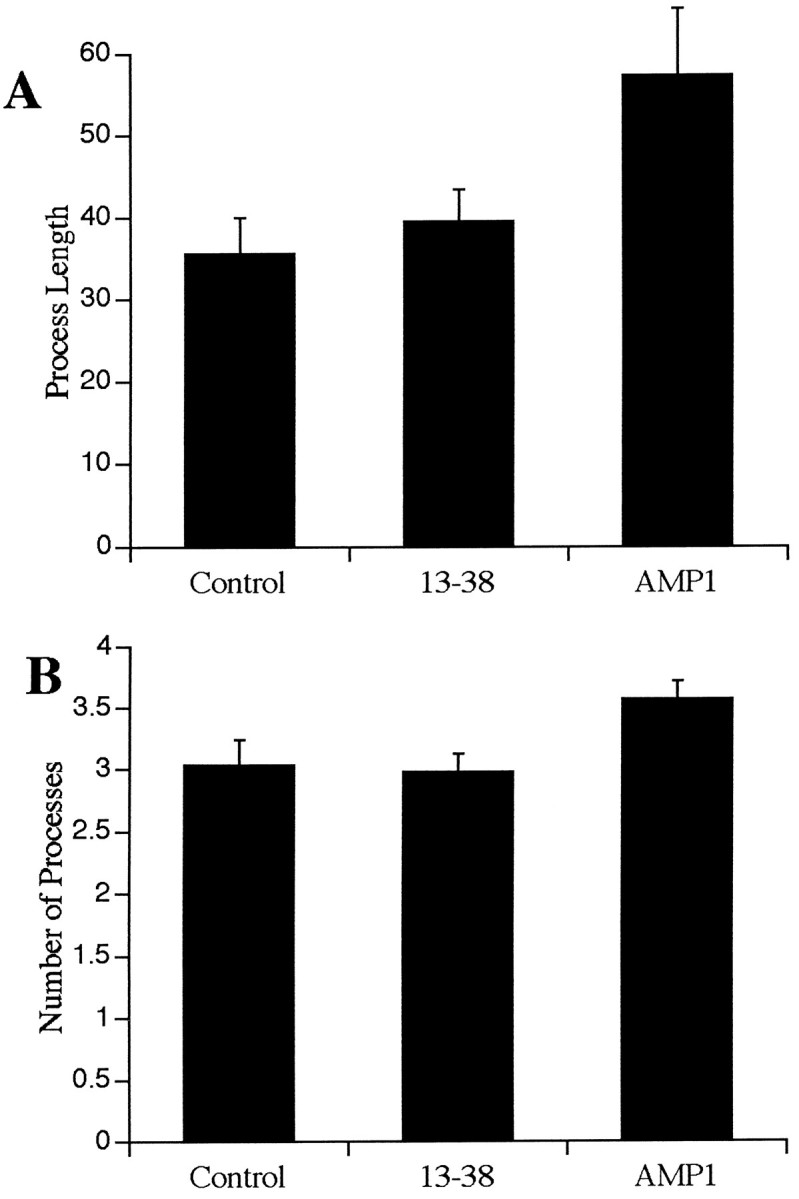
The changes observed in type 2 astrocytes were characterized by measuring the individual process length (A) and number of primary processes (B) of the GFAP-stained type 2 astrocytes. These data represent the mean and SEM. The cells were grown for 48 hr in normal medium containing 2% fetal calf serum (Control), 0.1 mg/ml of a monoclonal antibody directed against N-CAM (13-38), or 0.1 mg/ml of AMP1 antibody (AMP1). This analysis revealed that the AMP1-treated astrocytes had significantly longer processes (p < 0.05, Student’s ttest) than either the control or 13-38-treated cultures. In addition, there was a significant increase (p < 0.05, Student’s t test) in the number of primary processes in the AMP1-treated cultures.
Fig. 4.

The pattern of AMP1 labeling is illustrated in photomicrographs of cultured rat astrocytes. In A, the AMP1 labeling pattern of a confluent monolayer of living rat astrocytes is shown. The identical culture was counterstained for GFAP (B). In low-density culture of astrocytes (C), the intensity of the AMP1 immunoreactivity is considerably lower than that observed in confluent cultures.D illustrates the binding of the monoclonal antibody 13-38 (directed against an extracellular epitope on N-CAM) to the external surface of cultured astrocytes. Notice that the concentration of the AMP1 immunoreactivity at regions of cell–cell contact is similar to that observed for N-CAM. Scale bar, 50 μm.
In addition to the effects of the AMP1 antibody on the mitotic activity of cultured astrocytes, the antibody also alters the morphology of the cells (Fig. 2). The most obvious effect is on the type 2 astrocytes. These cells develop longer processes that appear to have more branches (Fig. 3). To determine whether the AMP1 antibody is capable of altering the morphology of cultured astrocytes, 12 cultures of astrocytes were treated with 0.1 mg/ml of AMP1, 0.1 mg/ml of 13-38, or no added antibody. After 48 hr in culture, the cells were fixed and stained for GFAP, and the cells were drawn and the length and number of the processes determined. The average length of astrocytic processes was significantly longer (Student’s t test at thep < 0.05 level) in the cultures treated with the AMP1 antibody. In addition, there was a significant increase (Student’st test at the p < 0.05 level) in the number of primary processes in the AMP1-treated cultures.
Characterization of AMP1 antigens
The monoclonal antibody AMP1 was identified by its binding to cultured glial cells (Fig. 4) and using a functional screen. The subsequent characterization of this antibody was complicated by the fact that this antibody recognizes two different astrocytic proteins. When protein samples of cultured astrocytes are run under nonreducing conditions, the AMP1 antibody recognizes a 106 kDa and a 26 kDa protein (Fig. 5), whereas under reducing conditions, the monoclonal antibody recognizes a single protein with a relative molecular weight of 106 kDa. When AMP1 was used to immunoprecipitate solubilized proteins from cultured astrocytes, only the 26 kDa protein was precipitated (Fig. 5). Repeated attempts to immunoprecipitate the 106 kDa antigen using different methods and detergents were not successful, although the antigen was detected in the detergent extracts using immunoblot methods.
Fig. 5.

Immunoblots of protein samples were taken from rat astrocytes (A,B,H,I) and rat C6 glioma (C,D). In addition, there is one sample of radiolabeled rat astrocytic proteins immunoprecipitated with the AMP1 antibody (E). Two cortical samples also are shown. Lane F is a protein sample from the injured rat cortex, and lane G is from the normal rat cortex. Lane H is from a low-density culture of astrocytes, and lane I is from a confluent culture of astrocytes. Lanes A, C, andE were run under reducing conditions, whereaslanes B, D, andF–I were run under nonreducing conditions. The total load of proteins in lanes A–D was balanced. Notice that the 106 kDa antigen is recognized in all samples immunoblotted with AMP1 and that the 26 kDa antigen is immunostained only in the nonreduced samples. Lane E is an autoradiogram of AMP1-immunoprecipitated radiolabeled astrocytic proteins. Only the 26 kDa antigen was precipitated by the AMP1 antibody.
To further characterize these two antigens, both were isolated, and amino acid sequences were determined. The 26 kDa protein was isolated by immunoprecipitation, and the N-terminal amino acid sequence was determined. The microsequencing identified a stretch of sequence 13 amino acids, GVEGCTKCIKYLL. The 106 kDa protein was isolated by anion exchange column chromatography, followed by electroelution from acrylamide gels. Several attempts were made to sequence the intact protein; however, no sequence data were obtained, suggesting that the N terminus of the protein was blocked. The isolated protein then was digested with the endoprotease Glu-C, and the peptide fragments were isolated and sequenced. Two of the peptides were successfully sequenced, revealing two stretches of amino acid sequence, ALIFDKHTNY and VSSFYHA.
Cloning the AMP1 antigens
Both of the proteins recognized by the AMP1 antibody were cloned from expression libraries, and the cDNAs were sequenced. One clone was identified in the rat C6 glioma library (4.3.1), and six clones were identified in an astrocyte library, five of which were completely sequenced (1.1, 2.2, 10.1, 12.1, and 12.4). The sequences from these clones had high homology with one of two different proteins: nonmuscle α actinin and the human lymphocyte protein TAPA-1.
The largest of the α actinin clones was 4.3.1 and was obtained from the C6 glioma library. The remaining α actinin clone (12.4) came from the astrocyte library, and the sequence was similar to the clone 4.3.1. The 4.3.1 clone contained 1.29 kb cDNA insert. The remaining portion of the sequence was obtained using the 5′ RACE technique. Using this method, three independent clones were obtained: P900 (966 bases), Li1000A (620 bases), and Li1000B (1450 bases). The deduced amino acid sequence of the cDNA sequence reveals a protein with 892 amino acids and a calculated molecular weight of 102,443 Da (Fig.6).
Fig. 6.
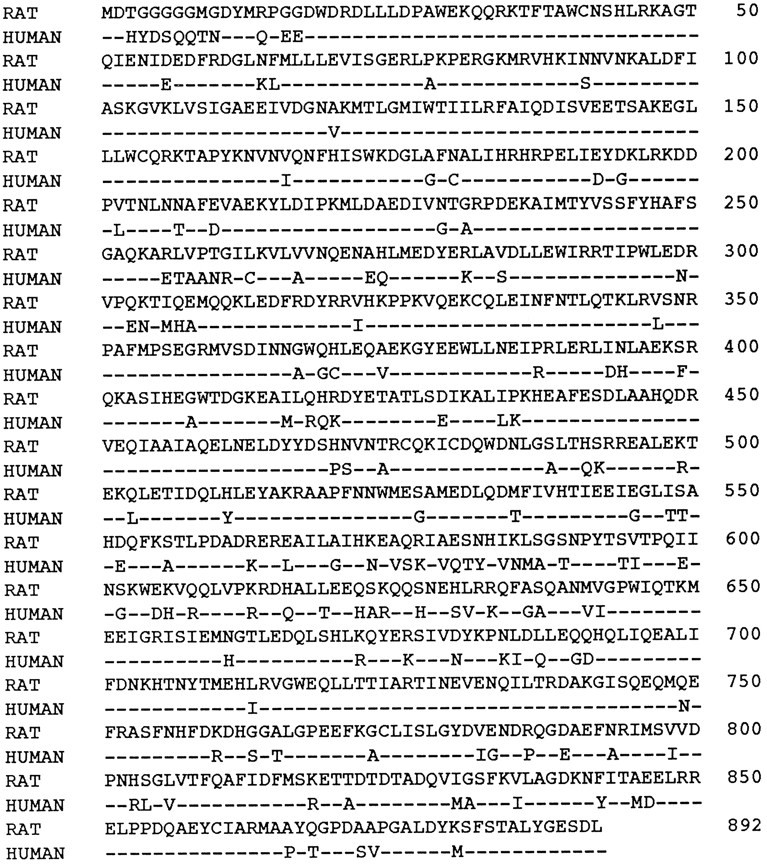
The deduced amino acid sequence of the cDNA sequence for rat α actinin is shown. The GenBank accession number isU19893. The protein has 892 amino acids and a calculated molecular weight of 102,443 Da. There is a high degree of homology with the human nonmuscle α actinin (accession number X15804). Identical amino acids are indicated by dashes, and differences in amino acids are designated by single letter notations.
Five independent clones were obtained for the second AMP1 antigen. Of these five clones, the largest was 1.1, which contained 977 bases of the 3′ end of the sequence. The remaining portion of the clone was obtained using the 5′ RACE technique. Based on the deduced amino acid sequence, the encoded protein has 236 amino acids and a calculated molecular weight of 25,886 Da (Fig. 7). The hydrophilicity analysis of the deduced amino acid sequence reveals four transmembrane regions, which is characteristic of this family of membrane proteins.
Fig. 7.

The deduced amino acid sequence for rTAPA is shown. The protein has 236 amino acids and a calculated molecular weight of 25,886 Da. The Genbank accession number of the rTAPA sequence is U19894. The amino acid sequences for rat, human, and mouse TAPA are aligned. The hydrophobic stretches are indicated byunderlining. Identical amino acids are indicated bydashes, and differences in amino acids are designated bysingle letter notations. Notice that this family of proteins is highly conserved and that the major difference is in the large, second extracellular loop.
The deduced amino acid sequences of the rat α actinin (Fig. 6) and that of rTAPA (Fig. 7.) can be analyzed to determine whether the AMP1 antibody recognizes a sequence on both proteins. The approximate location of the epitope on rTAPA can be defined, because the AMP1 antibody binds to the external surface of astrocytes, limiting the epitope to one of the two extracellular loops. Because the antibody recognized the rTAPA clone 1.1, which codes for the second extracellular loop only, the epitope is on this second loop. Furthermore, AMP1 does not recognize TAPA in the mouse or in humans (E. Geisert, unpublished observations). This last piece of evidence allows for a comparison of the deduced amino acid sequence between rat, human (GenBank accession number M33680), and mouse (GenBank accession numberX59047) (Fig. 7). When the 79 amino acids of the second extracellular loop (amino acids 112–191) are examined, there are only five positions where the rat sequence differs from that of both mouse and human. Thus, the epitope recognized by AMP1 must include at least one of these five amino acids. Because AMP1 recognizes α actinin in both human (Millake et al., 1989; Youssoufian et al., 1990) and rat, the sequences of these two proteins were compared with the 17 amino acid stretch of rTAPA, containing all of the five amino acid changes. There were no sequence homologies that were similar to the rTAPA sequence. Taken together, these data indicate that there is no sequence homology in the epitopes on rTAPA and α actinin. Therefore, it appears that the epitope on rTAPA is dependent on tertiary structure of the protein, whereas the AMP1 antibody recognizes the primary structure of α actinin.
Cellular and tissue distribution
Several lines of evidence demonstrated that the AMP1 monoclonal antibody recognized an antigen on the external surface of cultured glial cells. In primary cultures of rat glial cells, the antibody stains type 1 astrocytes (Fig. 4), type 2 astrocytes, and oligodendrocytes (data not shown). When the antibody is applied to living astrocytes for 15 min, the antibody labels the surface of the cultured cells. This type of labeling also occurs within minutes of exposure even at 4°C, indicating that the labeling is independent of the metabolic activity of the astrocytes or uptake by pinocytosis. The binding of the antibody to the surface of the cells can be eliminated by pretreating the cells with low levels of trypsin (data not shown). The pattern of labeling observed when living astrocytes are exposed to the antibody is similar to the pattern observed when the cells are fixed and treated with detergents. These data indicate that the monoclonal antibody AMP1 recognizes an epitope on the external surface of cultured glial cells.
The levels of AMP1 immunoreactivity appear to increase as a function of cell density or time in culture. As cultures mature, there is an apparent increase in the overall levels of AMP1 immunoreactivity (Fig.4). The relative levels of rTAPA and α actinin were quantified by an immunoblot analysis (Fig. 5). Protein samples from four nonconfluent and two confluent rat glial cultures were balanced, and limiting dilutions of each protein sample were analyzed. No difference in the levels of α actinin was observed in these samples. In contrast, the relative levels of rTAPA increase 2.5-fold as the cultures become confluent (Fig. 5).
In tissue sections of the adult brain, relatively even labeling of the sections is observed. There is an increase in labeling at the glial limatans and at the ventricular surface. The ependyma and choroid plexus also display high levels of AMP1 immunoreactivity. When sections were examined to define the cellular distribution of the antigen, there was a reticulated pattern of labeling throughout the nervous system, and there were no indications of neuronal labeling. To provide an independent means of assessing the distribution of rTAPA, samples of total brain, gray matter, white matter, and isolated myelin were analyzed using a quantitative immunoblot method. This approach revealed that rTAPA is found at approximately equal levels in gray matter, white matter, and myelin (data not shown).
Distribution of the AMP1 antigen at the CNS scar
The distribution of AMP1 immunoreactivity was examined in the cerebral cortex of the adult rat killed 14 d after a cortical stab wound (Fig. 8). When sections of cortical stab wounds were stained with AMP1 antibody, there was a dramatic increase in AMP1 immunoreactivity at the site of injury. This increased immunoreactivity was restricted to the region of reactive gliosis, as defined by the increase in GFAP (Fig. 8). This correlation between reactive gliosis and elevated levels of AMP1 immunoreactivity also was observed at different times after a cortical stab wound. At shorter survival times (1, 3, and 7 d after injury), the increase in AMP1 immunoreactivity paralleled reactive gliosis and the upregulation in GFAP. At 1 d after injury, there was a modest increase in GFAP within the astrocytes near the cortical stab wound, and there was a modest increase in the amount of AMP1 immunoreactivity. This increased over the next several days to reach relatively high levels by 7 d after injury (data not shown). These data reveal a temporal and a spatial correlation between the increase in AMP1 immunoreactivity and the upregulation of GFAP after a cortical stab wound.
Fig. 8.

The distribution of AMP1 immunoreactivity at the astrocytic scar is illustrated in a series of low- and high-magnification photomicrographs. High levels of AMP1 immunoreactivity (A,D) are observed in a section from an adult rat that received a cortical stab wound 14 d before being killed. In an adjacent section stained for GFAP (B,E), the reactive astrocytes at the glial scar have a spatial distribution that is similar to the high levels of AMP1 immunoreaction product. Although in a section stained with the secondary antibody only, a modest amount of immunoreactivity is observed at the site of the cortical stab wound (C,F). Scale bar inF, 100 μm.
Because the AMP1 antibody recognizes two proteins on immunoblots, a series of experiments was conducted to define the AMP1 antigen upregulated after cortical injury. When sections of cortical stab wounds were stained with a polyclonal antiserum directed against α actinin, very little immunoreactivity was associated with the glial scar (data not shown). To further define the regulation of α actinin and rTAPA after CNS injury, protein samples were taken from the cerebral cortex of six rats that received a stab wound at postnatal day 60 (P60) and were allowed to survive for 14 d. These protein samples were examined by immunoblot methods and compared with similar samples from four control animals (Fig. 5). The blots were scanned, and the relative intensities of immunolabeling of the 106 kDa protein and the 26 kDa protein were examined. There was no significant difference in the intensity of the 106 kDa band across all of the samples, indicating that the levels of α actinin were similar in all of the protein samples. Thus, there was no increase in α actinin associated with the cortical injury. When the 26 kDa band was examined, there were elevated levels of rTAPA in all of the protein samples from the injured cortex. To determine the extent of rTAPA upregulation, limiting dilutions of each sample were prepared, run on immunoblots, scanned, and analyzed to define the level of immunoreaction product. This analysis revealed an average fourfold increase in rTAPA in the protein samples from the injured cortex relative to the samples of the normal rat cortex. Using a Mann–Whitney U test, this increase in rTAPA was statistically significant at the p = 0.005 level. This difference represents an underestimate of the true upregulation of rTAPA, because all of the samples of the injured cortex were taken from cortical regions in which the stab wounds were spaced at a distance of ∼1 mm. Because the extent of elevated AMP1 immunoreactivity at the site of the stab wound ranges from 100 to 300 μm, the majority of the cortex in the sample would not display the highest level of rTAPA. Taken together, these data demonstrate a significant increase in rTAPA that is associated with reactive gliosis and CNS scar formation.
DISCUSSION
The AMP1 antibody recognizes two proteins on immunoblots, but only rTAPA on the external surface of cultured astrocytes. Expression cloning and biochemical methods identify both AMP1 antigens: a rat protein with a high degree of homology with human (Millake et al., 1989; Youssoufian et al., 1990) and chick (Waites et al., 1992) nonmuscle α actinin, and rTAPA related to the human lymphocyte protein TAPA-1 (Oren et al., 1990). Several lines of evidence demonstrate that AMP1 recognizes only rTAPA in cultured cells and in formalin-fixed tissue. Alpha-actinin is an actin-binding protein found in nonmuscle cells (for review, see Blanchard et al., 1989). In astrocytes, as with other cell types, α actinin is an intracellular protein, with no portion of the molecule exposed on the external surface of living cells (Abd-El-Basset et al., 1991). The sequence of the rat α actinin demonstrates that this AMP1 antigen is an intracellular protein, because no hydrophobic, transmembrane-spanning sequence was found (Jones et al., 1994). Thus, the only protein recognized by AMP1 on the external surface of astrocytes is rTAPA.
The rat α actinin is recognized by the AMP1 antibody only on immunoblots but not in cultured cells or formalin-fixed tissues. When intact cultures of astrocytes are stained with AMP1, the pattern of labeling is similar to that observed when the cells are made permeable with Triton X-100, suggesting that only one antigen is recognized by the antibody. Furthermore, when cultured astrocytes are stained with antibodies directed against α actinin (Abd-El-Basset et al., 1991), the pattern of immunoreactivity is quite different from that of AMP1 (Geisert et al., 1991) (E. Geisert, unpublished observation). When cultured astrocytes or rat brains are solubilized with detergents, both rTAPA and α actinin are present in the detergent extracts; however, the AMP1 antibody will only precipitate rTAPA. Finally, AMP1 antibody will recognize α actinin on immunoblots of protein samples from cells and tissues it will not stain: C6 glioma, human glioma (U373), or human brain (E. Geisert, unpublished observation). Taken together, these data demonstrate that the α actinin epitope is recognized by AMP1 when the protein is denatured and presented on nitrocellulose, and not when it is in its native state or in formalin-fixed tissues. Thus, the high levels of AMP1 immunoreactivity associated with reactive gliosis and the astrocytic scar are attributable solely to elevated levels of rTAPA.
rTAPA is a member of a family of proteins having four transmembrane domains with one major extracellular loop and with intracellular C- and N-terminal regions (Oren et al., 1990; Takahashi et al., 1990;Virtaneva et al., 1993; Dong et al., 1995). In addition to these structural features, many of these proteins (CD9, CD37, CD53, CD63, TAPA-1, CO-029, R2, and KAI1) have considerable sequence homology at the amino acid level. The best characterized member of this superfamily of proteins is the platelet protein CD9, which is also expressed at high levels by cells of the nervous system (Kaprielian and Patterson, 1993; Kaprielian et al., 1995). CD9 is found in peripheral neurons, Schwann cells, and chromaffin cells (Kaprielian et al., 1995). The antibody B2C11, which recognizes CD9 (Kaprielian et al., 1995), also labels astrocytes and oligodendrocytes within the rat CNS (Akeson and Warren, 1984). The results of the present study reveal that rTAPA, like CD9, is expressed in CNS glia. At the present time, there is no evidence that rTAPA is expressed in rat CNS neurons, either cultured rat cortical cells (Geisert et al., 1991) or neurons within the adult brain.
Although the specific functional role of the tetramembrane-spanning family is not fully defined, members of this family appear to associate with adhesion molecules and translate adhesive events into a regulation of cellular behavior (Yatomi et al., 1993). One family member, KAI1, is a metastatic suppressor for prostate cancer (Dong et al., 1995). The levels of this protein are low in metastatic prostate tumors, and expressing KAI1 in these cells suppresses their metastatic behavior (Dong et al., 1995). Other studies use antibody perturbation to define the functional role of tetramembrane-spanning family members. Bivalent antibodies directed against CD9 can be used to enhance adhesion of different cell types: pre-B cells (Masellis-Smith and Shaw, 1994), endothelial cells (Forsyth, 1991), and tumor cell mobility and invasiveness (Miyake et al., 1991). In the nervous system, the migratory behavior of Schwann cells over biologically relevant substrates can be enhanced with the application of antibodies directed against CD9 (Anton et al., 1995). In addition, treatment of Schwann cells with antibodies directed against CD9 promotes an increased mitotic rate (Hadjiargyrou and Patterson, 1995). The roles of CD9 in regulating adhesion and cell growth are reflected in its noncovalent association with β1 integrin, an adhesion molecule (Slupsky et al., 1989; Masellis-Smith and Shaw, 1994), and membrane-anchored EGF-like growth factors (Nakamura et al., 1995). Furthermore, activation of CD9 is associated with the hydrolysis of phosphoinositide during platelet activation (Jennings et al., 1990; Yatomi et al., 1993). Another member of the family, TAPA-1, is found in hematolymphoid cells. Antibodies directed against TAPA-1 depress the mitotic activity and induce an increase in cellular adhesion (Oren et al., 1990). TAPA-1 also is found in association with other membrane proteins (Schick and Levy, 1993), and antibody binding to TAPA-1 activates a tyrosine kinase (Schick et al., 1993). These data suggest that the members of the tetramembrane-spanning family, including TAPA-1, are involved in maintaining normal cell adhesion and in controlling the growth of cells.
In the present study, we observed that rTAPA is expressed at high levels at cell–cell contact, and the AMP1 antibody (directed against rTAPA) suppresses the mitotic activity of cultured glia. We also demonstrate a dramatic increase in the levels of rTAPA at the site of the glial scar. At first glance, these data appear to be difficult to reconcile, because an increase in mitotic activity is a minor part of the glial response to a cortical stab wound (Miyake et al., 1988;Takamiya et al., 1988) and reactive gliosis can occur in the spinal cord in the absence of a mitotic response (Murray et al., 1990). However, there are dramatic similarities between the in vitro and in vivo paradigms. In both cases, high levels of rTAPA are associated with low mitotic activity and stable cellular contact; in vitro, this occurs as the cells become confluent and are contact-inhibited, and in vivo, the elevated levels of rTAPA are observed as the processes of the reactive astrocytes are forming a glial scar. The only data that appear to be in conflict with these results is the effect of the AMP1 antibody on low-density cultures of glial cells. When the AMP1 antibody binds to rTAPA, the mitotic activity is downregulated. At the present time, we have not defined the molecular mechanism responsible for this effect; however, our current working hypothesis is that AMP1 antibody is fooling the cell into believing that it is surrounded by other cells (contact-inhibited). Taken together, these data suggest the rTAPA has a functional role similar to that of other members of the tetramembrane-spanning family of proteins, controlling growth and stabilizing cell contacts. This is supported by the observations that C6 glioma, which lack detectable levels of rTAPA, do not form stable contacts with each other and do not regulate their growth.
The high levels of rTAPA at the glial scar suggest they play a prominent role in reactive gliosis and scar formation. One of the most impressive aspects of a glial scar is the ordered meshwork of hypertrophied astrocytic processes (Reier and Houle, 1988). This ordered array of parallel processes is a strong indication that a recognition process is controlling the formation of the astrocytic scar. Astrocytes are known to express a number of adhesion molecules: N-CAM (Nobel et al., 1985; Geisert et al., 1991), N-Cadherin (Matsunaga et al., 1988), and members of the β1 integrins (Greve and Gottlieb, 1982; Geisert et al., 1991; Tawil et al., 1994). When examining the distribution of these molecules at the light microscopic level, there is no dramatic upregulation of these adhesion molecules. There is an increase in the highly glycosilated embryonic form of N-CAM (Le Gal La Salle et al., 1992); however, only a modest increase in total N-CAM (Irwin and Geisert, 1993) is seen at the site of CNS injury. In the present study, we demonstrate that the membrane protein rTAPA is upregulated after injury to the same extent as GFAP, the hallmark of reactive gliosis. We currently are conducting experiments to define the molecular interactions of rTAPA and its functional role during reactive gliosis.
Footnotes
This work was supported by the Spinal Cord Society and the University of Tennessee Health Science Center. We thank Ms. Kelly Morrison and Dr. John Baker for their assistance with amino acid sequencing, Allison Stewart for her technical assistance, Thomas P. Murphy for his work on screening the expression libraries, and Dr. Dan Goldowitz for his comments on this manuscript. We also thank Dr. Keith Burridge and Dr. Galen Schneider for the gift of the antibody directed against α actinin. We are grateful to Dr. Mike Dockter and to the Macromolecular Sequencing Laboratory of the Molecular Resource Center, University of Tennessee, Memphis, TN, for supporting the automated DNA sequencing and oligonucleotide synthesis.
Correspondence should be addressed to Eldon E. Geisert Jr., Department of Anatomy and Neurobiology, 855 Monroe Avenue, University of Tennessee, Memphis, TN 38163.
REFERENCES
- 1.Abd-El-Basset EM, Ahmed I, Fedoroff S. Actin and actin-binding proteins in differentiating astroglia in tissue culture. J Neurosci Res. 1991;30:1–17. doi: 10.1002/jnr.490300103. [DOI] [PubMed] [Google Scholar]
- 2.Akeson R, Warren SL. Detection of a cell surface antigen found on rat peripheral nervous system neurons and multiple glia: astrocytes, oligodendrocytes, and Schwann cells. J Neurosci Res. 1984;12:41–57. doi: 10.1002/jnr.490120105. [DOI] [PubMed] [Google Scholar]
- 3.Anton ES, Hadjiargyrou M, Patterson PH, Matthew WD. CD9 plays a role in Schwann cell migration in vitro. J Neurosci. 1995;15:584–595. doi: 10.1523/JNEUROSCI.15-01-00584.1995. [DOI] [PMC free article] [PubMed] [Google Scholar]
- 4.Bignami A, Dahl D. The astroglial response to stabbing. Immunofluorescence studies with antibodies to astrocyte-specific protein (GFA) in mammalian and submammalian vertebrates. Neuropathol Appl Neurobiol. 1976;2:99–111. [Google Scholar]
- 5.Blanchard A, Ohanian V, Critchley D. The structure and function of alpha-actinin. J Muscle Res Cell Motil. 1989;10:280–289. doi: 10.1007/BF01758424. [DOI] [PubMed] [Google Scholar]
- 6.Caroni P, Schwab ME. Antibody against myelin-associated inhibitor of neurite growth neutralizes non-permissive substrate properties of CNS white matter. Neuron. 1988;1:85–96. doi: 10.1016/0896-6273(88)90212-7. [DOI] [PubMed] [Google Scholar]
- 7.Darongsuwan T (1987) Effects of anti-white matter antiserum on growth and morphology of cultured astrocytes. Master’s thesis, University of Alabama at Birmingham.
- 8.Dong JT, Lamb PW, Rinker-Shaeffer CW, Vukanovic J, Ichikawa T, Isaacs JR, Barrett JC. KAI1, a metastasis suppressor gene for prostate cancer on human chromosome 11p11.2. Science. 1995;268:884–886. doi: 10.1126/science.7754374. [DOI] [PubMed] [Google Scholar]
- 9.Eng LF, Vanderhaegen JJ, Bignami A, Grestl B. An acidic protein isolated from fibrous astrocytes. Brain Res. 1971;28:351–354. doi: 10.1016/0006-8993(71)90668-8. [DOI] [PubMed] [Google Scholar]
- 10.Forsyth KD. Anti-CD9 antibodies augment neutrophil adherence to endothelium. Immunology. 1991;72:292. [PMC free article] [PubMed] [Google Scholar]
- 11.Geisert EE, Jr, Alley CD. Antiserum-induced growth of axons across lesions of the adult rat brain. Brain Res Bull. 1985;15:19–28. doi: 10.1016/0361-9230(85)90056-5. [DOI] [PubMed] [Google Scholar]
- 12.Geisert EE, Jr, Bidanset DJ. A central nervous system keratan sulfate proteoglycan: localization to boundaries in the neonatal rat brain. Dev Brain Res. 1993;75:163–173. doi: 10.1016/0165-3806(93)90020-b. [DOI] [PubMed] [Google Scholar]
- 13.Geisert EE, Jr, Stewart AM. Changing interactions between astrocytes and neurons during CNS maturation. Dev Biol. 1991;143:335–345. doi: 10.1016/0012-1606(91)90084-g. [DOI] [PubMed] [Google Scholar]
- 14.Geisert EE, Jr, Darongsuwan T, Binder LI. Anti-white matter antiserum alters astrocytic growth. Cell Biol Abstr. 1986;103:229. [Google Scholar]
- 15.Geisert EE, Jr, Johnson HG, Binder LI. Expression of microtubule-associated protein 2 by reactive astrocytes. Proc Natl Acad Sci USA. 1990;87:3967–3971. doi: 10.1073/pnas.87.10.3967. [DOI] [PMC free article] [PubMed] [Google Scholar]
- 16.Geisert EE, Jr, Murphy TP, Irwin MH, Larjava H. A novel cell adhesion molecule, G-CAM, found on cultured rat glia. Neurosci Lett. 1991;133:262–266. doi: 10.1016/0304-3940(91)90584-g. [DOI] [PubMed] [Google Scholar]
- 17.Greve JM, Gottlieb DI. Monoclonal antibodies which alter the morphology of cultured chick myogenic cells. J Cell Biochem. 1982;18:221–229. doi: 10.1002/jcb.1982.240180209. [DOI] [PubMed] [Google Scholar]
- 18.Hadjiargyrou M, Patterson PH. An anti-CD9 monoclonal antibody promotes adhesion and induces proliferation of Schwann cells in vitro. J Neurosci. 1995;15:574–583. doi: 10.1523/JNEUROSCI.15-01-00574.1995. [DOI] [PMC free article] [PubMed] [Google Scholar]
- 19.Irwin MH, Geisert EE., Jr Upregulation of a glial cell surface antigen at the CNS scar in the rat. Neurosci Lett. 1993;154:57–60. doi: 10.1016/0304-3940(93)90170-p. [DOI] [PubMed] [Google Scholar]
- 20.Jennings LK, Fox CF, Kouns WC, Mckay CP, Ballou LR, Schults HE. The activation of human platelets mediated by anti-human platelet p24/CD9 monoclonal antibodies. J Biol Chem. 1990;265:3815–3822. [PubMed] [Google Scholar]
- 21.Jones DT, Taylor WR, Thornton JM. A model recognition approach to the prediction of all-helical membrane protein structure and topology. Biochemistry. 1994;33:3038–3049. doi: 10.1021/bi00176a037. [DOI] [PubMed] [Google Scholar]
- 22.Kaprielian Z, Patterson PH. Surface and cytoskeletal markers of rostrocaudal position in the mammalian nervous system. J Neurosci. 1993;13:2495–2508. doi: 10.1523/JNEUROSCI.13-06-02495.1993. [DOI] [PMC free article] [PubMed] [Google Scholar]
- 23.Kaprielian Z, Cho K-O, Hadjiargyrou M, Patterson PH. CD9, a major platelet cell surface glycoprotein, is a ROCA antigen and is expressed in the nervous system. J Neurosci. 1995;15:562–573. doi: 10.1523/JNEUROSCI.15-01-00562.1995. [DOI] [PMC free article] [PubMed] [Google Scholar]
- 24.Laywell ED, Dorries U, Bartsch U, Faissner A, Schachner M, Steindler DA. Enhanced expression of the developmentally regulated extracellular matrix molecule tenascin following adult brain injury. Proc Natl Acad Sci USA. 1992;89:2634–2638. doi: 10.1073/pnas.89.7.2634. [DOI] [PMC free article] [PubMed] [Google Scholar]
- 25.Le Gal La Salle G, Rougon G, Valin A. The embryonic form of neural cell surface molecule (E-NCAM) in the rat hippocampus and its reexpression on glial cells following kainic acid-induced status epilepticus. J Neurosci. 1992;12:872–882. doi: 10.1523/JNEUROSCI.12-03-00872.1992. [DOI] [PMC free article] [PubMed] [Google Scholar]
- 26.Liesi P, Silver J (1988) Is astrocyte laminin involved in axon guidance in the mammalian CNS? Dev Biol 130: 774–785. [DOI] [PubMed]
- 27.Masellis-Smith A, Shaw ARE. Anti-CD9 monoclonal antibody induce pre-B cell adhesion to bond marrow fibroblasts through de novo recognition of fibronectin. J Immunol. 1994;152:2768–2777. [PubMed] [Google Scholar]
- 28.Matsunaga M, Hatta K, Nagafuchi A, Takeichi M. Guidance of optic nerve fibers by N-cadherin adhesion molecules. Nature. 1988;334:62–64. doi: 10.1038/334062a0. [DOI] [PubMed] [Google Scholar]
- 29.McCarthy KD, de Vellis J. Preparation of separate astroglial and oligodendroglial cell cultures from rat cerebral tissue. J Cell Biol. 1980;85:890–902. doi: 10.1083/jcb.85.3.890. [DOI] [PMC free article] [PubMed] [Google Scholar]
- 30.McKeon RJ, Schreiber RC, Rudge JS, Silver J. Reduction of neurite outgrowth in a model of glial scarring following CNS injury is correlated with the expression of inhibitory molecules on reactive astrocytes. J Neurosci. 1991;11:3389–3411. doi: 10.1523/JNEUROSCI.11-11-03398.1991. [DOI] [PMC free article] [PubMed] [Google Scholar]
- 31.McKerracher L, David S, Jackson DL, Kottis V, Dunn RJ, Braun PE. Identification of myelin-associated glycoprotein as a major myelin-derived inhibitor of neurite growth. Neuron. 1994;13:805–811. doi: 10.1016/0896-6273(94)90247-x. [DOI] [PubMed] [Google Scholar]
- 32.Millake DB, Blanchard AD, Patel B, Critchley DR. The cDNA sequence of human placental alpha-actinin. Nucleic Acids Res. 1989;17:6725–6725. doi: 10.1093/nar/17.16.6725. [DOI] [PMC free article] [PubMed] [Google Scholar]
- 33.Miyake T, Hattori T, Fukuda M, Kitamura T, Fujita S. Quantitative studies on proliferative changes of reactive astrocytes in mouse cerebral cortex. Brain Res. 1988;451:133–138. doi: 10.1016/0006-8993(88)90757-3. [DOI] [PubMed] [Google Scholar]
- 34.Miyake M, Koyama M, Seno M, Ikeyama S. Identification of the motility-related proteins (MRP-1), recognized by monoclonal antibody M31–15, which inhibits cell motility. J Exp Med. 1991;174:1347. doi: 10.1084/jem.174.6.1347. [DOI] [PMC free article] [PubMed] [Google Scholar]
- 35.Mukhopadhyay G, Doherty P, Walsh FS, Crocker PR, Filbin MT. A novel role for myelin-associated glycoprotein as an inhibitor of axonal regeneration. Neuron. 1994;13:757–767. doi: 10.1016/0896-6273(94)90042-6. [DOI] [PubMed] [Google Scholar]
- 36.Murray M, Wang S-D, Goldberger ME, Levitt P. Modification of astrocytes in the spinal cord following dorsal root or peripheral nerve lesions. Exp Neurol. 1990;110:248–257. doi: 10.1016/0014-4886(90)90036-r. [DOI] [PubMed] [Google Scholar]
- 37.Nakamura K, Iwamoto R, Mekada E. Membrane-anchored heparin-binding EGF-like growth factor (HB-EGF) and diphtheria toxin receptor-associated protein (DRAP27)/CD9 forms a complex with integrin α3β1 at cell-cell contact sites. J Cell Biol. 1995;129:1691–1705. doi: 10.1083/jcb.129.6.1691. [DOI] [PMC free article] [PubMed] [Google Scholar]
- 38.Noble M, Albrechtsen M, Moler C, Lyles J, Bock E, Goridis C, Watanabe M, Rutishauser U. Glial cells express N-CAM/D2-CAM-like polypeptides in vitro . Nature. 1985;316:725–728. doi: 10.1038/316725a0. [DOI] [PubMed] [Google Scholar]
- 39.Oren R, Takahashi S, Doss C, Levy R, Levy S. TAPA-1, the target of an antiproliferative antibody, defines a new family of transmembrane proteins. Mol Cellular Biol. 1990;10:4007–4015. doi: 10.1128/mcb.10.8.4007. [DOI] [PMC free article] [PubMed] [Google Scholar]
- 40.Peduzzi JD, Irwin MH, Geisert EE., Jr Distribution and characteristics of a 90 kDa protein, KG-CAM in the rat CNS. Brain Res. 1994;640:296–307. doi: 10.1016/0006-8993(94)91885-6. [DOI] [PubMed] [Google Scholar]
- 41.Reier PJ. Gliosis following CNS injury: the anatomy of astrocytic scars and their influences on axonal elongation. In: Fedoroff S, Vernadakis A, editors. Astrocytes, Vol. 3. Academic; Orlando: 1986. pp. 263–324. [Google Scholar]
- 42.Reier PJ, Houle JD. The glial scar: its bearing on axonal regeneration and transplantation approaches to CNS repair. In: Waxman SG, editor. Advances in neurology: functional recovery in neurological diseases. Raven; New York: 1988. pp. 87–138. [PubMed] [Google Scholar]
- 43.Rudge JS, Silver J. Inhibition of neurite outgrowth on astroglial scars in vitro. J Neurosci. 1990;10:3594–3603. doi: 10.1523/JNEUROSCI.10-11-03594.1990. [DOI] [PMC free article] [PubMed] [Google Scholar]
- 44.Schick MR, Levy S. The TAPA-1 molecule is associated on the surface of B cells with HLA-DR molecules. J Immunol. 1993;151:4090–4097. [PubMed] [Google Scholar]
- 45.Schick MR, Nguyen VQ, Levy S. Anti-TAPA-1 antibodies induce protein tyrosine phosphorylation that is prevented by increasing intracellular thiol levels. J Immunol. 1993;151:1918–1925. [PubMed] [Google Scholar]
- 46.Slupsky JR, Seehafer JG, Tang S-C, Masellis-Smith A, Shaw ARE. Evidence that monoclonal antibodies against CD9 antigen induce specific association between CD9 and the platelet glycoprotein IIb-IIIa complex. J Biol Chem. 1989;264:12289–12293. [PubMed] [Google Scholar]
- 47.Smith GM, Jacobberger JW, Miller RH. Modulation of adhesion molecule expression on rat cortical astrocytes during maturation. J Neurochem. 1993;60:1453–1466. doi: 10.1111/j.1471-4159.1993.tb03308.x. [DOI] [PubMed] [Google Scholar]
- 48.Takahashi S, Doss C, Levy S, Levy R. TAPA-1, the target of an antiproliferative antibody is associated on the cell surface with the Leu-13 antigen. J Immunol. 1990;145:2207–2213. [PubMed] [Google Scholar]
- 49.Takamiya Y, Kohsaka S, Toya S, Otani M, Tsukada Y. Immunohistochemical studies on the proliferation of reactive astrocytes and the expression of cytoskeletal proteins following brain injury in rats. Dev Brain Res. 1988;38:201–210. doi: 10.1016/0165-3806(88)90045-4. [DOI] [PubMed] [Google Scholar]
- 50.Tawil NJ, Wilson P, Carbonetto S. Expression and distribution of functional integrins in rat CNS glia. J Neurosci Res. 1994;39:436–447. doi: 10.1002/jnr.490390411. [DOI] [PubMed] [Google Scholar]
- 51.Virtaneva KI, Angelisová P, Baumruker T, Horejsi V, Nevaninna H, Schröder J. The gene for CD37, CD53, and R2, all members of a novel gene family, are located on different chromosomes. Immunogenetics. 1993;37:461–465. doi: 10.1007/BF00222471. [DOI] [PubMed] [Google Scholar]
- 52.Waites GT, Graham IR, Jackson P, Millake DB, Patel B, Blanchard AD, Weller PA, Eperon IC, Critchley DR. Mutually exclusive splicing of calcium-binding domain exons in chick alpha-actinin. J Biol Chem. 1992;267:6263–6271. [PubMed] [Google Scholar]
- 53.Yatomi Y, Ozaki Y, Satoh K, Kume S. Anti-CD9 monoclonal antibody elicits staurosporine inhibitable phosphatidylinositol 4,5-bisphosphate hydrolysis, phosphatidylinositol 3,4-bisphosphate synthesis, and protein-tyrosine phosphorylation in human platelets. FEBS Lett. 1993;322:285–290. doi: 10.1016/0014-5793(93)81587-p. [DOI] [PubMed] [Google Scholar]
- 54.Youssoufian H, McAfee M, Kwiatkowski DJ. Cloning and chromosomal localization of the human cytoskeletal alpha-actinin gene reveals linkage to the beta-spectrin gene. Am J Hum Genet. 1990;47:62–71. [PMC free article] [PubMed] [Google Scholar]