Abstract
Opioid-produced antinociception in mammals seems to be mediated in part by pathways originating in the periaqueductal gray (PAG) and the rostroventral medulla (RVM), and these pathways may include serotonergic neurons. In the present study, we examined the relationship of the cloned μ- and δ-receptors (MOR1 and DOR1, respectively) to PAG neurons projecting to the RVM, and RVM neurons projecting to the dorsal spinal cord. This was carried out by combining immunocytochemical staining for MOR1, DOR1, and serotonin with fluorescent retrograde tract-tracing. Of 133 retrogradely labeled cells in the RVM, 31% were immunoreactive for MOR1. Of the double-labeled cells, 41% also were immunoreactive for 5HT. Fifty-three percent of retrogradely labeled cells were apposed by DOR1-ir varicosities; 29% of the apposed cells were immunoreactive for 5HT. In the mesencephalon, cells retrogradely labeled from the RVM were usually surrounded by MOR1-ir structures; however, retrogradely labeled cells were never observed to be immunoreactive for MOR1. Similarly, retrogradely labeled cells in the caudal midbrain were seldom, if ever, labeled for DOR1; however, they frequently were apposed by DOR1-ir varicosities. Of 156 retrogradely labeled profiles from three rats, 52 (33%) were apposed by DOR1-ir varicosities. We conclude that both μ- and δ-opioid receptors could be involved in the antinociception mediated by the PAG–RVM–spinal cord circuit. In addition, opioids seem likely to have both direct and indirect effects on spinally projecting RVM cells in general, and on serotonergic RVM cells in particular.
Keywords: μ-opioid receptors, δ-opioid receptors, serotonin, immunocytochemistry, pain, antinociception, retrograde tract-tracing, confocal microscopy
Opioid-produced antinociception in mammals seems to be mediated in part by descending pathways originating from several sites, including the periaqueductal gray (PAG) and the rostroventral medulla (RVM). It has been proposed that activation of cells in PAG excites spinally projecting neurons in the RVM, which in turn inhibit nociceptive cells in the spinal cord (Basbaum and Fields, 1978, 1984;Fields and Basbaum, 1978). Some neurons in the RVM and PAG contain serotonin (Dahlström and Fuxe, 1964; Steinbusch, 1981), and these cells may be at least partially responsible for the antinociceptive functions of these regions (Rivot et al., 1988).
Distinct classes of cells that have different responses to opiates and to noxious stimuli have been identified in these regions. “ON-cells” are excited by pinch, commence firing just before a tail-flick response, and are inhibited by opiate analgesics. “OFF-cells” are inhibited by pinch, cease firing just before a tail-flick response, and are excited by opiate analgesics (Fields et al., 1991). Because electrical stimulation in either the PAG or the RVM produces antinociceptive responses (Reynolds, 1969; Oliveras et al., 1975; Proudfit and Anderson, 1975), it seems that excitation of projection neurons (either from the RVM to the spinal dorsal horn or from the PAG to the RVM) is sufficient to induce antinociception. Because OFF-cells are excited by opioids, they have been proposed to be mediators of the bulbospinal component of opiate analgesia (Fields et al., 1991)
Opioid receptors have been localized to the PAG and to nucleus raphe magnus (NRM) in the RVM using ligand-binding autoradiography (Mansour et al., 1987; Tempel and Zukin, 1987; Bowker and Dilts, 1988), immunocytochemistry (Arvidsson et al., 1995a,b; Mansour et al., 1995), and electrophysiology (Pan et al., 1990, 1993; Chieng and Christie, 1994a,b; Osborne et al., 1996); however, the precise relationship of opioid receptors to the circuitry of these regions is not known. The cellular effects of activation of opioid receptors are predominantly inhibitory (Duggan and North, 1984; McFadzean, 1988), suggesting that the excitatory effects of opioids in the midbrain and the RVM are indirect; that is, excitation of these cells may be the result of the inhibition of an inhibitory input (Yaksh et al., 1976; Pan et al., 1993; Chieng et al., 1994a,b; Osborne et al., 1996). It has been proposed that OFF-cells are indirectly excited by opioids in this fashion and that at least some serotonergic neurons are OFF-cells (Fields et al., 1991), although evidence against the latter has also been presented (Potrebic et al., 1994).
In the present study, we examined the relationship of opioid receptors to the PAG–RVM–spinal cord system by combining immunocytochemical staining for μ- and δ-opioid receptors in the PAG and RVM with retrograde tract-tracing from the RVM and the spinal cord. In addition, we examined the distribution of these opioid receptors with respect to neurons immunoreactive for serotonin. We found evidence that both μ- and δ-opioid receptors may affect these neurons and that those receptors may exert their effects both indirectly and directly.
MATERIALS AND METHODS
Sprague Dawley rats (150–200 gm; Harlan, Madison, WI) were used in all experiments. For retrograde labeling of neurons projecting from the PAG to the NRM, rats were first anesthetized by intramuscular injection of a mixture of ketamine (75 mg/kg), xylazine (5 mg/kg), and acepromazine (1 mg/kg). An incision was made over the cisterna magna, and a hole (∼3 mm wide and 7 mm long) was cut on the caudal midline of the occipital plate using bone rongeurs. The dura was opened, and, if necessary to expose the obex, the caudal-most portion of the cerebellar vermis was gently displaced rostrally. A micropipette filled with 3% hydroxystilbamidine [Fluoro-Gold (FG); Fluorochrome, Inc., Englewood, CO] (Schmued and Fallon, 1986; Wessendorf, 1991) in 0.9% NaCl was advanced through the cerebellum into NRM using coordinates of 3.5 mm rostral and 4.0 mm ventral to the obex, and with the electrode positioned at an angle of +15° from vertical. Injections were made using a constant positive current (2–6 μA) applied for 2–10 min using a high-compliance current source (Model CS-3; Stoelting, Chicago, IL). Animals were allowed to survive 2–3 d before they were killed. Injection micropipettes were pulled from 1.5 mm outer diameter, 1.2 mm inner diameter glass capillary tubing using a Narishige puller (PE-2; Narishige, Tokyo, Japan). Tips were trimmed to a diameter of ∼30 μm.
To label bulbospinal neurons, FG was applied topically to the surface of the lumbar spinal cord. The skin was opened at the level of the 13th rib, a laminectomy was performed, and the dura was opened. To facilitate FG labeling, the dorsal surface of the spinal cord was abraded very gently using the sharpened end of a wooden swab. Two microliters of a 10% solution of FG in DMSO were absorbed into a piece of gelfoam (∼8 mm3) and placed on the surface of the spinal cord. The skin was closed, and rats were allowed to survive 3–4 d before they were killed. Ninety minutes before they were killed, rats that had been administered FG on the lumbar spinal cord were loaded with an MAO inhibitor and tryptophan to improve the intensity of staining in serotonergic somata. Rats were administered tranylcypromine (Sigma, St. Louis, MO), 60 mg/kg i.p., followed 30 min later by 300 mg/kg tryptophan (Sigma); 30–60 min after the tryptophan injection rats were killed by being anesthetized deeply with chloral hydrate (350 mg/kg, i.p.) and fixed by vascular perfusion. The fixative was composed of 4% formaldehyde and 14% (v/v) saturated picric acid in 0.16 m phosphate buffer, pH 6.9. Seven hundred milliliters of fixative were followed by 400 ml of 10% sucrose solution in 0.1 m phosphate buffer, pH 7.2. Tissue was sectioned at 10 μm using a Bright cryostat (Huntington) or at 50 μm using a freezing microtome.
Sections were processed for immunofluorescence double-labeling using antisera against 5HT raised in goat (Incstar, Stillwater, MN) combined with rabbit antisera directed against either the cloned μ-opioid receptor (MOR1: Arvidsson et al., 1995b) or the cloned δ-opioid receptor (DOR1: Dado et al., 1993). Cryostat sections were incubated overnight at +4°C with goat anti-5HT, diluted 1:600, mixed with either rabbit anti-DOR1 (1:600) or rabbit anti-MOR1 (1:600). Sections were then washed in PBS (15 min × 3) at room temperature and incubated for 1 hr at room temperature with the secondary antibodies. The secondary antibodies that were used were donkey anti-goat conjugated with either FITC or cyanine 5.18 (Cy5, 1:100), donkey anti-rabbit conjugated with cyanine 3.18 (Cy3, 1:100; MOR1-staining), or donkey anti-rabbit conjugated with Lissamine rhodamine (1:100; DOR1-staining). All secondary antibodies were obtained from Jackson Immunoresearch Laboratories (West Grove, PA). After incubation with secondary antibodies, sections were washed with PBS (15 min × 3) and coverslipped.
Fifty micrometer frozen sections were incubated by allowing them to float freely in antisera diluted as follows: 1:1000 for 5HT, 1:2000 for DOR1, and 1:5000 for MOR1. Sections were incubated in primary antisera for 40–70 hr at +4°C with gentle agitation. Sections were then washed in PBS (1 hr × 3) at room temperature and incubated for 24 hr at +4°C with secondary antibodies, using the same reagents and dilutions as for cryostat sections. Sections were washed in three changes of PBS for 1 hr each, mounted onto gel-coated slides, dried, and coverslipped.
Absorption controls were performed using sections immediately adjacent to those processed for normal staining. In absorption controls, 10 μg of the peptide against which the antiserum was raised was added to each milliliter of diluted antiserum. Multiple labeling can be obtained artifactually if there is lack of specificity of the fluorophores and filters, the secondary antibodies, or the primary antibodies (Wessendorf et al., 1990; Wessendorf and Brelje, 1993). The multiple labeling obtained in these studies did not seem to be artifactual.
Cryostat and frozen sections were coverslipped either with a PBS/glycerol solution containing 0.1% phenylenediamine to reduce fading of FITC (Johnson and de C Nogueria Araujo, 1981) or with DPX (Fluka, Ronkonkoma, NY) if sections were not stained with FITC.
For quantification of MOR1 and DOR1-ir appositions in the midbrain and the RVM, cryostat sections were used. MOR1 and DOR1 varicosities were regarded as apposing FG neurons if no distance was discernible between the varicosity and the cell in question, using a 40×, 0.85 NA objective. Physiological studies suggest that antinociceptive effects are evoked largely from sites in or adjacent to the ventral lateral portion of the PAG. For that reason, quantitative studies in the midbrain used cells in the ventral lateral portion of the PAG and in the adjacent reticular formation.
Both conventional and confocal microscopy were used in this study. Conventional wide-field microscopic images were collected on an Olympus BH-2 fluorescence microscope equipped with an Optiquip model 1200 illuminator (Highland Mills, NY) and a 200 W Ushio Xe-Hg lamp. The filter sets were designed to allow selective visualization of FITC, Lissamine rhodamine, cyanine 5.18, and FG. Filter bandpasses were as follows: fluorescein, 460–490 nm excitation and 510–550 emission; Cy3 or Lissamine rhodamine, 545–551 nm excitation and 572–607 nm emission; and Cy5, 615–635 nm excitation and 655 nm longpass emission. Digital conventional microscopic images were collected using a Cohu 4915 CCD camera (Cohu, San Diego, CA), a Power Macintosh 7100 computer equipped with a frame grabber (model LG-3; Scion Corporation, Frederick, MD), and Scion Corporation’s version of the public domain National Institutes of Health (NIH) Image program [developed at NIH and available from the Internet by anonymous FTP fromzippy.nimh.nih.gov or on floppy disk from the National Technical Information Service (Springfield, VA), part number PB95-500195GEI].
Confocal images were collected using a Bio-Rad MRC600 or MRC1000 confocal scanning laser microscope equipped with a Kr/Ar-ion laser (Bio-Rad, Richmond, CA). The microscope was equipped with filters for the selective visualization of FITC, Lissamine rhodamine, and Cy5, or of Cy3 and Cy5. Images were collected using 4× (NA 0.20), 10× (NA 0.5 or 0.45), 20× (NA 0.75), and 60× (NA 1.4) objectives.
Digital images were manipulated using Adobe Photoshop (version 3.0.4) and printed on a Fuji Pictography 3000 color printer. In some cases, images were obtained for comparison (e.g., in the case of normal staining and absorption controls; see Figs. 3, 5, 8, 10). If so, the comparable images were manipulated identically, using the same adjustments to contrast and brightness.
Fig. 3.
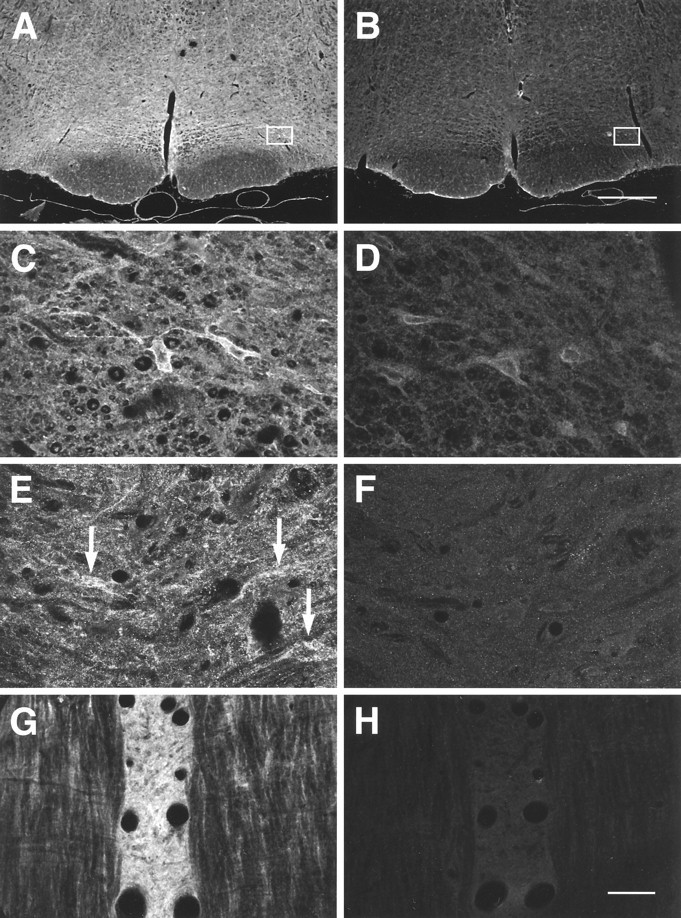
Confocal images of MOR1 labeling of free floating (A–D) and cryostat (E–H) sections through the RVM. A–F are coronal sections;G and H are horizontal sections.A, C, E, G, Normal MOR1 labeling; B, D, F, H, MOR1 absorption controls performed on sections adjacent toA, C, E, and G, respectively. C, D, Higher-magnification images from nucleus gigantocellularis pars α, as outlined on A and B, respectively. Note the presence of MOR1-ir cells (C).E, F, Images taken of a coronal section at the level of the caudal trapezoid body, showing MOR1-ir cells and processes in NRM.G, H, Horizontal section showing MOR1-ir within ventral NRM or nucleus raphe pallidus. Note density of labeling of neuropile. MOR1 labeling of cell membranes and cytoplasm in the RVM was reduced in absorption controls, although nuclear staining was not affected and thus was assumed to be nonspecific (D; also see text). Scale bars: A, B, 500 μm; C–H, 30 μm.
Fig. 5.
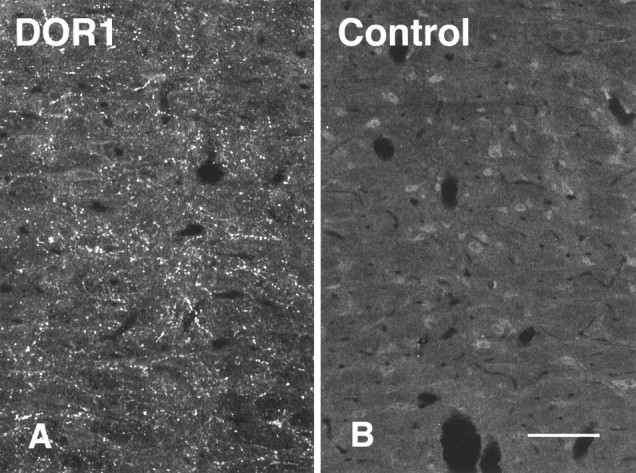
Images of adjacent sections through NRM stained with either the DOR1 antiserum (A) or the DOR1 antiserum to which was added 10 μg/ml of the peptide against which the antiserum was raised (B). Specific labeling was reduced or abolished in the absorption control. Scale bar, 50 μm.
Fig. 8.
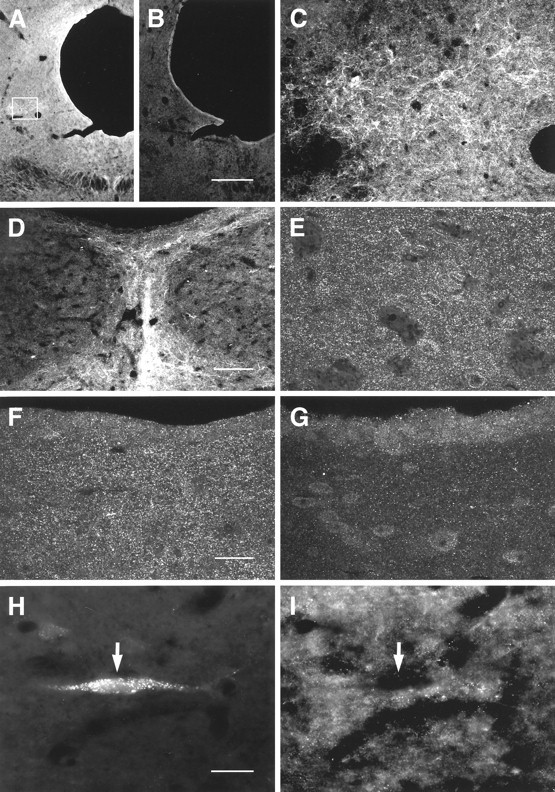
Images of MOR1-immunoreactivity obtained by confocal (A–G, 50 μm frozen sections) and conventional (H, I, 10 μm cryostat sections) microscopy in caudal PAG. A, Low-magnification image showing distribution of MOR1 staining. Labeling is reduced or absent in absorption control (B). C, Higher-magnification image of MOR1-ir cells and processes observed within the lateral PAG (box outlined onA). D, Densely packed MOR1-ir processes were observed in the caudal-most PAG, in the vicinity of nucleus raphe dorsalis. E, F, Higher-magnification images of lateral (E) and ventral (F) PAG. These regions contained small MOR1-ir processes that resembled axonal varicosities. G, Absorption control using a section serially adjacent to that in F. Most of the labeling seen in F was absent in absorption controls. H, I, Relationship of MOR1-ir to retrograde labeling from the RVM. FG-labeled neurons (H) were never observed to be labeled for MOR1 (I, arrow). Scale bars: A, B, 300 μm; C, D, 75 μm; E–G, 25 μm; H, I, 30 μm.
Fig. 10.
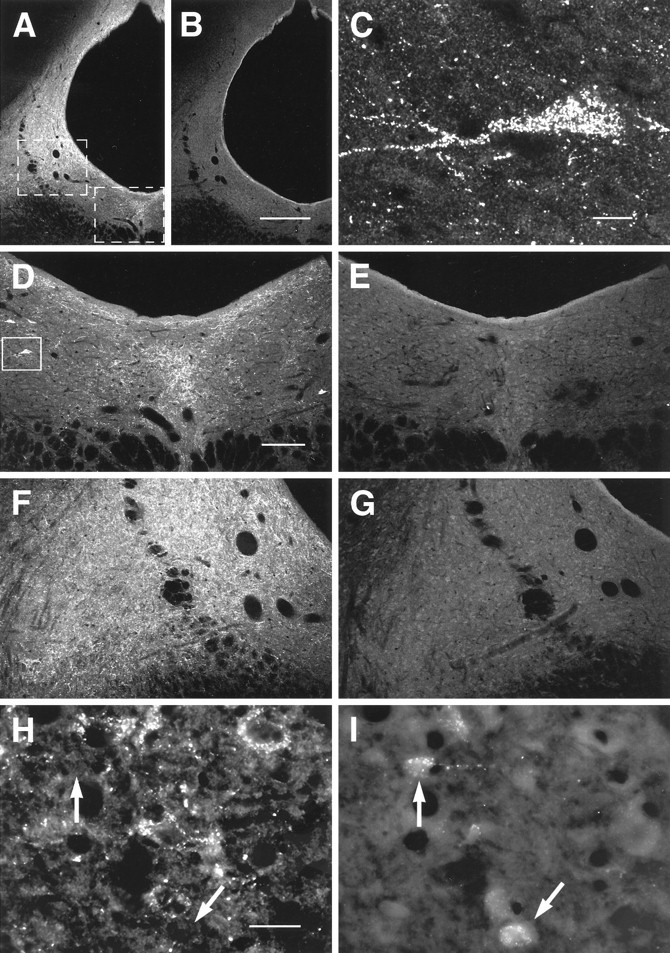
Images of DOR1-ir in caudal PAG obtained by confocal (A–G, 50 μm frozen sections) and conventional microscopy (H, I, 10 μm cryostat sections). A, B, Low-magnification overview of DOR1-ir in PAG and adjacent reticular formation. Labeled structures generally seemed to be varicosities, but some cells were also present.A, DOR1-ir; B, absorption control, serially adjacent to section shown in A. DOR1 staining was reduced or abolished in absorption controls. C, DOR1-ir cell. Image was taken from the region outlined inD. D, E, Higher-magnification views of ventral medial PAG. Area shown is outlined onA. D, DOR1-ir; E, absorption control, serially adjacent to section shown inD. F, G, Higher-magnification views of ventral lateral PAG. Area shown is outlined onA. F, DOR1-ir; G, absorption control, serially adjacent to section shown inF. H, I, DOR1-ir cells were rarely, if ever, retrogradely labeled from the RVM. H, DOR1-ir;I, FG. Arrows point to retrogradely labeled cells. Scale bars: A, B, 300 μm;C, 10 μm; D–G, 150 μm; H, I, 30 μm.
Specificity of antisera. The specificity of the staining obtained using the MOR1 and DOR1 antibodies has been examined both in earlier papers and in the present investigation. Previous studies of the MOR1 antiserum showed that it stained COS cells transfected with MOR1, stained a band on an immunoblot to which125I-β-endorphin bound, and labeled brain sections in a pattern that mirrored the pattern observed in ligand-binding studies (Arvidsson et al., 1995b). In the present study, immunocytochemical labeling for MOR1 in the brainstem agreed with the distribution of μ-opioid receptors reported in binding (Mansour et al., 1987; Tempel and Zukin, 1987; Bowker and Dilts, 1988), immunocytochemical (Ding et al., 1996), and physiological experiments (Pan et al., 1990; Kiefel et al., 1993; Pan et al., 1993; Rossi et al., 1993, 1994). Moreover, absorption controls abolished staining of the neuropile, the cell cytoplasm, and the cell membrane (see Figs. 2 and 3); however, some staining of cell nuclei remained in absorption controls (see Fig.3D), and as a result, any nuclear staining observed in the present study was regarded as artifactual.
Fig. 2.
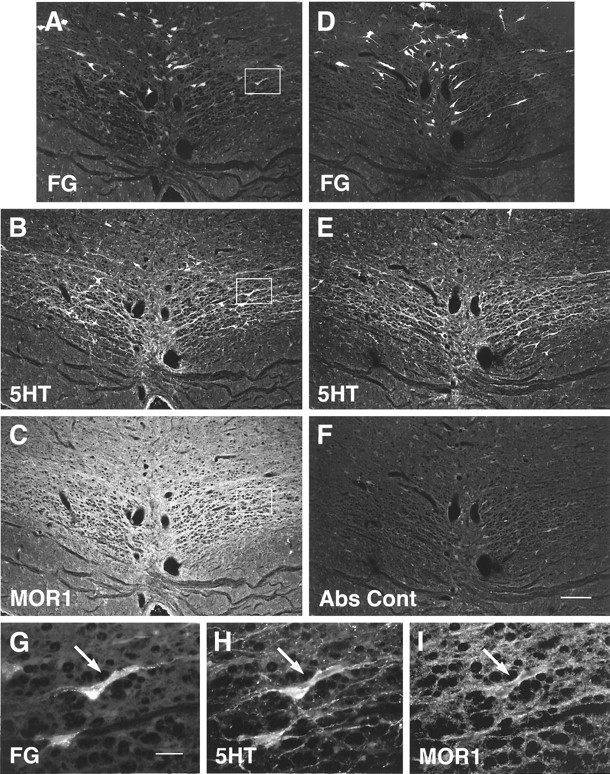
FG, 5HT, and MOR1 staining in two adjacent sections. A, D, and G were obtained using conventional fluorescence microscopy; the remaining images were obtained using confocal microscopy. A–C, A single section containing retrogradely labeled cells. The section has been stained for both 5HT and MOR1.D–F, An adjacent section that was stained identically, except that a MOR1 absorption control was substituted.G–I, Higher-magnification images of the regions onA–C marked by the box. Aand D demonstrate the distribution ofFG-labeled neurons within NRM resulting after lumbar application of FG (see Materials and Methods).B and E show labeling for5HT, and C and F show labeling either from the MOR1 antiserum (C) or a MOR1 absorption control (Abs Cont) (F). MOR1-ir was reduced in absorption controls (F; also see text). In some casesFG-labeled neurons (G) were labeled for both 5HT (H) andMOR1 (I). Scale bars:A–F, 150 μm; G–I, 30 μm.
Previous studies of the DOR1 antiserum have reported that it stained bands of the appropriate molecular weight on immunoblots (Dado et al., 1993). In addition, antibodies raised in different species against different portions of the receptor were used for double labeling. We found that structures that stained for one part of the receptor molecule also stained for the other, which suggested strongly that the bona fide protein was being labeled (Arvidsson et al., 1995a). In the present studies, the patterns of labeling observed in the caudal midbrain and in the RVM resembled those reported previously (Arvidsson et al., 1995a). In addition, labeling for the δ receptor was reduced or abolished in absorption controls (see Figs. 5 and 10). Thus the staining observed in the present study seems likely to be specific.
RESULTS
Retrogradely labeled RVM neurons
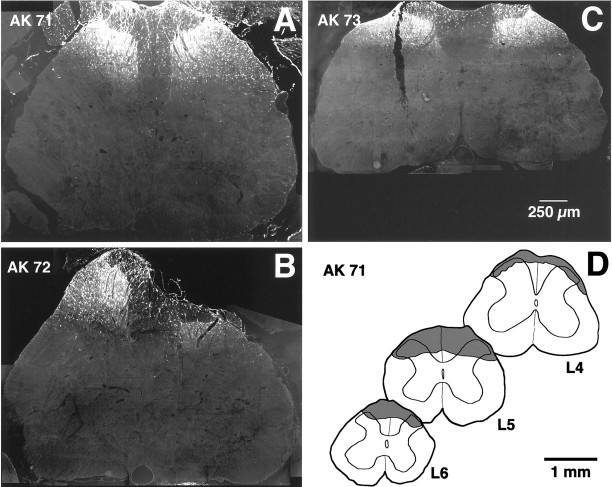
Application of FG onto the surface of the lumbar spinal cord resulted in labeling of the dorsal portion of the spinal cord, with the highest intensity of labeling within the substantia gelatinosa (Fig.1). No labeling of the ventral spinal cord or intermediate gray matter was observed (Fig. 1). Lumbar application of FG gave rise to a large number of retrogradely labeled cells within the RVM, including NRM (Fig. 2), nucleus paragigantocellularis lateralis, and nucleus gigantocellularis pars α (not shown). These cells were distributed largely at the level of NRM or in NRM itself; fewer were found in nucleus raphe pallidus or nucleus raphe obscurus.
Fig. 1.
Extents of the lumbar spinal injection sites.A–C, Images showing the maximal extent in the transverse plane of the FG application sites. Images were taken from the three rats used for quantitative studies; labeling is predominantly in the superficial dorsal horn. D, Camera lucida drawings showing the rostrocaudal extent of the largest of the application sites (rat AK 71). Shaded areas on drawings represent the extent of FG labeling at different lumbar levels.
Immunostaining of RVM sections for 5HT indicated that ∼31% (83 of 270) of the FG labeled cells within the NRM were 5HT positive (Fig. 2). In contrast to previous studies of retrograde labeling from the dorsal spinal cord (Skageberg and Björklund, 1985), double-labeled cells were observed at all rostrocaudal levels of the NRM, from the inferior olive to the trapezoid body.
Labeling for MOR1 in NRM and the RVM was of moderate intensity; i.e., it was fainter than that in the superficial dorsal horn or locus coeruleus (Arvidsson et al., 1995b). MOR1-ir was widespread, however, and was observed both in cell somata and in the neuropile between somata (Figs. 2, 3). Labeling of the neuropile could occasionally be so dense that individual MOR1-labeled cells were difficult to distinguish (Fig. 3G). At high magnification it was possible to distinguish small punctate MOR1-ir structures that may have been axonal varicosities or fine dendrites (Fig. 3C,E). These punctate structures were found apposed to most cells in the RVM (Figs.2G–I, 3C,E, 4E–G). In absorption controls, labeling of the neuropile, the cell cytoplasm, and the cell membrane was reduced greatly (compare Fig. 2C with 2F and Fig. 3A,C,E,G with 3B,D,F,H, respectively). In contrast, staining of the nuclear membrane sometimes remained (Fig. 3D). Thus staining that only labeled the nuclear membrane was regarded as nonspecific.
Fig. 4.
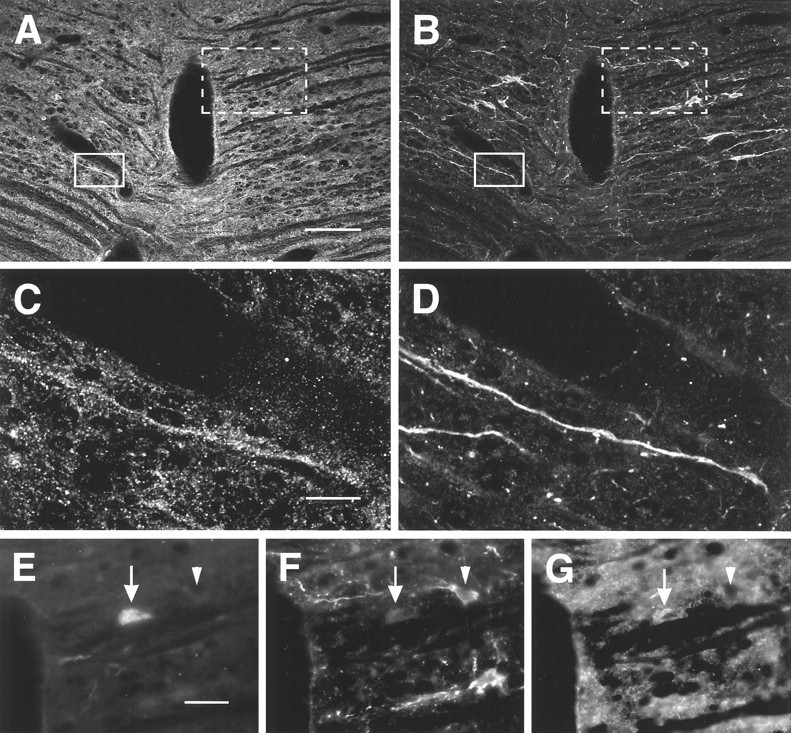
Staining of neurons in NRM for MOR1 and 5HT. Images are of a single section through NRM at the level of the caudal trapezoid body. A, B, Overview of the region examined.Solid line box marks the region shown inC and D; dotted line boxmarks the region shown in E–G. A, MOR1-ir; B, 5HT-ir; C, D, higher-magnification images of the region marked by the solid line box. Note the 5HT-ir process labeled for MOR1.E–G, Higher-magnification images of the region marked by the dotted line box. In some cases, FG-labeled cells (E) that seemed not to be immunoreactive for 5HT (F) were labeled for MOR1 (G). Scale bars: A, B, 75 μm; C, D, 25 μm;E–G, 30 μm.
Some cells and processes immunoreactive for MOR1 seemed to contain 5HT (Figs. 2B,C,H,I, 4C,D); of those, some cells were labeled retrogradely from the dorsal spinal cord (Fig.2G–I). In addition, other cells immunoreactive for MOR1 were labeled retrogradely from the dorsal spinal cord but were not 5HT-ir (Fig. 4E,G).
The proportion of retrogradely labeled cells that were MOR1-ir was determined in nine sections of the RVM, taken at the levels of the inferior olive, the facial nucleus, and the trapezoid body of rats AK 71, AK 72, and AK 73 (Table 1). A total of 133 retrogradely labeled cells were observed. Of these, 31% were MOR1-ir (Figs. 4, 5); an additional 23% of the retrogradely labeled cells were ambiguous cases, and it was not possible to determine whether they were immunoreactive for MOR1. Of the cells double-labeled for FG and MOR1, 41% were also immunoreactive for 5HT. The latter constituted 46% of the retrogradely labeled 5HT-ir cells counted in this part of the study (Figs. 2, 5). In addition, half of the ambiguous cases were immunoreactive for 5HT.
Table 1.
Relationship among 5HT, MOR1, and FG neurons
| Rat | Cells counted within NRM | |||
|---|---|---|---|---|
| FG | FG+MOR1 | FG+5HT | FG+MOR1 +5HT | |
| AK 71 | 53 | 15 (8) | 11 | 6 (3) |
| AK 72 | 49 | 16 (15) | 16 | 9 (5) |
| AK 73 | 31 | 10 (7) | 10 | 2 (7) |
| Total | 133 | 41 (30) | 37 | 17 (15) |
Relationships among RVM neurons retrogradely labeled from the dorsal spinal cord and immunocytochemically labeled for 5HT and/or MOR1. Table shows the number of retrogradely labeled cells counted in three sections from each of three rats. FG, Number of cells retrogradely labeled with FG; FG+MOR1, number of cells double-labeled for FG and MOR1-ir; FG+5HT, number of cells double-labeled for FG and 5HT-ir; FG+MOR1+5HT, number of cells triple-labeled for FG, MOR1-ir, and 5HT-ir. Numbers in parentheses are the number of ambiguous cases, about which no determination could be made.
The DOR1 antiserum also was used to stain sections containing retrogradely labeled RVM cells. As reported previously (Arvidsson et al., 1995a), the DOR1 antiserum labeled large numbers of varicose processes in the RVM (Fig. 5A); this staining was reduced greatly or abolished in absorption controls (Fig. 5A,B). When tissues containing retrogradely labeled cells were stained for 5HT and DOR1, some retrogradely labeled somata that were apposed by DOR1-ir varicosities were also immunoreactive for 5HT (Fig.6A–D). Interestingly, some DOR1-ir varicosities apposed to FG-containing cells were also immunoreactive for 5HT (Fig.6C,D). In addition to apposing 5HT-ir cells, in some cases DOR1-ir varicosities apposed retrogradely labeled cells that were not immunoreactive for 5HT (Fig. 6E–G).
Fig. 6.
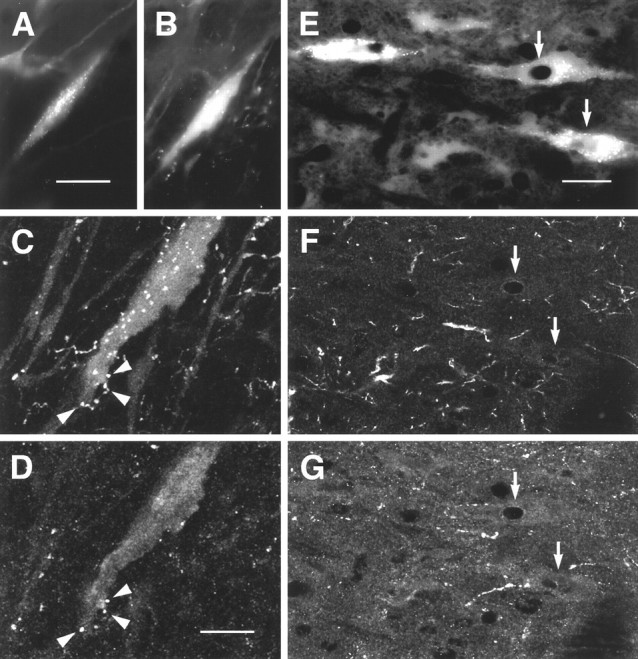
Images obtained by conventional or confocal microscopy of sections through NRM that were doubly stained for 5HT and DOR1. A–D, 5HT cell retrogradely labeled from the dorsal spinal cord and apposed by DOR1-ir varicosities. A, B, Conventional images showing FG labeling of a 5HT-ir cell in nucleus paragigantocellularis lateralis. A, FG;B, 5HT-ir; C, higher-magnification confocal image showing 5HT-ir varicosities apposed to the cell.D, DOR1-ir in the same field as C. Some of the 5HT-ir varicosities apposed to the cell were also immunoreactive for DOR1 (arrowheads). E–G, Nonserotonergic neurons retrogradely labeled from the dorsal spinal cord and apposed by DOR1-ir varicosities. E, FG;F, 5HT-ir; G, DOR1-ir. In some cases, retrogradely labeled cells that were not labeled for 5HT were apposed by DOR1-ir varicosities (arrows). Scale bars: A, B, 30 μm; C, D, 15 μm;E–G, 25 μm.
Of 137 FG-labeled somatic profiles that were found in a total of five sections taken from each of three rats, 53% were apposed by DOR1-ir varicosities (Table 2). (In an additional 20% of cases, it was unclear whether these profiles were apposed). Of the profiles that were apposed, 29% were immunoreactive for 5HT and 71% were not. The 5HT-ir profiles that were apposed represented 46% of the total number of retrogradely labeled 5HT-ir somatic profiles counted in this part of the study.
Table 2.
Relationship among 5HT, DOR1, and FG neurons
| Rat | Cells counted within NRM | |||
|---|---|---|---|---|
| FG | FG apposed by DOR1 | FG+5HT | FG+5HT apposed by DOR1 | |
| AK 71 | 51 | 25 (7) | 18 | 11 (1) |
| AK 72 | 37 | 21 (11) | 11 | 6 (3) |
| AK 73 | 49 | 27 (10) | 17 | 4 (2) |
| Total | 137 | 73 (28) | 46 | 21 (6) |
Relationships among neurons retrogradely labeled from the dorsal spinal cord, neurons immunoreactive for 5HT, and neurons apposed by DOR1-ir varicosities. Table shows the number of retrogradely labeled cells counted in five sections from each of three rats. FG, Number of cells retrogradely labeled with FG; FG apposed by DOR1, number of retrogradely labeled profiles apposed by DOR1-ir varicosities; FG+5HT, number of 5HT-ir neurons retrogradely labeled with FG; FG+5HT apposed by DOR1, number of 5HT-ir neurons retrogradely labeled with FG and apposed by DOR1-ir varicosities. Numbers in parentheses are the number of ambiguous cases, about which no determination could be made.
Retrogradely labeled neurons in the PAG and caudal mesencephalon
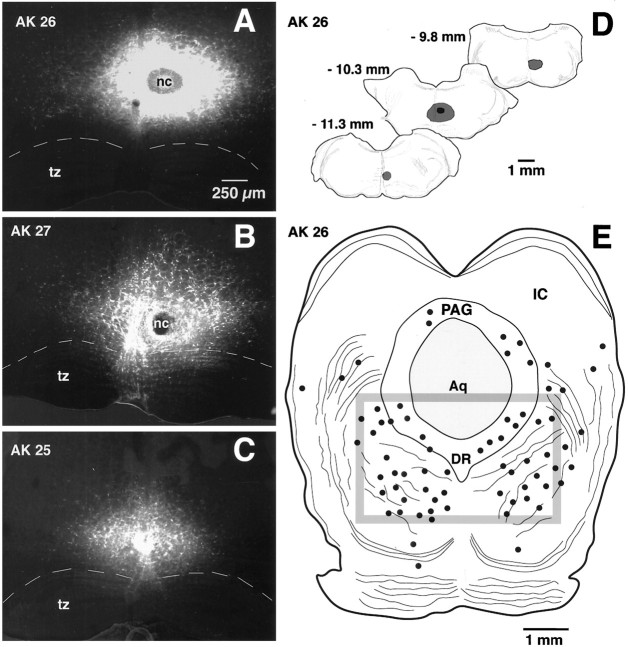
Iontophoretic injections of FG into the RVM were nearly spherical in shape, ranging from 0.2 to 1 mm in diameter (Fig. 7). The larger injection sites generally had a well defined necrotic core (Fig. 7). FG injections into the RVM resulted in retrograde labeling of neurons in both dorsal and ventral portions of PAG as well as in the adjacent reticular formation; this pattern was similar to those reported previously for retrograde labeling from the RVM (Gallager and Pert, 1978; Beitz, 1982). MOR1 labeling was found throughout the PAG but was most prominent in the dorsal lateral portion and along the ventral lateral border (Fig. 8A). Caudally, MOR1-ir was also prominent between the two medial longitudinal fasciculi (Fig.8A), frequently extending dorsally from that region (Fig. 8D). MOR1-ir was found in other portions of the caudal midbrain as well, including lateral lemniscus, reticular formation, the cuneiform nucleus, and the lateral parabrachial nucleus. The strongest MOR1-ir was found in nucleus raphe medianis, which contained large numbers of intensely labeled cells (Fig. 9).
Fig. 7.
FG injection sites in the RVM and the resulting retrograde labeling in the caudal midbrain. A–C, Conventional images of FG injection sites in the RVM (largely NRM) for each of the three animals from which quantitative data were obtained (AK 26, AK 27, and AK 28). Each image is a montage of four to six individual micrographs. tz, Trapezoid body; nc, necrotic core. Dashed line represents the dorsal border of the trapezoid body.C, Camera lucida drawings of the rostrocaudal extent of the largest injection (AK 26). Numbersapproximate the level of the corresponding figures in the Paxinos and Watson atlas of rat brain. E, Retrograde labeling of neurons within a single section of the caudal midbrain of rat AK 26. Solid dots represent FG-labeled cells.Box represents the boundary of the region in which quantitative studies were performed. PAG, Periaqueductal gray; IC, inferior colliculus; Aq, aqueduct;DR, dorsal raphe.
Fig. 9.
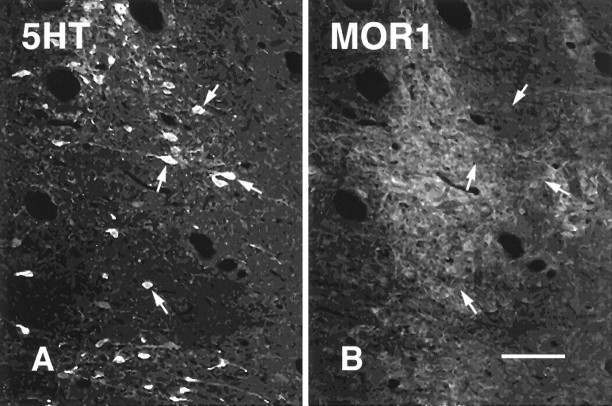
Serotonergic neurons in nucleus raphe medianis do not express MOR1. A, B, Confocal images of sections through raphe medianis that were stained for 5HT(A) and MOR1 (B).Arrows point to 5HT-ir cells that are not labeled for MOR1. Scale bar, 50 μm.
Cell somata, dendrites, and punctate processes labeled for MOR1 were observed within the caudal mesencephalon in and adjacent to the PAG (Fig. 8). As was the case in the RVM, MOR1-ir in the PAG was distributed widely but was not always strong. The labeling was greatly reduced in absorption controls (compare Fig. 8A,Fwith 8B,G, respectively).
Mesencephalic cells retrogradely labeled from the RVM were usually surrounded by small MOR1-ir structures, possibly distal dendrites or nerve terminals (Fig. 8H,I); however, retrogradely labeled cells themselves were never immunoreactive for MOR1 (Fig. 8H,I). This lack of double labeling was not the result of FG toxicity (Garrett et al., 1991), because we observed the same lack of labeling when fluorescent microspheres were used as the retrograde tract-tracer was used (data not shown). Despite the presence of both MOR1-ir cells and 5HT-ir cells in nucleus raphe medianis, double labeling was not observed (Fig. 9); double labeling also was not observed for either 5HT or MOR1 in nucleus raphe dorsalis (Fig. 11).
Fig. 11.
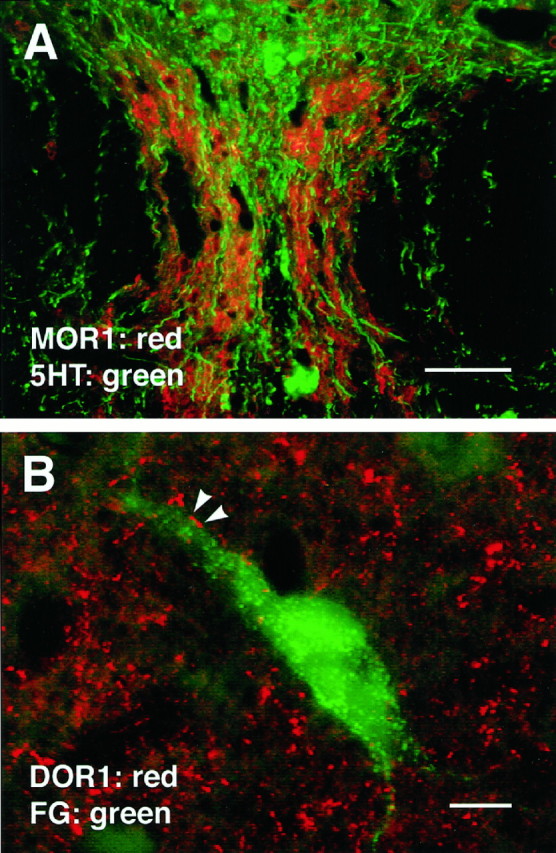
A, Section of nucleus raphe dorsalis stained for both 5HT and MOR1. As in nucleus raphe medianis (Fig. 9), serotonergic cells in NRD seldom if ever expressed MOR1-ir; however, MOR1-ir processes were found adjacent to 5HTcells and seemed to outline the region in which 5HT-ir cells occurred.B, DOR1-ir varicosities frequently apposed PAG cells retrogradely labeled from the RVM. In this image, FG was pseudocolored green. Scale bars: A, 50 μm; B, 10 μm.
In agreement with previous studies (Arvidsson et al., 1995a), the caudal midbrain was found to contain both DOR1-ir varicose fibers and a limited number of DOR1-ir cells (Figs. 10, 11). Cells were observed mainly in the ventral lateral portion of the caudal-most PAG (Fig.10A,C,D,H). These cells were seldom or never found to be retrogradely labeled from the RVM (Fig.10H,I). DOR1-ir varicosities were distributed throughout the PAG; the largest accumulation was found in the ventral lateral PAG (Fig. 10A,F). Dense accumulations also occurred in the ventral medial PAG (Fig. 10A,D) and in the dorsal PAG immediately adjacent to the aqueduct (Fig.10A).
Although retrogradely labeled cells in the caudal midbrain were rarely if ever immunoreactive for DOR1, they frequently were apposed by DOR1-ir varicosities: of 156 retrogradely labeled profiles from three rats, 52 (33%) were apposed by DOR1-ir varicosities.
DISCUSSION
We draw three principal conclusions from these studies. First, both μ- and δ-opioid receptors are present in brainstem antinociceptive circuits, and thus it seems that both receptors could be involved in the supraspinal component of opiate analgesia. Second, we propose that opioids exert mainly indirect effects on PAG–RVM projection neurons, but exert both direct and indirect effects on bulbospinal neurons. Third, some serotonergic neurons projecting to the spinal dorsal horn express μ-opioid receptors. These conclusions are summarized in Figure 12.
Fig. 12.
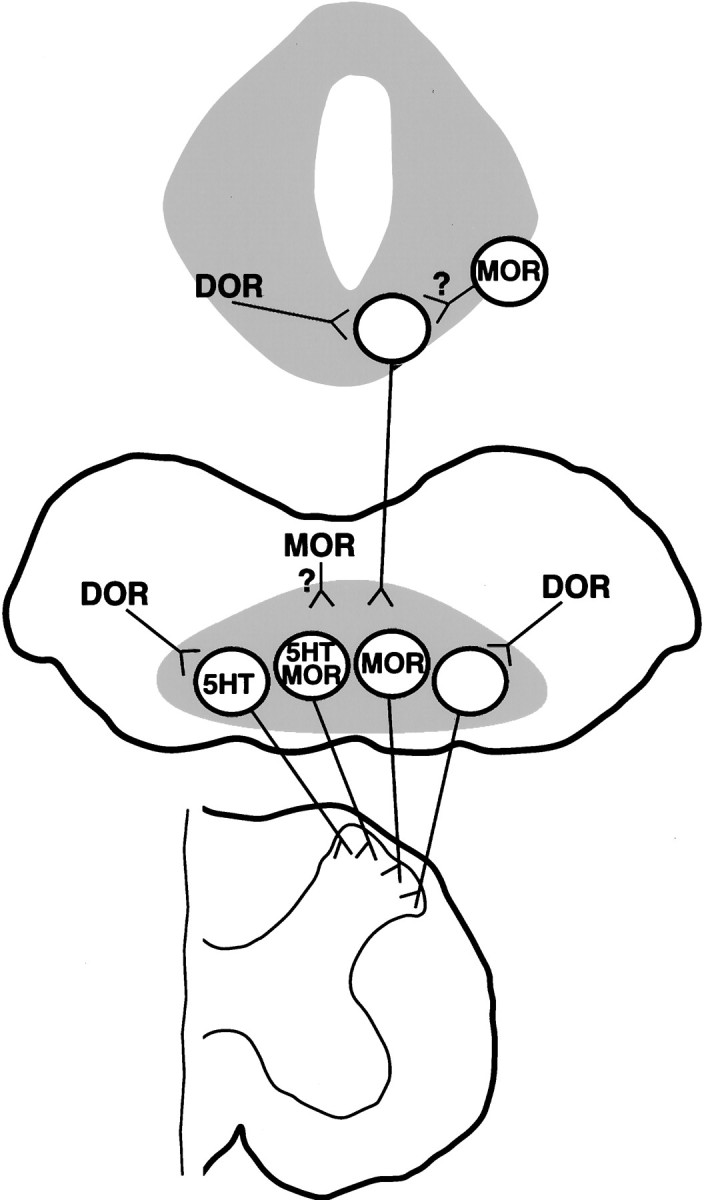
Schematic diagram depicting proposed relationships between opioid receptors and neurons within the PAG–RVM–spinal cord circuit. Top, PAG;middle, RVM; bottom, spinal cord. We propose that axon terminals expressing DOR1 synapse onto mesencephalic neurons, including PAG neurons, projecting to the RVM. Cell somata expressing MOR1 are found in the PAG, and terminals expressing MOR1 may also synapse onto mesencephalic neurons projecting to the RVM (question mark). In the RVM, we conclude that neurons expressing MOR1-ir in their somata project to the spinal dorsal horn and that some of these cells contain 5HT. (At this time, however, it is unclear whether these 5HT neurons express MOR1 on their spinal terminals.) Thus our data suggest that opiate analgesics may directly inhibit some bulbospinal neurons (see Discussion). In addition, nerve terminals expressing DOR1 may synapse onto both 5HT and non-5HT cells projecting to the dorsal horn. Terminals expressing MOR1 may also synapse onto bulbospinal neurons (question mark), as may neurons projecting from the PAG. For the sake of simplicity, we did not illustrate DOR1-labeled serotonergic fibers present in nucleus proprius of the dorsal horn and in the ventral horn (Arvidsson et al., 1995a).
Opioid receptors and projection neurons in the RVM and the PAG
In the RVM (including NRM), DOR1-ir varicosities apposed approximately half of all neuronal profiles projecting to or through the dorsal spinal cord; some of those profiles were labeled for 5HT. (This number seems likely to underestimate rather than overestimate the true percentage of apposed cells, because a cell might be unapposed in the section that was examined but apposed in other sections.) From these findings we conclude that δ-opioid receptors in this region may control inputs to neurons involved in modulating nociception. These studies were performed using only light microscopic methods, and electron microscopy will be required to determine whether the appositions observed in the present study represent actual synapses. The appearance of the relationships between varicosities and cells, however, suggested that at least in some cases synapses might exist between DOR1-ir terminals expressing DOR1 and bulbospinal neurons.
In a previous study, DOR1-ir was found to label 5HT-ir fibers in nucleus proprius of the dorsal horn and in the ventral horn (Arvidsson et al., 1995a). The bulbospinal neurons in the present study were probably labeled largely from the more superficial layers of the dorsal horn. Thus the present findings of DOR1-ir appositions onto bulbospinal 5HT-ir cells suggest that δ-opioid receptors can control spinal serotonergic tone by two distinct means. The first of these is by affecting afferent input to cells projecting to the superficial dorsal horn. The second is by directly affecting the release of serotonin from axonal terminals in the deep dorsal horn and ventral horn.
In addition to being apposed by DOR1-ir varicosities, almost one third of all RVM neurons projecting to or through the dorsal spinal cord (including almost half of the projection neurons that were immunoreactive for 5HT) were immunoreactive for MOR1. Thus μ-opioid receptors seem to be in a position to directly control the activity of many cells in the RVM, including 5HT cells. The response to opioids of putative 5HT cells in the RVM has been studied previously. In a set ofin vitro experiments, Pan et al. (1993) reported that most immunocytochemically confirmed 5HT cells responded to opioids. The response was indirect, however, and was mediated through a GABAergic synapse (Pan et al., 1990): only 1 of 27 5HT cells responded directly to an opioid agonist (Pan et al., 1993). Using in vivoelectrophysiological recording, some groups have suggested that there is little or no effect of opiates on putative 5HT cells (Auerbach et al., 1985; Chiang and Pan, 1985; Potrebic et al., 1994), although other studies suggest that activation of 5HT cells occurs in vivo(Bineau-Thurotte et al., 1984).
With regard to the PAG, varicosities that were immunoreactive for DOR1 were observed in regions implicated in antinociception, such as the cuniform nucleus, the ventral lateral PAG, and the nucleus raphe dorsalis (Fig. 10). It has been reported that microinjection of the δ-opioid agonist deltorphin into the PAG results in antinociception, suggesting that physiologically significant δ-opioid receptors exist in that region (Rossi et al., 1994). In the present study, DOR1-ir varicosities apposed approximately one third of the cells in the caudal midbrain tegmentum (including the ventral lateral PAG) that projected to or through the RVM.
μ-Opioid receptors previously have been reported in the PAG and adjacent midbrain (Mansour et al., 1987, 1994, 1995; Tempel and Zukin, 1987; Arvidsson et al., 1995b; Ding et al., 1996). In the present study, MOR1-ir seemed not to be common in mesencephalic neurons projecting to NRM; however, retrogradely labeled cells frequently were surrounded by punctate MOR1-ir (Fig. 8H,I). A large proportion of the punctate labeling observed in the PAG seemed to be specific (compare Fig. 8G with 8F), suggesting that MOR1 is expressed in nerve terminals or other processes in close proximity to mesencephalic neurons projecting to the RVM. Thus both δ- and μ-opioid receptors are common in the vicinity of midbrain neurons involved in antinociception.
Our findings agree in general terms with those of Osborne et al. (1996), who reported that only 14% of neurons in the ventral lateral PAG that projected to NRM were inhibited directly by opioids. [This effect seems to have been mediated by μ-opioid receptors (Chieng and Christie, 1994a)]. Thus it would be expected that at least some mesencephalic neurons projecting to NRM would be labeled for MOR1. Although both the MOR1 and DOR1 antisera seem to be specific, it is not certain that all μ- and δ-opioid receptors are labeled by these antisera, and thus these negative findings could be attributable to expression of μ-opioid receptors not recognized by our antisera. However, the absence of retrogradely labeled MOR1-ir cells observed in the present study could also reflect developmental differences. Adult rats were used in the present study, whereas neonatal rats were used inOsborne et al. (1996). Thus it would be of interest to repeat these studies in neonatal rats.
Opioid receptors and descending inhibitory systems
Both μ- and δ-opioid receptors were found to have relationships with neurons in the PAG–RVM–spinal cord circuit. As discussed above, it has been proposed that μ-opioid receptors on afferents to projection neurons, in both the PAG and the RVM, disinhibit the firing of those cells. In light of our findings, it seems possible that δ-opioid receptors on afferents to PAG and RVM cells also are disinhibitory. As with μ-opioid receptors, δ-opioid receptors seem to be predominantly inhibitory, and it has been reported that DOR1-ir in the hippocampus occurs on GABAergic terminals (Bausch et al., 1995).
The fact that μ- and δ-opioid agonists have been reported to have synergistic actions when microinjected into the PAG or the RVM (Rossi et al., 1993, 1994) suggests that the two receptors have similar or complementary roles with regard to antinociception. Morphine has a 30- to 50-fold lower potency at δ-opioid receptors than at μ-opioid receptors (Corbett et al., 1993), suggesting that δ-opioid receptors may not directly mediate the effects of morphine. Morphine administration, however, seems to cause release in the PAG of Met-enkephalin (Williams et al., 1995), which is highly potent at δ-opioid receptors (Corbett et al., 1993). Thus it seems that in the PAG–RVM–spinal cord circuit, δ-opioid receptors could play a major role in opioid-induced pain modulation. Because physiological stimuli also have been reported to evoke enkephalin release in PAG (Yaksh and Elde, 1981; Williams et al., 1995), it seems possible that δ-opioid receptors might be involved in physiological forms of antinociception as well.
Disinhibition of either the PAG or the RVM would increase descending inhibition of nociception if present models of opiate action are correct (Basbaum and Fields, 1984; Fields et al., 1991). In contrast, inhibition of RVM neurons projecting to the dorsal horn would be expected to decrease descending inhibition. In the present study we found evidence for circuitry that would decrease descending inhibition in response to opioids. RVM neurons (including both 5HT and non-5HT neurons) projecting to or through the dorsal spinal cord seemed to express the cloned μ-opioid receptor. Given the relatively high proportion of retrogradely labeled cells stained for MOR1, it seems likely that at least some of these cells actually terminated in the dorsal horn rather than being labeled via axons of passage. Moreover, the actions of μ-opioid receptors have been reported to be predominantly or entirely inhibitory (see introductory remarks). If so, it seems likely that opiates inhibit some RVM cells, including some 5HT cells, that project to the spinal dorsal horn. Thus these cells would be classified ON-cells, according to the model proposed by Fields et al. (1988, 1991). This finding is consistent with the report that both OFF-cells, which are excited by opiates, and ON-cells, which are inhibited by opiates, project to the dorsal horn (Fields et al., 1995).
There are two possible interpretations of these findings, depending on the spinal function of the raphe–spinal neurons expressing MOR1. If activation of these cells inhibits nociception, then inhibition of these cells by opioids would result in a decrease in descending inhibition of nociception. The latter would be at least partially consistent with the model of opiate antinociception proposed by Advokat (1988, 1993). If the projections facilitate nociception, as has been proposed for ON-cells (Fields and Basbaum, 1978; Kaplan and Fields, 1991), then their inhibition by opioids would result in a decreased facilitation, i.e., increased inhibition, of nociception.
In conclusion, we find that both μ- and δ-opioid receptors are present in brainstem antinociceptive circuits. In addition, these receptors seem positioned both to excite and to inhibit bulbospinal systems controlling nociception. Thus our findings suggest that the actions of opiate analgesics are more complex than has been supposed previously.
Footnotes
This work was supported by Public Health Service Grants DA05466 and DA09642 from the National Institute on Drug Abuse and by Swedish Medical Research Council Project 12X-6815. We thank Dr. Robert Elde for providing MOR1 and DOR1 antisera and for critical examination of this manuscript. We gratefully acknowledge expert technical assistance from Linda Germain, Galina Kalyuzhny, and Michael Grahek.
Correspondence should be addressed to Alexander E. Kalyuzhny, Department of Cell Biology and Neuroanatomy, University of Minnesota, Minneapolis, MN 55455.
Ulf Arvidsson’s present address: Department of Neuroscience, Karolinska Institute, Stockholm, Sweden S-171 77.
Wei Wu’s present address: Howard Hughes Medical Institute, School of Medicine, University of California at San Diego, La Jolla, CA 92093.
REFERENCES
- 1.Advokat C. The role of descending inhibition in morphine-induced analgesia. Trends Pharmacol Sci. 1988;9:330–334. doi: 10.1016/0165-6147(88)90105-8. [DOI] [PubMed] [Google Scholar]
- 2.Advokat C. Intrathecal coadministration of serotonin and morphine differentially modulates the tail-flick reflex of intact and spinal rats. Pharmacol Biochem Behav. 1993;45:871–879. doi: 10.1016/0091-3057(93)90134-f. [DOI] [PubMed] [Google Scholar]
- 3.Arvidsson U, Dado RJ, Law P-Y, Loh HH, Elde R, Wessendorf MW. Delta (δ)-opioid receptor immunoreactivity: distribution in brain stem and spinal cord and relationship to biogenic amines and enkephalin. J Neurosci. 1995a;15:1215–1235. doi: 10.1523/JNEUROSCI.15-02-01215.1995. [DOI] [PMC free article] [PubMed] [Google Scholar]
- 4.Arvidsson U, Riedl M, Chakrabarti S, Lee J-H, Nakano AH, Dado R, Loh HH, Law P-Y, Wessendorf MW, Elde R. Distribution and targeting of a μ-opioid receptor (MOR1) in brain and spinal cord. J Neurosci. 1995b;15:3328–3341. doi: 10.1523/JNEUROSCI.15-05-03328.1995. [DOI] [PMC free article] [PubMed] [Google Scholar]
- 5.Auerbach S, Fornal C, Jacobs BL. Response of serotonin-containing neurons in nucleus raphe magnus to morphine, noxious stimuli, and periaqueductal gray stimulation in freely moving cats. Exp Neurol. 1985;88:609–628. doi: 10.1016/0014-4886(85)90075-5. [DOI] [PubMed] [Google Scholar]
- 6.Basbaum AI, Fields HL. Endogenous pain control mechanisms: review and hypothesis. Ann Neurol. 1978;4:451–462. doi: 10.1002/ana.410040511. [DOI] [PubMed] [Google Scholar]
- 7.Basbaum AI, Fields HL. Endogenous pain control systems: brainstem spinal pathways and endorphin circuitry. Annu Rev Neurosci. 1984;7:309–338. doi: 10.1146/annurev.ne.07.030184.001521. [DOI] [PubMed] [Google Scholar]
- 8.Bausch SB, Patterson TA, Appleyard SM, Chavkin C. Immunocytochemical localization of delta opioid receptors in mouse brain. J Chem Neuroanat. 1995;8:175–189. doi: 10.1016/0891-0618(94)00044-t. [DOI] [PubMed] [Google Scholar]
- 9.Beitz AJ. The sites of origin brain stem neurotensin and serotonin projections to the rodent nucleus raphe magnus. J Neurosci. 1982;2:829–842. doi: 10.1523/JNEUROSCI.02-07-00829.1982. [DOI] [PMC free article] [PubMed] [Google Scholar]
- 10.Bineau-Thurotte M, Godefroy F, Weil-Fugazza J, Besson J-M. The effect of morphine on the potassium evoked release of tritiated 5-hydroxytryptamine from spinal cord slices in the rat. Brain Res. 1984;291:293–299. doi: 10.1016/0006-8993(84)91261-7. [DOI] [PubMed] [Google Scholar]
- 11.Bowker RM, Dilts RP. Distribution of mu-opioid receptors in the nucleus raphe magnus and nucleus gigantocellularis: a quantitative autoradiographic study. Neurosci Lett. 1988;88:247–252. doi: 10.1016/0304-3940(88)90218-2. [DOI] [PubMed] [Google Scholar]
- 12.Chiang CY, Pan ZZ. Differential responses of serotonergic and non-serotonergic neurons in nucleus raphe magnus to systemic morphine in rats. Brain Res. 1985;337:146–150. doi: 10.1016/0006-8993(85)91620-8. [DOI] [PubMed] [Google Scholar]
- 13.Chieng B, Christie MJ. Hyperpolarization by opioids acting on mu-receptors of a sub-population of rat periaqueductal gray neurones in vitro. Br J Pharmacol. 1994a;113:121–128. doi: 10.1111/j.1476-5381.1994.tb16183.x. [DOI] [PMC free article] [PubMed] [Google Scholar]
- 14.Chieng B, Christie MJ. Inhibition by opioids acting on mu-receptors of GABAergic and glutamatergic postsynaptic potentials in single rat periaqueductal gray neurones in vitro. Br J Pharmacol. 1994b;113:303–309. doi: 10.1111/j.1476-5381.1994.tb16209.x. [DOI] [PMC free article] [PubMed] [Google Scholar]
- 15.Corbett AD, Paterson SJ, Kosterlitz HW. Selectivity of ligands for opioid receptors. In: Herz A, editor. Handbook of experimental pharmacology, opioids I. Springer; New York: 1993. pp. 645–679. [Google Scholar]
- 16.Dado RJ, Law PY, Loh HH, Elde R. Immunofluorescent identification of a delta (δ)-opioid receptor on primary afferent nerve terminals. NeuroReport. 1993;5:341–344. doi: 10.1097/00001756-199312000-00041. [DOI] [PubMed] [Google Scholar]
- 17.Dahlström A, Fuxe K. Evidence for the existence of monoamine neurons in the central nervous system. I. Demonstration of monoamines in cell bodies of brain stem neurons. Acta Physiol Scand. 1964;62:1–55. [PubMed] [Google Scholar]
- 18.Ding Y-Q, Kaneko T, Nomura S, Mizuno N. Immunohistochemical localization of μ-opioid receptors in the central nervous system of the rat. J Comp Neurol. 1996;367:375–402. doi: 10.1002/(SICI)1096-9861(19960408)367:3<375::AID-CNE5>3.0.CO;2-2. [DOI] [PubMed] [Google Scholar]
- 19.Duggan AW, North RA. Electrophysiology of opioids. Pharmacol Rev. 1984;35:219–281. [PubMed] [Google Scholar]
- 20.Fields HL, Basbaum AI. Brainstem control of spinal pain-transmission neurons. Annu Rev Physiol. 1978;40:217–248. doi: 10.1146/annurev.ph.40.030178.001245. [DOI] [PubMed] [Google Scholar]
- 21.Fields HL, Barbaro NM, Heinricher MM. Brain stem neuronal circuitry underlying the antinociceptive action of opiates. Prog Brain Res. 1988;77:245–257. doi: 10.1016/s0079-6123(08)62792-2. [DOI] [PubMed] [Google Scholar]
- 22.Fields HL, Heinricher MM, Mason P. Neurotransmitters in nociceptive modulatory circuits. Annu Rev Neurosci. 1991;14:219–245. doi: 10.1146/annurev.ne.14.030191.001251. [DOI] [PubMed] [Google Scholar]
- 23.Fields HL, Malick A, Burstein R. Dorsal horn projection targets of on and off cells in the rostral ventromedial medulla. J Neurophysiol. 1995;74:1742–1759. doi: 10.1152/jn.1995.74.4.1742. [DOI] [PubMed] [Google Scholar]
- 24.Gallager DW, Pert A. Afferents to brain stem nuclei (brain stem raphe, nucleus reticularis pontis caudalis and nucleus gigantocellularis) in the rat as demonstrated by microiontophoretically applied horseradish peroxidase. Brain Res. 1978;144:257–275. doi: 10.1016/0006-8993(78)90153-1. [DOI] [PubMed] [Google Scholar]
- 25.Garrett WT, McBride RL, Williams JK, Jr, Feringa ER. Fluoro-Gold’s toxicity makes it inferior to True Blue for long-term studies of dorsal root ganglion neurons and motoneurons. Neurosci Lett. 1991;128:137–139. doi: 10.1016/0304-3940(91)90778-r. [DOI] [PubMed] [Google Scholar]
- 26.Johnson DG, de C Nogueria Araujo GM. A simple method of reducing the fading of immunofluorescence during microscopy. J Immunol Methods. 1981;43:349–350. doi: 10.1016/0022-1759(81)90183-6. [DOI] [PubMed] [Google Scholar]
- 27.Kaplan H, Fields HL. Hyperalgesia during acute opioid abstinence: evidence for a nociceptive facilitating function of the rostral ventromedial medulla. J Neurosci. 1991;11:1433–1439. doi: 10.1523/JNEUROSCI.11-05-01433.1991. [DOI] [PMC free article] [PubMed] [Google Scholar]
- 28.Kiefel JM, Rossi GC, Bodnar RJ. Medullary mu and delta opioid receptors modulate mesencephalic morphine analgesia in rats. Brain Res. 1993;624:151–161. doi: 10.1016/0006-8993(93)90073-v. [DOI] [PubMed] [Google Scholar]
- 29.Mansour A, Khachaturian H, Lewis ME, Akil H, Watson SJ. Autoradiographic differentiation of mu, delta, and kappa opioid receptors in the rat forebrain and midbrain. J Neurosci. 1987;7:2445–2464. [PMC free article] [PubMed] [Google Scholar]
- 30.Mansour A, Fox CA, Burke S, Meng F, Thompson RC, Akil H, Watson SJ. Mu, delta, and kappa opioid receptor mRNA expression in the rat CNS: an in situ hybridization study. J Comp Neurol. 1994;350:412–438. doi: 10.1002/cne.903500307. [DOI] [PubMed] [Google Scholar]
- 31.Mansour A, Fox CA, Burke S, Akil H, Watson SJ. Immunocytochemical localization of cloned mu opioid receptor in the rat CNS. J Chem Neuroanat. 1995;8:283–305. doi: 10.1016/0891-0618(95)00055-c. [DOI] [PubMed] [Google Scholar]
- 32.McFadzean I. The ionic mechanisms underlying opioid actions. Neuropeptides. 1988;11:173–180. doi: 10.1016/0143-4179(88)90072-8. [DOI] [PubMed] [Google Scholar]
- 33.Oliveras JL, Redjemi F, Guilbaud G, Besson JM. Analgesia induced by electrical stimulation of the inferior centralis nucleus of the raphe in the cat. Pain. 1975;1:139–145. doi: 10.1016/0304-3959(75)90098-6. [DOI] [PubMed] [Google Scholar]
- 34.Osborne PB, Vaughan CW, Wilson HI, Christie M. Opioid inhibition of rat periaqueductal gray neurons with identified projections to rostral ventromedial medulla in vitro. J Physiol (Lond) 1996;490:383–389. doi: 10.1113/jphysiol.1996.sp021152. [DOI] [PMC free article] [PubMed] [Google Scholar]
- 35.Pan ZZ, Williams JT, Osborne P. Opioid actions on single nucleus raphe magnus neurons from rat and guinea pig in vitro. J. Physiol (Lond) 1990;427:519–532. doi: 10.1113/jphysiol.1990.sp018185. [DOI] [PMC free article] [PubMed] [Google Scholar]
- 36.Pan ZZ, Wessendorf MW, Williams JT. Modulation by serotonin of the neurons in rat nucleus raphe magnus in vitro. Neuroscience. 1993;54:421–429. doi: 10.1016/0306-4522(93)90263-f. [DOI] [PubMed] [Google Scholar]
- 37.Potrebic SB, Fields HL, Mason P. Serotonin immunoreactivity is contained in one physiological cell class in the rat rostral ventromedial medulla. J Neurosci. 1994;14:1655–1665. doi: 10.1523/JNEUROSCI.14-03-01655.1994. [DOI] [PMC free article] [PubMed] [Google Scholar]
- 38.Proudfit HK, Anderson EG. Morphine analgesia: blockade by raphe magnus lesions. Brain Res. 1975;98:612–618. doi: 10.1016/0006-8993(75)90380-7. [DOI] [PubMed] [Google Scholar]
- 39.Reynolds DV. Surgery in the rat during electrical analgesia induced by focal brain stimulation. Science. 1969;164:444–445. doi: 10.1126/science.164.3878.444. [DOI] [PubMed] [Google Scholar]
- 40.Rivot JP, Pointis D, Besson JM. Morphine increases 5HT metabolism in the nucleus raphe magnus: an in vivo study in freely moving rats using 5-hydroxyindole electrochemical detection. Brain Res. 1988;446:333–342. doi: 10.1016/0006-8993(88)90892-x. [DOI] [PubMed] [Google Scholar]
- 41.Rossi GC, Pasternak GW, Bodnar RJ. Synergistic brainstem interactions for morphine analgesia. Brain Res. 1993;624:171–180. doi: 10.1016/0006-8993(93)90075-x. [DOI] [PubMed] [Google Scholar]
- 42.Rossi GC, Pasternak GW, Bodnar RJ. Mu and delta opioid synergy between the periaqueductal gray and the rostro-ventral medulla. Brain Res. 1994;665:85–93. doi: 10.1016/0006-8993(94)91155-x. [DOI] [PubMed] [Google Scholar]
- 43.Schmued LC, Fallon JH. Fluoro-Gold: a new fluorescent retrograde axonal tracer with numerous unique properties. Brain Res. 1986;377:147–154. doi: 10.1016/0006-8993(86)91199-6. [DOI] [PubMed] [Google Scholar]
- 44.Skageberg G, Björklund A. Topographic principles in the spinal projections of serotonergic and non-serotonergic brainstem neurons in the rat. Neuroscience. 1985;15:445–480. doi: 10.1016/0306-4522(85)90225-8. [DOI] [PubMed] [Google Scholar]
- 45.Steinbusch HW. Distribution of serotonin-immunoreactivity in the central nervous system of the rat-cell bodies and terminals. Neuroscience. 1981;6:557–618. doi: 10.1016/0306-4522(81)90146-9. [DOI] [PubMed] [Google Scholar]
- 46.Tempel A, Zukin RS. Neuroanatomical patterns of the mu, delta, and kappa opioid receptors of rat brain as determined by quantitative in vitro autoradiography. Proc Natl Acad Sci USA. 1987;84:4308–4312. doi: 10.1073/pnas.84.12.4308. [DOI] [PMC free article] [PubMed] [Google Scholar]
- 47.Wessendorf MW. Fluoro-Gold: composition, and mechanism of uptake. Brain Res. 1991;553:135–148. doi: 10.1016/0006-8993(91)90241-m. [DOI] [PubMed] [Google Scholar]
- 48.Wessendorf MW, Brelje TC. Multicolor fluorescence microscopy using the laser-scanning confocal microscope. Neuroprotocols. 1993;2:121–140. [Google Scholar]
- 49.Wessendorf MW, Apple NM, Molitor TW, Elde RP. A method for immunofluorescent demonstration of three coexisting neurotransmitters in rat brain and spinal cord, using the fluorophores fluorescein, lissamine rhodamine, and 7-amino-4-methylcoumarin-3-acetic acid. J Histochem Cytochem. 1990;38:1859–1877. doi: 10.1177/38.12.1701460. [DOI] [PubMed] [Google Scholar]
- 50.Williams FG, Mullet MA, Beitz AJ. Basal release of Met-enkephalin and neurotensin in the ventrolateral periaqueductal gray matter of the rat: a microdialysis study of antinociceptive circuits. Brain Res. 1995;690:207–216. doi: 10.1016/0006-8993(95)00554-4. [DOI] [PubMed] [Google Scholar]
- 51.Yaksh TL, Elde RP. Factors governing release of methionine enkephalin-like immunoreactivity from mesencephalon and spinal cord of the cat in vivo. J Neurophysiol. 1981;46:1056–1075. doi: 10.1152/jn.1981.46.5.1056. [DOI] [PubMed] [Google Scholar]
- 52.Yaksh TL, Yeung JC, Rudy TA. Systematic examination in the rat of brain sites sensitive to the direct application of morphine: observation of differential effects within the periaqueductal gray. Brain Res. 1976;114:83–103. doi: 10.1016/0006-8993(76)91009-x. [DOI] [PubMed] [Google Scholar]


