

Abstract
By combining single-channel and whole-cell patch-clamp recordings, we have established the sensitivity to ω-agatoxin IVA and ω-conotoxin MVIIC (SNX-230) of G1, G2, and G3, the three novel non-L-, non-N-type Ca2+ channels characterized previously in rat cerebellar granule cells. G1 channels were blocked irreversibly by both ω-conotoxin MVIIC and low doses of ω-agatoxin IVA (saturation at 50 nm). Thus, according to pharmacological criteria, G1 channels must be classified as P-type Ca2+channels. Being slowly inactivating during depolarizing pulses and completely inactivated at voltages in which steady-state inactivation of P-type channels in Purkinje cells is negligible, G1 represents a novel P subtype. Neither G2 nor G3 was blocked irreversibly by ω-conotoxin MVIIC, and therefore both are R-type Ca2+channels. G2 and G3 have some biophysical properties similar to those of low-voltage-activated (LVA) Ca2+ channels (e.g., voltage range for steady-state inactivation, V1/2 = −90 mV), some properties similar to those of high-voltage-activated (HVA) Ca2+ channels (e.g., high sensitivity to Cd2+ block), and other properties intermediate between those of LVA and HVA Ca2+ channels, with LVA properties prevailing in G2 and HVA properties prevailing in G3. The R-type whole-cell current was inhibited by Ni2+with a biphasic dose–response curve (IC50: 4 and 153 μm), suggesting that G2 and G3 may have a different sensitivity to Ni2+ block. Our results uncover functional diversity of both native P-type and R-type Ca2+ channels and show that R subtypes with distinct biophysical properties are coexpressed in rat cerebellar granule cells.
Keywords: calcium channel, cerebellum, granule neuron, patch clamp, conotoxin, agatoxin, channel diversity
The fundamental roles played by voltage-gated Ca2+ channels in neuronal physiology and pathology (Llinas, 1988; Augustine and Neher, 1992; Johnston et al., 1992; Lipton and Rosenberg, 1994; Dunlap et al., 1995; Ghosh and Greenberg, 1995) explain the large and prolonged effort spent to study the functional, pharmacological, and molecular diversity of brain Ca2+channels.
According to pharmacological criteria, neuronal high-voltage-activated (HVA) Ca2+ channels have been classified as dihydropyridine (DHP)-sensitive channels (L-type), ω-conotoxin GVIA (GVIA)-sensitive channels (N-type), and ω-agatoxin IVA (ω-AgaIVA)-sensitive channels (P- and Q-type, distinguished on the basis of different sensitivities to ω-AgaIVA; Kd < 10 nm for P-type and Kd > 10 nm for Q-type) (Birnbaumer et al., 1994; Olivera et al., 1994; Dunlap et al., 1995;Randall and Tsien, 1995). An additional component of HVA current (R-type) has been identified as the current resistant to DHPs and ω-conotoxin MVIIC (SNX-230, Neurex Corporation, Menlo Park, CA) (MVIIC; Hillyard et al., 1992; Zhang et al., 1993).
Cloning studies have shown that brain Ca2+ channels α1 and β subunits are encoded by at least five (α1A, α1B, α1C, α1D, α1E) and four (β1, β2, β3, β4) different genes, respectively (Birnbaumer et al., 1994). Further molecular diversity is created by the existence of multiple splice variants for each gene (Perez-Reyes and Schneider, 1994). Heterologous expression studies have shown that α1C and α1D give rise to DHP-sensitive Ca2+ channels, α1B to GVIA-sensitive Ca2+ channels, α1A to ω-AgaIVA-sensitive Ca2+ channels, and α1Eto Ca2+ channels resistant to all specific inhibitors (Mikami et al., 1989; Williams et al., 1992a,b; Sather et al., 1993;Soong et al., 1993; Perez-Reyes and Schneider, 1994). Moreover, they have shown that combinations of a given α1 subunit with different β subunits give rise to Ca2+ channels with different biophysical properties (Sather et al., 1993; Olcese et al., 1994; Stea et al., 1994; De Waard and Campbell, 1995).
Considering the different isoforms for α1 and β subunits and the many possible subunit combinations, a functional diversity of brain Ca2+ channels much wider than the established pharmacological diversity can be expected in native neuronal membranes. Although there is evidence for functional heterogeneity of neuronal L-type (Forti and Pietrobon, 1993; Kavalali and Plummer, 1994), N-type (Nowycky et al., 1985; Plummer et al., 1989; Carbone et al., 1990;Kasai and Neher, 1992; Elmslie et al., 1994), and T-type Ca2+ channels (Carbone and Lux, 1984; Huguenard and Prince, 1992; Huguenard et al., 1993), functional diversity of P-type channels has not been reported yet. Actually, the lack of inactivation in long depolarizations and the steady-state inactivation at relatively positive voltages of P-type channels in Purkinje cells (Regan, 1991;Usowicz et al., 1992) are considered characteristic properties of P-type channels, distinguishing them from Q-type channels. On the other hand, faster inactivation together with lower sensitivity to ω-AgaIVA have been considered distinctive features of Q-type channels with respect to P-type channels (Sather et al., 1993; Randall and Tsien, 1995).
Recently, we have characterized the single-channel properties of three novel DHP- and GVIA-insensitive Ca2+ channels coexpressed in rat cerebellar granule cells (Forti et al., 1994). We have called these channels G1, G2, G3 (in which G stands for granule and 1, 2, 3 refer to the order of frequency with which they were observed), because their biophysical properties were different from those of both P- and T-type Ca2+ channels. G1, G2, and G3 showed some inactivation during long depolarizations and complete steady-state inactivation at voltages in which steady-state inactivation of P-type channels is negligible. We have now assessed the sensitivity of G1, G2, and G3 to ω-AgaIVA and MVIIC. Our results demonstrate that, according to pharmacological criteria, G2 and G3 are R-type Ca2+ channels, whereas G1 channels are P-type Ca2+ channels and represent a novel P subtype with biophysical properties distinct from the subtype expressed in Purkinje cells.
MATERIALS AND METHODS
Cell culture. Cerebellar granule cells were grown in primary culture after enzymatic and mechanical dissociation from 6- to 7-d-old Wistar rats according to the procedure of Levi et al. (1984). The cells were plated on poly-l-lysine-coated glass coverslips and kept in basal Eagle’s medium supplemented with 10% fetal calf serum, 25 mm KCl, 2 mm glutamine, and 60 μg/ml gentamycin. Cytosine arabinoside (10 μm) was added to the culture 18 hr after plating to inhibit the proliferation of non-neuronal cells. Granule cells were the large majority of the cells in the cultures and were morphologically identified by their oval or round cell body, small size, and bipolar neurites. Experiments were performed on granule cells grown from 5 to 8 d in vitro (DIV), with the majority of experiments at 6–7 DIV.
Patch-clamp recordings and data analysis. Single-channel and whole-cell patch-clamp recordings followed standard techniques (Hamill et al., 1981). Currents were recorded with a DAGAN 3900 patch-clamp amplifier, low pass-filtered at 1 kHz (−3 dB; 8-pole Bessel filter), sampled at 5 kHz, and stored for later analysis on a PDP-11/73 computer. Experiments were performed at room temperature (21–25°C).
All single-channel recordings were obtained in the cell-attached configuration. Linear leak and capacitative currents were subtracted digitally from all records used for analysis. Current amplitude histograms were obtained from the data directly, with bin width equal to our maximal resolution (323.6 points/pA). For display, each histogram was normalized to the value of the zero current peak. Open probability, Po, was computed by measuring the average current 〈I〉 in a given single-channel current record and dividing it by the unitary single-channel currenti. To obtain activation curves, Povalues were calculated by averaging the open probabilities measured in each sweep at a given voltage only in segments with single-channel activity. In this case the values of Po reflect the voltage-dependent equilibrium between short-lived open and closed states in the activation pathway. Open-channel current amplitudes fori–V were measured by manually fitting cursors to well-resolved channel openings. A channel opening or closure was detected when more than one sampling point crossed a discriminator line at 50% of the elementary current. Histograms of open and closed times were fit with sums of decaying exponentials, as described in Forti and Pietrobon (1993).
The pipette solution contained (in mm): 90 BaCl2, 10 TEACl, 15 CsCl, and 10 HEPES, pH 7.4 (with TEAOH). The bath solution contained (in mm): 140 K-gluconate, 5 EGTA, 35 l-glucose, and 10 HEPES, pH 7.4 (with KOH). The high-potassium bath solution was used to zero the membrane potential outside the patch. In some experiments the bath solution contained 0.5–1 μm (+)-(S)-202-791. Liquid junction potential at the pipette tip was +12 mV (pipette positive), and this value should be subtracted from all voltages to obtain the correct values of membrane potentials in cell-attached recordings (Neher, 1992). For assessing the sensitivity of single channels to MVIIC, the toxin was usually added to both the pipette solution and the divalent-free bath solution. Cells were always incubated for at least 10 min in the presence of toxin before recording.
For whole-cell recordings, cells were placed into a recording chamber with Tyrode’s solution and, after attainment of the whole-cell configuration, were perfused with the external recording solution containing (in mm): 5 BaCl2, 147.5 TEA-Cl, and 10 HEPES (adjusted to pH 7.4 with TEA-OH). Internal solution contained (in mm): 100 Cs-methanesulfonate, 5 MgCl2, 30 HEPES, 10 EGTA, 4 ATP, 0.5 GTP, and 1 c-AMP (adjusted to pH 7.4 with CsOH). The perfusion system consisted of six microcapillary Teflon tubes glued together and placed inside a standard plastic pipette (Gilson, Middleton, WI) at ∼12 mm from the tip (∼1.2 mm diameter), which was cut to have a flute-beak shape and positioned close to the cell. The tubes were fed by gravity from reservoirs containing external solution with or without toxins. Switching between different solutions was controlled by solenoid valves. Delay time for complete solution change was <8 sec. Cytochrome C (0.1 mg/ml) was included in all recording solutions to block nonspecific peptide-binding sites. Barium currents were corrected for leak and capacitative currents by subtraction of an appropriately scaled current elicited by a 10 mV hyperpolarization. Averages are given as mean ±SEM. Liquid junction potential at the pipette tip was −8 mV (pipette negative) and that between the Tyrode’s solution in the experimental chamber and the external recording solution (flowing from the capillary tube) was −4 mV; these two junction potentials should be added to all voltages to obtain the correct values of membrane potential in whole-cell recordings (Neher, 1992). Isolated cells were chosen for recording. We considered space clamp as adequate when notch-like current discontinuities were absent from recordings at different voltages and when slow components in the decay of capacitative currents (in response to a hyperpolarizing pulse) or in the decay of tail currents (in the presence of nimodipine; Forti and Pietrobon, 1993) either were absent or had a negligible amplitude. The experiment was discarded if these criteria were not met.
All drugs were stored as stock solutions at −20°C: 3 mm(+)-(S)-202-791 (gift from Dr. Hof, Sandoz, Basel, Switzerland) in 95% ethanol, 250 μm ω-conotoxin GVIA (Peninsula Laboratories, Belmont, CA, and Bachem, Budendorf, Switzerland) in distilled water, 250 μm ω-conotoxin MVIIC (SNX-230 provided by Neurex Corporation) in distilled water, 95 μm ω-AgaIVA (gift from M. Adams, University of California at Riverside, Riverside, CA in first single-channel experiments, and then a gift from Pfizer, Groton, CT, in majority of whole-cell experiments; some experiments were done with the toxin sold by Bachem, Budendorf, Switzerland) in distilled water, and 10 mm nimodipine (gift from Dr. B. Bean, Vollum Institute, Portland, OR) in ethanol absolute.
RESULTS
Table 1 summarizes the single-channel properties of G1, G2, and G3, the three novel DHP- and GVIA-insensitive Ca2+ channels we have recently characterized in rat cerebellar granule cells in primary culture (Forti et al., 1994). Besides differing in unitary current, conductance, and mean open time, G1, G2, and G3 channels also differ in activation threshold, which increases in the order G2 (−40 mV with 90 mmBa2+ as charge carrier) < G3 (−25 mV) < G1 (−10 mV). Steady-state inactivation of G1 channels occurs at relatively negative voltages (over the range from −80 to −30 mV) and that of G2 and G3 channels at even more negative voltages, with complete inactivation already at holding potentials of −50 mV. G channels inactivate rather slowly: the percentage of decay of average single-channel current at the end of 720-msec-long depolarizations to +10 mV does not reach 50% for the most rapidly inactivating G2 channels.
Table 1.
Single-channel properties of G1, G2, and G3 Ca2+ channels
| G1 | G2 | G3 | |
|---|---|---|---|
| Unitary conductance | 21 pS | 15 pS | 20 pS |
| Unitary current at 0 mV | 1.4 pA | 0.5 pA | 0.8 pA |
| Average open time | 0.8 msec | 1.2 msec | 1 msec |
| Activation properties: | |||
| V1/2a | +11 mV | −22 mV | −4 mV |
| Thresholdb | −10 mV | −40 mV | −25 mV |
| Inactivation properties: | |||
| Percentage (after 720 msec at Vt = +10 mV)c | 34% | 46% | n.d. |
| Vhof complete inactivationd | −30 mV | −50 mV | −50 mV |
| Percentage of nulls (Vh = −90 mV)e | 48% | 66% | 70% |
| Frequency of observationf | 32% | 23% | 14% |
All values in the table are taken from Forti et al. (1994) and represent averages from at least three cell-attached patches (with 90 mm Ba2+ as charge carrier).
aV1/2 was obtained from fitting average activation curves (plots of single-channel open probability, Po, as a function of voltage) with a Boltzmann distribution function of the form Po = P0,max × {1 + exp[−(V − V1/2) × zF/RT]}−1. Povalues at a given voltage were obtained by averaging the open probabilities measured in segments with activity in each sweep.
Lowest voltage at which single-channel openings were observed during 720-msec-long test depolarizations, delivered every 4 sec from holding potentials of −90 mV.
Calculated as fraction of inactivating sweeps with single-channel activity or as percentage of decay of average single-channel current. Vt, Test pulse voltage.
Holding potential (Vh) at which single-channel open probability became zero during a series of test depolarizations delivered every 4 sec for at least 2 min.
Percentage of test depolarizations withPo = 0.
Percentage of cell-attached patches in which a given type of channel was observed. Multichannel patches in which identification of channel type was uncertain were excluded from the statistics.
To complete the pharmacological characterization of G1, G2, and G3 channels and to classify them as either P/Q or R-type Ca2+channels, we assessed their sensitivity to MVIIC, a toxin that inhibits irreversibly both P- and Q-type channels. Establishing the individual sensitivity of G1, G2, and G3 channels to this membrane-impermeable conopeptide is not straightforward, because G-type channels run down in excised patches, and, as an additional problem, binding of MVIIC to P/Q-type channels is inhibited by high divalent ion concentrations. Using human neuroblastoma IMR32 cells, which are rich in N-type channels (Carbone et al., 1990), we have established previously an experimental protocol effective in blocking single N-type Ca2+ channels in cell-attached patches (Forti et al., 1994). Before they were recorded, the cells were incubated in the divalent-free bath recording solution in the presence of 2.3 μm GVIA for at least 10 min. Irreversible block of N-type channels was inferred from the absence of these channels in 70 cell-attached patches from cells preincubated with toxin, compared with their presence in 17 of 69 patches from control cells (Forti et al., 1994). We concluded that, once bound, the rate of unbinding of the toxin was sufficiently slow to allow detection of channel block in cell-attached recordings. Given the established irreversibility of block of P/Q-type channels by MVIIC (compare Fig. 3), we used here the same protocol. After incubation for at least 10 min with 10 μm MVIIC in the potassium gluconate bath recording solution, G1 channels were never observed in 51 cell-attached patches (with 3 μm MVIIC in the pipette). In paired controls without toxin performed alternatively on the same neuronal preparation at each day in culture, they were observed in 16 of 40 patches (excluding all multichannel patches in which identification was uncertain). We can then conclude that G1 Ca2+ channels are blocked irreversibly by MVIIC. In contrast, because G2 and G3 Ca2+ channels were still observed after incubation with MVIIC and their activity was similar to that in control patches (Fig.1), neither G2 nor G3 is blocked irreversibly by MVIIC. According to the accepted pharmacological classification of HVA Ca2+ channels into four classes (L, N, P/Q, R), each of which may comprise channel subtypes with distinct biophysical properties, both G2 and G3 are R-type Ca2+ channels.
Fig. 3.

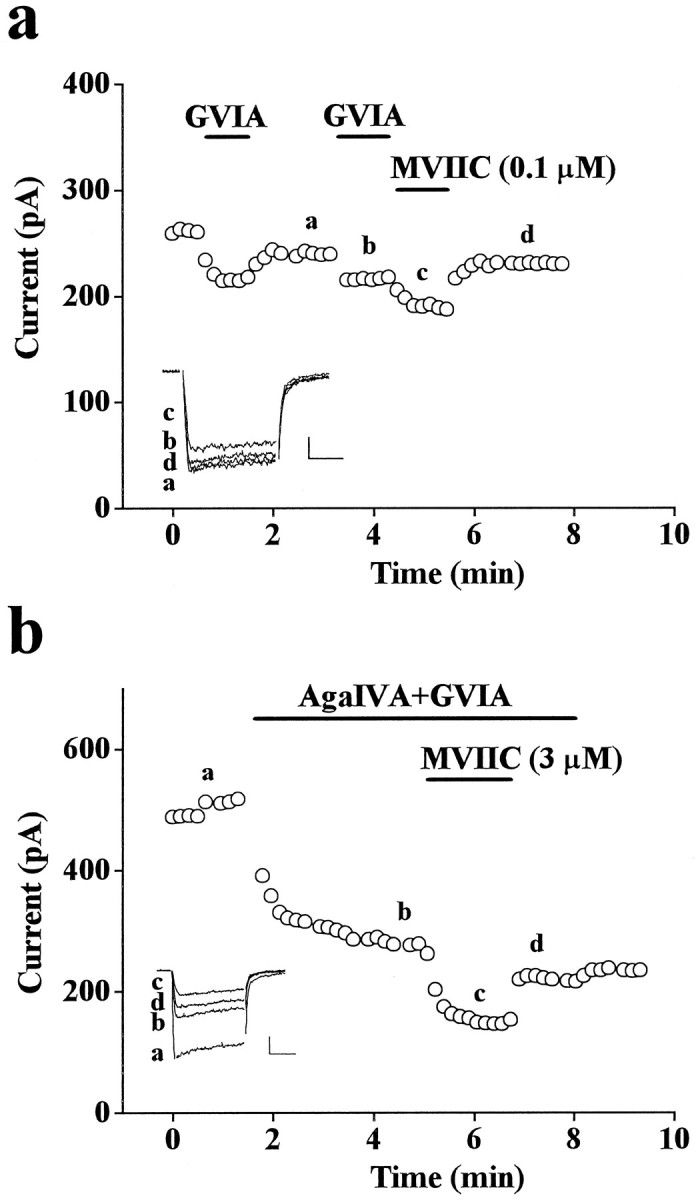
Pharmacological properties of DHP-insensitive whole-cell Ba2+ current of rat cerebellar granule cells. Whole-cell recordings with 5 mm Ba2+ as charge carrier in the continuous presence of 3–5 μm nimodipine to inhibit L-type channels. a, Plot of peak Ba2+ current versus time for an experiment in which 1 μm GVIA and 3 μm MVIIC were sequentially applied and then washed; examples of traces from the same experiment were taken at times indicated by a, b, c.Inset, Calibration: 50 pA, 20 msec. Depolarizations 56 msec long (Vt = −10 mV) were delivered every 10 sec from Vh = −90 mV. Cell T84D. Shown on the right are representative traces recorded during 720-msec-long depolarizations (from a different experiment: cell U22H; calibration: 50 pA, 80 msec). Trace a, Total DHP-insensitive current, 38% current decay after 720 msec, biexponential best fit with τ1 = 50 msec, τ2 = 1938 msec, and relative amplitudes of 0.5 and 99.5% (average values: τ1 = 46 ± 3 msec, τ2 = 1979 ± 51 msec; relative amplitudes 0.4 and 99.6%;n = 11). Trace c, Resistant current in the presence of MVIIC and GVIA, 57% decay after 720 msec, biexponential best fit with τ1 = 40 msec, τ2 = 1177 msec, and relative amplitudes of 1.3 and 98.7% (average values: τ1 = 66 ± 11 msec, τ2 = 1196 ± 104 msec; relative amplitudes 2 and 98 ± 1%, respectively; n = 4). Traces a–c, Difference current, 31% decay after 720 msec, biexponential best fit with τ1 = 57 msec, τ2 = 2000 msec, and relative amplitudes 0.3 and 99.7%.b, Dose–response curve for Ni2+ inhibition of the resistant current recorded in the presence of (in μm): 5 nimodipine, 1 GVIA, and 5 MVIIC. Data were pooled from five cells. The data points were best fit by the sum of two Langmuir adsorption isotherms with dissociation constantsKd1 = 11.8 μm andKd2 = 286 μm, number of binding sites n1 = 1.9 andn2 = 1.1, and relative amplitudes 52 and 48%, respectively. Representative traces of resistant current during 720-msec-long depolarizations (Vt = −10 mV;Vh = −90 mV) before and after addition of 100 μm Ni2+ are shown on thebottom (calibration: 50 pA, 80 msec). Percentage of decay (67%) and time course of decay (τ1 = 78 msec, τ2 = 1029 msec) of the resistant current inhibited by 100 μm Ni2+ were similar to those of the total resistant current. Cell U13C.
Fig. 1.

G2 and G3 Ca2+ channels of rat cerebellar granule cells are not blocked irreversibly by MVIIC. Cell-attached recordings with 90 mm Ba2+ as charge carrier. Shown are representative current traces and normalized current amplitude histograms from all traces with activity of single G2 and G3 channels at −10 mV. Depolarizations were 720 msec long and were delivered every 4 sec from holding potentials of −80 to −100 mV. Records were sampled and filtered at 5 and 1 kHz, respectively.Control: G2, unitary current i = 0.69 pA, average open probability Po = 0.20, cell N03C; G3, i = 1.05 pA,Po = 0.06, cell N56B [in the presence of 1 μm (+)-(S)-202-791 in the incubation bath]. MVIIC: Cell-attached recordings with 3 μm MVIIC in pipette after incubation of neurons with 10 μm MVIIC in the potassium gluconate bath solution [and in the presence of 0.5 μm(+)-(S)-202-791]. G2, i = 0.68 pA,Po = 0.23, one L-type channel was also present in the patch (compare unresolved openings of higher amplitude in second trace), cell U24A; G3, i = 0.95 pA,Po = 0.06, cell U23D. In paired control and MVIIC recordings (i.e., performed alternatively on the same neuronal preparation at each day in culture), G2 channels were observed in 9 of 42 patches in controls and in 4 of 32 patches with MVIIC; G3 channels were observed in 8 of 40 patches in controls and in 4 of 31 patches with MVIIC (excluding all multichannel patches for which identification was uncertain). G2 and G3 channels were identified on the basis of their unitary current and conductance and on the basis of the voltage range for activation (compare Table 1 and Forti et al., 1994).
Recently, Randall and Tsien (1995) subdivided the MVIIC-sensitive current of cerebellar granule cells into two components on the basis of their different sensitivities to ω-AgaIVA: a noninactivating P-type component inhibited by ω-AgaIVA with a Kd ∼1 nm (as in Purkinje cells) and a slowly inactivating Q-type component inhibited by ω-AgaIVA with a Kd∼90 nm. The biophysical properties of our MVIIC-sensitive G1 channels are closer to those of the Q-type component as defined by Randall and Tsien than to those of P-type channels in Purkinje cells. However, because the pharmacological distinction between P- and Q-type channels is based on different affinities for ω-AgaIVA, it was necessary to assess the sensitivity of G1 channels to ω-AgaIVA before classifying them as either Q-type channels or P-type channels functionally different from those of Purkinje cells.
The interpretation of results obtained by using single-channel recordings and a protocol similar to that used with MVIIC to investigate the sensitivity of G1 channels to ω-AgaIVA is complicated by the relatively small difference in affinity for ω-AgaIVA of P- and Q-type channels, which was established on the basis of whole-cell recordings with low Ba2+ concentrations and the difficulty in predicting the relative affinities of P- and Q-type channels in the presence of high Ba2+ concentrations. An additional complicating factor is the voltage dependence of ω-AgaIVA binding (Mintz et al., 1992b), which makes it difficult to predict the relative affinities of P- and Q-type channels in the depolarizing K-gluconate bath solution used in our cell-attached recordings. Moreover, in our hands, the presence of ω-AgaIVA in the pipette solution led to destabilization of the seal. We therefore investigated the sensitivity of G1 channels to ω-AgaIVA with whole-cell recordings after ascertaining that both functional and pharmacological properties of the DHP-insensitive whole-cell Ba2+ current were similar to those of G channels (G1 + G2 + G3) in cell-attached patches.
Figure 2 shows the voltage-dependent properties of the whole-cell current recorded with 5 mm Ba2+ as charge carrier in the continuous presence of 3 μmnimodipine. At this concentration, nimodipine inhibited on average 24 ± 2% (n = 12) of total current (at holding potential Vh = −90 mV and test potentialVt = −10 mV) and was saturating for L-type current inhibition (data not shown; cf. Amico et al., 1995). Given the small fraction of DHP-insensitive current blocked irreversibly by GVIA (10 ± 2%, n = 10), this current should be attributable mainly to Ba2+ influx through G1, G2, and G3, the three types of channels observed most frequently (together with L-type) in cell-attached patches of cerebellar granule cells (Forti and Pietrobon, 1993; Forti et al., 1994). In reasonable agreement with the steady-state activation and inactivation properties of single G-type channels, significant DHP-insensitive inward current was recorded by depolarizing the membrane above −50 mV (from holding potentialVh = −90 mV; Fig. 2b), and this current was reduced progressively to almost zero by increasing the holding potential from −110 to −40 mV (Fig.2c).
Fig. 2.

Biophysical properties of DHP-insensitive whole-cell Ba2+ current of rat cerebellar granule cells. Whole-cell recordings with 5 mm Ba2+ as charge carrier in the continuous presence of 3–5 μm nimodipine to inhibit L-type channels. a, Representative traces at increasing test depolarizations (Vt = −50 to −10 mV) from holding potential Vh = −90 mV (top) and representative traces atVt = −10 mV from different holding potentials (Vh = −40 to −100 mV) in the same cell (cell U04A). Depolarizations were 56 msec long and were delivered every 10 sec. The traces at differentVh were recorded after the attainment of the new steady-state value after each change ofVh (i.e., after at least 1 min from the change). b, Peak normalized Ba2+ currentIn as a function ofVt (Vh = −90 mV). Data were pooled from five cells. For each cell the current was normalized with respect to maximal peak current at −10 mV. Thedashed lines are the fractional contributions to whole-cell current of G1, G2, and G3 at differentVt, predicted from their single-channel properties, assuming that the DHP-insensitive current was entirely attributable to G channels. The contribution of each channel was calculated as i × Po × % obs × (100 − % nulls) at eachVt, in which i is the unitary current, Po is the open probability in active traces, % obs is the frequency of observation in cell-attached patches, and % nulls is the fraction of traces without activity atVh = −90 mV [values taken from Forti et al. (1994); compare Table 1] and assuming an average of 20 mV more negative surface potential at the lower Ba2+ concentration of whole-cell with respect to single-channel recordings.c, Peak normalized Ba2+ currentIn as a function of holding potentialVh (Vt = −10 mV). Data were pooled from five cells. For each cell the current was normalized with respect to maximal current atVh = −110 mV. The data points were best fit by a Boltzmann distribution function of the formIn = In max × {1 + exp [(V − V1/2)/k]}−1with V1/2 = −74.9 mV, k = 16.9 mV, and In max = 1.12 (continuous line). The dashed line is the sum of two Boltzmann functions (see below). d, Peak Ba2+ current as a function of Vtat Vh = −90 mV (circles) andVh = −60 mV (squares). Cell T43E. e, Steady-state inactivation curves atVt = −30 mV (squares), atVt = −10 mV (circles), andVt = +10 mV (triangles). Cell U21B. Peak currents were normalized with respect to the current atVh = −100 mV for eachVt. The steady-state inactivation curve at −30 mV was best fit by a Boltzmann function withV1/2 = −85.5 mV, k = 11.5 mV, and In max = 1.3. The steady-state inactivation curves at −10 and +10 mV were fit by Boltzmann functions with V1/2 = −73.6, k = 15.3, In max = 1.18; andV1/2 = −63.7, k = 13.7, In max = 1.07 (continuous lines). Dashed lines are best fits with two Boltzmann distributions. The best fit of the steady-state inactivation curve at +10 mV was obtained with (V1/2)2 = −55.9 mV andk2 = 10.8, using for (V1/2)1 andk1 the values obtained from the best fit of the steady-state inactivation curve at −30 mV (relative amplitudes from best fit: 33 and 67% for components 1 and 2, respectively). Although two Boltzmann functions did not fit better than one, the steady-state inactivation curve at −10 mV, using (V1/2)1 = −85.5 mV,k1 = 11.5 mV and (V1/2)2 = −55.9 mV,k2 = 10.8, the best fit was obtained with relative amplitudes of 58 and 42% for components 1 and 2, respectively. Using as parameters for the two Boltzmann functions the average values obtained from three experiments [(V1/2)1 = −90.4,k1 = 10.9; (V1/2)2 = −58.2,k2 = 11.8], we obtained the best fit of the average inactivation curve at −10 mV (dashed line inc) with relative amplitudes of 46 and 54% for components 1 and 2, respectively.
From the combined more negative voltage range for steady-state inactivation and more negative voltage threshold for activation of G2 and G3 channels with respect to G1, one expects that (1) the threshold for current activation should shift toward more positive voltages if the holding potential is changed toward less negative values, and (2) the voltage range of steady-state inactivation should shift toward more positive voltages if the test depolarization is changed from values (e.g., −30 mV) in which almost all of the current is predicted to be through G2 and G3 channels to values (e.g., +10 mV) in which most of the current is predicted to be through G1 channels (see Fig.2b, fractional contributions to whole-cell current of G1, G2, and G3 predicted from their single-channel properties and their relative abundance in cell-attached patches). These predictions were confirmed by our results. When the holding potential was changed from −90 to −60 mV, significant DHP-insensitive inward current started to be recorded at more positive voltages (Fig. 2d). Moreover, the fractional current inactivation atVh = −60 mV was reduced progressively from 80 to 45% with increasing Vt in the range from −30 to −10 mV (the range in which the fractional contribution to whole-cell current of G2 plus G3 channels is expected to decrease and that of G1 to increase). When the test depolarization was changed from −30 to +10 mV, the voltage range of steady-state inactivation was shifted toward more positive voltages (Fig. 2e). An intermediate steady-state inactivation curve was obtained atVt = −10 mV, in which G1 and G2 plus G3 channels are expected to contribute similar amounts of whole-cell current. In agreement with the inactivation properties of G2 and G3 channels, steady-state inactivation of the current at −30 mV occurred over a very negative voltage range (V1/2 = −90.4 ± 1.7, n = 3) and was almost complete atVh = −60 mV. Fitting steady-state inactivation curves at +10 mV with two Boltzmann distributions provided a value ofV1/2 = −58.2 ± 1.7 (n = 3) for the Boltzmann distribution at more positive voltages, which should describe steady-state inactivation of G1 channels in isolation (with some negligible contribution from the small fraction of N-type channels). In good agreement with the prediction on the basis of single-channel properties of G channels, steady-state inactivation curves at −10 mV were best fit (using the parameters obtained for G2 plus G3 and G1 currents in isolation), assuming a similar contribution of G2 plus G3 and G1 channels to the whole-cell current at −10 mV (see legend, Fig. 2e).
Besides the biophysical properties, the pharmacological properties of the DHP-insensitive whole-cell current of cerebellar granule cells are also consistent with the conclusion that most of this current is attributable to Ba2+ influx through G1, G2, and G3 channels (Fig. 3). GVIA inhibited only a relatively small component of DHP-insensitive current (average total inhibition 20 ± 2%, n = 25; Vh = −90 mV;Vt = −10 mV) and, in general, only a fraction of it in an irreversible manner (average irreversible inhibition 10 ± 2%, n = 10). In contrast, as expected from the irreversible block by MVIIC of G1 channels, MVIIC added after GVIA inhibited slowly and irreversibly a large component of DHP-insensitive whole-cell current (43 ± 2%, n = 20). The average time constant of inhibition by 3 μm MVIIC, added after GVIA, was 87 ± 11 sec (n = 6). As expected from single-channel recordings, a large component of current, similar in amplitude to that inhibited by MVIIC, was resistant to both GVIA and MVIIC (38 ± 2%, n = 21). In agreement with the inactivation kinetics of single G2 channels, this resistant whole-cell current inactivated relatively slowly (on average 56 ± 4% at the end of 720-msec-long depolarizations to −10 mV, n = 4) and displayed a biexponential time course. As expected from the relatively slower inactivation of G1 channels with respect to G2 (Table1), the percentage of decay of the total DHP-insensitive current was smaller than that of the resistant current (38 ± 1%,n = 11), and the time constant of the primarily prevailing slow component of the biexponential inactivation time course was larger (see legend, Fig. 3a).
Figure 3b shows that the resistant current consisted of at least two components with differential sensitivity to Ni2+block, one extremely sensitive and inhibited by Ni2+ with an IC50 of 3.8 μm, the other less sensitive and inhibited by Ni2+ with an IC50 of 153 μm. The two components contributed approximately equally to the resistant current.
Because the biophysical and pharmacological properties of the DHP-insensitive whole-cell current and of single G channels are quite similar, we can assess whether G1 channels belong to the pharmacological category of P- or Q-type by studying the effect of low doses of ω-AgaIVA on whole-cell Ba2+ current. We used 30 nm ω-AgaIVA, a concentration that should be saturating for block of P-type channels and only partially inhibitory for Q-type channels, and based our discrimination between P- and Q-type channels on the absence or presence of further inhibition of whole-cell current by higher doses of ω-AgaIVA.
Figure 4 shows that ω-AgaIVA concentrations above 30 nm hardly caused further inhibition of DHP-insensitive whole-cell current. Inhibition by ω-AgaIVA was not removed by wash (Fig. 4b) but could be completely removed by two series of ten 50-msec-long depolarizations to +130 mV (indicated by Pin Fig. 4a). The average time constant of inhibition by 30 nm ω-AgaIVA was 80 ± 12 sec (n = 5). The properties of ω-AgaIVA block, including time course, saturation at 50 nm, and voltage dependence, are quite similar to those reported previously in cerebellar Purkinje cells and used to define P-type Ca2+ channels (Mintz et al., 1992a,b). We decided to distinguish between P- and Q-type pharmacology on the basis of the absence or presence of further inhibition by concentrations of ω-AgaIVA higher than 30 nm and not on the basis of the effect of lower concentrations of toxin, because it was difficult to separate the very slow kinetics of inhibition by ≤10 nm ω-AgaIVA from those (variable from cell to cell) of rundown and to establish when steady-state inhibition had been reached. However, we measured the inhibition of the DHP-insensitive current produced by sequential additions of 5 and 50 nm ω-AgaVA in six neurons with negligible rundown. After 5 min from the addition (a time that was sufficient to reach steady-state inhibition with 50 nm, but not with 5 nm toxin), 50 nmω-AgaIVA inhibited 52 ± 3% of non-L current (in good agreement with the data in Fig. 4c from a different group of 12 cells), and 5 nm ω-AgaIVA inhibited 16 ± 1% of the same current. Thus, 5 nm ω-AgaIVA inhibits at least 31 ± 2% of the total ω-AgaIVA-sensitive component of whole-cell current of cerebellar granule cells, in good agreement with the data reported by Mintz et al. (1992a) in cerebellar Purkinje cells (see their Fig. 3c).
Fig. 4.

Inhibition by ω-AgaIVA of whole-cell Ba2+ current of rat cerebellar granule cells.a, Plot of peak Ba2+ current versus time for an experiment in which 30, 50, and 100 nm ω-AgaIVA were applied sequentially and then washed. After washing, two series of ten 50-msec-long depolarizations to +130 mV separated by 3 msec atVh = −90 mV and 10 msec atVt = −10 mV were applied (indicated byP). Nimodipine (3 μm) was present throughout. Examples of traces from the same experiment, taken at times indicated by a, b, c, d, are shown on theright (calibration: 100 pA, 20 msec). Cell T56E.b, Plot of peak Ba2+ current versus time for an experiment in which 100 and 200 nm ω-AgaIVA were applied sequentially and then washed. Vh = −100 mV; Vt = −10 mV. Cell C66A.c, Average inhibition of DHP-insensitive current by 30 nm ω-AgaIVA (44 ± 3%, n = 15), 50 nm ω-AgaIVA (54 ± 3%, n = 12), and 100 nm ω-AgaIVA (52 ± 3%,n = 11). The averages at different concentrations of toxin were obtained from the same preparations. Statistical significance of 10% difference of inhibition between 30 and 50 nm ω-AgaIVA: p < 0.03; Student’st test.
If, as suggested by the data in Figure 4, Q-type Ca2+channels are not present in significant amount in our cerebellar granule cells, then (1) the average fraction of current inhibited by 50 nm ω-AgaIVA should be quantitatively similar to that inhibited by 3 μm MVIIC added after GVIA, and (2) low doses of ω-AgaIVA should occlude most of the slow and irreversible block produced by MVIIC. Figure 5 shows that both predictions were verified by our data. We conclude that MVIIC and low doses of ω-AgaIVA inhibit the same channels and that these Ca2+ channels can be classified pharmacologically as P-type channels.
Fig. 5.

MVIIC and low doses of ω-AgaIVA inhibit the same type of Ca2+ channels in rat cerebellar granule cells. Whole-cell recordings with 5 mm Ba2+ as charge carrier in the continuous presence of 3–5 μm nimodipine. Depolarizations 56 or 136 msec long were delivered every 10 sec.Vt = −10 mV; Vh = −90 mV. a, Filled bars, Average fractional inhibition of DHP-insensitive current by 1 μmGVIA (reversible + irreversible; 20 ± 2%, n = 25), by 50 nm ω-AgaIVA (47 ± 3%,n = 20), by 3 μm MVIIC added after GVIA (MVIIC*; 43 ± 2%, n = 20), and average fractional current remaining in the presence of nimodipine plus GVIA plus MVIIC (R; 38 ± 2%,n = 21). Empty bars, Sum of pharmacological current components indicated below. The sum of the average fraction of DHP-insensitive current resistant to GVIA and MVIIC and the average fraction of current inhibited by GVIA and that inhibited by low doses of ω-AgaIVA amounted to 104 ± 7%. In agreement with Amico et al. (1995) and in contrast with Pearson et al. (1995), there seems to be no significant overlapping selectivity between GVIA and ω-AgaIVA. b, Plot of peak Ba2+ current versus time for an experiment in which 50 nm ω-AgaIVA plus 2 μm GVIA and 3 μm MVIIC were sequentially applied and then washed.Vh = −90 mV; Vt = −10 mV. Inset, Traces taken at times a, b, c (calibration: 50 pA, 20 msec). Cell T82F. On average, the fraction of non-L current inhibited irreversibly by 3 μmMVIIC added after 50 nm ω-AgaIVA (+GVIA) was 10 ± 1% (n = 5).
In agreement with the almost complete inactivation of whole-cell current at Vh = −40 mV (Fig.2c), our single-channel data show a relatively high density of G1 channels inhibited irreversibly by MVIIC and no evidence for the presence of noninactivating P-type channels [because the rare noninactivating single channels mentioned in Forti et al. (1994) were not blocked by MVIIC; our unpublished results]. We then expect that the channels inhibited by MVIIC and low doses of ω-AgaIVA are G1 channels. Indeed, the biophysical properties of the whole-cell current component inhibited by 30 nm ω-AgaIVA are similar to those of G1 channels and quite different from those of P-type channels in Purkinje cells, both in inactivation kinetics and in steady-state inactivation properties (Fig. 6; compare also Fig. 3). Taking advantage of the complete removal of ω-AgaIVA block by a series of positive prepulses, we could measure in the same cell the amount of current inhibited by ω-AgaIVA (30 nm) at two different holding potentials (−90 and −60 mV). Figure 6 shows that the amount of current inhibited while holding at −90 mV (126 pA) was approximately twice that inhibited while holding at −60 mV (66 pA), as expected for G1 channels, a fraction of which should be inactivated at −60 mV and contrary to what is expected for P-type channels in Purkinje cells that do not display steady-state inactivation in the range −90 to −60 mV (Regan, 1991; Usowicz et al., 1992). On average, the amount of current inhibited at −90 mV by low doses of ω-AgaIVA was 1.9-fold ± 0.03 (n = 3) that inhibited at −60 mV. We can, therefore, conclude that G1 channels are P channel subtypes with functional properties different from those of Purkinje cells.
Fig. 6.

The Ca2+ channels inhibited by low doses of ω-AgaIVA have inactivation properties similar to those of G1 channels. a, Plot of peak Ba2+ current versus time for an experiment in which the holding potential was varied as indicated, and the inhibition by 30 nm ω-AgaIVA was measured first at Vh = −60 mV and then atVh = −90 mV, after removal of previous block by a series of ten 50-msec-long depolarizations to +130 mV (indicated by P). Nimodipine (3 μm) was present throughout. Vt = −10 mV. Cell T48C.b, Representative traces taken at times indicated by a, b in a and corresponding difference current. Calibration: 50 pA, 20 msec.
Figure 7 displays the properties of a small component of current, measurable only in some cells, which was inhibited rapidly and reversibly by low concentrations of MVIIC. Panel a shows that 100 nm MVIIC inhibited reversibly both the component of current inhibited reversibly by 1 μm GVIA and a small additional component, which amounted on average to 10 ± 1% (n = 9) of the total DHP-insensitive current. Panelb shows that the rapid and reversible block by MVIIC of this component was not occluded by 50 nm ω-AgaIVA (+GVIA). Given the rapidity (complete block in <1 min with 100 nmMVIIC) and reversibility of block, this small component does not have the properties of a Q-type current as defined in Randall and Tsien (1995) and is similar to the “Q-like” current described by Magnelli et al. (1995).
Fig. 7.
Properties of a small current component inhibited rapidly and reversibly by MVIIC. Plots of peak Ba2+ current versus time from whole-cell recordings in the continuous presence of 3 μm nimodipine. Depolarizations 56 msec long were delivered every 10 sec. Vt = −10 mV;Vh = −90 mV. a, GVIA (1 μm) inhibited 17% of non-L current. Of this inhibition, 50% was recovered by wash and was reinhibited by a subsequent addition of the same concentration of GVIA. As shown by the fraction of current recovered after wash, 100 nm MVIIC inhibited reversibly both the component of current inhibited reversibly by GVIA and an additional 11% of total non-L current. Inset, Traces taken at times a, b, c, d (calibration: 50 pA, 20 msec). Cell T93F. b, The reversible inhibition by MVIIC is not occluded by low doses of ω-AgaIVA. In the presence of 50 nm ω-AgaIVA and 1 μm GVIA, MVIIC (3 μm) inhibited rapidly and reversibly 15% of total non-L current. Inset, Traces taken at times a, b, c, d. Calibration: 100 pA, 20 msec. Cell T91E.
The pharmacological properties of G1, G2, and G3 channels, as derived from this and our previous study (Forti et al., 1994), are summarized in Table 2.
Table 2.
Pharmacological properties of G1, G2, and G3 Ca2+ channels
| G1 | G2 | G3 | |
|---|---|---|---|
| Nimodipine (3 μm) | no | no | no |
| ω-CgTx-GVIA (2 μm) | no2_a | no2_a | no2_a |
| ω-CTx-MVIIC (3 μm) | yes | no2_a | no2_a |
| ω-AgaIVA (50 nm) | yes | no | no |
Refers to irreversible block; our data do not exclude that some G channels might be reversibly and partially blocked by ω-CgTx-GVIA and/or ω-CTx-MVIIC.
The concentrations of toxins and nimodipine indicated in parentheses are saturating for block.
DISCUSSION
By combining single-channel and whole-cell patch-clamp recordings, we have established the sensitivity to ω-AgaIVA and MVIIC of G1, G2, and G3, the three novel non-L, non-N-type Ca2+ channels recently characterized in rat cerebellar granule cells in primary culture (Forti et al., 1994; Table 1). We have shown that neither G2 nor G3 channels are blocked irreversibly by MVIIC, whereas G1 channels are blocked irreversibly by both MVIIC and low doses of ω-AgaIVA.
The characteristics of ω-AgaIVA block of G1 channels, namely its saturation at 50 nm toxin, its relatively fast kinetics, its irreversibility by prolonged wash, and its relief by prepulses to very positive voltages, are all similar to those reported for ω-AgaIVA block of P-type channels in Purkinje cells and other neurons (Mintz et al., 1992a,b; Umemiya and Berger, 1994). Thus, according to pharmacological criteria, G1 channels must be classified as P-type rather than Q-type Ca2+ channels, although they are slowly inactivating during depolarizing pulses and are completely inactivated at voltages in which steady-state inactivation of P-type channels in Purkinje cells is negligible (Regan, 1991; Usowicz et al., 1992). Our data do not exclude a small difference in affinity for ω-AgaIVA between G1 channels and P-type channels of Purkinje cells, but they do exclude that such difference would exceed a factor of 10 and thus be larger than the differences in affinities reported for different N or L channel subtypes (Welling et al., 1993; Boland et al., 1994; Dunlap et al., 1995).
In contrast to Randall and Tsien (1995), our data do not support the subdivision of the ω-AgaIVA-sensitive whole-cell current of cerebellar granule cells into a noninactivating P-type component inhibited by ω-AgaIVA with a Kd ∼1 nm and a slowly inactivating Q-type component inhibited with a Kd ∼90 nm (cf. also Pearson et al., 1995). The reason for the conflicting result remains uncertain. It might be attributable simply to expression of different Ca2+ channels in cerebellar granule cells maintained in culture under different conditions (in particular, different concentration of K+ ions in culture medium). Alternatively, because the actual data of Randall and Tsien (1995) show at most only 10–15% additional inhibition by 1 μmω-AgaIVA with respect to 100 nm, most of the conflict might be only apparent and be partly resolved if one admits that (1) the assumption that ω-AgaIVA inhibits with high affinity only a noninactivating current may not be right (as shown by our data), and the consequent fitting of doses–responses with two one-to-one binding curves may lead to an overestimation of the Kdfor the inactivating component, and (2) block of this component is saturated at 100 nm ω-AgaIVA, and the additional small fraction of current inhibited at higher concentrations of toxin may be attributable to block of other Ca2+ channels, perhaps the same channels that account for the small component inhibited rapidly and reversibly by MVIIC shown in Figure 7. These channels do not fit into any previously described pharmacological class of Ca2+channels (except maybe the O-type of Olivera et al., 1994; cf. Magnelli et al., 1995).
By showing that G1 channels represent a novel P channel subtype, our results uncover functional diversity of native P-type channels and should warn against considering lack of inactivation and steady-state inactivation at relatively positive voltages as distinctive properties of P-type channels on the one hand and slow inactivation and steady-state inactivation at relatively negative voltages as distinctive properties of Q-type channels on the other hand. The recognition of P channel subtypes with distinct biophysical properties is important, because they are expected to be differentially activated during different patterns of neuronal activity.
Given the good correlation between densities of ω-AgaIVA-sensitive currents and levels of α1A mRNA and α1Aimmunostaining in rat cerebellar Purkinje and granule cells (Stea et al., 1994; Westenbroek et al., 1995), it is very likely that both the noninactivating P subtype of Purkinje cells and the slowly inactivating P subtype (G1) of granule cells are encoded by α1A. It remains unknown whether the different biophysical properties of the two native P subtypes are exclusively attributable to different β subunits (Sather et al., 1993; Stea et al., 1994; Yatani et al., 1994;De Waard and Campbell, 1995) or whether different α1Asplice variants contribute to the functional diversity. Interestingly, a high density of α1A has been found in the terminals of the parallel fibers of rat cerebellar granule cells (Westenbroek et al., 1995), and Ca2+ channels with a P-type pharmacology have been shown to mediate 50% of Ca2+ influx controlling neurotransmitter release at the granule cell to Purkinje cell synapse in rat cerebellar slices (Mintz et al., 1995). Whether the P channel located in the terminals is the same inactivating subtype (G1) that we have characterized in the bodies of granule cells is unknown.
Besides functional diversity of P-type Ca2+ channels, our study uncovers functional diversity of R-type Ca2+channels, because both G2 and G3 are resistant to DHPs, GVIA, and MVIIC. G2 and G3 differ mainly in single-channel conductance and unitary current and in voltage range for activation (see Table 1). Given the biphasic dose–response curve for Ni2+ block of the whole-cell current resistant to nimodipine, GVIA, and MVIIC (Fig.3), they might differ also in Ni2+ sensitivity, suggesting that a relatively high Ni2+ sensitivity may not be a general property of all R subtypes. In contrast with the fast inactivation reported for R-type current in cerebellar granule cells byZhang et al. (1993), both G2 and G3 inactivate relatively slowly (Fig.3; Forti et al., 1994). However, in a minority of granule cells, we have observed a small component of whole-cell current inactivating rapidly as in Zhang et al. (1993; data not shown), suggesting further heterogeneity of R-type channels. Functional diversity of native R-type channels is consistent with the widely different biophysical properties reported for α1E coexpressed with different β subunits (Soong et al., 1993; Olcese et al., 1994; Wakamori et al., 1994).
Neither a classification as LVA Ca2+ channels nor as HVA Ca2+ channels seems appropriate for the two R subtypes of cerebellar granule cells (especially for G2). The quite negative voltage range for steady-state inactivation of G2 channels (V1/2 = −90 mV) is rather similar to that reported for T-type currents in different CNS neurons (Akaike et al., 1989; Mogul and Fox, 1991; Regan, 1991; Huguenard and Prince, 1992). On the other hand, the slow inactivation and the high-affinity block by Cd2+ of both G2 and G3 (Forti et al., 1994) associate them to HVA Ca2+ channels rather than to LVA Ca2+channels, which have in common a much faster inactivation (complete in 50–300 msec) and a smaller sensitivity to Cd2+ block (Bossu et al., 1985; Fox et al., 1987; Huguenard and Prince, 1992). Unitary currents and conductance and especially voltage range for activation of G2 and G3 are intermediate between those of LVA and HVA channels, with values closer to those of LVA for G2 and to those of HVA for G3 (Table 1).
Given the low threshold for activation, G2 channels are expected to be activated by subthreshold EPSPs, as recently shown for LVA channels in dendrites of hippocampal and cortical neurons (Markram and Sakmann, 1994; Magee and Johnston, 1995). Moreover, given their steady-state inactivation properties, their contribution to EPSP- or action potential-evoked Ca2+ transients is expected to be strongly dependent on previous hyperpolarization or prolonged depolarization of the neuronal membrane. Thus, G2 channels may have a potentially important role in the generation of calcium spikes, in synaptic integration, and in postsynaptic forms of plasticity known to involve Ca2+ influx.
The ranges for voltage-dependent activation and inactivation of G1, G2, and G3 vary gradually and form almost a continuum along the voltage axis. Thus it is not surprising that both current–voltage and steady-state inactivation curves of DHP-insensitive Ca2+current of granule cells (Fig. 2b,c) do not show signs of multiple kinetic components. However, the presence of multiple Ca2+ channels with slightly different voltage-dependent properties becomes apparent from the different current–voltage relations obtained at different holding potentials and the different steady-state inactivation curves obtained at different test depolarizations (Fig. 2d,e). Because the fractional contribution of P and R Ca2+ channel subtypes to the whole-cell current are expected to be quite different at different test depolarizations and holding potentials (compare Fig. 2b), some of the differences in functional and pharmacological properties of whole-cell Ca2+ current reported for cerebellar granule cells in different laboratories may be attributable to the different voltage protocols adopted (De Waard et al., 1991; Slesinger and Lansman, 1991; Rossi et al., 1994; Amico et al., 1995; Pearson et al., 1995; Randall and Tsien, 1995).
The results reported in this and our previous articles (Forti and Pietrobon, 1993; Forti et al., 1994) show that each of the pharmacological classes of native neuronal Ca2+ channels comprises various members with distinct biophysical properties and that Ca2+ channels with similar pharmacological but distinct biophysical properties can be coexpressed in a single type of neuron. It seems likely that the large potential for combinatorial structural heterogeneity of brain Ca2+ channels revealed by molecular biology may indeed be fully exploited in native neuronal membranes. Structural and functional heterogeneity of neuronal Ca2+channels provides significant flexibility in the fine tuning of Ca2+-dependent functions and may be the basis for selective modification of local Ca2+-dependent events during specific patterns of neuronal activity.
Footnotes
The financial support of Telethon-Italy (Grants 392 and 720) to D.P. is gratefully acknowledged. This work was also partially supported by grants from the Regione del Veneto (Giunta Regionale-Ricerca Sanitaria Finalizzata-Venezia-Italia) and the Italian Research Council (Consiglio Nazionale delle Ricerche) Target Project Aging to D.P.; it is in partial fulfillment of the doctoral programs of the University of Padova in Molecular and Cellular Biology and Pathology (A.T.) and in Pharmacology and Toxicology (A.M.). We thank Drs. J. R. Bell and L. Nadasdi of Neurex Corporation for providing ω-conotoxin MVIIC (SNX-230), Dr. N. A. Saccomano of Pfizer for providing the ω-AgaIVA used in most of our experiments, and Dr. M. Adams for providing the ω-AgaIVA used in our initial experiments. We thank Drs. E. Carbone, G. Carmignoto, and B. Hivert for critically reading this manuscript.
Correspondence should be addressed to Dr. Daniela Pietrobon, Department of Biomedical Sciences, University of Padova, Via Trieste 75, 35131 Padova, Italy.
REFERENCES
- 1.Akaike N, Kostyuk PG, Osipchuk YV. Dihydropyridine-sensitive low threshold calcium channels in isolated rat hypothalamic neurones. J Physiol (Lond) 1989;412:181–195. doi: 10.1113/jphysiol.1989.sp017610. [DOI] [PMC free article] [PubMed] [Google Scholar]
- 2.Amico C, Marchetti C, Nobile M, Usai C. Pharmacological types of calcium channels and their modulation by baclofen in cerebellar granules. J Neurosci. 1995;15:2839–2848. doi: 10.1523/JNEUROSCI.15-04-02839.1995. [DOI] [PMC free article] [PubMed] [Google Scholar]
- 3.Augustine GJ, Neher E. Neuronal Ca2+ signalling takes the local route. Curr Opin Neurobiol. 1992;2:302–307. doi: 10.1016/0959-4388(92)90119-6. [DOI] [PubMed] [Google Scholar]
- 4.Birnbaumer L, Campbell KP, Catterall WA, Harpold MM, Hofmann F, Horne WA, Mori Y, Schwartz A, Snutch TP, Tanabe T, Tsien RW. The naming of voltage-gated calcium channels. Neuron. 1994;13:505–506. doi: 10.1016/0896-6273(94)90021-3. [DOI] [PubMed] [Google Scholar]
- 5.Boland LM, Morrill JA, Bean BP. ω-Conotoxin block of N-type calcium channels in frog and rat sympathetic neurons. J Neurosci. 1994;14:5011–5027. doi: 10.1523/JNEUROSCI.14-08-05011.1994. [DOI] [PMC free article] [PubMed] [Google Scholar]
- 6.Bossu JL, Feltz A, Thomann JM. Depolarization elicits two distinct calcium currents in vertebrate neurones. Pflügers Arch. 1985;403:360–368. doi: 10.1007/BF00589247. [DOI] [PubMed] [Google Scholar]
- 7.Carbone E, Lux HD. A low voltage-activated, fully inactivating Ca channel in vertebrate sensory neurones. Nature. 1984;310:501–511. doi: 10.1038/310501a0. [DOI] [PubMed] [Google Scholar]
- 8.Carbone E, Sher E, Clementi F. Ca currents in human neuroblastoma IMR32 cells: kinetics, permeability, and pharmacology. Pflügers Arch. 1990;416:170–179. doi: 10.1007/BF00370239. [DOI] [PubMed] [Google Scholar]
- 9.De Waard M, Campbell KP. Subunit regulation of the neuronal α1A Ca2+ channel expressed in Xenopus oocytes. J Physiol (Lond) 1995;485:619–634. doi: 10.1113/jphysiol.1995.sp020757. [DOI] [PMC free article] [PubMed] [Google Scholar]
- 10.De Waard M, Feltz A, Bossu JL. Properties of a high-threshold voltage-activated calcium current in rat cerebellar granule cells. Eur J Neurosci. 1991;3:771–777. doi: 10.1111/j.1460-9568.1991.tb01673.x. [DOI] [PubMed] [Google Scholar]
- 11.Dunlap K, Luebke JI, Turner TJ. Exocytotic Ca2+ channels in mammalian central neurons. Trends Neurosci. 1995;18:89–98. [PubMed] [Google Scholar]
- 12.Elmslie KS, Kammermeier PJ, Jones SW. Reevaluation of Ca2+ channel types and their modulation in bullfrog sympathetic neurons. Neuron. 1994;13:217–228. doi: 10.1016/0896-6273(94)90471-5. [DOI] [PubMed] [Google Scholar]
- 13.Forti L, Pietrobon D. Functional diversity of L-type calcium channels in rat cerebellar neurons. Neuron. 1993;10:437–450. doi: 10.1016/0896-6273(93)90332-l. [DOI] [PubMed] [Google Scholar]
- 14.Forti L, Tottene A, Moretti A, Pietrobon D. Three novel types of voltage-dependent calcium channels in rat cerebellar neurons. J Neurosci. 1994;14:5243–5256. doi: 10.1523/JNEUROSCI.14-09-05243.1994. [DOI] [PMC free article] [PubMed] [Google Scholar]
- 15.Fox AP, Nowycky MC, Tsien RW. Kinetic and pharmacological properties distinguishing three types of calcium currents in chick sensory neurones. J Physiol (Lond) 1987;394:149–172. doi: 10.1113/jphysiol.1987.sp016864. [DOI] [PMC free article] [PubMed] [Google Scholar]
- 16.Ghosh A, Greenberg ME. Calcium signaling in neurons: molecular mechanisms and cellular consequences. Science. 1995;268:239–247. doi: 10.1126/science.7716515. [DOI] [PubMed] [Google Scholar]
- 17.Hamill O, Marty A, Neher E, Sakmann B, Sigworth F. Improved patch-clamp techniques for high-resolution current recording from cells and cell-free membrane patches. Pflügers Arch. 1981;391:85–100. doi: 10.1007/BF00656997. [DOI] [PubMed] [Google Scholar]
- 18.Hillyard DR, Monje VD, Mintz IM, Bean BP, Nadasdi L, Ramachandran J, Milijanich G, Azimi-Zoonooz A, McIntosh JM, Cruz LJ, Imperial JS, Oliveira BM. A new conus peptide ligand for mammalian presynaptic Ca2+ channels. Neuron. 1992;9:69–77. doi: 10.1016/0896-6273(92)90221-x. [DOI] [PubMed] [Google Scholar]
- 19.Huguenard JR, Prince DA. A novel T-type current underlies prolonged Ca2+-dependent burst firing in GABAergic neurons of rat thalamic reticular nucleus. J Neurosci. 1992;12:3804–3817. doi: 10.1523/JNEUROSCI.12-10-03804.1992. [DOI] [PMC free article] [PubMed] [Google Scholar]
- 20.Huguenard JR, Gutnick MJ, Prince DA. Transient Ca2+ currents in neurons isolated from rat lateral habenula. J Neurophysiol. 1993;70:158–166. doi: 10.1152/jn.1993.70.1.158. [DOI] [PubMed] [Google Scholar]
- 21.Johnston D, Williams S, Jaffe D, Gray R. NMDA-receptor independent long-term potentiation. Annu Rev Physiol. 1992;54:489–505. doi: 10.1146/annurev.ph.54.030192.002421. [DOI] [PubMed] [Google Scholar]
- 22.Kasai H, Neher E. Dihydropyridine-sensitive and ω-conotoxin-sensitive calcium channels in a mammalian neuroblastoma–glioma cell line. J Physiol (Lond) 1992;448:161–188. doi: 10.1113/jphysiol.1992.sp019035. [DOI] [PMC free article] [PubMed] [Google Scholar]
- 23.Kavalali ET, Plummer MR. Selective potentiation of a novel calcium channel in rat hippocampal neurones. J Physiol (Lond) 1994;480:475–484. doi: 10.1113/jphysiol.1994.sp020376. [DOI] [PMC free article] [PubMed] [Google Scholar]
- 24.Levi G, Aloisi M, Ciotti M, Gallo V. Autoradiographic localization and depolarization-induced release of amino acids in differentiating granule cells cultures. Brain Res. 1984;290:77–86. doi: 10.1016/0006-8993(84)90737-6. [DOI] [PubMed] [Google Scholar]
- 25.Lipton SA, Rosenberg PA. Excitatory amino acids as a final common pathway for neurologic disorders. N Engl J Med. 1994;330:613–622. doi: 10.1056/NEJM199403033300907. [DOI] [PubMed] [Google Scholar]
- 26.Llinas RR. The intrinsic electrophysiological properties of mammalian neurons: insight into central nervous system function. Science. 1988;242:1654–1664. doi: 10.1126/science.3059497. [DOI] [PubMed] [Google Scholar]
- 27.Magee JC, Johnston D. Synaptic activation of voltage-gated channels in the dendrites of hippocampal pyramidal neurons. Science. 1995;268:301–307. doi: 10.1126/science.7716525. [DOI] [PubMed] [Google Scholar]
- 28.Magnelli V, Pollo A, Sher E, Carbone E. Block of non-L, non-N-type Ca2+ channels in rat insulinoma RINm5F cells by ω-agatoxin IVA and ω-conotoxin MVIIC. Pflügers Arch. 1995;429:762–771. doi: 10.1007/BF00374799. [DOI] [PubMed] [Google Scholar]
- 29.Markram H, Sakmann B. Calcium transients in dendrites of neocortical neurons evoked by single subthreshold excitatory postsynaptic potentials via low-voltage-activated calcium channels. Proc Natl Acad Sci USA. 1994;91:5207–5211. doi: 10.1073/pnas.91.11.5207. [DOI] [PMC free article] [PubMed] [Google Scholar]
- 30.Mikami A, Imoto K, Tanabe T, Niidome T, Mori Y, Takeshima H, Narumiya S, Numa S. Primary structure and functional expression of the cardiac dihydropyridine-sensitive calcium channel. Nature. 1989;340:230–233. doi: 10.1038/340230a0. [DOI] [PubMed] [Google Scholar]
- 31.Mintz IM, Venema VJ, Swiderek KM, Lee TD, Bean BP, Adams ME. P-type calcium channels blocked by the spider toxin ω-Aga IVA. Nature. 1992a;355:827–829. doi: 10.1038/355827a0. [DOI] [PubMed] [Google Scholar]
- 32.Mintz IM, Adams ME, Bean BP. P-type calcium channels in rat central and peripheral neurons. Neuron. 1992b;9:85–95. doi: 10.1016/0896-6273(92)90223-z. [DOI] [PubMed] [Google Scholar]
- 33.Mintz IM, Sabatini BL, Regehr WG. Calcium control of transmitter release at a cerebellar synapse. Neuron. 1995;15:675–688. doi: 10.1016/0896-6273(95)90155-8. [DOI] [PubMed] [Google Scholar]
- 34.Mogul DJ, Fox AP. Evidence for multiple types of Ca2+ channels in acutely isolated hippocampal CA3 neurones of the guinea-pig. J Physiol (Lond) 1991;433:259–281. doi: 10.1113/jphysiol.1991.sp018425. [DOI] [PMC free article] [PubMed] [Google Scholar]
- 35.Neher E. Correction for liquid junction potentials in patch-clamp experiments. Methods Enzymol. 1992;207:123–131. doi: 10.1016/0076-6879(92)07008-c. [DOI] [PubMed] [Google Scholar]
- 36.Nowycky MC, Fox AP, Tsien RW. Three types of neuronal calcium channels with different calcium agonist sensitivity. Nature. 1985;316:440–443. doi: 10.1038/316440a0. [DOI] [PubMed] [Google Scholar]
- 37.Olcese R, Qin N, Schneider T, Neely A, Wei X, Stefani E, Birnbaumer L. The amino terminus of a calcium channel β subunit sets rates of channel inactivation independently of the subunit’s effect on activation. Neuron. 1994;13:1433–1438. doi: 10.1016/0896-6273(94)90428-6. [DOI] [PubMed] [Google Scholar]
- 38.Olivera BM, Milijanich GP, Ramachandran J, Adams ME. Calcium channel diversity and neurotransmitter release: the ω-conotoxins and ω-agatoxins. Annu Rev Biochem. 1994;63:823–867. doi: 10.1146/annurev.bi.63.070194.004135. [DOI] [PubMed] [Google Scholar]
- 39.Pearson HA, Sutton KG, Scott RH, Dolphin AC. Characterization of Ca2+ channel currents in cultured rat cerebellar granule neurones. J Physiol (Lond) 1995;482:493–509. doi: 10.1113/jphysiol.1995.sp020535. [DOI] [PMC free article] [PubMed] [Google Scholar]
- 40.Perez-Reyes E, Schneider T. Calcium channels: structure, function, and classification. Drug Dev Res. 1994;33:295–318. [Google Scholar]
- 41.Plummer MR, Logothetis DE, Hess P. Elementary properties and pharmacological sensitivities of calcium channels in mammalian peripheral neurons. Neuron. 1989;2:1453–1463. doi: 10.1016/0896-6273(89)90191-8. [DOI] [PubMed] [Google Scholar]
- 42.Randall A, Tsien RW. Pharmacological dissection of multiple types of Ca2+ channel currents in rat cerebellar granule neurons. J Neurosci. 1995;15:2995–3012. doi: 10.1523/JNEUROSCI.15-04-02995.1995. [DOI] [PMC free article] [PubMed] [Google Scholar]
- 43.Regan LJ. Voltage-dependent calcium currents in Purkinje cells from rat cerebellar vermis. J Neurosci. 1991;11:2259–2269. doi: 10.1523/JNEUROSCI.11-07-02259.1991. [DOI] [PMC free article] [PubMed] [Google Scholar]
- 44.Rossi P, D’Angelo E, Magistretti J, Toselli M, Taglietti V. Age-dependent expression of high-voltage-activated calcium currents during cerebellar granule cell development in situ. Pflügers Arch. 1994;429:107–116. doi: 10.1007/BF02584036. [DOI] [PubMed] [Google Scholar]
- 45.Sather WA, Tanabe T, Zhang JF, Mori Y, Adams ME, Tsien RW. Distinctive biophysical and pharmacological properties of class A (BI) calcium channel α1 subunit. Neuron. 1993;11:291–303. doi: 10.1016/0896-6273(93)90185-t. [DOI] [PubMed] [Google Scholar]
- 46.Slesinger PA, Lansman JB. Inactivating and noninactivating dihydropyridine-sensitive Ca2+ channels in mouse cerebellar granule cells. J Physiol (Lond) 1991;435:101–121. doi: 10.1113/jphysiol.1991.sp018668. [DOI] [PMC free article] [PubMed] [Google Scholar]
- 47.Soong TW, Stea A, Hodson CD, Dubel SF, Vincent SR, Snutch TP. Structure and functional expression of a member of the low voltage-activated calcium channel family. Science. 1993;260:1133–1136. doi: 10.1126/science.8388125. [DOI] [PubMed] [Google Scholar]
- 48.Stea A, Tomlinson WJ, Wah Soong T, Bourinet E, Dubel SJ, Vincent SR, Snutch TP. Localization and functional properties of a rat brain α1A calcium channel reflect similarities to neuronal Q- and P-type channels. Proc Natl Acad Sci USA. 1994;91:10576–10580. doi: 10.1073/pnas.91.22.10576. [DOI] [PMC free article] [PubMed] [Google Scholar]
- 49.Umemiya M, Berger AJ. Properties and function of low- and high-voltage-activated Ca2+ channels in hypoglossal motoneurons. J Neurosci. 1994;14:5652–5660. doi: 10.1523/JNEUROSCI.14-09-05652.1994. [DOI] [PMC free article] [PubMed] [Google Scholar]
- 50.Usowicz MM, Sugimori M, Cherskey B, Llinas R. P-type calcium channels in the somata and dendrites of adult cerebellar Purkinje cells. Neuron. 1992;9:1185–1199. doi: 10.1016/0896-6273(92)90076-p. [DOI] [PubMed] [Google Scholar]
- 51.Wakamori M, Niidome T, Furutama D, Furuichi T, Mikoshiba K, Fujita Y, Tanaka I, Katayama K, Yatani A, Schwartz A, Mori Y. Distinctive functional properties of the neuronal BII (class E) calcium channel. Receptors Channels. 1994;2:303–314. [PubMed] [Google Scholar]
- 52.Welling A, Kwan YW, Bosse E, Flockerzi V, Hofmann F, Kass RS. Subunit-dependent modulation of recombinant L-type calcium channels. Molecular basis for dihydropyridine tissue selectivity. Circ Res. 1993;73:974–980. doi: 10.1161/01.res.73.5.974. [DOI] [PubMed] [Google Scholar]
- 53.Westenbroek RE, Sakurai T, Elliott EM, Hell JW, Starr TVB, Snutch TP, Catterall WA. Immunochemical identification and subcellular distribution of the α1A subunits of brain calcium channels. J Neurosci. 1995;15:6403–6418. doi: 10.1523/JNEUROSCI.15-10-06403.1995. [DOI] [PMC free article] [PubMed] [Google Scholar]
- 54.Williams ME, Feldman DH, McCue AF, Brenner R, Velicelebi G, Ellis SB, Harpold MM. Structure and functional expression of α1, α2, and β subunits of a novel human neuronal calcium channel subtype. Neuron. 1992a;8:71–84. doi: 10.1016/0896-6273(92)90109-q. [DOI] [PubMed] [Google Scholar]
- 55.Williams ME, Brust PF, Feldman DH, Patthi S, Simerson S, Maroufi A, McCue AF, Velicelebi G, Ellis SB, Harpold MM. Structure and functional expression of an ω-conotoxin-sensitive human N-type calcium channel. Science. 1992b;257:389–395. doi: 10.1126/science.1321501. [DOI] [PubMed] [Google Scholar]
- 56.Yatani A, Bahinski A, Wakamori M, Tang S, Mori Y, Kobayashi T, Schwartz A. Alteration of channel characteristics by exchange of pore-forming regions between two structurally related Ca2+ channels. Mol Cell Biochem. 1994;140:93–102. doi: 10.1007/BF00926748. [DOI] [PubMed] [Google Scholar]
- 57.Zhang JF, Randall AD, Ellinor PT, Horne WA, Sather WA, Tanabe T, Schwarz TL, Tsien RW. Distinctive pharmacology and kinetics of cloned neuronal Ca2+ channels and their possible counterparts in mammalian CNS neurons. Neuropharmacology. 1993;32:1075–1088. doi: 10.1016/0028-3908(93)90003-l. [DOI] [PubMed] [Google Scholar]