

Abstract
There is increasing evidence that the neurotrophins, particularly nerve growth factor (NGF) and neurotrophin-3 (NT-3), play a role in the regulation of glial development in the CNS. Recent studies have shown that the proliferation of optic nerve-derived O2A progenitors (OLPs) is potentiated by NT-3 in combination with platelet-derived growth factor, whereas NT-3 alone supports the survival of their differentiated progeny (Barres et al., 1994). In this study, we have examined the expression of the high-affinity neurotrophin receptors (trks) and the low-affinity nerve growth factor receptor p75 in developing oligodendrocytes (OLs). In addition, we have examined the effects of NGF and NT-3 on proliferation and survival of OLPs and OLs, respectively. TrkC, the high-affinity NT-3 receptor, and trkA, the high-affinity NGF receptor, are both expressed from the early OLP through the mature OL stage. The truncated form of trkB, lacking the tyrosine kinase domain, and the low-affinity neurotrophin receptor p75 are expressed at low levels in OLPs and are upregulated in mature OLs. NGF and NT-3 both induced the phosphorylation of mitogen-activated protein kinase (MAPK) in OLPs and in OLs. In both OLPs and OLs, NT-3 sustained the activation of MAPK more than NGF. NT-3 enhanced the proliferation of OLPs and supported the survival of OLs. By contrast, unless coadministered with FGF-2, NGF did not exhibit mitogenic effects on OLPs but did enhance the survival of differentiated OLs. Our data demonstrate the presence of functional trkA and trkC in developing OLs and indicate that both NGF and NT-3 have a broad spectrum of developmental actions on cells of the OL lineage.
Keywords: neurotrophins, trks, p75, MAP kinase, oligodendrocytes, proliferation, survival
Neurotrophins are a family of structurally related homodimeric proteins that regulate neuronal and glial development and function in the mammalian central and peripheral nervous systems (Barde, 1994; Davis, 1994; Snider, 1994). TrkA, trkB, and trkC are high-affinity receptor tyrosine kinases that interact with the neurotrophins, nerve growth factor (NGF), brain-derived neurotrophic factor (BDNF), and neurotrophin 4/5 (NT-4/5) or NT-3, respectively (for review, see Barbacid, 1994). In addition, there are multiple truncated receptor isoforms of both trkB and trkC that lack the cytoplasmic tyrosine kinase domain and, further, the trkC gene can also code for multiple kinase isoforms (Barbacid, 1994; Tsoulfas et al., 1994; Valenzuela et al., 1994). Individual trks are necessary and sufficient to transduce functional responses to their cognate ligands (Kaplan and Stephens, 1994; Klein et al., 1994). The low-affinity nerve growth factor receptor p75, which binds all neurotrophins, is a member of the tumor necrosis factor α (TNFα) receptor superfamily. p75 increases the ligand specificity of trkA, modulates trkA signal transduction (Chao et al., 1994; Huber and Chao, 1995), and interacts with the mitogen-activated protein kinase (MAPK) signaling cascade (Volente et al., 1993).
In addition to neurons, glial cells of the CNS, including astrocytes (Hutton and Perez-Polo, 1992, 1995; Rudge et al., 1994), oligodendrocytes, (Barres et al., 1994; Wetmore and Olson, 1995), and microglia (Gilad and Gilad, 1995), also express receptors for and respond to the neurotrophins.
In the absence of specific epigenetic signals, oligodendrocyte progenitors (OLPs) exit the cell cycle, differentiate, and may undergo programmed cell death (Barres et al., 1992, 1993). Growth factors, or “oligotrophins,” potentiate the proliferation of OLPs and promote the survival of newly generated postmitotic oligodendrocytes (OLs). Specific combinations of these growth factors potentiate their individual proliferative effects (Pfeiffer et al., 1993; Barres and Raff, 1994). For example, optic nerve-derived OLPs proliferate in the presence of PDGF-AA, NT-3, and insulin-like growth factor; a similar profile of proliferation of OLPs is thought to occur in vivo(for review, see Barres and Raff, 1994).
The findings that transection of the developing optic nerve reduces the number of OLs and their precursors and that astrocyte-conditioned medium supports OL survival suggest that both active nerve fibers and astrocytes secrete oligotrophins (Barres et al., 1992; Barres and Raff, 1993; Gard et al., 1995). Further, delivery of neutralizing NT-3 antibodies to the developing optic nerve for 1 week significantly reduces the number of OLs present, demonstrating a crucial role for NT-3 in progenitor cell development in vivo(Barres and Raff, 1994; Barres et al., 1994). Although neurotrophins play an important role in the regulation of OL development, the expression of their receptors and the stages at which they exert their trophic action have not been fully defined. In this study, we used immunocytochemical and molecular analyses to demonstrate that developing OLs express trkA and trkC and that NGF and NT-3 each activate MAPK. In addition, we demonstrate that while NT-3 induces the proliferation of OLPs, both NGF and NT-3 support the survival of mature OLs.
MATERIALS AND METHODS
Primary culture preparation. Primary cultures of rat brain oligodendrocytes were generated from postnatal day 2 rat brains as described by Almazan et al. (1993) using a modification of the original technique of McCarthy and de Vellis (1980). For immunostaining procedures and bromodeoxyuridine (BrdU) incorporation assays, oligodendrocyte precursors were plated by drop (70 μl) onto poly-d-lysine-coated glass coverslips (Assistent) in 6-well culture dishes or spin-seeded on 8-well glass or Permanox poly-d-lysine-coated chamber slides (Nunc) at a density of 3000 cells/coverslip or well, respectively. For Western blot analysis, cells were plated on 6 or 10 cm Primaria (Falcon) dishes at a density of 4.5 × 10⁵ or 1 × 10⁶ cells/dish, respectively. For detection of activated MAP kinase, cells were plated on poly-d-lysine-coated 6-well dishes (Falcon) at a density of 2.5 × 10⁵ cells/dish. After the isolation procedure outlined in Almazan et al. (1993), the cultures were grown in serum-free medium (SFM) (DMEM/F12, 1:1) containing 25 μg/ml transferrin, 30 nm tri-iodothyronine, 20 nmhydrocortisone, 20 nm progesterone, 10 nmbiotin, trace elements, 30 nm selenium, 5 μg/ml insulin, 1 μg/ml putrescine, 0.1% BSA, 100 U/ml penicillin, 100 μg/ml streptomycin, and 100 μg/ml amphotericin B (Life Technologies) and 2.5 ng/ml each of FGF-2 and PDGF-AA (UBI) for 4 d to promote their growth and to prevent cellular differentiation (Bögler et al., 1990). After this 4 d expansion period, the cultures were coined day 0 (d0) cultures, after which the cells were cultured in SFM without PDGF-AA and FGF-2. The cultures were named d1 to d13 with respect to the amount of days cultured in SFM medium or under differentiating conditions. Using this culture paradigm, the cells differentiated to postmitotic oligodendrocytes by 5 d (see Survival Assay in Materials and Methods for explanation). Purified microglial cultures were obtained from the preplating protocol after the shaking step in the procedure for isolation of oligodendrocyte progenitors (seeMcCarthy and de Vellis, 1980). These cultures were plated (2 × 10⁶ cells/dish) onto bacterial quality uncoated polystyrene culture dishes (Fisher) and grown in DMEM/F12 (1:1) containing 10% fetal bovine serum (Life Technologies) and 20 mm HEPES, pH 7.4 (complete media). The cells were harvested in Tri-Reagent (Molecular Research Center) after 4 d in culture. Astrocyte cultures were obtained after the oligodendrocyte isolation procedure. Briefly, the monolayers were trypsinized and replated in complete media at low density (40,000 cells per 60 mm dish). The cells were cultured for several days and harvested in Tri-Reagent when the cells had expanded to cover 80–90% of the entire dish. By phase-contrast microscopy, the majority of these cells resembled type-1 astrocytes. Both microglia and astrocytes were used as control samples. These cellular lineage species may be found in highly purified cultures of developing oligodendrocytes (<5% determined by GFAP/ED1 immunostaining).
RT-PCR analysis. RNA isolated from developing OLs (d0–d12), microglia (Mg), astrocytes (As), PC12 cells (PC12), and postnatal d2 rat brain was processed for RT-PCR to examine the detailed expression of trk family transcripts. Isolated RNA was treated with DNase to digest any contaminating genomic DNA and reverse-transcribed at 42°C for 45 min using random hexamers according to the manufacturer’s instructions (Life Technologies, SuperScript). The resulting cDNA was quantitated and amplified (30 cycles) by standard PCR techniques using the following parameters: denaturation, annealing, and polymerization cycles for 1 min at 94, 55, and 72°C, respectively. PCR products were resolved on 1% agarose gel and were identified based on size and sequence. Omission of reverse transcriptase resulted in loss of signals in all cases, indicating that genomic DNA had not been amplified. The oligonucleotide primers listed in Table 1 were used to amplify the indicated trk receptor transcripts.
Table 1.
Oligonucleotide primers
| Trk receptor | Primer sequence 5′-3′ | Base pairs |
|---|---|---|
| trkAI (upstream) | CGTGGAACAGCATCACTG | (946 –963) |
| TrkAI (downstream) | CTTGATGTGCTGTTAGTGTC | (1285 –1304) |
| trkAII (upstream) | CGTGGAACAGCATCACTG | (946 –963) |
| trkAII (downstream) | TCCACTGGCGAGAAGGAGA | (1265 –1283) |
| trkBTK−(upstream) | GCTGGGGCTGTGGTGCTTGTTGCCTG | (1454 –1479) |
| trkBTK−(downstream) | CTTCGATTCTATATTTGAACTATTGTA | (1511 –1685) |
| trkBTK+(upstream) | TGAAGGACGCCAGCGACAATGCACGCAAGG | (2229 –2258) |
| trkBTK+(downstream) | GGTGAATTTCCTATACATGATGCTCTCTC | (2673 –2701) |
| trkCTK+(upstream) | TCTATGGGGTCTGTGGTGATGGGG | (1808 –1832) |
| trkCTK+(downstream) | TCTCCCAAAGAATAACCCCAAAGC | (2362 –2386) |
| p75 (upstream) | GAGGGCACATACTCAGACGAAGCC | (567 –590) |
| p75 (downstream) | GTCTATATGTTCAGGCTGGTAACC | (1206 –1229) |
Immunofluorescence staining. For detection of lipid surface antigens, live cells were incubated with mouse IgM monoclonal antibodies A2B5 (Eisenbarth et al., 1979), O4 (Sommer and Schachner, 1981), or O1 (Sommer and Schachner, 1981) as diluted serum-free hybridoma culture supernatants (1:3) for 20 min at 37°C. The A2B5, O4, and O1 antibodies were used on cell populations with increasing degrees of cellular differentiation as determined by days in vitro without FGF-2 and PDGF-AA (A2B5, 0 d; O4, 4 d; O1, 7–12 d). After rinsing (2 times, 10 min each) with warm HBSS containing Ca2+ and Mg2+, the cells were fixed with 4% paraformaldehyde in PBS, pH 7.4, for 20 min at room temperature (RT). The cells were then washed three times with PBS containing 10 mml-glycine and blocked for 30 min in PBS containing 5% calf serum and 5% lamb serum (blocking solution). The cells were washed twice in PBS and then incubated for 90 min with rabbit polyclonal antibodies against neurotrophin receptors, diluted in blocking solution as follows: anti-TrkA-R, 1:200; anti-TrkA-out, 1:200; anti-TrkB-out, 1:200; anti-TrkC-out, 1:200; anti-p75, 1:250 (see Table 2 for specificities and references). Similar procedures were carried out with preimmune serum (all 1:200) from rabbits used to generate the anti-TrkA-out, anti-TrkB-out, and anti-TrkC-out antibodies. The cells were rinsed three times with PBS followed by the simultaneous application of two secondary antibodies in blocking solution: goat anti-rabbit TRITC (1:150; Cappel) and goat anti-mouse IgM(μ)-chain-specific FITC (1:250; Cappel). To verify the nonspecific interactions of the secondary antibodies, the immunocytochemistry protocols were performed without primary antibodies. These controls were repeated with all preimmune serum preparations. The cells were washed once in PBS containing Hoechst 33342 for 10 min to identify the number of nuclei per microscopic field. The coverslips were mounted with AquaMount (Polysciences), examined under an Olympus BX50F epifluorescent microscope (400× magnification), and photographed using Kodak Ektachrome Elite 400 ASA film.
Table 2.
Antisera
| Name of antisera | Specificity | Reference or source |
|---|---|---|
| Anti-trkA-R | Extracellular domain of trkA | Clary et al., 1994 |
| Anti-trkA-out | Peptide antisera, extracellular domain of trkA | Ehlers et al., 1995 |
| Anti-trkB-out | Peptide antisera, extracellular domain of rat trkB | Kaplan et al., 1993 |
| Anti-trkC-out | Peptide antisera, extracellular domain of rat trkC | Dr. D. Kaplan, Montreal Neurological Institute, McGill University |
| Anti-p75 | Cytoplasmic domain of p75 | Huber and Chao, 1995 |
Western blotting. Protein and RNA fractions from highly enriched cultures of developing oligodendrocytes, astrocytes, and microglia were isolated using Tri-Reagent (Chomczynski, 1993). The concentration of protein in the samples was determined by the BCA method (Pierce), using BSA as a standard. The RNA fraction was utilized for the corresponding PCR analysis. The proteins (5 or 10 μg of protein/lane) were resolved for 90 min at RT by SDS-PAGE analysis on either 7.5% or 10% acrylamide gels and electroblotted at 4°C for 90 min to ECL-Nitrocellulose (Amersham). The membranes were placed in heat-sealed plastic bags and blocked for 1 hr at 37°C with 10% (w/v) dry skim milk (Carnation) in TBS (pH 7.6) + 0.05% Tween-20 (Blotto) with 5% filtered normal goat serum (NGS; Vector Laboratories). The blots were quickly rinsed twice with TBS (pH 7.6) + 0.05% Tween-20 (TTBS) once for 15 min and twice more for 5 min. The primary antibodies [rabbit anti-TrkA-out, 1:1000; rabbit anti-TrkA-R, 1:2000; rabbit anti-TrkB-out 1:8000; rabbit anti-TrkC-out, 1:2000; rabbit anti-p75, 1:1000; mouse anti-CNPase, 1:400 (IgG1, Sigma); mouse anti-myelin basic protein (MBP), 1:1000 (SMI99, IgG2B, Sternberger Monoclonals)] were diluted in Blotto + 1% NGS and then added to the nitrocellulose membranes packaged into heat-sealed plastic bags. The blots were incubated overnight at 4°C on an orbital shaker and washed. The secondary antibodies (goat anti-rabbit or anti-mouse), coupled to horseradish peroxidase (Bio-Rad), were diluted 1:5000 in Blotto + 1% NGS and incubated with the membranes for 1–2 hr at RT. The blots were washed once for 15 min and four times for 5 min in TTBS before 1 min incubation in an enhanced luminol solution (SuperSignal, Pierce). The blots were dried, packaged in a sheet protector, exposed to Fuji X-ray film for 1–30 min, and developed in a Kodak automatic developer.
Detection of phosphorylated MAP kinase. Oligodendrocyte progenitor (d0) or differentiated OL (d7) cultures were incubated with 50 ng/ml NT-3 or NGF for 5–180 min or varying doses of each growth factor (0.5–50 ng/ml) for 30 min. The cells were harvested with 150 μl of ice-cold TBS, pH 7.6, containing 10% glycerol, 0.1% Nonidet P-40, 0.1% Triton X-100, 0.1% SDS, 1 mm PMSF, 5 μg/ml leupeptin, and 0.3 mm sodium orthovanadate (lysis buffer). The lysates were quickly frozen on dry ice and later resolved on 7.5% acrylamide gels as described above. The gels were blotted onto 0.22 μm supported nitrocellulose membranes (Micron Separations) and stained as described above, with an activation state-specific antibody for MAP kinase (rabbit anti-phospho-MAP kinase, New England BioLabs) at a dilution of 1:1000. The blots were stripped in Tris buffer (62.5 mm, pH 6.8) containing 2% SDS and 0.7% β-mercaptoethanol (stripping buffer) and reprobed with anti-MAP kinase (UBI, 1:4000) overnight at 4°C as described above. The resulting autoradiograms were scanned, and the relative density of each band was calculated using a National Institutes of Health Image software program. To standardize the activation or phosphorylation state of MAP kinase relative to the amount of MAP kinase present in each sample, the optical density of the phospho-MAP kinase was normalized to the relative density of total MAP kinase present (both phosphorylated and nonphosphorylated forms). Similar responses were obtained on three separate trials. The data are expressed as a percent of control ± SEM.
Proliferation assay. To reduce basal proliferation rates, oligodendrocyte progenitor cells (d0) were deprived of exogenously added growth factors (PDGF-AA/FGF-2) for 24 hr. We used the MTT technique (see Survival Assay method below) to show that in the presence of bFGF and PDGF there is almost no cell death (2–4% of total cells). Further, growth factor withdrawal and application of SFM for 2 d resulted in an insignificant increase in the proportion of cell death (5–7% of total cells). Twenty-four hours after factor withdrawal (d1), NGF (0.1–100 ng/ml) or NT-3 (0.1–100 ng/ml) was added alone or in combination with PDGF-AA (2.5 ng/ml) or FGF-2 (2.5 ng/ml) for 24 hr. To label cells in S-phase, BrdU (10 μm) was added to the cultures for the last 12 hr of propagation. The next day (d2), the cells were processed for O4 or for A2B5 immunocytochemistry as described (see Immunofluorescence Staining). Although the A2B5 antibody recognizes O2A progenitor cells, the O4 monoclonal antibody labels both progenitor cells (Bansal et al., 1992) and committed oligodendrocyte precursors, therefore labeling a larger population than A2B5 antibody alone. After washing and neutralizing the paraformaldehyde, the cells were processed further for BrdU staining according to the manufacturer’s instructions (Boehringer Mannheim). The cells were washed and incubated with IgG-subtype-specific secondary antibodies to O4, A2B5, and BrdU (mouse anti-IgM-FITC, 1:250, Cappel; mouse anti-IgG1-TRITC, 1:200, Cappel) in blocking solution for 45 min. The cells were then washed once and incubated with Hoechst 33342 dye for 10 min to label the cell nuclei. The cells were washed three more times in PBS (10 min each), mounted, and analyzed as above. Greater than 90% of cells analyzed were either A2B5+ or O4+. Each treatment was carried out in quadruplicate, and two fields (10 × 100 μm) per treatment were quantitated and expressed as the percentage of either (BrdU+/O4+)/total O4+ or (BrdU+/A2B5+)/total A2B5+ cells. Similar response histograms were obtained in three separate experiments.
Survival assay. The MTT survival assay was carried out as described previously by Barres et al. (1993) according to the original procedure of Manthorpe et al. (1986). The cells were plated onto 24-well dishes in SFM with FGF-2 and PDGF-AA. The medium was withdrawn after 4 d, and the cells were allowed to differentiate in SFM alone for 5 d. At this time, we determined that the cell population was postmitotic, as confirmed by the lack of basal or stimulated (with up to 100 ng/ml NT-3 or NGF) BrdU incorporation. Therefore, the cellular effects of the growth factors (NT-3 and NGF) would represent trophic actions on survival and not proliferation. At d5, the SFM was removed and the cells were cultured in DMEM/F12, 0.1% BSA (basal medium) containing the indicated concentrations of growth factors. Basal medium was refreshed after 2 d, and an additional aliquot of NGF or NT-3 was added on day 4. The following day, 3-(4,5-dimethylthiazol-2-yl)-2,5-diphenyl tetrazolium bromide (MTT; Sigma) was added to the cultures (final concentration of 0.15 mg/ml) and allowed to react for 4 hr at 37°C. Viable cells converted the MTT to a blue formazan precipitate. The percentage of viable cells per field (4 wells, 8 random fields, 3 independent experiments, 400× magnification) was counted using a bright-field phase microscope (Olympus). Replicate wells were stained with anti-O1, and immunoreactive cells were detected using the ABC method (Vector); and the total number of O1+ and total cells per well were counted as above.
Data analysis. Data collected from MAPK phosphorylation, BrdU incorporation, and survival experiments presented in Figures 5, 6, 7, respectively, were all carried out at least in triplicate (see individual sections in Materials and Methods) and analyzed for significance by Student’s t test.
Fig. 5.

The effect of neurotrophins on the phosphorylation of MAP kinase. Oligodendrocyte progenitors (A,C) or oligodendrocytes (B,D) plated in 6-well dishes were stimulated with either 50 ng/ml NT-3 (white bars) or NGF (hatched bars) for 5–60 min, or with 0.5–50 ng/ml NT-3 or NGF for 45 min. The cells were harvested, and the lysates were resolved on 7.5% acrylamide gels. The gels were transferred to supported nitrocellulose and probed with anti-phospho-MAP kinase (P-MAPK). The blots were stripped and reprobed with anti-MAP kinase (MAPK). The optical density was determined using an optical scanner and a National Institutes of Health Image program and expressed as percent control of phospho-MAPK/MAPK ± SEM (A, n = 4; B–D, n = 3). The treated values were compared by t test to unstimulated cultures; *p < 0.05, **p < 0.01, ***p < 0.005, ****p < 0.001, *****p < 0.0001.
Fig. 6.
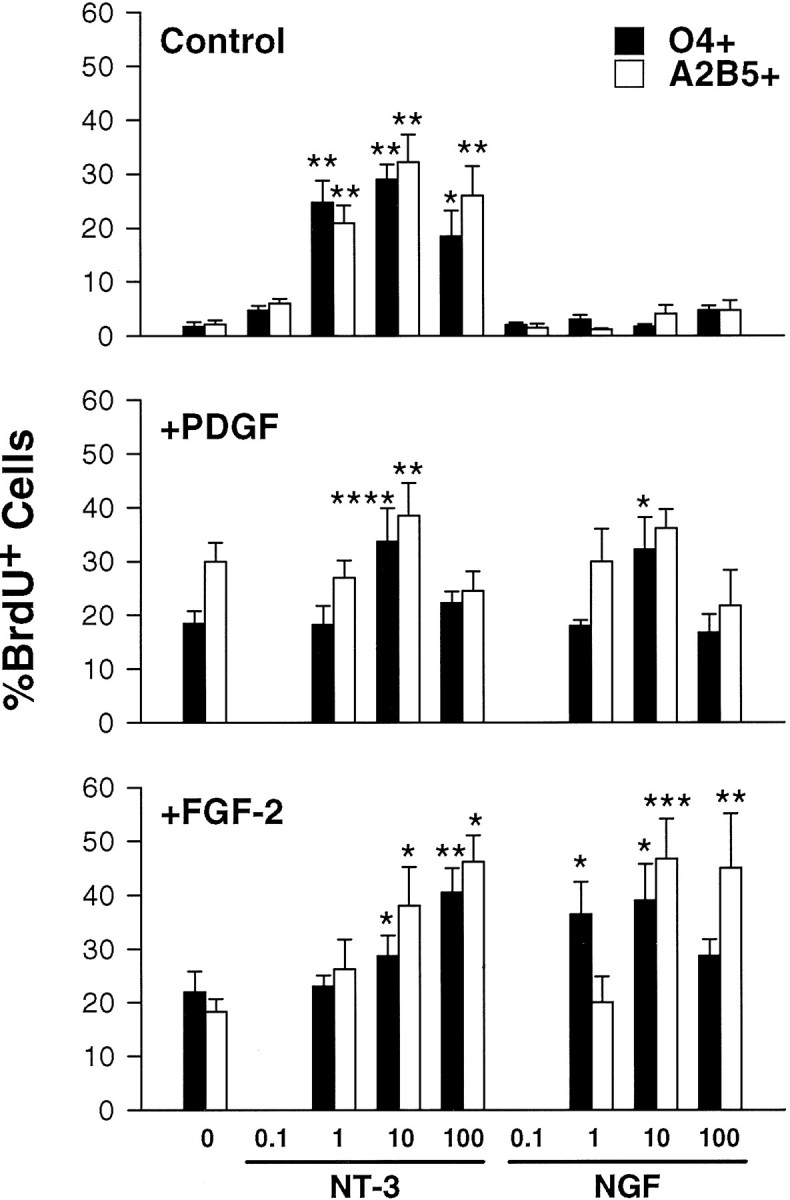
The effect of NT-3 and NGF on the proliferation of oligodendrocyte progenitors. Oligodendrocyte progenitors were cultured in SFM without or with NT-3 or NGF (0.1–100 ng/ml) alone (Control, top panel) or in combination with 2.5 ng/ml PDGF-AA (+PDGF, middle panel) or FGF-2 (+FGF-2, bottom panel) for 24 hr. During the last 12 hr, 10 μm BrdU was added to the culture medium. Live cells were stained with either the monoclonal antibody A2B5 (white bars) or O4 (black bars) and fixed and processed for BrdU staining. The cell nuclei were counterstained with Hoechst 33342 for quantitative analysis. The total number of either BrdU+/O4+ and total O4+ or BrdU+/A2B5+ and total A2B5+ cells was counted from three independent experiments (two 10 × 100 μm fields from four separate wells). The data are expressed as a percentage of either BrdU+/O4+ or BrdU+/A2B5+ of total O4+ or A2B5+ cells ± SEM. The results with either neurotrophin were compared by t test to the control, PDGF-AA, or FGF-2 treatment alone (left bars in the three panels; *p < 0.05, **p < 0.01, ***p < 0.005, ****p < 0.001). Note that FGF or PDGF alone each increased proliferation without the addition of the neurotrophins (left bars of graph). The neurotrophin concentrations are indicatedbelow the y-axis of the figure.
Fig. 7.

The effects of NT-3 and NGF on the survival of differentiated oligodendrocytes. Oligodendrocyte progenitors were grown as described in Materials and Methods and allowed to differentiate for 5 d. The cultures were then removed from SFM and placed in basal medium (A, B, black bars) containing 0.1–100 ng/ml NT-3 (hatched bars) or NGF (white bars) and on day 5 were processed for the MTT assay and for immunocytochemical analysis with the O1 antibody as detailed in Materials and Methods. The percentage of viable cells was counted using a bright-field phase microscope (Olympus). Replicate wells were used to determine the number of O1-immunoreactive cells that remained (two 10 × 100 μm fields, four separate wells, three independent experiments for each treatment). The results are expressed as mean ± SEM of MTT+ cells (A) and O1+ cells (B) per treatment. Each value was compared by t test to the control treatment alone (*p < 0.05, **p < 0.005).
RESULTS
Multiple neurotrophin receptor transcripts are expressed in developing oligodendrocytes in vitro
To characterize the range of neurotrophin receptor family members expressed by developing oligodendrocytes, we carried out RT-PCR using specific primers for trkAI, trkAII, trkBTK−, trkBTK+, trkCTK+, and p75 (Fig.1A–F, respectively). The trkAI isoform, the form of trkA originally cloned, differs from trkAII by virtue of a 6 amino acid (18 bp) insert in the extracellular domain of the latter. This insert does not affect NGF receptor binding specificity, but it does confer binding to NT-3 (Barker et al., 1993;Clary and Reichardt, 1994a). The 18 bp insert was used as a primer to identify the presence of trkAII (see Table 1). Using specific primers for trkAI and trkAII, both progenitors (d0) and differentiated OLs (d4 onward) expressed transcripts for the “glial” trkAI (Fig.1A) (Barker et al., 1993; Clary and Reichardt, 1994), whereas only differentiated OLs (d4 onward) expressed transcripts for the “neuronal” or NT-3 binding form of the trkAII (Fig.1B) (Barker et al., 1993; Clary and Reichardt, 1994). Transcripts for trkBgp145, the functional high-affinity BDNF receptor, were not expressed in developing OLs (Fig.1D); however, the truncated BDNF receptor trkBgp95 was present at all developmental stages (Fig.1C). The tyrosine kinase domain of trkC (trkCTK+) was present from days 0 through 12 (Fig.1E), consistent with the findings of Barres et al. (1994). The transcript for the low-affinity nerve growth factor receptor p75 was detectable in d0–d12 cultures (Fig.1F).
Fig. 1.
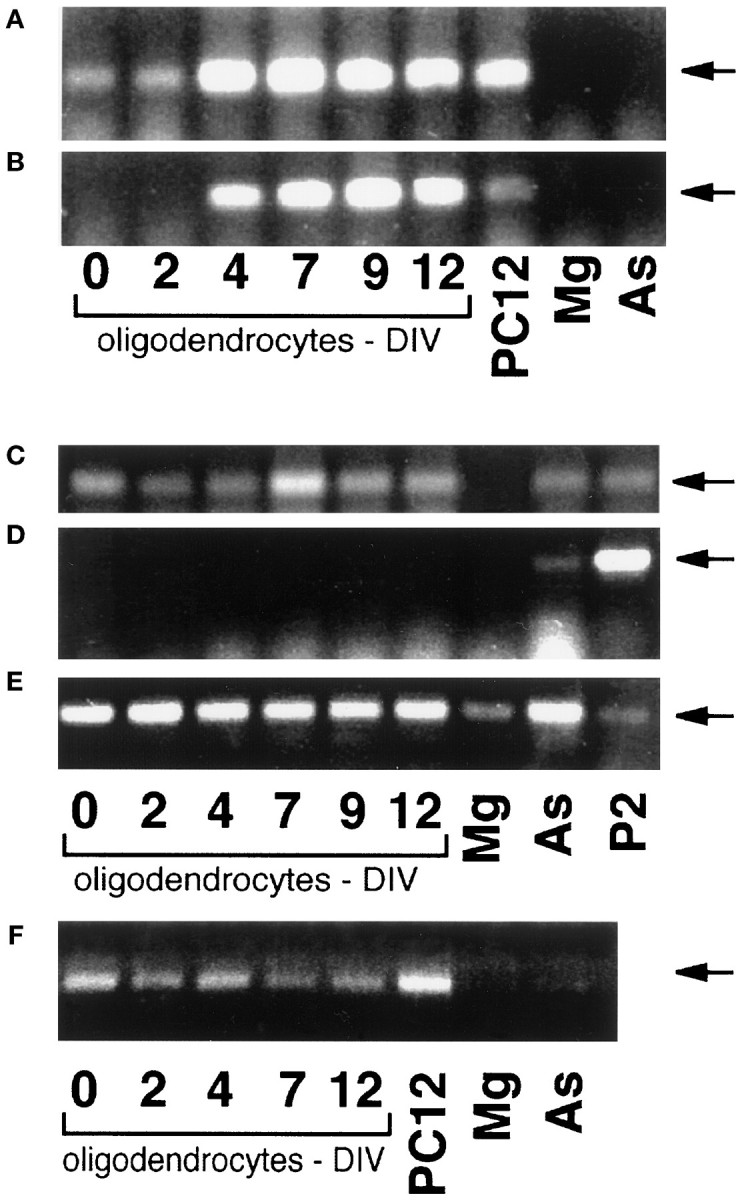
Detection of trk family mRNA in developing oligodendrocytes by RT-PCR. RNA from developing oligodendrocytes (0–12 d in vitro), microglia (Mg), astrocytes (As), PC12 cells (PC12), or postnatal day 2 (P2) rat brain was amplified by RT-PCR using oligonucleotide primers to (A) trkAI, (B) trkAII, (C) trkBTK−, (D) trkBTK+, (E) trkCTK+, and (F) p75 (see Table 1). The amplified cDNA was resolved on 1.2% agarose gels containing ethidium bromide and photographed. The lower bands inD are oligonucleotide primers and were included in the figure to facilitate visualization of the lanes.
High- and low-affinity neurotrophin receptor proteins are expressed within cultures of developing oligodendrocytes
Immunocytochemical analysis with neurotrophin receptor-specific antisera was performed to characterize the distribution of neurotrophin receptor subtypes in developing OLs in vitro. After propagation and expansion of the OLPs for 4 d in PDGF-AA and FGF-2, the majority of the cells appeared bipolar with very small (10–15 μm) phase-bright cell bodies (not shown). At this stage, 92 ± 4% of the cells were A2B5+ and no O1+ cells were detected. The entire cell body and bipolar process extension reacted strongly with the A2B5 antibody (Fig.2A,C,E,G,I). There were also some cells with shorter, more numerous processes. Most of the A2B5+ cells reacted with the anti-TrkA-out antisera (Fig. 2B). The staining was restricted to the cell bodies. The TrkA-R antisera produced a similar staining pattern to that of Trk-A-out (Fig. 2D), with the exception of staining of the bipolar processes. A majority of the A2B5+cells were reactive with the Trk-B-out antisera (Fig.2F). The Trk-C-out antisera reacted with A2B5+ OLPs, with preferential staining of the perikarya (Fig. 2H). At this developmental stage, a majority of the cells were A2B5+/p75− (Fig.2J). After 4–5 d in culture (d4–d5), a majority of cells were O4+ (87 ± 8%). At this stage, the O1 antisera stained 30 ± 7% of the cultured cells. After 8 d, a majority of the cells were O1+ (93 ± 4%) and extended multiple processes, some of which had flattened myelin-like membranes that stained brightly with the O1 antisera (Fig.3A,C,E,G,I).
Fig. 2.
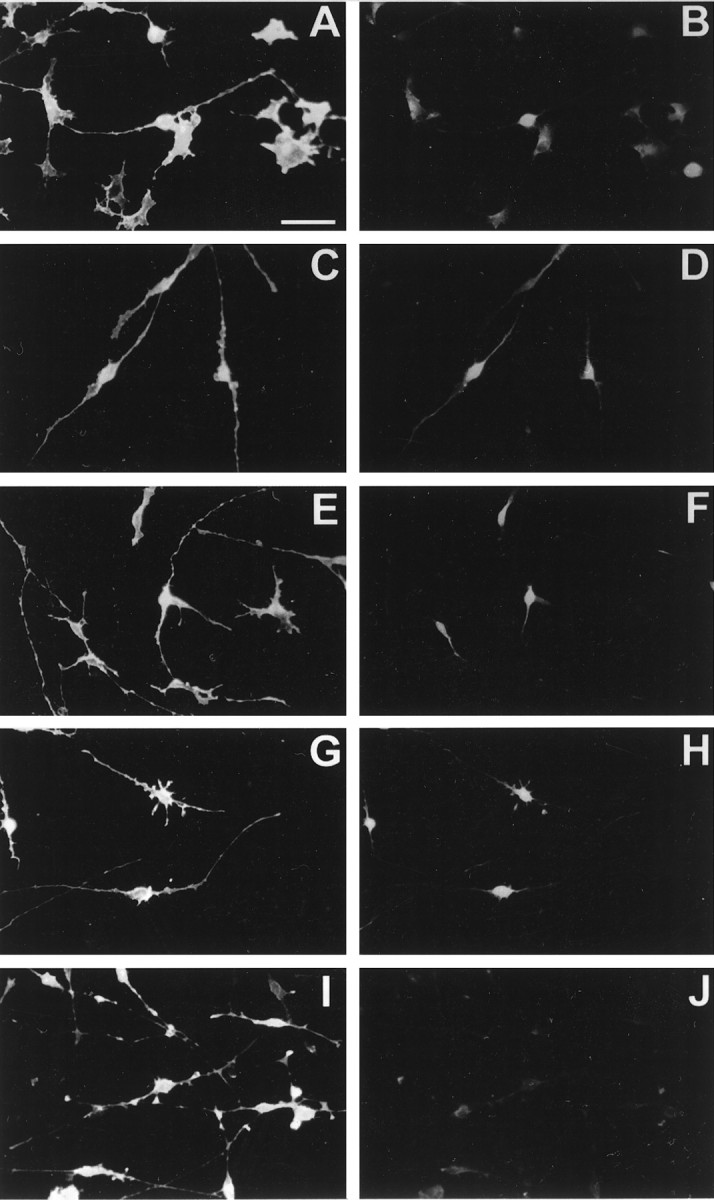
Double immunostaining of oligodendrocyte progenitors with stage-specific and neurotrophin receptor family-specific antibodies. Oligodendrocyte progenitors (d0) were processed for live, A2B5 staining, fixed with 4% paraformaldehyde, and processed for dual-immunofluorescence microscopy with the following primary antibodies: Trk-A-out (1:200); Trk-A-R (1:200); Trk-B-out (1:200); Trk-C-out (1:200); and p75 (1:250). All of the left panels represent A2B5-immunoreactive OLPs, and the adjacentright fields represent the respective: (B) Trk-A-out; (D) Trk-A-R; (F) Trk-B-out; (H) Trk-C-out; and (J) p75.
Fig. 3.
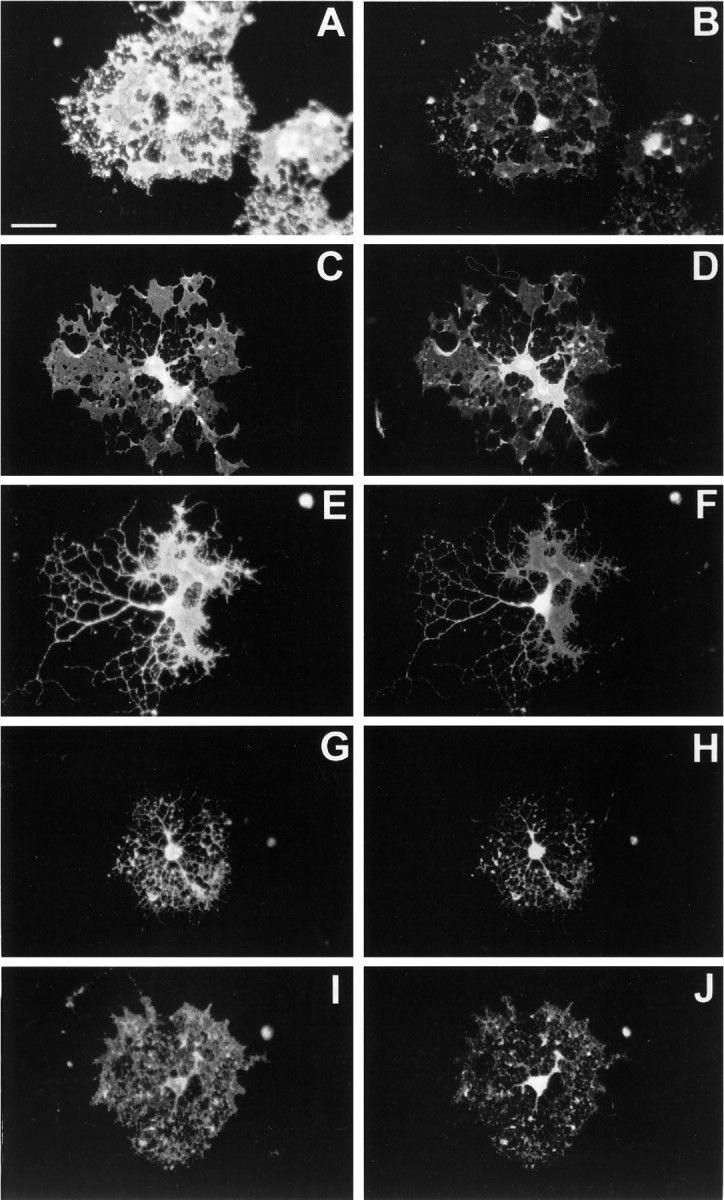
Double immunostaining of differentiated oligodendrocytes with stage-specific and neurotrophin receptor family-specific antibodies. Oligodendrocytes (day 8) were processed for live O1 immunocytochemistry. The remaining parts of the procedure were identical to Figure 2. All of the left panels represent O1-immunoreactive OLs, and the adjacent right fieldsrepresent the respective: (B) Trk-A-out; (D) Trk-A-R; (F) Trk-B-out; (H) Trk-C-out; and (J) p75.
In differentiated cells, the Trk-A-out antisera exhibited a staining pattern similar to that seen in progenitor cells, with staining restricted to the cell bodies (Fig. 3B). However the Trk-A-R antisera also reacted with the major process extensions and, in some cases, with the flattened membranous sheaths (Fig. 3D). All O1+ cells were also Trk-B-out+ (Fig.3F). Trk-C-out staining in O1+ cells was similar to the pattern observed in progenitor cells, but there was also specific punctate staining on many of the processes (Fig.3H). In differentiated cultures, all of the O1+ cells reacted to the p75 antisera (Fig.3J), with prominent staining on the cell bodies and extension into some of the major and minor processes. The absence of nonspecific immunoreactivity was verified by following the immunocytochemistry protocol with the absence of primary antibodies and/or with replacement of the primary antibody with preimmune serum for the following antibodies: anti-TrkA-out, TrkB-out, TrkC-out (gifts from Dr. D. Kaplan).
Developmental regulation of multiple isoforms of full-length and truncated neurotrophin receptors
To determine the pattern and to quantify the level of neurotrophin receptor expression in developing OLs, oligodendrocyte cultures (d0, d2, d4, d7, d9, d11, and d13) were analyzed by SDS-PAGE (Fig.4). The Trk-A-R (Fig. 4A) antisera recognized a major band migrating at ∼180 kDa, and the TrkA-out antisera (Fig. 4B) identified two bands around 150 and 135 kDa. To determine whether these two antibodies recognize different proteins, the TrkA-out blot was stripped and reprobed with TrkA-R antisera. When the blots were overlaid, the upper band of the TrkA-out blot did not coincide with the major band recognized by the TrkA-R antisera. Furthermore, if the original TrkA-R blot was exposed for 30 min, the lower 150 and 135 kDa bands were visible, albeit weakly. As oligodendrocyte progenitors differentiated, the amount of TrkA immunoreactivity decreased slightly, and similar staining patterns were seen with both TrkA antibodies. Microglia and astrocytes in culture expressed relatively small amounts of the receptor proteins compared to developing oligodendrocytes. The TrkB-out antisera recognized one band at ∼95 kDa in developing oligodendrocytes and astrocytes, but not in microglia (Fig. 4C). As the progenitor cells matured, the level of TrkB immunoreactivity increased approximately fivefold. The TrkC-out antibody (Fig.4D) recognized two bands (150 and 180 kDa) in developing oligodendrocytes, which correspond to a full-length and possibly a novel high-molecular-weight TrkC receptor isoform. Preimmune serum was used to determine the specificity of the antibody. With the preimmune serum after long exposure, very faint bands were seen at 70–80 and 200 kDa, and the pattern of these bands did not correspond to the immune sera bands (data not shown). The p75 antibody reacted with a band of ∼75 kDa (Fig. 4E). The level of p75 was initially very low, but as the progenitor cells differentiated and expressed CNP (Fig. 4F) and MBP (Fig. 4G), there was an 8- to 10-fold upregulation of p75 expression over the values at d0. Both microglia and astrocytes contained relatively low amounts of p75 compared to developing oligodendrocytes. These patterns of neurotrophin receptor expression are consistent with the RT-PCR and the immunocytochemical data previously presented.
Fig. 4.

The expression of neurotrophin receptors in differentiating oligodendrocytes. Protein (10 μg) from developing oligodendrocytes (days 0–13), microglia, and astrocytes was resolved on 7.5% acrylamide gels. The gels were blotted onto nitrocellulose membranes and probed with (A) Trk-A-R, (B) Trk-A-out, (C) Trk-B-out, (D) Trk-C-out, (E) p75, (F) CNPase, or (G) MBP antibodies.
NT-3 and NGF activate MAP kinase in both progenitors and differentiated oligodendrocytes
Because MAP kinase is a downstream signal transduction intermediate of Trk-induced, ras-dependent pathways in PC12 cells (Kaplan and Stephens, 1994), the kinetics and dose dependence of enzyme activation in response to either NT-3 or NGF were determined in OLPs (d0; Fig. 5A,C) and in mature OLs (d7; Fig. 5B,D). After 5 min, NT-3 (50 ng/ml) stimulated a three- to fivefold increase in the phosphorylation of MAPK in both OLPs and mature OLs (Fig.5A,B, white bars). In contrast, whereas NGF (50 ng/ml) stimulated an increase in MAPK phosphorylation in differentiated cells after 5 min, it took 60 min in progenitors cells to stimulate a significant increase (Fig.5A,B, hatched bars) Furthermore, in progenitor cells (Fig. 5C, white bars), NT-3 (0.5 and 5 ng/ml) stimulated a significant increase in MAPK phosphorylation, whereas much higher amounts of NGF (50 ng/ml) were needed to produce a significant effect. In differentiated cells (Fig. 5D), the effect of NGF (50 ng/ml,hatched bars) on MAPK phosphorylation was similar to that observed in progenitor cells (Fig. 5C, hatched bars). In contrast, the response to NT-3 was altered; 0.5 ng/ml NT-3, which stimulated a robust response in progenitor cells (Fig. 5C, white bars), no longer produced a significant increase in MAPK phosphorylation in mature cells (Fig.5D, white bars).
NT-3 but not NGF stimulates the proliferation of oligodendrocyte progenitors, whereas both neurotrophins enhance the survival of differentiated cells
To determine the effects of the neurotrophins on the proliferation of developing oligodendrocyte progenitors, cultured cells were exposed to varying concentrations of NT-3 or NGF alone or in combination with known OLP mitogens FGF-2 (2.5 ng/ml) or PDGF-AA (2.5 ng/ml) (Fig.6). Application of NT-3 (1–100 ng/ml) caused a significant increase in the number of either O4+/BrdU+ or A2B5+/BrdU+ cells compared to control wells, whereas NGF had no effect on proliferation (Fig. 6, top). Coapplication of either neurotrophin with PDGF was only slightly more effective than addition of PDGF alone in inducing cellular proliferation (Fig. 6, middle). The combination of PDGF with 10 ng/ml NT-3 significantly increased the proliferation of both O4+ and A2B5+ cells compared to PDGF alone. However, the combination of PDGF and 10 ng/ml NGF significantly increased the incorporation of BrdU into O4+ cells. In contrast, coapplication of FGF-2 and NGF was significantly more effective than either factor alone in recruiting developing progenitors (both A2B5+ and O4+ cells) into the S-phase of the cell cycle (Fig. 6, bottom). Coapplication of FGF-2 and NT-3 was also more effective then either factor alone in increasing the number of O4+/BrdU+ and A2B5+/BrdU+ progenitor cells, albeit at a higher dose than NGF (1 vs 10 ng/ml; Fig. 6, bottom).
To determine whether NGF and NT-3 support survival of differentiated OLs, we assessed cellular viability using two related methods, the MTT cell survival assay (Fig. 7A) and quantitation of surviving O1+ cells (Fig. 7B). Progenitor cultures were allowed to differentiate for 5 d, and cellular viability was determined. At this stage, the cells were postmitotic (see Materials and Methods) and ∼95% of the cells were MTT+. The cells were then switched to basal medium containing varying doses of NT-3 or NGF for 5 d and then processed for the MTT assay. Replicate culture wells were treated in the same manner and processed for O1+ immunoreactivity. In the absence of added growth factors, the majority of the cells died within 5 d. NT-3 increased the number of both MTT+ and O1+ OLs in a concentration-dependent manner (Fig.7A,B). NGF (1–10 ng/ml) also significantly increased the relative number of MTT+ and GC-immunoreactive OLs (Fig. 7A,B). Thus, both NT-3 and NGF support the survival of mature OLs. This trophic action of NGF on mature OLs is consistent with the expression of TrkA, the upregulation of p75, and the significant increase in the activation of MAPK signal pathways by NGF in these cells.
DISCUSSION
In this study, we showed that developing rat brain oligodendrocytes express full-length transcripts for trkA, trkC, and their protein products (for summary, see Table 3). By contrast, TrkBgp95 and p75 were expressed at low levels in O-2A progenitors but were upregulated in mature OLs. The phosphorylation of MAP kinase within developing OLs after NGF or NT-3 application supports the existence of functional TrkA and TrkC in these cells. NT-3 application induced proliferation of O-2A progenitor cells, whereas addition of either NT-3 or NGF increased the survival of mature OLs.
Table 3.
Summary of effects of neurotrophins and the expression of their receptors in developing oligodendrocytes
| Growth factor | Progenitor cells | Differentiated cells |
|---|---|---|
| Cellular effect | ||
| NGF | − prolif./+ MAPK | +++ surv./++ MAPK |
| FGF-2 | ++ prolif. | N/D |
| NGF + FGF-2 | ++++ prolif. | N/D |
| NT3 | ++ prolif./++++ MAPK | +++ surv./+++ MAPK |
| Receptor | mRNA (PCR) | |
| TrkAI | + | + |
| TrkAII | − | + |
| TrkB (TK−) | + | + |
| TrkB (TK+) | − | − |
| TrkC (TK−) | N/D | N/D |
| TrkC (TK+) | + | + |
| p75 | + | + |
| Protein | ||
| TrkA/(110/140 kDa) | +++?/+++ (IC/WB) | ++?/+ (IC/WB) |
| TrkA/(180 kDa) | +++?/+++ (IC/WB) | +++?/+++ (IC/WB) |
| TrkB/(95 kDa) | −/+ (IC/WB) | +++/+++ (IC/WB) |
| TrkC/(140/200 kDa) | ++?/++ (IC/WB) | ++?/++ (IC/WB) |
| p75/(80 kDa) | −/− (IC/WB) | +++/+++ (IC/WB) |
The effects of growth factors NGF, NGF+FGF-2, FGF-2, and NT-3 and the expression of their receptors were determined in this study and summarized in the above table. Cellular effects determined were MAPK activation (MAPK), proliferation of progenitor cells (prolif.), and survival of differentiated cells (surv.). The receptors detected by PCR (mRNA) and by immunocytochemistry (IC) or by Western blotting (WB) are summarized in the lower portion of the table. Relative levels of stimulation of the given effect or type of receptor present or absent are indicated by the amount of plus (+) or minus (−) signs in the given column. A question mark (?) is used to indicate that the molecular weight type recognized by immunocytochemical procedures cannot be determined using the available antisera; however, a signal is still present. N/D, Not determined; prolif., proliferation; surv., survival.
Expression of TrkA and p75 and response to NGF by developing OLs
Our observations that developing rat OLs express trkA and are responsive to NGF are consistent with the findings of Althaus and coworkers. They have shown that NGF stimulates calcium transients and supports the survival and process reformation of adult porcine brain oligodendrocytes in culture (Althaus et al., 1992; Engel et al., 1994). Although their studies identified a functional response to NGF, these observations and previous studies (Kumar et al., 1993; Hutton and Perez-Polo, 1995) have not examined the expression of TrkA in cultured OLs or the effects of NGF on the proliferation and survival of rodent brain-derived OLs. Three differentially processed (presumably glycosylated) forms of TrkA (135, 150, and 180 kDa) are expressed in developing OLs. The lower-molecular-weight form (underglycosylated form of TrkA; Ehlers et al., 1995) disappears with time in culture, whereas the 150 and 180 kDa forms persist in mature O1+ OLs. The 180 kDa band represents a post-translational modification of TrkA that has been identified in trigeminal ganglion. This novel isoform is resistant to N-neuramidase treatment, suggesting that it does not contain N-glycosylated residues (Ehlers et al., 1995). It is interesting to note that the TrkA-R antibody, which recognizes the 180 kDa isoform, stains the cell bodies and processes in developing OLs, whereas the TrkA-out antibody, which recognizes the lower-molecular-weight form, stains only the cell bodies. This differential pattern of TrkA distribution raises the possibility that differential post-translational modifications could play a role in targeting TrkA receptors to different intracellular locations.
NGF alone does not induce the proliferation of brain-derived O-2A progenitor cells, but coapplication of NGF and FGF-2 enhances FGF-2-mediated proliferation of O-2A progenitors. By contrast, solitary application of NGF supports the survival of differentiated cells and causes a robust and prolonged increase in the amount of phosphorylated MAPK. Because both OLPs and OLs express trkA, the reasons for these differences are yet to be determined. One possibility is that p75, which is abundant in OLs but not in OLPs, may amplify trkA responses in mature cells, as suggested in other experimental systems (for review, see Green and Kaplan, 1995). For example, sensory and sympathetic neurons isolated from the p75 knockout mouse exhibited two- to threefold decreased sensitivity to NGF at developmental periods that coincide with the peak of naturally occurring cell death; similar observations have been reported for cutaneous sensory neurons (Davies et al., 1993; Lee et al., 1994). These observations and others (Mahadeo et al., 1994) suggest that p75 and TrkA coexpression allows cells to respond to NGF at lower concentrations than cells that express TrkA alone. Further, introduction of p75 into MAH sympathetic neuroblasts generates an eightfold increase in NGF-stimulated Trk autophosphorylation, suggesting that a significant excess of p75 is required to modulate Trk activity or binding affinity (Verdi et al., 1994). Finally, two recent studies have demonstrated physical interactions between the Trks and p75 (Huber and Chao, 1995; Wolf et al., 1995), supporting the hypothesis that p75 increased the rate at which NGF associated with the Trks (for review, see Greene and Kaplan, 1995). Thus, the enhanced responsiveness to NGF by mature OLs may be mediated by the developmental upregulation of p75.
TrkBgp95 expression is upregulated in postmitotic OLs
Using PCR and Western blot analysis, we have demonstrated that oligodendrocyte lineage species express a truncated form of TrkB (TrkBgp95) that is upregulated in mature cells. These findings are consistent with Northern analysis of developing OLs showing that O-2A progenitors and mature OLs express several different truncated trkB receptor transcripts in vitro (Frisen et al., 1993). Further, TrkBgp95 and BDNF have been shown to be expressed in mature oligodendrocytes in vivo (Wetmore and Olson, 1995). Interestingly, Ip et al. (1993) found that the ratio of trkBgp95 to trkBgp145 increases 10-fold in the transition from newborn to adult rat brain. More recently, Barde and colleagues have shown that in the developing chick brain, truncated trkB is primarily expressed by glial cells and establishes a gradient of BDNF for adjacent neurotrophin-responsive neurons (Biffo et al., 1995). Those studies and the findings of Wetmore and Olson (1995)suggest that oligodendrocytes may also be a source for BDNF. Thus, in the mature brain, myelinating oligodendrocytes may support BDNF-dependent neurons by producing BDNF and/or by establishing BDNF concentration gradients for adjacent neurons.
TrkC is expressed in developing oligodendrocytes
Previous studies have demonstrated potent trophic actions of NT-3 on the proliferation and survival of optic nerve-derived O-2A progenitors and mature OLs both in vitro and in vivo (Barres at al., 1993, 1994a; Barres and Raff, 1994). Barres and coworkers found a synergistic effect on OLP cell proliferation using a combination of NT-3 and PDGF. Our results show that both NT-3 and PDGF increase the percentage of OLPs that synthesize DNA. Although coapplication of NT-3 and PDGF resulted in a moderate increase in the percentage of BrdU+ OLPs, this increase is not significantly different than the effects of NT-3 alone. Interestingly,in vitro analysis of OLPs derived from adult rat spinal cord showed that NT-3 is not a mitogen for this cellular subpopulation (Engel and Wolswijk, 1996). The difference in the responses in these three experimental systems may lie in their regional differences in the CNS, or in the subtype(s) of trkC transcripts expressed in these cells. Four splice variants of trkC, with functional tyrosine kinase domains, exhibit different signal transduction capabilities (Lamballe et al., 1993; Tsoulfas et al., 1993; Valenzuela et al., 1993) and, therefore, may define interactive capabilities between other tyrosine kinase receptors, such as the PDGF receptor family. Thus, further identification of the types of trkC expressed in this system and in optic nerve-derived OLs may shed light on the mechanisms by which trkC transduces the trophic actions of NT-3. Western blot analysis has demonstrated the existence of a high-molecular-weight (180 kDa) form of TrkC in addition to the more commonly recognized 150 kDa form. A high-molecular-weight form of TrkA has been described previously byEhlers et al. (1995), but no previous study has reported the existence of high-molecular-weight species of TrkC. The identification of the NT-3-responsive trkAII isoform on mature OLs raises the possibility that NT-3 may exert some of its trophic effects on the survival of mature OLs via activation of TrkA as well as TrkC. It is interesting to note that the survival assay demonstrates that the trophic effects of NT-3 on mature OLs are further potentiated at very high NT-3 concentrations (10–100 ng/ml); thus, the effects at high factor concentrations could be transduced by both trkAII and trkC.
Trk and p75 expression in the oligodendrocyte lineage: a developmental perspective
Individual classes of peripheral nervous system neurons utilize specific neurotrophins at several stages of their development (Birren et al., 1993; Davis, 1994; Verdi et al., 1994) and, further, neurotrophins exert trophic actions on the development and survival of several CNS neuronal and glial cellular populations. However, little is known about the developmental regulation of trk and p75 expression in CNS-derived neural lineages. We have taken advantage of the ability to identify and isolate progressive stages of the OL lineage to examine the profile of neurotrophin receptor expression in this oligodendrocyte lineage. TrkA and TrkC are both expressed at the OLP stage, whereas p75 expression occurs predominantly in mature OLs. Recent reports have shown that oligodendroglial species express NGF (Byravan et al., 1994;Qu et al., 1995) and that proliferating macroglial cultures from several CNS areas also express NGF at levels that are eightfold higher than in quiescent cells (Lu et al., 1991). Further, Kumar et al. (1993)have demonstrated that NGF application induces p75 expression in astrocytes. Thus, endogenous NGF may upregulate p75 as OLPs undergo terminal differentiation. This hypothetical autocrine loop involving p75 upregulation by NGF may increase responsiveness of mature OLs to the neurotrophins. However, similar in vitro models of p75 upregulation by NGF in PNS neurons (Birren et al., 1993; Davies, 1994;Verdi et al., 1994) have been questioned by Davies et al. (1995), who showed that the developmental upregulation of p75 in the trigeminal ganglion is similar in the NGF −/− mouse and the wild-type animal. Thus, delineation of the mechanisms that regulate trkA, trkC, and p75 gene expression in developing OLs and confer increased NGF responsiveness by mature OLs will require future studies. Taken together, our results establish that NGF as well as NT-3 exert stage-specific effects on the development and the survival of OLs and provide additional insights into the range of developmental signaling pathways utilized by CNS glia.
Footnotes
This work was supported by the National Institutes of Health-sponsored Medical Scientist Training Program, AECOM (R.M.), the Muscular Dystrophy Association, an Irma T. Hirschl Career Scientist Award (M.F.M.), and U.S. Public Health Service Grants NS-20013, NS-20778 (J.A.K.), and NS-23705 (R.I.C., W.T.N.). We thank Drs. David Kaplan, Louis Reichardt, and Moses Chao for generous gifts of their respective neurotrophin receptor antisera; Dr. Steve Pfeiffer for providing the O4 and O1 hybridoma lines; Dr. Karen Chandross for valuable help in designing the PCR primers, for editorial comments, and for preparation of figures; Dr. Ziying Zang for help in designing the PCR primers; Drs. Michael Prystowsky and Martha Downen for use of computer image analysis and production facility; and Howard Rubin for help with the graphics.
REFERENCES
- 1.Almazan G, Afar DEH, Bell JC. Phosphorylation and disruption of intermediate filament proteins in oligodendrocyte precursor cultures treated with calyculin A. J Neurosci Res. 1993;36:163–172. doi: 10.1002/jnr.490360206. [DOI] [PubMed] [Google Scholar]
- 2.Althaus HH, Kloppner S, Schmidt-Schultz T, Schwartz P. Nerve growth factor induces proliferation and enhances fiber regeneration in oligodendrocytes isolated from adult pig brain. Neuroscience. 1992;135:219–223. doi: 10.1016/0304-3940(92)90440-i. [DOI] [PubMed] [Google Scholar]
- 3.Bansal R, Stefansson K, Pfeiffer SE. Proligodendroblast antigen (POA), a developmental antigen expressed by A007/O4-positive oligodendrocyte progenitors prior to the appearance of sulfatide and galactocerebroside. J Neurochem. 1992;58:2221–2229. doi: 10.1111/j.1471-4159.1992.tb10967.x. [DOI] [PubMed] [Google Scholar]
- 4.Barbacid M. The trk family of neurotrophin receptors. J Neurobiol. 1994;25:1386–1403. doi: 10.1002/neu.480251107. [DOI] [PubMed] [Google Scholar]
- 5.Barde YA. Neurotrophic factors: an evolutionary perspective. J Neurobiol. 1994;25:1329–1333. doi: 10.1002/neu.480251102. [DOI] [PubMed] [Google Scholar]
- 6.Barker PA, Lomen-Hoerth C, Gensch EM, Meakin SO, Glass DJ, Shooter EM. Tissue-specific alternative splicing generates two isoforms of the trkA receptor. J Biol Chem. 1993;268:15150–15157. [PubMed] [Google Scholar]
- 7.Barres BA, Raff MC. Proliferation of oligodendrocyte precursor cells depends on electrical activity of axons. Nature. 1993;361:258–260. doi: 10.1038/361258a0. [DOI] [PubMed] [Google Scholar]
- 8.Barres BA, Raff MC. Control of oligodendrocyte numbers in the rat optic nerve. Neuron. 1994;12:935–942. doi: 10.1016/0896-6273(94)90305-0. [DOI] [PubMed] [Google Scholar]
- 9.Barres BA, Hart IK, Coles HSR, Burne JF, Voyvodic JT, Richardson WD, Raff MC. Cell death and control of cell survival in the oligodendrocyte lineage. Cell. 1992;70:31–46. doi: 10.1016/0092-8674(92)90531-g. [DOI] [PubMed] [Google Scholar]
- 10.Barres BA, Schmid R, Sendtner M, Raff MC. Multiple extracellular signals are required for long-term oligodendrocyte survival. Development. 1993;8:283–295. doi: 10.1242/dev.118.1.283. [DOI] [PubMed] [Google Scholar]
- 11.Barres BA, Raff MC, Gaese F, Bartke I, Dechant G, Barde YA. A crucial role for neurotrophin-3 in oligodendrocyte development. Nature. 1994;367:371–375. doi: 10.1038/367371a0. [DOI] [PubMed] [Google Scholar]
- 12.Biffo S, Offenhauser N, Carter BD, Barde YA. Selective binding and internalisation by truncated receptors restrict the availability of BDNF during development. Development. 1995;121:2461–2470. doi: 10.1242/dev.121.8.2461. [DOI] [PubMed] [Google Scholar]
- 13.Bögler O, Wren D, Barnett SC, Land H, Noble M. Cooperation between two growth factors promotes extended self-renewal and inhibits differentiation of oligodendrocyte-type-2-astrocyte (O2A) progenitor cells. Proc Natl Acad Sci USA. 1990;87:6368–6372. doi: 10.1073/pnas.87.16.6368. [DOI] [PMC free article] [PubMed] [Google Scholar]
- 14.Byravan S, Foster LM, Phan T, Verity AN, Campagnoni AT. Murine oligodendroglial cells express nerve growth factor. Proc Natl Acad Sci USA. 1994;91:8812–8816. doi: 10.1073/pnas.91.19.8812. [DOI] [PMC free article] [PubMed] [Google Scholar]
- 15.Chao MV. The p75 neurotrophin receptor. J Neurobiol. 1994;25:1373–1385. doi: 10.1002/neu.480251106. [DOI] [PubMed] [Google Scholar]
- 16.Chomczynski P. A reagent for the single-step simultaneous isolation of RNA, DNA and proteins from cell and tissue samples. Biotechniques. 1993;15:532–537. [PubMed] [Google Scholar]
- 17.Clary DO, Reichardt LF. An alternatively spliced form of the nerve growth factor receptor trkA confers an enhanced response to neurotrophin-3. Proc Natl Acad Sci USA. 1994;91:11133–11137. doi: 10.1073/pnas.91.23.11133. [DOI] [PMC free article] [PubMed] [Google Scholar]
- 18.Clary DO, Weskamp G, Austin LR, Reichardt LF. TrkA cross-linking mimics neuronal responses to nerve growth factor. Mol Biol Cell. 1994;5:549–563. doi: 10.1091/mbc.5.5.549. [DOI] [PMC free article] [PubMed] [Google Scholar]
- 19.Condorelli DF, Dell’Albani P, Mudo G, Timmusk T, Belluardo N. Expression of neurotrophins and their receptors in primary astroglial cultures: induction by cyclic AMP-elevating agents. J Neurochem. 1994;63:509–516. doi: 10.1046/j.1471-4159.1994.63020509.x. [DOI] [PubMed] [Google Scholar]
- 20.Davies AM. The role of neurotrophins in the developing nervous system. J Neurobiol. 1994;25:1334–1348. doi: 10.1002/neu.480251103. [DOI] [PubMed] [Google Scholar]
- 21.Davies AM, Lee KF, Jaenisch R. P75-deficient trigeminal sensory neurons have an altered response to NGF but not to other neurotrophins. Neuron. 1993;11:565–574. doi: 10.1016/0896-6273(93)90069-4. [DOI] [PubMed] [Google Scholar]
- 22.Dobrowsky RT, Werner MH, Castellino AM, Chao MV, Hannun YA. Activation of the sphingomyelin cycle through the low-affinity neurotrophin receptor. Science. 1994;265:1596–1599. doi: 10.1126/science.8079174. [DOI] [PubMed] [Google Scholar]
- 23.Davies AM, Wyatt S, Nishimura M, Phillips H. NGF receptor expression in sensory neurons develop normally in embryos lacking NGF. Dev Biol. 1995;171:434–438. doi: 10.1006/dbio.1995.1293. [DOI] [PubMed] [Google Scholar]
- 24.Ehlers MD, Kaplan DR, Price DL, Koliatsos VE. NGF-stimulated retrograde transport of trkA in the mammalian nervous system. J Cell Biol. 1995;130:149–156. doi: 10.1083/jcb.130.1.149. [DOI] [PMC free article] [PubMed] [Google Scholar]
- 25.Eisenbarth GS, Walsh FS, Nirenberg M. Monoclonal antibody to a plasma membrane antigen of neurons. Proc Natl Acad Sci USA. 1979;76:4913–4917. doi: 10.1073/pnas.76.10.4913. [DOI] [PMC free article] [PubMed] [Google Scholar]
- 26.Engel J, Althaus HH, Kristjansson GI. NGF increases [Ca2+]i in regenerating mature oligodendroglial cells. NeuroReport. 1994;5:397–400. doi: 10.1097/00001756-199401120-00006. [DOI] [PubMed] [Google Scholar]
- 27.Engel U, Wolswijk G. Oligodendrocyte type-2 astrocytes (O-2A) progenitor cells derived from the adult rat spinal cord: in vitro characteristics and response to PDGF bFGF and NT-3. Glia. 1996;16:16–26. doi: 10.1002/(SICI)1098-1136(199601)16:1<16::AID-GLIA3>3.0.CO;2-9. [DOI] [PubMed] [Google Scholar]
- 28.Frisen J, Verge VM, Fried K, Risling M, Persson H, Trotter J, Hokfelt T, Lindholm D. Characterization of glial trkB receptors: differential response to injury in the central and peripheral nervous systems. Proc Natl Acad Sci USA. 1993;90:4971–4975. doi: 10.1073/pnas.90.11.4971. [DOI] [PMC free article] [PubMed] [Google Scholar]
- 29.Gard AL, Pfeiffer SE. Two proliferative stages of oligodendrocyte lineage (A2B5+/O4− and O4+/O1−) under different mitogenic control. Neuron. 1990;5:615–625. doi: 10.1016/0896-6273(90)90216-3. [DOI] [PubMed] [Google Scholar]
- 30.Gard AL, Pfeiffer SE. Glial cell mitogens bFGF and PDGF differentially regulate development of O4+/O1− oligodendrocytes progenitors. Dev Biol. 1993;159:618–630. doi: 10.1006/dbio.1993.1269. [DOI] [PubMed] [Google Scholar]
- 31.Gard AL, Burrel MR, Pfeiffer SE, Rudge JS, Williams WC. Astroglial control of oligodendrocyte survival is mediated by PDGF and leukemia inhibitory factor-like protein. Development. 1995;121:2187–2197. doi: 10.1242/dev.121.7.2187. [DOI] [PubMed] [Google Scholar]
- 32.Gilad GM, Gilad VH. Chemotaxis and accumulation of nerve growth factor by microglia and macrophages. J Neurosci Res. 1995;41:594–602. doi: 10.1002/jnr.490410505. [DOI] [PubMed] [Google Scholar]
- 33.Hantzopoulos PA, Suri C, Glass DJ, Goldfarb MP, Yancopoulos GD. The low affinity NGF receptor p75 can collaborate with each of the trks to potentiate functional response to the neurotrophins. Neuron. 1994;13:187–201. doi: 10.1016/0896-6273(94)90469-3. [DOI] [PubMed] [Google Scholar]
- 34.Huber LJ, Chao MV. A potential interaction of p75 and trkA NGF receptors revealed by affinity crosslinking and immunoprecipitation. J Neurosci Res. 1995;40:557–563. doi: 10.1002/jnr.490400415. [DOI] [PubMed] [Google Scholar]
- 35.Hutton LA, Perez-Polo JR. In vitro glial responses to nerve growth factor. J Neurosci Res. 1995;41:185–196. doi: 10.1002/jnr.490410206. [DOI] [PubMed] [Google Scholar]
- 36.Hutton LA, de Vellis J, Perez-Polo JR. Expression of p75NGFR TrkA, and TrkB mRNA in rat C6 glioma and type I astrocyte cultures. J Neurosci Res. 1992;32:375–383. doi: 10.1002/jnr.490320309. [DOI] [PubMed] [Google Scholar]
- 37.Junier MP, Suzuki F, Onteniente B, Peschanski M. Target-deprived CNS neurons express the NGF gene while reactive glia around their axonal terminals contain low and high affinity NGF receptors. Mol Brain Res. 1994;24:247–260. doi: 10.1016/0169-328x(94)90138-4. [DOI] [PubMed] [Google Scholar]
- 38.Kahn MA, de Vellis J. Regulation of an oligodendrocyte progenitor cell line by the IL6 family of cytokines. Glia. 1994;21:87–98. doi: 10.1002/glia.440120202. [DOI] [PubMed] [Google Scholar]
- 39.Kaplan DR, Stephens RM. Neurotrophic signal transduction by the trk receptors. J Neurobiol. 1994;25:1404–1417. doi: 10.1002/neu.480251108. [DOI] [PubMed] [Google Scholar]
- 40.Kaplan DR, Matsumoto K, Lucarelli R, Thiele CJ. Induction of TrkB by retinoic acid mediates biologic responsiveness to BDNF and differentiation of human neuroblastoma cells. Neuron. 1993;11:321–331. doi: 10.1016/0896-6273(93)90187-v. [DOI] [PubMed] [Google Scholar]
- 41.Klein R, Silos-Santiago I, Smeyne RJ, Lira SA, Brambilla R, Bryant S, Zhang L, Snider WD, Barbacid M. Disruption of the neurotrophin-3 receptor gene trkC eliminates Ia muscle afferents and results in abnormal movements. Nature. 1994;368:249–251. doi: 10.1038/368249a0. [DOI] [PubMed] [Google Scholar]
- 42.Kumar S, Pena LA, de Vellis J. CNS glial cells express neurotrophin receptors whose levels are regulated by NGF. Mol Brain Res. 1993;17:163–168. doi: 10.1016/0169-328x(93)90086-5. [DOI] [PubMed] [Google Scholar]
- 43.Lamballe F, Tapley P, Barbacid M. TrkC encoded multiple neurotrophin-3 receptors with distinct biological properties and substrate specificity. EMBO J. 1993;12:3083–3094. doi: 10.1002/j.1460-2075.1993.tb05977.x. [DOI] [PMC free article] [PubMed] [Google Scholar]
- 44.Lee KF, Davies AM, Jaenisch R. p75-Deficient embryonic dorsal root sensory and neonatal sympathetic neurons display decreased sensitivity to NGF. Development. 1994;120:1027–1033. doi: 10.1242/dev.120.4.1027. [DOI] [PubMed] [Google Scholar]
- 45.Lee TH, Abe K, Korgure K, Itoyama Y. Expressions of nerve growth factor and p75 low affinity receptor after transient forebrain ischemia in gerbil hippocampal CA1 neurons. J Neurosci Res. 1995;41:684–695. doi: 10.1002/jnr.490410515. [DOI] [PubMed] [Google Scholar]
- 46.Lu B, Yokoyama M, Dreyfus M, Black IB. NGF gene expression in actively growing brain glia. J Neurosci. 1991;11:318–326. doi: 10.1523/JNEUROSCI.11-02-00318.1991. [DOI] [PMC free article] [PubMed] [Google Scholar]
- 47.Mahadeo D, Kaplan L, Chao MV, Hampstead BL. High affinity NGF binding displays a faster rate of association than p140 trk binding: implications for multi-subunit receptors. J Biol Chem. 1994;269:6884–6891. [PubMed] [Google Scholar]
- 48.Manthorpe MR, Fagnani SD, Skaper Varon S. An automated colorimetric microassay for neuronotrophic factors. Dev Brain Res. 1986;25:191–198. doi: 10.1016/s0006-8993(86)80227-x. [DOI] [PubMed] [Google Scholar]
- 49.McCarthy KD, de Vellis J. Preparation of separate astroglial and oligodendroglial cell cultures from rat cerebral tissue. J Cell Biol. 1980;85:890–902. doi: 10.1083/jcb.85.3.890. [DOI] [PMC free article] [PubMed] [Google Scholar]
- 50.Pfeiffer SE, Warrington AE, Bansel R. Oligodendrocyte and its many cellular processes. Trends Cell Biol. 1993;3:191–198. doi: 10.1016/0962-8924(93)90213-k. [DOI] [PubMed] [Google Scholar]
- 51.Qu P, Dai X, Wu H, Freidman WJ, Black IB, Dreyfus CF. Expression and regulation of neurotrophic factors in basal forebrain oligodendrocytes in vitro and in vivo. Soc Neurosci Abstr. 1995;21:2012. [Google Scholar]
- 52.Rabizadeh S, Bredesen DE. Is p75NGFR involved in developmental neural cell death? Dev Neurosci. 1994;16:207–211. doi: 10.1159/000112108. [DOI] [PubMed] [Google Scholar]
- 53.Rabizadeh S, Oh J, Zhong LT, Yang J, Bitler CM, Butcher LL, Bredesen DE. Induction of apoptosis by the low-affinity NGF receptor. Science. 1993;261:345–348. doi: 10.1126/science.8332899. [DOI] [PubMed] [Google Scholar]
- 54.Raible DW, McMorris FA. Cyclic AMP regulates the rate of differentiation of oligodendrocytes without changing the lineage commitment of their progenitors. Dev Biol. 1989;133:437–446. doi: 10.1016/0012-1606(89)90047-x. [DOI] [PubMed] [Google Scholar]
- 55.Raible DW, McMorris FA. Induction of oligodendrocyte differentiation by activators of adenylate cyclase. J Neurosci Res. 1990;27:43–46. doi: 10.1002/jnr.490270107. [DOI] [PubMed] [Google Scholar]
- 56.Rodriguez-Tebar A, Dechant G, Barde YA. Binding brain-derived neurotrophic factor to the nerve growth factor receptor. Neuron. 1990;4:487–492. doi: 10.1016/0896-6273(90)90107-q. [DOI] [PubMed] [Google Scholar]
- 57.Rudge JS, Li Y, Pasnikowski EM, Mattsson K, Pan L, Yancopoulos GD, Wiegand SJ, Lindsay RM, Ip NY. Neurotrophic factor receptors and their signal transduction capabilities in rat astrocytes. Eur J Neurosci. 1994;6:693–705. doi: 10.1111/j.1460-9568.1994.tb00981.x. [DOI] [PubMed] [Google Scholar]
- 58.Shao Y, Porter JT, McCarthy KD. Neuroligand receptor heterogeneity among astroglia. Perspect Dev Neurobiol. 1994;2:205–215. [PubMed] [Google Scholar]
- 59.Snider WD. Function of the neurotrophins during nervous system development: what the knockouts are teaching us. Cell. 1994;77:627–638. doi: 10.1016/0092-8674(94)90048-5. [DOI] [PubMed] [Google Scholar]
- 60.Sommer I, Schachner M. Monoclonal antibodies (O1 and O4) to oligodendrocyte cell surfaces: an immunocytological study in the central nervous system. Dev Biol. 1981;83:311–327. doi: 10.1016/0012-1606(81)90477-2. [DOI] [PubMed] [Google Scholar]
- 61.Stephens RM, Loeb DM, Copeland TD, Pawson T, Greene LA, Kaplan DR. Trk receptors use redundant signal transduction pathways involving SHC and PLC-γ1 to mediate NGF responses. Neuron. 1994;12:691–705. doi: 10.1016/0896-6273(94)90223-2. [DOI] [PubMed] [Google Scholar]
- 62.Tsoulfas P, Soppet D, Escandon E, Tessarollo L, Mendoze-Ramirez J-L, Rosenthal A, Nikolics K, Parada LF. The rat trkC locus encodes multiple neurogenic receptors that exhibit differential response to neurotrophin-3 in PC12 cells. Neuron. 1994;10:975–990. doi: 10.1016/0896-6273(93)90212-a. [DOI] [PubMed] [Google Scholar]
- 63.Valenzuela DM, Maisonpierre PC, Glass DJ, Rojas E, Nunez L, Kong Y, Gies DR, Stitt TN, Ip NY, Yancopoulos GD. Alternative forms of trkC with different functional capabilities. Neuron. 1993;10:963–974. doi: 10.1016/0896-6273(93)90211-9. [DOI] [PubMed] [Google Scholar]
- 64.Vartanian T, Sprinkle TJ, Dawson G, Szuchet S. Oligodendrocyte substratum adhesion modulates expression of adenylate cyclase-linked receptors. Proc Natl Acad Sci USA. 1988;85:939–943. doi: 10.1073/pnas.85.3.939. [DOI] [PMC free article] [PubMed] [Google Scholar]
- 65.Verdi JM, Anderson DJ. Neurotrophins regulate sequential changes in neurotrophin receptor expression by sympathetic neuroblasts. Neuron. 1994;13:1359–1372. doi: 10.1016/0896-6273(94)90421-9. [DOI] [PubMed] [Google Scholar]
- 66.Verdi JM, Birren SJ, Ibáñez CF, Persson H, Kaplan DR, Benedetti M, Chao MV, Anderson DJ. p75LNGFR regulates Trk signal transduction and NGF-induced neuronal differentiation in MAH cells. Neuron. 1994;12:733–745. doi: 10.1016/0896-6273(94)90327-1. [DOI] [PubMed] [Google Scholar]
- 67.Volente C, Angelastro JM, Greene LA. Association of protein kinases ERK1 and ERK2 with p75 nerve growth factor receptors. J Biol Chem. 1993;268:21410–21415. [PubMed] [Google Scholar]
- 68.Wyatt S, Davies AM. Regulation of nerve growth factor receptor gene expression in sympathetic neuron during development. J Cell Biol. 1995;130:1435–1446. doi: 10.1083/jcb.130.6.1435. [DOI] [PMC free article] [PubMed] [Google Scholar]
- 69.Wetmore C, Olson L. Neuronal and nonneuronal expression of neurotrophins and their receptors in sensory and sympathetic ganglia suggest new intercellular trophic interactions. J Comp Neurol. 1995;353:143–159. doi: 10.1002/cne.903530113. [DOI] [PubMed] [Google Scholar]
- 70.Widmer HR, Hefti F. Neurotrophin 4/5 promotes survival and differentiation of rat striatal neurons developing in culture. Eur J Neurosci. 1994;6:1669–1679. doi: 10.1111/j.1460-9568.1994.tb00559.x. [DOI] [PubMed] [Google Scholar]
- 71.Wolswijk G, Riddle PN, Noble M. Platelet-derived growth factor is mitogenic for O2Aadult progenitor cells. Glia. 1991;4:495–503. doi: 10.1002/glia.440040509. [DOI] [PubMed] [Google Scholar]
- 72.Zhou J, Bradford HF, Stern GM. The response of human and rat fetal ventral mesencephalon in culture to the brain-derived neurotrophic factor treatment. Brain Res. 1994;656:147–156. doi: 10.1016/0006-8993(94)91376-5. [DOI] [PubMed] [Google Scholar]