

Abstract
Different cortical areas are linked reciprocally via forward and feedback connections. Forward connections are involved in the representation of retinal images, whereas feedback pathways may play a role in the selection and interpretation of visual information. To examine the synaptic mechanisms of forward and feedback connections between primary and secondary visual cortical areas directly, we have performed intracellular recordings in slices of rat visual cortex. Irrespective of stimulus intensity and membrane potential, 78% (45/58) of the cells in striate cortex activated by feedback input showed monosynaptic responses that were depolarizing only, and inhibitory inputs were evident merely as a slight acceleration in the decay of EPSPs. In contrast, in 89% (17/19) of the cells, stimulation of forward input evoked monosynaptic excitatory postsynaptic potentials (EPSPs), followed by disynaptic, hyperpolarizing inhibitory postsynaptic potentials (IPSPs). EPSPs followed by IPSPs also were recorded after stimulation of local connections within primary visual cortex (92%, 12/13) and after activation of thalamocortical input (91%, 10/11). These results suggest that the synaptic organization of feedback connections are distinct from forward, local, and thalamocortical circuits. The findings further indicate that intracortical back projections exert modulatory influences via synaptic mechanisms in which weak inhibitory input is strongly dominated by excitation.
Keywords: visual cortex, forward circuit, feedback circuit, synaptic mechanisms, inhibition, excitation
Vision is an active process in which the cortical representation of the visual scene is modulated by top-down signals to assess the relevance of incoming information for ongoing behavior (Desimone and Duncan, 1995; Maunsell, 1995). In addition, the cortical representation of the retinal image is dynamic and depends on the context in which a stimulus appears (Gilbert, 1992). Important anatomical substrates underlying these processes reside in the visual cortex, specifically horizontal intra-areal and feedback connections that link higher with lower visual areas. These pathways have a widespread but specific connectivity that integrates information from dispersed parts of the visual field (Gilbert and Wiesel, 1983; Rockland and Virga, 1989; Shipp and Zeki, 1989a,b; Salin et al., 1993). Experiments in cats and primates have shown that activation of these widely distributed systems suppresses responses in the classical receptive field (Allman et al., 1985; Nelson and Frost, 1985; Orban et al., 1987; Gilbert and Wiesel, 1989, 1990). Other observations, however, indicate that excitatory responses can be obtained by activation of horizontal and feedback systems (Sandell and Schiller, 1982; Mignard and Malpeli, 1991; Knierim and Van Essen, 1992; Grinvald et al., 1994).
To understand the synaptic mechanisms that underlie interactions within horizontal networks, Hirsch and Gilbert (1991) recorded in slices of cat visual cortex. They found that horizontal connections evoked EPSPs, followed by IPSPs, in 59% of striate cortical neurons. The remaining 41% was dominated by EPSPs, and IPSPs were too weak to produce hyperpolarization. This suggests that the effects of horizontal inputs on striate cortical receptive fields are determined by the balance of excitation and inhibition. By stimulating remote inputs more strongly, a greater number of inhibitory neurons are recruited, thereby tipping the balance toward suppression of responses and greater stimulus selectivity (Hirsch and Gilbert, 1991; Sommers et al., 1995; Stemmler et al., 1995).
We have investigated the organization of intracortical forward and feedback connections in rat visual cortex (Coogan and Burkhalter, 1993). Ultrastructural analyses have revealed that both of these pathways provide input to pyramidal cells and GABAergic neurons (Johnson and Burkhalter, 1996). Most importantly, the results show that feedback inputs to GABAergic neurons are five times less numerous than forward inputs, and the majority of feedback inputs terminate on dendritic spines of pyramidal neurons. This organization differs from that of horizontal connections within monkey striate cortex (McGuire et al., 1991) and suggests that synaptic mechanisms in feedback circuits are distinct. In feedback circuits, the balance between excitation and inhibition may not be dependent simply on the level of activation (Hirsch and Gilbert, 1991), but it is conceivable that anatomical constraints favor excitation. To test this hypothesis, we recorded in slices of rat visual cortex and compared postsynaptic responses evoked by forward and feedback connections that link area 17 with the secondary visual area, LM (Coogan and Burkhalter, 1993). In addition, we compared forward and feedback circuits with horizontal connections within area 17 and the thalamocortical pathway, which both show structural similarities to forward connections (Peters and Feldman, 1976; McGuire et al., 1991).
MATERIALS AND METHODS
Preparation and maintenance of slices. Young adult Long Evans rats aged 4–6 weeks were anesthetized by inhalation of halothane and decapitated. The brain was removed and placed in ice-cold oxygenated sucrose artificial CSF (sucrose ACSF) containing (in mm): 252 sucrose, 3.3 KCl, 2.5 CaCl2, 1.2 MgSO4, 25.5 NaHCO3, 1.2 KH2PO4, and 15 d-glucose, pH 7.4 (Aghajanian and Rasmussen, 1989). The occipital pole was dissected and cut in the coronal plane at 400 μm with a vibratome. The fourth and the fifth slices counted from the posterior pole were selected for recording. Both of these slices contain areas 17 and LM and include the connections that reciprocally link both areas (Domenici et al., 1995). Slices were viewed on a black background under a dissecting microscope. Under these conditions, the lateral border of area 17 appeared as a sharp transition in coloration between the heavily myelinated striate cortex and the more weakly myelinated extrastriate cortex adjoining laterally. This border was marked by cutting a notch in the subiculum below the visual cortex (Domenici et al., 1995). Then the slices were transferred with a fine paint brush to an interface-type chamber (Fine Science Tools). The tissue was maintained at 33°C in a humidified atmosphere of 95% O2/5% CO2 and superfused with a 1:1 mixture of sucrose ACSF and normal ACSF containing (in mm): 124 NaCl, 3.3 KCl, 2.5 CaCl2, 1.2 MgSO4, 25.5 NaHCO3, 1.2 KH2PO4, and 15 d-glucose, pH 7.4. After 30 min this mixture was replaced by normal ACSF. The slices were allowed to recover for an additional 90 min before recording commenced.
Recording and stimulation. Intracellular recordings were obtained from randomly selected cells in layer 2/3. Recording electrodes were pulled from thin-walled borosilicate Ω-dot tubing [outer diameter (o.d.), 1 mm; inner diameter (i.d.), 0.75 mm; WPI, Sarasota, FL). Electrode resistances ranged from 60 to 120 MΩ when filled with 4 m K-acetate, pH 7.4. For intracellular injections of 4,4′-dinitro-stilbene-2,2′-disulfonic acid (DNDS; Pfaltz and Bauer, Waterbury, CT), the free acid was dissolved in 2 m K-acetate immediately before use to a final concentration of 0.2–0.5 mm. All manipulations involving DNDS were performed with the room lights dimmed to protect from direct exposure to light.
Bipolar stimulating electrodes were made of pairs of insulated platinum/iridium (Pt/Ir) wires with exposed tips spaced 200 μm apart (F. Haer, Brunswick, ME). For stimulation, electric pulses (0.5–2 mA, 100 μsec, 0.1–10 Hz) were delivered by a stimulator. Stimulus strength was scaled to the minimal strength (threshold, 1T) necessary to elicit postsynaptic potentials (PSPs) at the resting membrane potential. Stimulus intensities of 1T–1.33T were considered weak. Medium-strength stimuli ranged from 1.34T to 1.66T. The highest stimulus intensities used for synaptic activation were 1.67T–2T.
To place stimulating and recording electrodes into identified cortical areas, we viewed the cut marking the lateral border of area 17 under a dissecting microscope. The 17/LM border was defined as the line originating at the notch and intersecting the pial surface perpendicularly. For activating forward connections, the stimulating electrode was placed medial to the 17/LM border and was centered in layer 2/3 of area 17. Intracellular recordings were performed in cortex lateral to the 17/LM border and were restricted to superficial layers of area LM (see Fig. 1A). To stimulate feedback connections, we reversed the positions of stimulating and recording electrodes (see Fig. 1B). The distance between stimulating and recording electrodes was 0.9–1.5 mm, and the distance from the 17/LM border was always >0.3 mm. Within these boundaries, the optimal relative position of stimulating and recording electrodes, defined by the topography of interareal connections (Thomas and Espinoza, 1987; Montero, 1993), was found by recording evoked field potentials with low resistance glass pipettes (2–5 MΩ, 3 m NaCl). For this purpose, the cortex was stimulated and the relative position of the two electrodes was adjusted until the response was maximal at minimal stimulus strength (Domenici et al., 1995).
Fig. 1.

Arrangement of stimulating and recording electrodes for studying postsynaptic potentials evoked by forward (A), feedback (B), local (C), and thalamocortical (D) pathways in slices of rat visual cortex. The interrupted linerunning from the notch below white matter (WM) to the pial surface demarcates the myeloarchitectonic border between primary visual cortex (area17) and the secondary visual area (LM). Dorsal is up; medial is to the right.
To study synaptic potentials evoked by local horizontal connections within area 17, we placed stimulating electrodes in layer 2/3 near the medial border of area 17. Recordings were made in the same layer >0.9 mm lateral to the stimulation site (see Fig. 1C). Putative thalamocortical input was activated by stimulating white matter from the gray/white matter border directly below the recording electrode in area 17 (see Fig. 1D; Miller et al., 1993).
The effects of GABA on the membrane potential in the presence of intracellular DNDS was tested by puffer application (Picospritzer, General Valve, Fairfield, NJ) of a microdrop (5–10 nl) of GABA (1 mm in ACSF) from a glass pipette (tip diameter 2–5 μm) in the vicinity of the cell body of the recorded neuron.
Transmembrane voltage signals were amplified (Axoprobe-1, Axon Instruments, Foster City, CA) and displayed on an oscilloscope. Steady-state input resistance (Rm) was determined from the amplitude of 5–10 mV hyperpolarizing responses evoked by 500 msec negative current pulses. The membrane potential was monitored continuously on a separate display. The true membrane potential (Vm) was determined on withdrawal of the electrode by subtracting the extracellular from the intracellular potential. To study the voltage dependence of evoked PSPs, we obtained recordings in active bridge mode, and the membrane potential was manipulated by injecting steady (i.e., DC) depolarizing or hyperpolarizing currents. Data were digitized at 25 kHz. Potentials were displayed on-line and stored on optical disk for future analysis.
Cells were selected for recordings that displayed resting membrane potentials ≤68 mV and overshooting action potentials in response to brief depolarizing current injections. Data analyses were confined to those cells with stable resting potentials (i.e., maintained without applied current injections) throughout the course of the experiment (n = 126). Peak amplitudes of EPSPs and IPSPs (average of 3–6 individual sweeps) were measured as the maximal positive or negative deflection from the baseline. Peak latencies of EPSPs were measured as the time from the stimulus to the peak. Onset latencies were determined from the time of stimulus to the time the EPSP began to deviate consistently from the average baseline value. The widths of EPSPs were measured at half-maximal amplitude. All values are given as mean ± SD. Student’s t test was used to compare data obtained in different experiments, and significance was set atp ≤ 0.05.
RESULTS
Postsynaptic targets of forward and feedback input
When stimulating and recording electrodes were aligned topographically (Fig. 1A,B), the majority of randomly selected cells recorded in layer 2/3 of areas 17 and LM showed synaptic responses to either feedback (95%, 58/61) or forward (86%, 19/22) inputs, respectively. In most of these cells in which PSPs were recorded (93%, 77/83), a 200–500 msec pulse of positive current elicited repetitive firing, the frequency of which (∼50 Hz) gradually decreased as a function of time (Fig.2A). It was shown previously that this regular-spiking (RS) behavior is encountered in all pyramidal neurons (McCormick et al., 1985). Although similar responses also may be present in some nonpyramidal cells (Kawaguchi, 1995), we estimate on the basis of the incidence (Peters and Kara, 1985) and probability of recordings from nonpyramidal cells (Hestrin, 1993) that >95% in our population of RS cells are pyramidal neurons. The remaining 7% (6/83) of synaptically driven neurons showed a different behavior that resembled that of fast-spiking (FS) cells, the discharge rates of which, up to ∼150 Hz, remained constant over the duration of the current pulse (Fig. 2B). All of these cells were considered nonpyramidal cells (McCormick et al., 1985; Kawaguchi, 1995).
Fig. 2.

Regular-spiking (RS) and fast-spiking (FS) neurons receive monosynaptic input from feedback connection. A, Left, Spike discharge pattern of RS neuron in layer 2/3 of area 17 during injection of depolarizing current pulse (200 msec, 0.5 nA). Recording atVm = −78 mV). Right, PSP of same cell after electrical stimulation at 0.1 and 10 Hz in area LM.B, Left, Spike discharge pattern of FS neuron in layer 2/3 of area 17 in response to intracellular current injection. Right, PSP of same cell after stimulation at different frequencies in LM. Recording at Vm = −69 mV.
All RS cells (77/77) recorded in areas 17 and LM received monosynaptic input from either forward or feedback connections. Figure2A shows an example of a monosynaptic EPSP in area 17 evoked by feedback input. The average EPSP amplitude in the feedback circuit was 7.5 ± 3.4 mV (n = 58), measured in neurons with a mean resting potential (Vm ± SD) of −77 ± 6 mV and a mean input resistance (Rm ± SD) of 37 ± 9 MΩ. The persistence of fixed latency EPSPs during stimulation at frequencies ≥10 Hz is characteristic for monosynaptic inputs (Sutor and Hablitz, 1989). Stimulation of forward connections to RS cells in area LM (Vm = −77 ± 8 mV;Rm = 46 ± 8 MΩ; n = 19) evoked significantly (p ≤ 0.05) larger EPSPs (13.4 ± 4.5 mV) than activation of feedback input (Table 1). No significant differences between the two pathways were found for PSP onset latencies (forward: 3.7 ± 0.1 msec,n = 16; feedback: 4.1 ± 0.2 msec,n = 19) or peak latencies (forward: 8.7 ± 0.4 msec, n = 16; feedback: 8.8 ± 0.4 msec,n = 19). Thus, on the basis of an average distance between stimulating and recording electrodes of ∼1 mm and assuming a synaptic delay of ∼1 msec, we estimate that the conduction velocity of forward and feedback fibers is similar and ranges between 0.35 and 0.40 m/sec.
Table 1.
| FW | FB | WM | |
|---|---|---|---|
| EPSP amplitude | 13.4 ± 4.5 | 7.5 ± 3.4 | 10.9 ± 4.1 |
| (mV) at Vmrest | n = 19 | n = 58 | n = 11 |
| EPSP width (msec) | 11.1 ± 4.6 | 13.1 ± 3.2 | 8.4 ± 4.0 |
| atVm rest | n = 10 | n = 18 | n = 10 |
| EPSP amplitude | 5.6 ± 3.5 | 4.5 ± 2.0 | 5.0 ± 1.7 |
| (mV) atVm dep | n = 16 | n = 19 | n = 11 |
| EPSP width (msec) | 3.9 ± 3.0 | 9.7 ± 4.8 | 4.0 ± 3.1 |
| atVm dep | n = 11 | n = 12 | n = 10 |
| IPSP amplitude | −6.9 ± 3.4 | −0.88 ± 0.24 | −6.5 ± 1.1 |
| (mV) | n = 19 | n = 58 | n = 11 |
| −7.7 ± 2.6 | −3.9 ± 3 | −7.15 ± 3.1 | |
| n = 17 | n = 13 | n = 10 |
Comparison of PSPs recorded in regular spiking cells of layer 2/3 of rat visual cortex. Forward connections (FW) represent stimulation in area 17, recording in area LM. Feedback connections (FB) represent stimulation in area LM, recording in area 17. Putative thalamocortical connections represent stimulation in white matter (WM), recording in area 17. EPSP represents maximal positive deflections from baseline (mean ± SD). IPSP amplitudes represent maximal negative deflections from baseline (top row, mean ± SD of all cells recorded; bottom row, mean ± SD of cells with undershooting IPSP). EPSP widths were measured at half-maximal amplitude. “Vm rest” refers to the resting membrane potential. “Vm dep” indicates the membrane potential 10–15 mV positive to rest.
Monosynaptic inputs were evident in all of the FS cells (n = 6) recorded (3 in area 17, 3 in LM). In contrast to the responses of RS neurons, however, high frequency stimulation of FS cells typically resulted in a slight attenuation of EPSP amplitude (Fig. 2B). Mean EPSP amplitudes evoked by forward (6.2 ± 2.4 mV) and feedback (7.3 ± 1.8 mV) connections were comparable and closely resembled those evoked by feedback inputs to RS neurons (see above). Average onset latencies (3.9 ± 0.2 msec) and peak latencies (9.1 ± 0.6 msec) were also similar to those seen in recordings from RS cells.
Source of intracortical input
Antidromic activity
Although in all of our experiments stimulating and recording electrodes were placed far apart at distinct locations in areas 17 and LM, the question arose whether forward and feedback pathways were stimulated in isolation. For example, by electrically stimulating forward-projecting neurons in area 17, it is conceivable that feedback-projecting neurons, including their local collaterals within area LM, are activated antidromically. If present, antidromic spikes could, in turn, evoke PSPs in neighboring LM neurons. Because EPSPs activated via this pathway cannot be distinguished readily from activation by forward-projecting fibers, the significance of this potential complication was examined by determining the incidence of antidromic spikes evoked in areas 17 and LM. These experiments revealed that, under the stimulation conditions used in this study (≤2T), antidromic responses were rare and, even when stimulated at ≥2.5T, were seen only in 4% (3/77) of neurons recorded. An example of a feedback-projecting neuron in area LM that received synaptic input from area 17 is shown in Figure 3A,B. Stimulation in area 17 at intermediate stimulus strength (1.5T) evoked a synaptic response (Fig. 3A, top). Strong stimulation (2.0T) was sufficient to trigger an orthodromic action potential riding on the EPSP (Fig. 3A, middle). A further increase in stimulus strength to 2.5T finally triggered an antidromic spike that rose from the baseline (Fig. 3A, bottom, and B). These findings are, in part, explained by a lower probability of activating cells via a small contingent of output fibers than via the more massive number of converging input fibers. However, because antidromic spikes can be evoked only by stimuli that are at least 1.5 times stronger than those required for evoking maximal amplitude EPSPs, it seems more likely that we have used stimuli that were below the threshold for antidromic activation. Such subthreshold stimuli are thought to activate preferentially cell bodies and axon hillocks and are less effective in firing axons of passage (Asanuma and Sakata, 1967; Stoney et al., 1968; Hirsch, 1995). Although we cannot rule out a small contamination of antidromically activated fibers, the distinct PSPs evoked by different pathways (Figs. 4, 5, 7) suggest that this is a minor problem. Further support for this conclusion derives from a current source density analysis showing that the laminar patterns of synaptic activity evoked by stimulation in area 17 and LM closely resemble the laminar distributions of forward and feedback inputs (Coogan and Burkhalter, 1993; Domenici et al., 1995). Thus, it seems likely that the paradigm used in this study allowed for selective activation of forward and feedback pathways.
Fig. 3.

A, B, Antidromic activation depends on stimulus strength. A, Intracellular recording from regular-spiking neuron in layer 2/3 of area 17. Subthreshold monosynaptic PSP evoked by stimulating feedback input with medium-intensity stimulus (1.4T). Stimulation at2T produces larger PSP that triggers an action potential. Recording at Vm = −73 mV. A further increase in stimulus intensity to 2.5T evokes an antidromic spike. B, Events in A shown at higher temporal resolution. Notice that antidromic spike is succeeded by synaptic potential, indicating that forward-projecting neurons receive feedback input. C, D, Monosynaptic and polysynaptic activity after stimulation of forward and feedback pathways. C, PSPs of regular-spiking layer 2/3 neuron in area 17 (recorded at the resting potential) after stimulation (1.5T) of feedback input. Top, Low frequency stimulation (0.1 Hz) reveals an early and a late peak (arrow). Bottom, High frequency stimulation (10 Hz) elicits early and late peak (arrow) only to first stimulus of the train; subsequent stimuli fail to evoke second peak. The amplitude of the early peak is increased because of elimination of polysynaptic inhibitory inputs. D, PSPs of regular-spiking layer 2/3 neuron in area LM (recording at depolarized potential) after stimulation (1.6T) of forward input.Top, 0.1 Hz stimulation (0.1 Hz) reveals an early and a late peak (arrow), followed by a long-lasting hyperpolarization. Bottom, With 10 Hz stimulation, the late peak and the pronounced afterhyperpolarization are present only in the first trial, and both are absent after subsequent stimuli. PSP amplitude is increased, and the decay is slowed because of elimination of polysynaptic EPSPs and IPSPs.
Fig. 4.

PSPs after stimulation of forward and feedback inputs. A, PSPs of regular-spiking layer 2/3 neuron in area 17 after low (1.3T) and high (1.8T) intensity stimulation of feedback input. Hyperpolarizing inhibition is absent at the membrane potentials tested. B, PSPs of regular-spiking layer 2/3 neuron in area LM after low (1.3T) and high (1.8T) intensity stimulation of forward input. At depolarized membrane potentials, high intensity stimulation reveals strong hyperpolarizing inhibition.
Fig. 5.

Distinct PSPs evoked by stimulation of converging inputs with different origins. A, PSPs of regular-spiking layer 2/3 neuron in area 17 after stimulation (1.8T) of feedback inputs (FB) and putative thalamocortical inputs entering from subcortical white matter (WM). Note that this neuron, which shows no hyperpolarizing inhibition to FB inputs, exhibits pronounced hyperpolarization (at depolarized membrane potentials) to WM stimulation. B, PSPs of regular-spiking layer 2/3 neuron in area 17 after stimulation (1.6T) of FB inputs and local horizontal connections (Local) within area 17. Note that this neuron, which shows no hyperpolarizing inhibition to FB inputs, exhibits strong hyperpolarizing response (at depolarized membrane potential) to local inputs.
Fig. 7.

Comparison of peak amplitude of monosynaptic EPSPs (open circles above zero line) and disynaptic IPSPs (open circles below zero line) evoked by high intensity stimulation (1.9T) of different pathways providing input to layer 2/3 neurons of rat visual cortex. All measurements were performed at depolarized membrane potentials, 10–15 mV positive to the rest.Filled circles in each panel (A–D) indicate mean ± SD of EPSPs and IPSPs.IPSPunder indicates the percentage of neurons that show hyperpolarizing inhibition. Insets, Comparison of PSPs evoked in regular-spiking layer 2/3 cells of rat visual cortex at different membrane potentials in response to high intensity stimulation (1.9T) of different inputs. A, Recording in area 17. Typical feedback input from area LM, representative for 78% of the cells tested. B, Recording in area LM. Forward input from area 17. C, Stimulation in white matter below recording site in area 17. D, Input from remote location within area 17.
Polysynaptic activity
Activation of forward and feedback pathways often evoked responses with multiple components. Nevertheless, with the use of high frequency stimulation, it was straightforward to distinguish between mono- and polysynaptic potentials. An example of a feedback response is shown in Figure 3C. In this case, stimulation (0.1 Hz, medium strength) evoked an EPSP with an early and a late peak. Although high frequency stimulation (10 Hz) completely abolished the late peak, the primary peak persisted and, in this particular example, increased in amplitude by 31%. The latter observation clearly suggests that, in addition to a monosynaptic feedback input, this cell received polysynaptic inputs from excitatory and inhibitory neurons, both of which were eliminated by high frequency stimulation. Responses with multiple peaks also were found after stimulation of forward connections (Fig. 3D). However, in contrast to the feedback pathway, a prominent IPSP was evident. As in the feedback pathway, high frequency stimulation rendered the EPSP unimodal. In addition, high frequency stimulation completely eliminated the IPSP, indicating that the IPSP (like the late component of the EPSP) reflects polysynaptic activity.
Inhibition in forward and feedback circuits
To test further the hypothesis that feedback connections are less inhibiting than forward connections (Johnson and Burkhalter, 1996), we recorded PSPs at different membrane potentials and stimulus intensities. To enhance the detection of weak IPSPs, we injected DC currents to depolarize the cell membrane away from the IPSP equilibrium potential (Luhmann and Prince, 1991). Figure 4 shows examples of unimodal responses elicited by forward and feedback pathways. At low stimulus strengths, PSPs evoked from rest by both pathways had similar waveforms. At depolarized membrane potentials, however, EPSPs evoked by feedback inputs were considerably slower than those evoked by forward inputs, and EPSP durations were almost 2.5 times greater when evoked by feedback, as compared with forward inputs (Table 1). In both pathways, the 10%/90% rise time and the time to peak of the EPSP were relatively insensitive to changes in membrane potential. Because feedback PSPs were relatively unaffected by changes in membrane potential, whereas high intensity stimulation of forward connections at depolarized potentials always resulted in hyperpolarizing inhibition, we conclude that disynaptic inhibition in the forward pathway is much more powerful than in the feedback circuit. This interpretation is consistent with the observation that, at depolarized membrane potentials in which IPSPs are large, forward EPSPs were smaller than feedback EPSPs (Table 1). Importantly, even the cells that showed undershooting IPSPs on average had smaller IPSPs than observed in the forward pathway (compare IPSP amplitude in top and bottom rows, Table1).
Distinct PSPs in individual cells evoked by different inputs
To control for differences in EPSP/IPSP balance between different pathways that might have been introduced by the preparation of slices, we recorded PSPs in individual area 17 neurons that received convergent input from different cortical and subcortical sources. Four cells were tested that received both feedback input from LM and forward input from putative thalamocortical afferents. An additional five neurons that received inputs from feedback and local horizontal fibers from within area 17 also were studied. Without exception, stimulation of feedback input failed to evoke hyperpolarizing inhibition in the same cell that responded to white matter stimulation or activation of inputs from within area 17 with strong undershooting IPSPs (Fig.5A,B). This response asymmetry was present at all membrane potentials tested and persisted at stimulation strengths (∼2T) near saturation of the EPSP evoked by both inputs. These results show that strong inhibitory inputs are preserved in layer 2/3 neurons that fail to exhibit overt IPSPs from feedback inputs. This suggests that the discrepancies between the different input pathways are attributable to distinct synaptic circuits.
Intracellular blockade of IPSPs
Although the results presented thus far strongly suggest that synaptic mechanisms at forward and feedback synapses are different, it is important to establish directly the contribution of IPSPs to the PSP. For this purpose, we eliminated the fast IPSP by blocking Cl− channels intracellularly with DNDS (Singh et al., 1991), which leaves slow K+-dependent IPSPs unaffected (Z. Shao and A. Burkhalter, unpublished observations). DNDS was infused slowly into cells by diffusion from the recording pipette. Most neurons (22/24) were affected by the drug and typically showed a noticeable change in PSP waveform within 25–30 min of impalement. Continuous monitoring of the resting membrane potential, and intermittent determinations (at 10 min intervals) of input impedances and membrane time constants, showed no significant deviations from control values over the time of recordings (Fig.6A). An example of how DNDS (0.4 mm) affects PSPs evoked by forward inputs (n = 4) is shown in Figure 6B. At the resting membrane potential (−70 mV for the cell in Fig.6B), the only noticeable effect of DNDS was a gradual increase in EPSP amplitude, indicating a reduction of inhibition. The effect of DNDS, however, was quite large at depolarized potentials: within 30 min after impalement, the hyperpolarizing IPSP was eliminated almost completely. Similar effects were seen in 10 cells tested after stimulation of putative thalamocortical inputs from the white matter (Fig. 6C, top). In contrast to the effects on PSPs with strong hyperpolarizing components (Figs. 6B,C, top), in the 8 of 10 cells affected by DNDS, the effect on feedback PSPs, although clear, was substantially smaller (Fig. 6C, bottom). To estimate the magnitude of the effect of DNDS, we have determined PSP width at half-maximal amplitude before and after drug treatment. Measurements were obtained at membrane potentials 10–15 mV positive to rest, ∼30 min after impalement with DNDS-filled micropipettes. On average, DNDS treatment broadened feedback PSPs 1.9 ± 0.6-fold. In contrast, the change in forward and thalamocortical PSPs was 4.1 ± 0.3-fold, which is more than twice that seen in the feedback pathway. These findings are consistent with the suggestion that, similar to forward circuits, inhibitory interneurons are also incorporated in feedback circuits but that their effects on EPSP amplitude and decay are much weaker than in forward circuits.
Fig. 6.

A–C, Intracellular blockade of IPSPs by DNDS in regular-spiking neurons of rat visual cortex.A, Response of layer 2/3 neuron in area 17 to injection of hyperpolarizing and depolarizing current. Control records were obtained immediately after impalement; records in the presence of DNDS were obtained 30 min later. Note that intracellular injection of DNDS has no significant effect on input resistance or membrane time constant. B, PSPs (recordings at different membrane potentials) of layer 2/3 neuron in area LM evoked by stimulation (1.6T) of forward input. Control trace was obtained immediately after impalement with DNDS-filled electrode. As DNDS slowly enters the cell, IPSP amplitude is reduced markedly 30 min after impalement and disappears altogether at 50 min. C, PSPs of layer 2/3 cell in area 17 after stimulation (1.7T) of inputs from white matter (WM) and feedback (FB) connections. Control traces represent recordings before intracellular infusion of DNDS. Traces labeledDNDS show responses 45 min after impalement and after DNDS effectively blocks IPSPs. D, Intracellular infusion of DNDS blocks response to local application of GABA. Intracellular response to GABA application (filled circle) near soma of layer 2/3 neuron in area 17 shortly after impalement with DNDS-filled electrode (top). The initial phase of the response (indicated by arrows) is shown at expanded time scale (bottom). E, Response to GABA application in the same neuron 30 min after impalement and infusion of DNDS.
Control experiments revealed that intracellular infusion of DNDS blocks effectively the response to application of GABA at the cell body. During the first ∼5 min after impalement, every cell tested (5/5) showed a rapid hyperpolarization, followed by a long-lasting depolarization (Fig. 6D), which is the result of the progressive spread of GABA across the dendritic arbor (Connors et al., 1988). Without exception, 20–30 min after impalement GABA responses were eliminated by DNDS (Fig. 6D). This is consistent with interpretation that synaptically mediated events blocked by DNDS reflect activity of GABA currents.
Comparison of different pathways
The striking correlation between synaptic physiology and synaptic connectivity (Johnson and Burkhalter, 1996) seen in forward and feedback circuits prompted us to look for similar correlations in other pathways. We, therefore, compared forward and feedback PSPs to those evoked by the thalamocortical pathway and by local horizontal connections within area 17.
Putative thalamocortical inputs were activated by stimulating in white matter (Fig. 1D). Inputs from local connections were evoked by stimulating layer 2/3 neurons in area 17 at ∼1 mm from the recording site (Fig. 1C). The findings are shown in Figure7 as plots of peak depolarizing and hyperpolarizing PSP amplitudes against time to peak. The results confirm the observations illustrated in Figures 4 and 5: PSPs after stimulation of forward (Fig.7B), putative thalamocortical (Fig. 7C), and local horizontal connections (Fig. 7D) showed undershooting IPSPs, whereas comparable IPSPs were lacking in most cells activated by the feedback pathway (Fig. 7A; inset shows PSP that is representative for majority of cells. PSPs with undershooting IPSP, representative for the minority of cells, are not shown). In tests performed at high stimulus strengths and at depolarized membrane potentials (10–15 mV positive to resting potential) the percentages of neurons in thalamocortical, local, and forward circuits that showed undershooting IPSPs ranged from 89–92% (Fig. 7B–D). This stands in contrast to the 22% found in the feedback pathway (Fig.7A). In the cells that exhibited undershooting IPSPs, 13 cells (of 58 tested) with feedback input showed an average IPSP amplitude of 3.9 ± 3 mV (Table 1, bottom row). This amplitude was significantly smaller in than in cells showing undershooting IPSPs recorded in other pathways: forward (7.7 ± 2.6 mV,n = 17; Table 1, bottom row), thalamocortical (7.15 ± 3.1 mV, n = 10; Table 1, bottom row), and local horizontal (6.6 ± 4.1 mV, n = 12). Nevertheless, the data show that feedback inputs evoked undershooting IPSPs in a considerable number of cells. This suggests the interesting possibility that the feedback pathway can activate different types of interneurons. Alternatively, it is possible that in some cases the 17/LM border was inaccurately determined and that this may have caused the stimulation of a mixture of feedback and local horizontal fibers.
DISCUSSION
The results show that layer 2/3 pyramidal cells in rat visual cortical areas 17 and LM receive direct excitatory and indirect inhibitory input from both interareal forward and feedback pathways. These observations confirm recordings from long-range intracortical connections in visual and somatosensory cortex (Hirsch and Gilbert, 1991; Thomson and Deuchars, 1994) and are consistent with previous ultrastructural findings (Johnson and Burkhalter, 1996). A summary diagram of the synaptic connectivity in forward and feedback circuits is shown in Figure 8. Although immunostaining of projection neurons has revealed direct GABAergic forward and feedback connections (McDonald and Burkhalter, 1993), we have never encountered monosynaptic IPSPs after stimulation in superficial layers and, therefore, conclude that this input derives from infragranular layers.
Fig. 8.
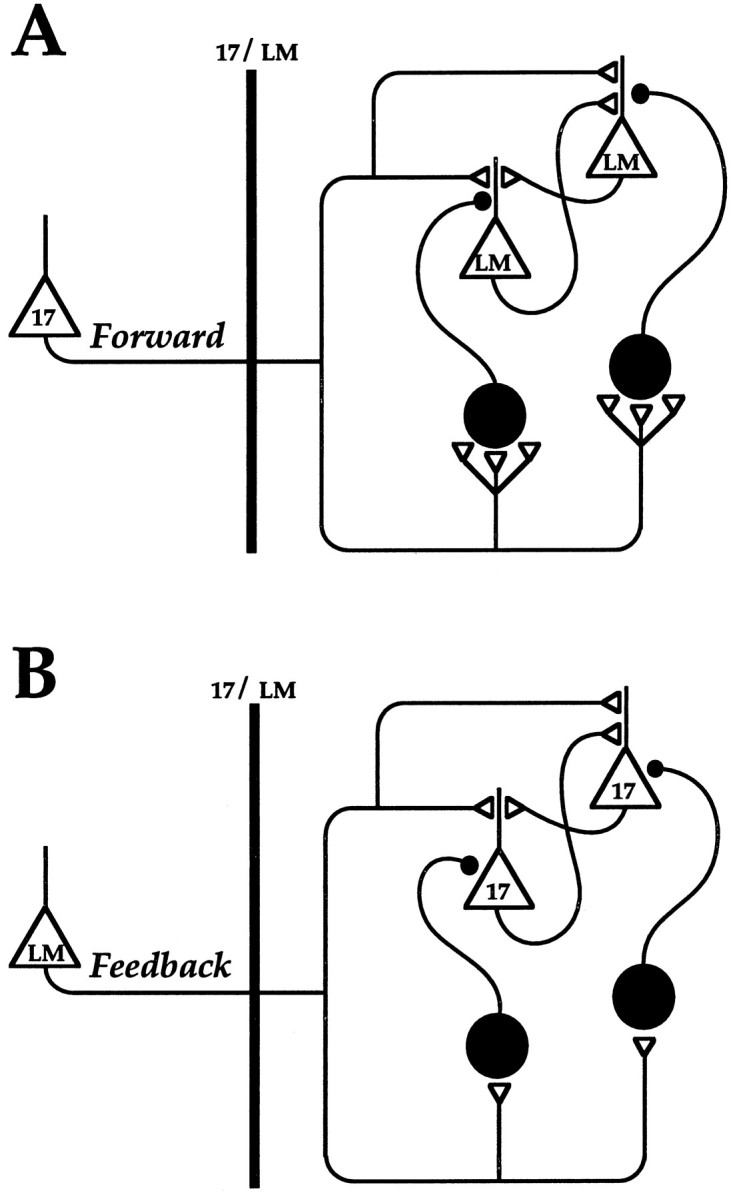
Proposed schematic of forward and feedback circuits. Openlarge triangles indicate pyramidal cells. Opensmall trianglesrepresent excitatory synapses. Filledlarge circles indicate inhibitory GABAergic interneurons.Filledsmall circles represent inhibitory synapses. Note that, in the forward circuit (A), inputs to inhibitory interneurons are more numerous than in the feedback circuit (B). Also note that, in the forward circuit, inhibitory axons terminate on proximal dendrites, whereas in the feedback circuit they terminate on cell bodies. 17, Primary visual cortical neurons; LM, neurons in secondary visual area LM; 17/LM, border between areas 17 and LM.
Although the basic structure of forward and feedback circuits is similar, the results show that the synaptic balance of excitation and inhibition differs in both pathways. Forward inputs invariably evoked EPSPs, followed by hyperpolarizing IPSPs. In contrast, undershooting IPSPs were rarely (22%) seen in the feedback pathway, regardless of the level of stimulation (which was varied to recruit the maximal number of inputs to inhibitory interneurons). This differs from horizontal connections within cat striate cortex, where more than one-half (59%) of the cells showed undershooting IPSPs (Hirsch and Gilbert, 1991). It also differs from results in layer 2/3 of cat motor cortex, where local stimulation invariably evoked EPSPs, followed by strong hyperpolarization (van Brederode and Spain, 1995). Although inhibitory interneurons participate in both forward and feedback circuits, our findings suggest that, in 78% of the cells receiving feedback inputs, synaptic inhibition is much weaker than in forward circuits. A similar inhibitory imbalance was found in the density of synaptic contacts with GABAergic neurons, which is five times higher in forward than in feedback circuits (Johnson and Burkhalter, 1996).
Feedback connections also differ physiologically from both thalamocortical and local horizontal pathways within area 17. Similar to forward connections, activation of thalamocortical inputs and local horizontal connections typically evoked hyperpolarizing IPSPs (Fig.7C,D). Unlike feedback connections, the synaptic organization in both of these pathways resembles that of forward connections (Peters and Feldman, 1976; Freund et al., 1985, 1989;Kisvàrday et al., 1986; Loewenstein and Somogyi, 1991; McGuire et al., 1991; Johnson and Burkhalter, 1996). It therefore seems that the feedback circuit has a unique organization in which synaptic inhibition is much weaker than in the canonical circuit (Douglas and Martin, 1991), the structure and function of which resemble the thalamocortical, horizontal, and forward circuits. As a consequence of the structural asymmetry between feedback and other characterized cortical connections, inhibition is imbalanced in interactions between feedback inputs and inputs from lower areas.
Unequal strength of synaptic inhibition
Recordings in the presence of the Cl− channel blocker DNDS (Singh et al., 1991) clearly showed that synaptic potentials in both forward and feedback pathways are affected (Fig.6B,C). Although DNDS presumably blocks a variety of different Cl− conductances (Mayer, 1985; Madison et al., 1986), local application of GABA demonstrated that DNDS completely blocked membrane hyperpolarization (Fig. 6D,E). This suggests that the effects on forward and feedback PSPs can be attributed to a partial blockade of GABAergic neurotransmission. The lower incidence of hyperpolarizing inhibition in the feedback, as compared with the forward pathway, therefore indicates that GABAergic inhibition is weaker in feedback than in forward circuits. Similar differences in the strength of inhibitory synaptic input have been observed in local circuits of rat hippocampus and neocortex (Chagnac-Amitai and Connors, 1989; Miles, 1990; Hirsch and Gilbert, 1991; Scharfman, 1992; Cauller and Connors, 1994). Studies in rat motor cortex indicate that such differences reflect the balance between EPSPs and IPSPs, which is determined primarily by the relative amplitude and timing of these PSPs (van Brederode and Spain, 1995).
EPSP and IPSP amplitudes
Feedback inputs to layer 2/3 of area 17 are ∼50% less numerous than forward inputs to LM (X. Jiang, R.R. Johnson, and A. Burkhalter, unpublished observations). This fits with our present observation that EPSP amplitudes evoked by feedback input are approximately one-half the size (50.3%) of those seen in the forward pathway. However, compared with the relative anatomical input strength of both pathways, mean IPSP amplitudes evoked by feedback inputs are much smaller and, when averaged across all cells recorded, amount to only 12.7% (Table 1, top row) of those evoked by forward inputs. This difference is qualitatively similar to that estimated from the slowing of EPSP decay in the presence of DNDS. Most importantly, it is comparable to the fivefold difference in synaptic input to interneurons seen between both pathways (Johnson and Burkhalter, 1996). Thus, the physiological inequality seems to be determined by a quantitative difference in the input to interneurons and not by the output strength of these cells. A similar conclusion was reached on the basis of the finding that pyramidal neurons in rat somatosensory cortex with small and large IPSPs receive equal numbers of inhibitory inputs (White et al., 1994).
Interneurons respond best to trains of spikes, and their discharge is related directly to the input strength (Thomson et al., 1993). This suggests that IPSPs are larger in forward than in feedback circuits, because inhibitory neurons receive the greater number of interareal inputs (Johnson and Burkhalter, 1996).
EPSP/IPSP timing
Experiments in cat motor cortex have demonstrated that hyperpolarizing inhibition results when large IPSPs are slower than EPSPs and outlast the depolarizing response (van Brederode and Spain, 1995). In contrast, inhibition merely creates an abbreviated EPSP when IPSPs are small and have a time course that coincides with the monosynaptic EPSP. Temporal differences in IPSP waveforms may arise from different types of interneurons with distinct axonal projection patterns and/or physiological properties. For example, inhibitory inputs to dendrites may produce slower IPSPs than axosomatic inputs (Spruston et al., 1993), particularly if inputs are provided by late-spiking interneurons (Kawaguchi, 1995). Studies in the hippocampus support the idea of different interneurons in forward and feedback circuits. They show that bistratified interneurons, supplying axodendritic inputs, generate longer-lasting IPSPs than basket cells that terminate on proximal dendrites and somata (Buhl et al., 1994; Sik et al., 1995). Interneurons with similar morphological and molecular characteristics also have been identified in the neocortex (DeFelipe et al., 1986; Somogyi and Soltesz, 1986; DeFelipe and Fairen, 1988;DeFelipe et al., 1989, 1990, 1992; Kawaguchi, 1995). Thus, it is tempting to speculate that feedback connections preferentially synapse with basket cells, whereas forward circuits rely on double-bouquet or neurogliaform cells. Measurements of IPSP kinetics in rat somatosensory cortex indicate that this anatomical disparity could account for differences in the time to peak of up to 7 msec (Benardo, 1994).
Functional significance
Receptive field properties of neurons in V1 can be modulated both by stimuli presented outside the classical receptive field (Knierim and Van Essen, 1992; Grinvald et al., 1994; Kapadia et al., 1995; Lamme, 1995) and by visual attention (Motter, 1993; Press et al., 1994). Each of these reports suggests that feedback connections from higher cortical areas supply the requisite excitatory and inhibitory influences. Indeed, preliminary evidence from monkey visual cortex shows that inactivation of feedback input to V1 and V2 selectively eliminates modulatory interactions between receptive field center and surround (James et al., 1995). It is possible that these effects are caused by the imbalance in synaptic inhibition between forward and feedback pathways or between thalamocortical and feedback connections.
In considering the effects of this imbalance on neuronal responses, it is important to recall that weak stimulation of both forward and feedback pathways evoked depolarizing PSPs and failed to activate hyperpolarizing IPSPs (Fig. 4). This suggests that during weak visual stimulation coincident feedback input to area 17 contributes additional depolarization that enhances striate cortical responses. Strong stimuli, on the other hand, activate EPSPs and IPSPs in both forward and feedback circuits. As a result, summed PSPs elicited by converging forward and feedback inputs may show smaller and more transient depolarizing responses than in the absence of feedback input (Hirsch, 1995). This behavior is reminiscent of that seen in a model of interactions between receptive field center and surround (Stemmler et al., 1995). It suggests that the net effect of feedback input on the excitability of cortical neurons is stimulus-dependent. Thus, to perform double duty and to provide both enhancing and suppressive influences over a broad range of stimulation conditions, reciprocal circuits operate with different activation thresholds for EPSPs and IPSPs and imbalanced inhibition.
In striate cortex, the earliest modulatory effects attributed to feedback connections have been observed within 10 msec of the onset of the stimulus (Knierim and Van Essen, 1992). This fits approximately the time to peak for monosynaptic feedback PSPs (Fig. 7A). However, many contextual and attentional effects occur with longer delays of 20–100 msec (Knierim and Van Essen, 1992; Motter, 1994;Lamme, 1995). These effects may require sustained bursts of feedback activity that lead to temporal summation of EPSPs and increased depolarization (van Brederode and Spain, 1995). Under these conditions striate cortical excitability may be amplified for 80–100 msec so that weak stimuli elicit a more vigorous response. However, because excitation and inhibition covary in cortical spike activity (Ferster, 1986), it will depend on the nature of the stimulus whether feedback inputs from extrastriate cortex lead to an enhancement or a suppression of striate cortical responses.
Footnotes
This work was supported by National Institutes of Health Grant EY05935. We thank Jeanne Nerbonne, Randy Johnson, Luciano Domenici, and Michael Sesma for valuable discussions throughout the course of this study. We especially thank Jeanne Nerbonne, David Van Essen, and Yuri Gonchar for their insightful comments on this manuscript.
Correspondence should be addressed to Dr. Andreas Burkhalter, Department of Anatomy and Neurobiology, Washington University School of Medicine, P.O. Box 8101, 660 South Euclid Avenue, St. Louis, MO 63110.
REFERENCES
- 1.Aghajanian GK, Rasmussen K. Intracellular studies in the facial nucleus illustrating a simple method for obtaining viable motoneurons in adult brain slices. Synapse. 1989;3:331–338. doi: 10.1002/syn.890030406. [DOI] [PubMed] [Google Scholar]
- 2.Allman J, Miezin F, McGuinness E. Stimulus-specific responses from beyond the classical receptive field: neurophysiological mechanisms for local–global comparisons in visual neurons. Annu Rev Neurosci. 1985;8:407–430. doi: 10.1146/annurev.ne.08.030185.002203. [DOI] [PubMed] [Google Scholar]
- 3.Asanuma H, Sakata H. Functional organization of a cortical efferent system examined with focal depth stimulation in cats. J Neurophysiol. 1967;30:35–54. [Google Scholar]
- 4.Benardo LS. Separate activation of fast and slow inhibitory postsynaptic potentials in rat neocortex in vitro. J Physiol (Lond) 1994;476:203–215. doi: 10.1113/jphysiol.1994.sp020124. [DOI] [PMC free article] [PubMed] [Google Scholar]
- 5.Buhl EH, Halasy K, Somogyi P. Diverse sources of hippocampal unitary inhibitory postsynaptic potentials and the number of synaptic release sites. Nature. 1994;368:823–828. doi: 10.1038/368823a0. [DOI] [PubMed] [Google Scholar]
- 6.Cauller LJ, Connors BW. Synaptic physiology of horizontal afferents to layer I in slices of rat SI neocortex. J Neurosci. 1994;14:751–762. doi: 10.1523/JNEUROSCI.14-02-00751.1994. [DOI] [PMC free article] [PubMed] [Google Scholar]
- 7.Chagnac-Amitai Y, Connors BW. Synchronized excitation and inhibition driven by intrinsically bursting neurons in neocortex. J Neurophysiol. 1989;62:1149–1162. doi: 10.1152/jn.1989.62.5.1149. [DOI] [PubMed] [Google Scholar]
- 8.Connors BW, Malenka RC, Silva LR. Two inhibitory postsynaptic potentials and GABAA and GABAB receptor-mediated responses in neocortex of rat and cat. J Physiol (Lond) 1988;406:443–468. doi: 10.1113/jphysiol.1988.sp017390. [DOI] [PMC free article] [PubMed] [Google Scholar]
- 9.Coogan TA, Burkhalter A. Hierarchical organization of areas in rat visual cortex. J Neurosci. 1993;13:3749–3772. doi: 10.1523/JNEUROSCI.13-09-03749.1993. [DOI] [PMC free article] [PubMed] [Google Scholar]
- 10.DeFelipe J, Fairen A. Synaptic connections of an interneuron with axonal arcades in the cat visual cortex. J Neurocytol. 1988;17:313–323. doi: 10.1007/BF01187854. [DOI] [PubMed] [Google Scholar]
- 11.DeFelipe J, Jones EG. High resolution light and electron microscopic immunocytochemistry of co-localized GABA and calbindin D-28K in somata of double-bouquet cell axons of monkey somatosensory cortex. Eur J Neurosci. 1992;4:46–60. doi: 10.1111/j.1460-9568.1992.tb00108.x. [DOI] [PubMed] [Google Scholar]
- 12.DeFelipe J, Hendry SHC, Jones EG. A correlative electron microscopic study of basket cells and large GABAergic neurons in the monkey sensory–motor cortex. Neuroscience. 1986;17:991–1009. doi: 10.1016/0306-4522(86)90075-8. [DOI] [PubMed] [Google Scholar]
- 13.DeFelipe J, Hendry SHC, Jones EG. Visualization of chandelier cell axons by parvalbumin immunoreactivity in monkey cerebral cortex. Proc Natl Acad Sci USA. 1989;86:2093–2097. doi: 10.1073/pnas.86.6.2093. [DOI] [PMC free article] [PubMed] [Google Scholar]
- 14.DeFelipe J, Hendry SHC, Hashikawa T, Molinari M, Jones EG. A microcolumnar structure of monkey cerebral cortex revealed by immunocytochemical studies of double-bouquet cell axons. Neuroscience. 1990;37:655–673. doi: 10.1016/0306-4522(90)90097-n. [DOI] [PubMed] [Google Scholar]
- 15.Desimone R, Duncan J. Neural mechanisms of selective visual attention. Annu Rev Neurosci. 1995;18:193–222. doi: 10.1146/annurev.ne.18.030195.001205. [DOI] [PubMed] [Google Scholar]
- 16.Domenici L, Harding GW, Burkhalter A. Patterns of synaptic activity in forward and feedback pathways within rat visual cortex. J Neurophysiol. 1995;74:2649–2664. doi: 10.1152/jn.1995.74.6.2649. [DOI] [PubMed] [Google Scholar]
- 17.Douglas RJ, Martin KAC. A functional microcircuit for cat visual cortex. J Physiol (Lond) 1991;440:735–769. doi: 10.1113/jphysiol.1991.sp018733. [DOI] [PMC free article] [PubMed] [Google Scholar]
- 18.Ferster D. Orientation selectivity of synaptic potentials in neurons of cat primary visual cortex. J Neurosci. 1986;6:1284–1301. doi: 10.1523/JNEUROSCI.06-05-01284.1986. [DOI] [PMC free article] [PubMed] [Google Scholar]
- 19.Freund TF, Martin KAC, Whitteridge D. Innervation of cat visual area 17 and 18 by physiologically identified X- and Y-type thalamic afferents. I. Arborization patterns and quantitative distribution of postsynaptic elements. J Comp Neurol. 1985;242:263–274. doi: 10.1002/cne.902420208. [DOI] [PubMed] [Google Scholar]
- 20.Freund TF, Martin KAC, Soltez I, Somogyi P, Whitteridge D. Arborization patterns and postsynaptic targets of physiologically identified thalamocortical afferents in striate cortex of the macaque monkey. J Comp Neurol. 1989;289:315–336. doi: 10.1002/cne.902890211. [DOI] [PubMed] [Google Scholar]
- 21.Gilbert CD. Horizontal integration and cortical dynamics. Neuron. 1992;9:1–13. doi: 10.1016/0896-6273(92)90215-y. [DOI] [PubMed] [Google Scholar]
- 22.Gilbert CD, Wiesel TN. Clustered intrinsic connections in cat visual cortex. J Neurosci. 1983;3:1116–1133. doi: 10.1523/JNEUROSCI.03-05-01116.1983. [DOI] [PMC free article] [PubMed] [Google Scholar]
- 23.Gilbert CD, Wiesel TN. Columnar specificity of intrinsic horizontal and cortico-cortical connections in cat visual cortex. J Neurosci. 1989;9:2432–2442. doi: 10.1523/JNEUROSCI.09-07-02432.1989. [DOI] [PMC free article] [PubMed] [Google Scholar]
- 24.Gilbert CD, Wiesel TN. The influence of contextual stimuli on the orientation selectivity of cells in primary visual cortex of the cat. Vision Res. 1990;30:1689–1701. doi: 10.1016/0042-6989(90)90153-c. [DOI] [PubMed] [Google Scholar]
- 25.Grinvald A, Lieke EE, Frostig RD, Hildesheim R. Cortical point-spread function and long-range lateral interactions revealed by real-time optical imaging of macaque monkey primary visual cortex. J Neurosci. 1994;14:2545–2568. doi: 10.1523/JNEUROSCI.14-05-02545.1994. [DOI] [PMC free article] [PubMed] [Google Scholar]
- 26.Hestrin S. Different glutamate receptor channels mediate fast excitatory synaptic currents in inhibitory and excitatory cortical neurons. Neuron. 1993;11:1083–1091. doi: 10.1016/0896-6273(93)90221-c. [DOI] [PubMed] [Google Scholar]
- 27.Hirsch JA. Synaptic integration in layer IV of the ferret striate cortex. J Physiol (Lond) 1995;483:183–199. doi: 10.1113/jphysiol.1995.sp020577. [DOI] [PMC free article] [PubMed] [Google Scholar]
- 28.Hirsch JA, Gilbert CD. Synaptic physiology of horizontal connections in the cat’s visual cortex. J Neurosci. 1991;11:1800–1809. doi: 10.1523/JNEUROSCI.11-06-01800.1991. [DOI] [PMC free article] [PubMed] [Google Scholar]
- 29.James AC, Hupé J-M, Lomber SL, Payne B, Girard P, Bullier J. Feedback connections contribute to center-surround interactions in neurons of monkey areas V1 and V2. Soc Neurosci Abstr. 1995;21:904. [Google Scholar]
- 30.Johnson RR, Burkhalter A. Microcircuitry of forward and feedback connections between area 17 and extrastriate area LM in rat visual cortex. J Comp Neurol. 1996;367:1–16. doi: 10.1002/(SICI)1096-9861(19960506)368:3<383::AID-CNE5>3.0.CO;2-1. [DOI] [PubMed] [Google Scholar]
- 31.Kapadia MK, Ito M, Gilbert CD, Westheimer G. Improvement in visual sensitivity by changes in local context: parallel studies in human observers and in V1 of alert monkeys. Neuron. 1995;15:843–856. doi: 10.1016/0896-6273(95)90175-2. [DOI] [PubMed] [Google Scholar]
- 32.Kawaguchi Y. Physiological subgroups of nonpyramidal cells with specific morphological characteristics in layer II/III of rat frontal cortex. J Neurosci. 1995;15:2638–2655. doi: 10.1523/JNEUROSCI.15-04-02638.1995. [DOI] [PMC free article] [PubMed] [Google Scholar]
- 33.Kisvàrday ZF, Martin KAC, Freund TF, Magloczky Z, Whitteridge D, Somogyi P. Synaptic targets of HRP-filled layer III pyramidal cells in cat striate cortex. Exp Brain Res. 1986;64:541–552. doi: 10.1007/BF00340492. [DOI] [PubMed] [Google Scholar]
- 34.Knierim JJ, Van Essen DC. Neuronal responses to static texture patterns in area V1 of the alert macaque monkey. J Neurophysiol. 1992;67:961–979. doi: 10.1152/jn.1992.67.4.961. [DOI] [PubMed] [Google Scholar]
- 35.Lamme VA. The neurophysiology of figure–ground segregation in primary visual cortex. J Neurosci. 1995;15:1605–1615. doi: 10.1523/JNEUROSCI.15-02-01605.1995. [DOI] [PMC free article] [PubMed] [Google Scholar]
- 36.Loewenstein PR, Somogyi P. Synaptic organization of cortico-cortical connections from the primary visual cortex to the posteromedial lateral suprasylvian visual area in the cat. J Comp Neurol. 1991;310:253–266. doi: 10.1002/cne.903100209. [DOI] [PubMed] [Google Scholar]
- 37.Luhmann HJ, Prince DA. Postnatal maturation of the GABAergic system in rat neocortex. J Neurophysiol. 1991;65:247–263. doi: 10.1152/jn.1991.65.2.247. [DOI] [PubMed] [Google Scholar]
- 38.Madison DV, Malenka DC, Nicoll RA. Phorbol esters block a voltage-sensitive chloride current in hippocampal pyramidal cells. Nature. 1986;321:695–697. doi: 10.1038/321695a0. [DOI] [PubMed] [Google Scholar]
- 39.Maunsell JHR. The brain’s visual world: representation of visual targets in cerebral cortex. Science. 1995;270:764–769. doi: 10.1126/science.270.5237.764. [DOI] [PubMed] [Google Scholar]
- 40.Mayer ML. A calcium-activated chloride current generates the after-depolarization of rat sensory neurones in culture. J Physiol (Lond) 1985;364:217–239. doi: 10.1113/jphysiol.1985.sp015740. [DOI] [PMC free article] [PubMed] [Google Scholar]
- 41.McCormick DA, Connors BA, Lighthall JW. Comparative electrophysiology of pyramidal and sparsely spiny stellate neurons of the neocortex. J Neurophysiol. 1985;54:782–806. doi: 10.1152/jn.1985.54.4.782. [DOI] [PubMed] [Google Scholar]
- 42.McDonald CT, Burkhalter A. Organization of long-range inhibitory connections within rat visual cortex. J Neurosci. 1993;13:768–781. doi: 10.1523/JNEUROSCI.13-02-00768.1993. [DOI] [PMC free article] [PubMed] [Google Scholar]
- 43.McGuire BA, Gilbert CD, Rivlin PK, Wiesel TN. Targets of horizontal connections in macaque primary visual cortex. J Neurosci. 1991;305:370–392. doi: 10.1002/cne.903050303. [DOI] [PubMed] [Google Scholar]
- 44.Mignard M, Malpeli JG. Paths of information flow through visual cortex. Science. 1991;251:1249–1251. doi: 10.1126/science.1848727. [DOI] [PubMed] [Google Scholar]
- 45.Miles R. Variations in strength of inhibitory synapses in the CA3 region of guinea-pig hippocampus in vitro. J Physiol (Lond) 1990;431:659–676. doi: 10.1113/jphysiol.1990.sp018353. [DOI] [PMC free article] [PubMed] [Google Scholar]
- 46.Miller B, Chou L, Finlay BL. The early development of thalamocortical and corticothalamic projections. J Comp Neurol. 1993;226:16–41. doi: 10.1002/cne.903350103. [DOI] [PubMed] [Google Scholar]
- 47.Montero VM. Retinotopy of cortical connections between striate cortex and extrastriate visual areas in the rat. Exp Brain Res. 1993;94:1–15. doi: 10.1007/BF00230466. [DOI] [PubMed] [Google Scholar]
- 48.Motter BC. Focal attention produces spatially selective processing in visual cortical areas V1, V2, and V4 in the presence of competing stimuli. J Neurophysiol. 1993;70:909–919. doi: 10.1152/jn.1993.70.3.909. [DOI] [PubMed] [Google Scholar]
- 49.Motter BC. Neural correlates of feature-selective memory and pop-out in extrastriate area V4. J Neurosci. 1994;14:2190–2199. doi: 10.1523/JNEUROSCI.14-04-02190.1994. [DOI] [PMC free article] [PubMed] [Google Scholar]
- 50.Nelson JI, Frost BJ. Orientation-selective inhibition from beyond the classic receptive field. Brain Res. 1985;139:359–365. doi: 10.1016/0006-8993(78)90937-x. [DOI] [PubMed] [Google Scholar]
- 51.Orban GAB, Gulyas B, Vogels R. Influence of a moving textured background on direction selectivity of cat striate cortex. J Neurophysiol. 1987;57:1792–1812. doi: 10.1152/jn.1987.57.6.1792. [DOI] [PubMed] [Google Scholar]
- 52.Peters A, Feldman ML. The projection of the lateral geniculate nucleus to area 17 of the rat cerebral cortex. I. General description. J Neurocytol. 1976;5:63–84. doi: 10.1007/BF01176183. [DOI] [PubMed] [Google Scholar]
- 53.Peters A, Kara DA. The neuronal composition of area 17 of rat visual cortex. II. The nonpyramidal cells. J Comp Neurol. 1985;234:242–263. doi: 10.1002/cne.902340209. [DOI] [PubMed] [Google Scholar]
- 54.Press WA, Knierim JJ, Van Essen DC. Neuronal correlates of attention to texture patterns in macaque striate cortex. Soc Neurosci Abstr. 1994;20:838. [Google Scholar]
- 55.Rockland KS, Virga A. Terminal arbors of individual “feedback” axons projecting from area V2 to V1 in the macaque monkey: a study using immunohistochemistry of anterogradely transported Phaseolus vulgaris-leucoagglutinin. J Comp Neurol. 1989;285:54–72. doi: 10.1002/cne.902850106. [DOI] [PubMed] [Google Scholar]
- 56.Salin P-A, Girard P, Bullier J. Visuotopic organization of corticocortical connections in the visual system. Prog Brain Res. 1993;95:169–178. doi: 10.1016/s0079-6123(08)60367-2. [DOI] [PubMed] [Google Scholar]
- 57.Sandell JH, Schiller PH. Effect of cooling area 18 on striate cortex cells in the squirrel monkey. J Neurophysiol. 1982;48:38–48. doi: 10.1152/jn.1982.48.1.38. [DOI] [PubMed] [Google Scholar]
- 58.Scharfman HE. Blockade of excitation reveals inhibition of dentate spiny hilar neurons recorded in rat hippocampal slices. J Neurophysiol. 1992;68:978–984. doi: 10.1152/jn.1992.68.3.978. [DOI] [PMC free article] [PubMed] [Google Scholar]
- 59.Shipp S, Zeki S. The organization of connections between areas V5 and V1 in macaque monkey. Eur J Neurosci. 1989a;1:309–331. doi: 10.1111/j.1460-9568.1989.tb00798.x. [DOI] [PubMed] [Google Scholar]
- 60.Shipp S, Zeki S. The organization of connections between areas V5 and V2 in macaque visual cortex. Eur J Neurosci. 1989b;1:333–354. doi: 10.1111/j.1460-9568.1989.tb00799.x. [DOI] [PubMed] [Google Scholar]
- 61.Sik A, Penttonen M, Ylinen A, Buzsaki G. Hippocampal CA1 interneurons: an in vivo intracellular labeling study. J Neurosci. 1995;15:6651–6665. doi: 10.1523/JNEUROSCI.15-10-06651.1995. [DOI] [PMC free article] [PubMed] [Google Scholar]
- 62.Singh AK, Afink GB, Venglarik CJ, Wang R, Bridges RJ. Colonic Cl channel blockade by three classes of compounds. Am J Physiol. 1991;261:C51–C63. doi: 10.1152/ajpcell.1991.261.1.C51. [DOI] [PubMed] [Google Scholar]
- 63.Sommers DC, Nelson SB, Sur M. An emergent model of orientation selectivity in cat visual cortical simple cells. J Neurosci. 1995;15:5448–5465. doi: 10.1523/JNEUROSCI.15-08-05448.1995. [DOI] [PMC free article] [PubMed] [Google Scholar]
- 64.Somogyi P, Soltesz I. Immunogold demonstration of GABA in synaptic terminals of intracellularly recorded, horseradish peroxidase-filled basket cells and clutch cells in the cat’s visual cortex. Neuroscience. 1986;19:1051–1065. doi: 10.1016/0306-4522(86)90122-3. [DOI] [PubMed] [Google Scholar]
- 65.Spruston N, Jaffe DB, Williams SH, Johnston D. Voltage- and space-clamp errors associated with the measurement of electrotonically remote synaptic events. J Neurophysiol. 1993;70:781–802. doi: 10.1152/jn.1993.70.2.781. [DOI] [PubMed] [Google Scholar]
- 66.Stemmler M, Usher M, Niebur E. Lateral interactions in primary visual cortex: a model bridging physiology and psychophysics. Science. 1995;269:1877–1880. doi: 10.1126/science.7569930. [DOI] [PubMed] [Google Scholar]
- 67.Stoney SD, Thompson WD, Asanuma H. Excitation of pyramidal tract cells by intracortical microstimulation: effective extent of stimulating current. J Neurophysiol. 1968;31:659–669. doi: 10.1152/jn.1968.31.5.659. [DOI] [PubMed] [Google Scholar]
- 68.Sutor B, Hablitz JJ. EPSPs in rat neocortical neurons in vitro. I. Electrophysiological evidence for two distinct EPSPs. J Neurophysiol. 1989;61:621–634. doi: 10.1152/jn.1989.61.3.607. [DOI] [PubMed] [Google Scholar]
- 69.Thomas HC, Espinoza SG. Relationships between interhemispheric cortical connections and visual areas in hooded rats. Brain Res. 1987;417:214–224. doi: 10.1016/0006-8993(87)90445-8. [DOI] [PubMed] [Google Scholar]
- 70.Thomson AM, Deuchars J. Temporal and spatial properties of local circuits in neocortex. Trends Neurosci. 1994;17:119–126. doi: 10.1016/0166-2236(94)90121-x. [DOI] [PubMed] [Google Scholar]
- 71.Thomson AM, Deuchars J, West DC. Single axon excitatory postsynaptic potentials in neocortical interneurons exhibit pronounced paired-pulse facilitation. Neuroscience. 1993;54:347–360. doi: 10.1016/0306-4522(93)90257-g. [DOI] [PubMed] [Google Scholar]
- 72.van Brederode JFM, Spain WJ. Differences in inhibitory synaptic input between layer II-III and layer V neurons of the cat neocortex. J Neurophysiol. 1995;74:1149–1166. doi: 10.1152/jn.1995.74.3.1149. [DOI] [PubMed] [Google Scholar]
- 73.White EL, Amitai Y, Gutnick MJ. A comparison of synapses onto the somata of intrinsically bursting and regular spiking neurons in layer V of rat SmI cortex. J Comp Neurol. 1994;342:1–14. doi: 10.1002/cne.903420102. [DOI] [PubMed] [Google Scholar]