Abstract
Angiotensin II (Ang II) stimulates norepinephrine transporter (NET) and tyrosine hydroxylase (TH) in the neurons, but the signal transduction mechanism of this neuromodulation is not understood. Treatment of neuronal cultures of hypothalamus-brainstem with Ang II resulted in a time- and dose-dependent activation of Ras, Raf-1, and mitogen-activated protein kinase. This activation was mediated by the interaction of Ang II with the AT1 receptor subtype and was associated with the redistribution of AT1 receptor with Ras and Raf-1 on the neuronal membrane. Treatment with antisense oligonucleotide (AON) to mitogen-activated protein kinase decreased mitogen-activated protein kinase immunoreactivity by 70% and attenuated Ang II stimulation of c-fos, NET, and TH mRNA levels. This demonstrates that induction of these genes requires mitogen-activated protein kinase activation by Ang II. In contrast, AON to mitogen-activated protein kinase failed to inhibit Ang II stimulation of plasminogen activator inhibitor-1 mRNA levels. These results suggest that AT1 receptors are coupled to a Ras-Raf-1 mitogen-activated protein kinase signal transduction pathway that is responsible for stimulation of NET and TH, two neuromodulatory actions of Ang II in the brain.
Keywords: Ras, Raf-1, MAP kinase, angiotensin II, neurons, neuronal cultures, antisense, brain AT1 receptor, norepinephrine transporter, tyrosine hydroxylase, mRNA
Angiotensin II (Ang II) exerts diverse physiological actions unique to both the periphery and the brain. In addition to its potent vasoconstrictor activity, it stimulates aldosterone secretion, regulates fluid balance, and plays an important role in cardiac hypertrophy, tissue remodeling, and growth of vascular smooth muscle cells in the periphery (Peach, 1981; Geisterfer et al., 1988; Dostal and Baker, 1992; Saxena, 1992). Ang II is a neuromodulator in the brain and regulates sympathetic activity, synthesis, uptake, and release of catecholamines; regulates release of vasopressin; and modulates baroreceptor reflex (Phillips, 1987; Saavedra, 1992;Steckelings et al., 1992; Timmermans et al., 1993; Raizada et al., 1994; Wright and Harding, 1994). These diverse actions of Ang II are mediated through its interaction with a single class of Ang II receptors, AT1 receptor subtype (Dostal and Baker, 1992; Steckelings et al., 1992; Sumners and Raizada, 1993;Timmermans et al., 1993; Raizada et al., 1994). The question as to how one receptor subtype could be responsible for so many diverse physiological actions of Ang II has been the focus of intense investigation during the last several years. It has been suggested that distinct signal transduction pathways linked to the AT1 receptor in many tissues may hold the key to these diverse actions of Ang II. This hypothesis has gained significant momentum since cloning of the AT1 receptor was reported (Murphy et al., 1991; Sasaki et al., 1991). The AT1 receptor belongs to the G-protein-coupled-receptor superfamily and contains seven transmembrane serpentine regions with a distinct cytoplasmic tail (Inagami et al., 1993). Because G-protein-coupled receptors activate intracellular second messenger proteins by the mechanisms involving phosphorylation, attempts have been made to identify similar mechanisms for Ang II actions (Molloy et al., 1993; Bhat et al., 1994; Marrero et al., 1995;Sadoshima et al., 1995). The observations indicate that the growth-promoting actions of Ang II involve the phospholipase Cγ/JAK/STAT signaling pathway.
Despite these observations implicating JAK/STAT pathway in the growth and tissue remodeling actions of Ang II, very little is known regarding the signal transduction pathways involved in the neuromodulatory actions of Ang II in the brain (Sumners et al., 1995). In view of this gap in our knowledge and the fact that the AT1receptor plays a key role in the central control of blood pressure (Saavedra, 1992; Steckelings et al., 1992; Raizada et al., 1994; Wright and Harding, 1994), we decided to investigate the signal transduction mechanism involved in the Ang II regulation of norepinephrine transporter (NET) and tyrosine hydroxylase (TH) genes. Neuronal cells from the hypothalamus-brainstem of 1-d-old rats in primary culture were chosen for the study because (1) they express functional AT1 receptors that are coupled to the stimulatory actions of Ang II on the uptake, synthesis, and release of norepinephrine (NE) (Sumners and Raizada, 1993; Raizada et al., 1994), and (2) the neurons from the spontaneously hypertensive (SH) rat brain express higher levels of AT1 receptors and a parallel increase in the neuromodulatory action of Ang II (Raizada et al., 1984; Sumners and Raizada, 1986; Ding et al., 1990; Yang et al., 1991; Raizada et al., 1993; Raizada et al., 1994), a situation compatible with hyperactive brain Ang II in vivo. Thus, neuronal culture presents an excellent in vitro model to investigate the AT1 receptor signaling mechanism in the normal rat brain and the potential to compare this in the hypertensive rat brain. The data presented in this study show that the interaction of Ang II with the neuronal AT1receptor initiates a cascade of cellular events involving Ras, Raf-1, and MAP kinase that ultimately leads to the stimulation of the expression of NET and TH genes.
MATERIALS AND METHODS
One-day-old Wistar Kyoto rats were obtained from our breeding colony, which originated from Harlan Sprague–Dawley (Indianapolis, IN). DMEM, plasma-derived horse serum (PDHS), and 1× crystal trypsin were from Central Biomedia (Irwin, MO). Phosphate-free DMEM was purchased from Life Technologies (Grand Island, NY). [32P]-Orthophosphate (1 mCi = 37 MBq), [γ-32P]ATP (3000 Ci/mmol), [α-32P]dCTP (3000 Ci/mmol),l-[14C(U)]tyrosine (502 mCi/mmol), and chemiluminescence assay reagents were from Dupont/NEN (Boston, MA). Nitrocellulose membranes were from Micron Separations (Westboro, MA). Ang II and polyethyleneimine-cellulose thin-layer plates were purchased from Sigma (St. Louis, MO). Losartan potassium (Dup753) was a gift from DuPont/Merck (Wilmington, DE). PD123319 was from RBI (Natick, MA), and the PCR kit containing Taq DNA polymerase was purchased from Perkin-Elmer Cetus (Norwalk, CT). Superscript RNase H−, reverse transcriptase (RT), and deoxynucleotide mixture were from Life Technologies. Oligo-dT was from Promega (Madison, WI), and Dynal beads and other reagents for poly(A+) RNA isolation were from Dynal (Lake Success, NY). Anti-Ras, anti-Raf-1, anti-MAP kinase [anti-ERK-2 (C-14)], and anti-AT1 receptor polyclonal antibodies were purchased from Santa Cruz Biotechnology (Santa Cruz, CA), and an anti-rat MAP kinase polyclonal antibody (erk-I-III) was from Upstate Biotechnology (Lake Placid, NY). In addition, polyclonal antibodies to AT1 receptor prepared in our group (Zelezna et. al., 1992) were also used. All other reagents were purchased from Fisher Scientific (Pittsburgh, PA) and were the highest quality available.
Primers for c-fos, plasminogen activator inhibitor-1 (PAI-1), NET, TH, β-actin, and sense (SONs) and antisense oligonucleotides (AONs) for MAP kinase were synthesized in the DNA synthesis facility of the Interdisciplinary Center for Biotechnology Research, University of Florida, Gainesville. The sequences of these primers are listed as follows:
c-fos:
sense: 5′-AGGAGGGAGCTGACAGATA-3′
antisense: 5′-CCTGGCTCACATGCTACTA-3′
NET:
sense: 5′-CCGCATCCATGCTTCTGGCGCGGATGAA-3′
antisense: 5′-GGGCAGGCTCAGATGGCCAGCCAGTGTT-3′
TH:
sense: 5′-GGGATGGGAATGCTGTTCTCAAC-3′
antisense: 5′-CGAGAGGCATAGTTCCTGAGCTT-3′
PAI-1:
sense: 5′-GCTCCAGGATGCAGATGTCT-3′
antisense: 5′-GCTCTCGTTCACCTCGATCT-3′
MAP kinase:
SON: 5′-CGACTTGCTATCAAGAAAATC-3′
MAP kinase:
AON: 5′-GATTTTCTTGATAGCAACTCG-3′
Hypothalamus-brainstem neuronal cells in primary culture
Hypothalamus-brainstem areas of 1-d-old Wistar Kyoto normotensive rat brains were dissected, and brain cells were dissociated by trypsin (Raizada et al., 1984, 1993) and were plated onto poly-l-lysine precoated tissue culture 35 mm dishes (3 × 10⁶ cells/dish) or 100 mm dishes (2 × 10⁷/dish) in DMEM containing 10% PDHS and neuronal cultures established essentially as described previously (Raizada et al., 1984, 1993). They were allowed to grow for 15 d before experiments were begun. These cultures contained 85–90% neuronal cells and 10–15% astroglial cells (Raizada et. al., 1984, 1993).
Measurement of Ras, Raf-1, and MAP kinase activity
Analysis of Ras activation. Ratio of GTP-Ras over GTP-Ras plus GDP-Ras was used to determine the levels of activated Ras by Ang II in neuronal cultures essentially as described previously (Downward et al., 1990; Duronio et al., 1992). In brief, neuronal cultures established in 100 mm culture dishes were prelabeled with [32P]orthophosphate (2 mCi/dish) in phosphate-free DMEM for 1 hr at 37°C. After treatment with Ang II, cells were rinsed with ice-cold PBS, pH 7.4, suspended in the immunoprecipitation buffer (50 mm Tris-HCl, pH 7.4, 20 mm MgCl2, 150 mm NaCl, 0.5% Nonidet P-40, and 10 μg/ml aprotinin) for 10 min, and centrifuged at 3000 × g for 5 min. The supernatant was used to immunoprecipitate Ras with the use of anti-Ras polyclonal antibody agarose conjugated essentially as described previously (Downward et al., 1990; Duronio et al., 1992). The immunoprecipitate was washed twice with the immunoprecipitation buffer and twice with the washing buffer (50 mmTris-HCl, pH 7.4, 20 mmMgCl2, and 150 mm NaCl) and was suspended in 20 μl of 20 mm Tris-HCl, pH 7.4, 30 mm EDTA, 2% SDS, 0.5 mm GDP, and 0.5 mm GTP. The suspension was heated at 65°C for 5 min and centrifuged. The supernatant was spotted onto a polyethyleneimine-cellulose thin-layer plate and developed with 0.75 mKH2PO4, pH 3.4, followed by autoradiography. The radioactivity was quantitated with a UVP Image 5000 system (Ultra Violet Products, San Gabriel, CA). The percentage of Ras-GTP complex relative to the total amount of Ras was calculated, and the data were presented as percentage activated Ras (Downward et al., 1990; Duronio et al., 1992).
Measurement of Raf-1 kinase activation. Raf-1 kinase activation by Ang II was analyzed essentially as described previously (Ohmichi et al., 1992; Williams et al., 1992). Briefly, neuronal cells after Ang II treatment were lysed for 10 min in the lysis buffer (50 mm Tris, pH 7.4, 150 mmNaCl, 10% glycerol, 0.1% SDS, 0.5% sodium deoxycholate, 1% Triton X-100, 2 mm EDTA, 1 mmphenylmethylsulfonyl fluoride, 10 μg/ml aprotinin, and 100 μm sodium orthovanadate). The lysates were centrifuged at 10,000 × g for 5 min, and supernatants were used for immunoprecipitation with anti-Raf-1 antibody at 4°C for 1 hr (Ohmichi et al., 1992; Williams et al., 1992). Immune precipitates were resuspended in 20 μl of reaction buffer (20 mmHEPES, pH 7.4, 1 mm NaCl, and 5 mm MgCl2) containing 10 μCi [γ-32P]ATP (3000 Ci/mm). After 10 min at 24°C, reactions were stopped by the addition of Laemmli’s sample buffer, and proteins were subjected to SDS/PAGE followed by autoradiography. Quantitation of phosphorylated Raf-1 was performed by determination of observed density (OD) of radioactive bands of ∼74 KDa on an UVP Image 5000 system.
Measurement of MAP kinase activation. Neuronal cell lysates were prepared in the lysis buffer (25 mmTris-HCl, pH 7.4, 25 mm NaCl, 1% Triton X-100, 1% deoxycholic acid, 0.1% SDS, 1 mm sodium orthovanadate, 10 mm sodium fluoride, 10 mm sodium pyrophosphate, 0.5 mm EGTA, 1 mmphenylmethylsulfonyl fluoride, 10 μg/ml aprotinin, and 0.8 μg/ml leupeptin), and lysates were immunoprecipitated with anti-ERK-2 antibody agarose conjugated overnight at 4°C (Sadoshima et al., 1995). Immunoprecipitates were electrophoresed on a 10% SDS/PAGE containing 0.5 mg/ml myelin basic protein. After electrophoresis, SDS was removed by washing the gel with two changes of 20% 2-propanol in 50 mm Tris-HCl, pH 8.0, for 1 hr and then with two changes of 50 mm Tris-HCl, pH 8.0, containing 5 mm 2-mercaptoethanol for 1 hr. The enzyme was denatured by incubating the gel with two changes of 6 mol of guanidine hydrochloride for 1 hr and then renatured with three changes of 50 mm Tris HCl, pH 8.0, containing 0.04% Tween 40 and 5 mm 2-mercaptoethanol overnight at 4°C. The gel was then incubated with 40 mm HEPES, pH 8.0, containing 2 mm dithiothreitol, 10 mm MgCl2, 0.5 mm EGTA, 40 μm ATP, and 10 μCi [γ-32P]ATP (3000 Ci/mm), washed with a 5% trichloracetic acid solution containing 1% sodium pyrophosphate, dried, and subjected to autoradiography (Sadoshima et al., 1995).
Immunoblotting
Immunoblotting was used to identify the presence of Raf-1, P42, and P44 proteins (subtypes of MAP kinase) in neuronal cultures. Briefly, cell-free lysates were prepared as described above for Raf-1 or MAP kinase activation. Lysates were electrophoresed on 10% SDS/PAGE, and proteins were transferred to nitrocellulose membranes. Membranes were blocked by using 5% nonfat dry milk in TBST (20 mmTris-HCl, pH 8.0, 150 mm NaCl, and 0.05% Tween 20) for 1 hr followed by incubation for 1 hr at room temperature with rabbit anti-Raf-1 antibody or rabbit anti-erk-I-III antibody. Protein-bound antibody was detected by incubation of the membrane with horseradish peroxidase-labeled second antibody (Santa Cruz Biotechnology, Santa Cruz, CA) and enhanced chemiluminescence assay reagents. The bands recognized by the primary antibody were visualized by autoradiography. In other experiments, the following protocol was used to determine the co-precipitation of AT1receptors with Ras and Raf-1 with Ras. Cell lysates were immunoprecipitated by rabbit anti-AT1 receptor or anti-Ras antibody conjugated to agarose. Agarose beads were washed three times with 50 mm Tris-HCl, pH 8.0, 150 mm NaCl, and 0.1% Triton X-100 and suspended in the Laemmli’s sample buffer. Supernatant was electrophoresed in 10% SDS/PAGE, and separated proteins were transferred to nitrocellulose membrane. This was followed by immunoblotting with the use of rabbit anti-Ras or anti-Raf-1 antibody.
Immunocytochemical co-localization of Ras, Raf-1, and AT1 receptors
Neuronal cultures established in 35 mm dishes were rinsed with PBS, pH 7.4, and fixed in −10°C methanol for 5 min. After preincubation with fetal bovine serum for 30 min at 37°C to suppress nonspecific binding of the antibody, cells were incubated with a combination of rabbit anti-AT1 receptor and mouse anti-Ras, or a combination of Ras and rabbit anti-Raf antibodies at 1 μg/ml concentration in 1× PBS 0.5% bovine serum albumin solution (Zelezna et al., 1992; Phillips et al., 1993). After rinsing five times with PBS for 60 min at room temperature, cells were incubated for an additional 60 min at 37°C with a rhodamine-conjugated anti-rabbit IgG and FITC-conjugated anti-mouse IgG. The cells were processed for fluorescent microscopy as described elsewhere (Lu et al., 1996). The rhodamine staining representing AT1 receptor and Raf-1 and the FITC staining representing Ras were examined with the use of a confocal microscope. Data were collected by using a 40×/numerical Olympus IMT-2 inverted light microscope, and two-dimensional images were processed as described previously (Lu et al., 1996).
Treatment of neuronal cultures with MAP kinase AONs and SONs
AONs and SONs corresponding to a region for both P44 and P42 cDNA were synthesized. The oligonucleotides were made as phosphorothioate derivatives, which have been shown to enhance nuclease resistance and support RNase H cleavage of hybridizing RNA. Neuronal cultures established in 100 mm culture dishes for 10–15 d were treated with 1 μm AONs and SONs to MAP kinase dissolved in 5 μg/ml Lipofectin Reagent (Life Technologies) for 24–48 hr at 37°C. This was followed by incubation of cells with 100 nm Ang II for indicated time periods.
RT-PCR measurements of c-fos, NET, TH, PAI-1, and β-actin mRNA levels
The mRNA levels for c-fos, NET, TH, PAI-1, and β-actin were measured by RT-PCR essentially as described previously (Lu and Raizada, 1995; Lu et al., 1995). Validity of this procedure and optimal conditions for both RT and PCR reactions also have been established previously (Lu and Raizada, 1995; Lu et al., 1995). In brief, the procedure includes isolating poly(A+) RNA from neuronal cultures with the use of Dynal beads and running the RT reaction directly with the poly(A+)-Dynal-bead complex (Lu and Raizada, 1995; Lu et al., 1995). This is followed by using 5 μl of RT solution for PCR and specific primers for c-fos, NET, TH, PAI-1, or β-actin in separate tubes. Our previous studies have established that the PCR reaction is linear with the number of PCR cycles as well as with the RT reaction volumes, whether the PCR for c-fos, NET, PAI-1, and β-actin is carried out in a single tube or in separate tubes. Thus, we have used the PCR reactions for c-fos, NET PAI-1, TH, and β-actin in parallel tubes with the use of 5 μl RT reaction. PCR products were separated on a nondenaturing PAGE essentially as described previously (Lu et al., 1996). The gel was decasted, wrapped in a plastic bag, and exposed to an x-ray film overnight at −70°C. Bands representing PCR products on the x-ray film were scanned with the use of the UVP Imagestore 5000 system, and density of each PCR product was then quantitated by the SW 5000 Gel Analysis program.
Measurement of TH activity
TH activity in neuronal culture was measured as described previously (Park et al., 1990). In brief, triplicate 100 mm neuronal culture dishes were rinsed with PBS, pH 7.4, and cells were scraped and homogenized in 0.4 ml buffer (5 mmKH2PO4, pH 7.0, 0.2% Triton X-100). The supernatant was collected by centrifugation at 10,000 × g and was used for enzyme assay and determination of protein concentration. The assay mixture of 25 μl containing 300 mm sodium acetate, pH 5.8, 3 nml-tyrosine, 0.5 μCil-[14C(U)]tyrosine, 3 mm 6-methyl tetrahydropteridine in 420 mm β-mercaptoethanol, and 1 μl of catalose (1000 U) was added to 50 μl of enzyme solution (200 μg protein). The incubation was carried out at 30°C for 20 min. The reaction was stopped by addition of 1 ml of 0.4N perchloric acid containing 10 μg of l-3,4-dihydroxyphenylalanine (DOPA) and centrifuged at 2500 × g for 10 min. The supernatant was collected, and 6.5 ml of a mixture containing 5 vol of 5% disodium EDTA and 1.5 vol of 0.35 m KH2PO4 was added. After adjusting the pH to 8.6 with 1N NaOH, the solution was passed over an aluminum oxide column. The column was washed with 20 ml of H2O. 14C-DOPA was then eluted with 4 ml of 0.5N acetic acid, and radioactivity was counted. The TH activity was presented as nanomoles of DOPA per milligram of protein per minute.
Experimental groups and data analysis
Each experiment for the effect of Ang II on the activation of Ras, Raf-1, and MAP kinase was conducted in triplicate culture dishes. Cells in these dishes were derived from multiple brains of 1-d-old rats. Each experiment was repeated three times, unless indicated otherwise. TH activity also was determined with the use of the same number of cultures in triplicate experiments. For the analysis of mRNA levels, triplicate culture dishes were used for each data point and poly(A+) RNA was pooled. Each experiment was repeated three times unless indicated otherwise. Densities of PCR bands were quantitated, and data were presented as OD of the mean ± SE, derived from normalization with β-actin for equivalent loading (Lu et al., 1996). Comparisons between the control and experimental groups were made using one-way ANOVA and Dunnett’s tests with the use of Statistica software.
RESULTS
Effects of Ang II on Ras, Raf-1, and MAP kinase activation in neuronal cultures
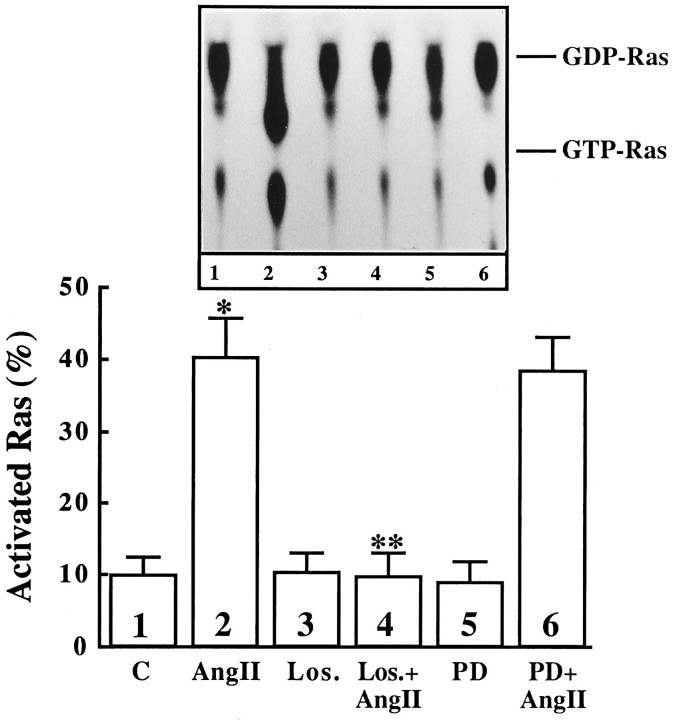
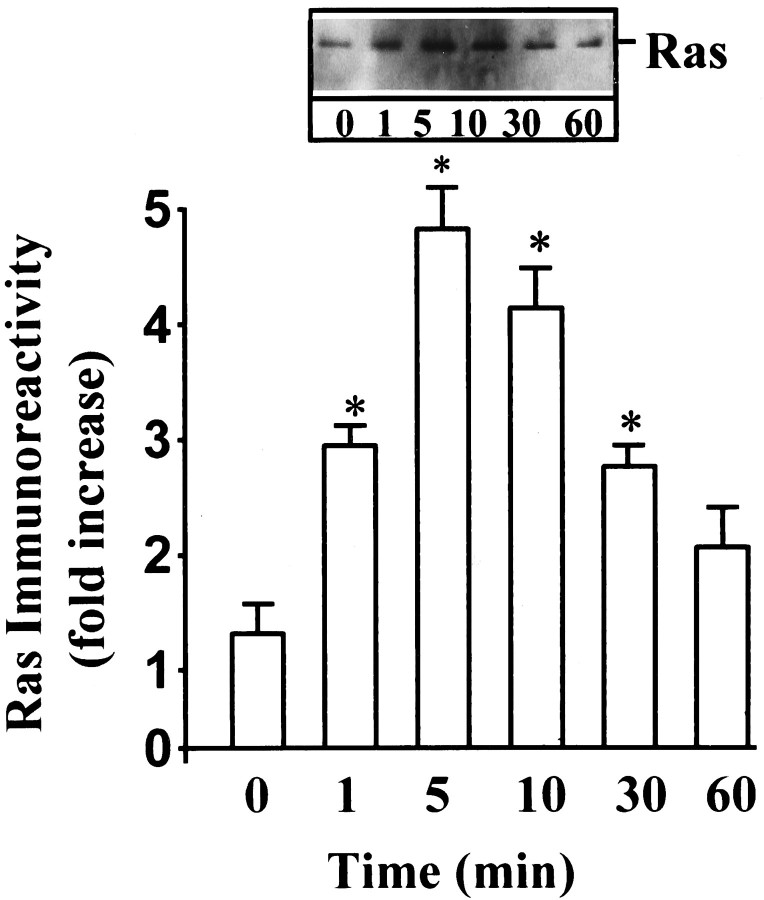
Incubation of neuronal cultures with Ang II resulted in the activation of Ras, as judged by an increase in the ratio of GTP-bound Ras to GDP-bound Ras. This activation was time-dependent and transient. Figure 1A shows that the maximal stimulation of ∼fourfold was observed in 5 min, followed by a gradual decrease that reached to control levels in 30 min. The stimulation was also concentration-dependent, and 10 nm Ang II provided a maximal 4.5-fold activation (Fig. 1B). The stimulation was blocked by 10 μm losartan, the AT1 receptor-specific antagonist, and not by PD 123319, the AT2 receptor-specific antagonist (Fig. 2). These observations showed that Ang II stimulation of Ras activation is mediated by AT1receptor subtype.
Fig. 1.
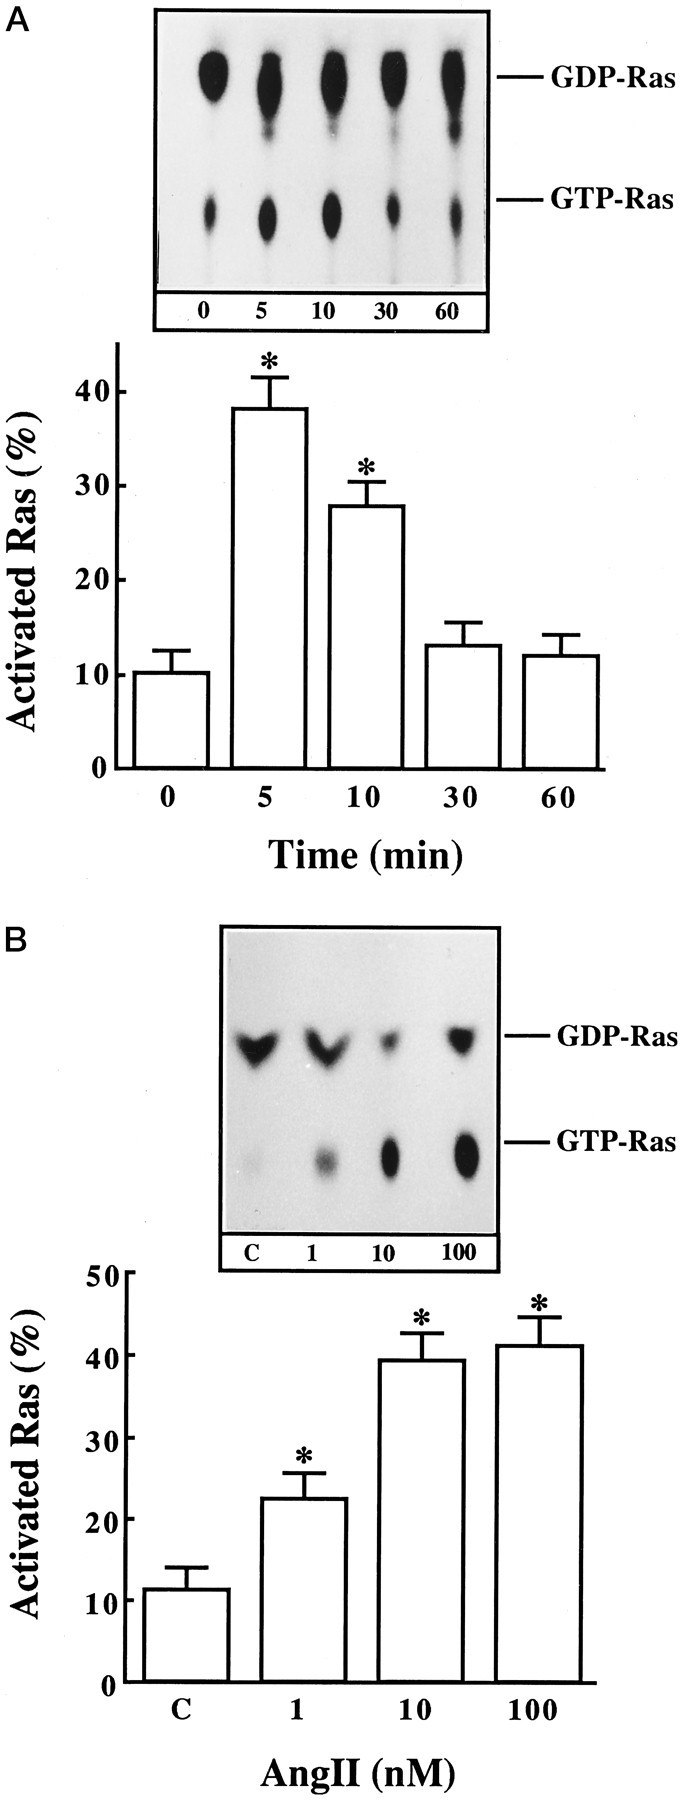
The effect of Ang II on activation of Ras in neuronal cultures. Neuronal cultures were incubated with 100 nm Ang II for indicated time periods (A) or with indicated Ang II concentrations for 5 min (B). Levels of GTP-bound Ras and GDP-bound Ras were determined essentially as described in Materials and Methods. Data are presented as activated Ras, which was calculated as a percentage from a ratio of GTP-Ras over GTP-Ras + GDP-Ras. They are mean ± SE (n = 3). Asterisks indicate significantly different from zero time or control (p < 0.05).Insets in both A and B show representative autoradiograms.
Fig. 2.
The effect of Ang II receptor specificity on Ang II stimulation of activation of Ras in neuronal cultures. Neuronal cells established in primary culture for 15 d were incubated with 100 nm Ang II for 5 min. Losartan (10 μm) for AT1receptor-specific and PD123319 (10 μm) for AT2-receptor-specific antagonists were used in the absence or presence of Ang II. Top, Representative autoradiogram. Bottom, Data from three experiments are presented as mean ± SE. Asterisk indicates significantly different from control (p < 0.05); double asterisk indicates significantly different from Ang II-treated neurons (p < 0.05).
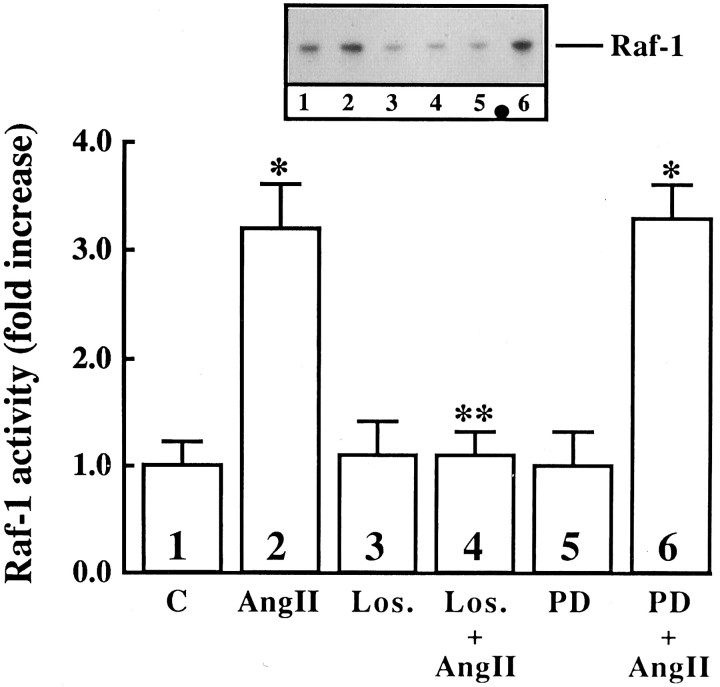
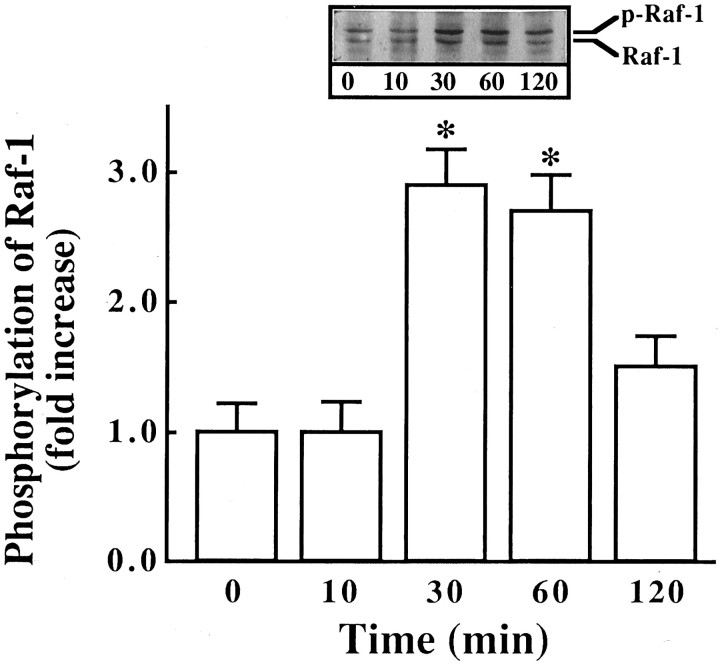
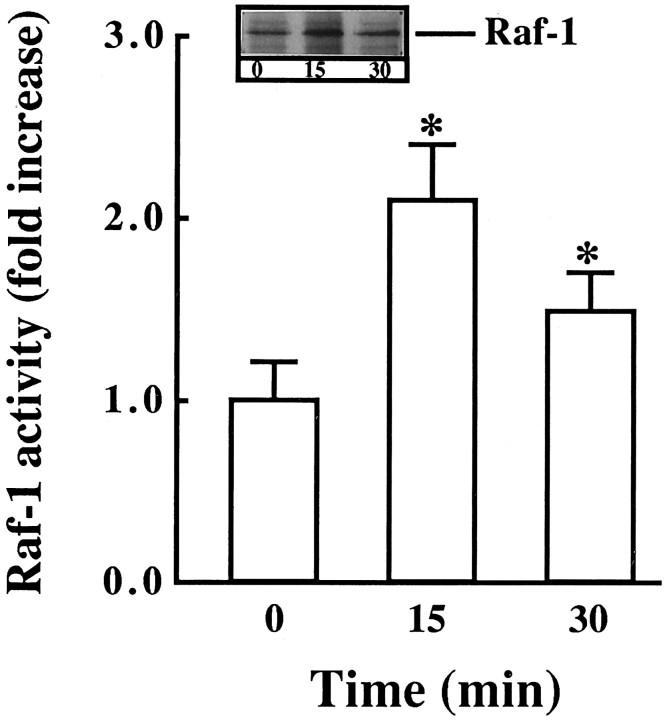
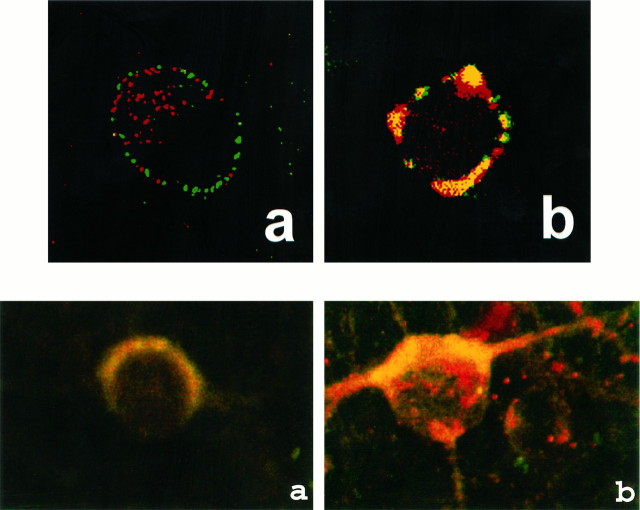
Next we studied the effect of Ang II on the activation of Raf-1, because earlier studies have shown that Ras is involved in the activation of Raf-1 (Leevers et al., 1994). Ang II caused a time- and dose-dependent activation of Raf-1 in a transient fashion (Fig.3A,B). Maximal stimulation of ∼threefold was observed by 100 nm Ang II in 10 min, followed by its gradual decrease, and returned to control, unstimulated levels in 60 min. The activation of Raf-1 was also mediated by the interaction of Ang II with the AT1 receptor subtype, because it was blocked completely by losartan and not by PD123319 (Fig.4). Immunoblot analysis with the use of specific Raf-1 antibody showed that Ang II increased the levels of phosphorylated Raf-1 in a time-dependent fashion, and a maximal increase of threefold was observed in 30 min (Fig. 5). Data in Figures 3 and 5indicated that there was a delayed response of Ang II stimulation of phosphorylated Raf-1 when compared with the stimulation of its kinase activity. This discrepancy could be attributable to the difference in the sensitivities of the methods used to quantitate the kinase activity of Raf-1 and the levels of phosphorylated Raf-1. In addition, the possibility of the existence of specific phosphatase that may change the levels of phosphorylated Raf-1 also could not be ruled out at the present time. Raf-1 is a cytoplasmic protein whose activation involves its redistribution and translocation to the plasma membrane and its interaction with activated Ras (Moodie et al., 1993; Leevers et al., 1994). We determined the effect of Ang II on a possible interaction between AT1 receptor and Ras and Ras with Raf-1 by the use of a co-precipitation technique. Extracts of Ang II-treated neuronal cells were immunoprecipitated with either AT1 receptor antibody or Ras antibody. This was followed by immunoblotting with either Ras or Raf-1 antibody after SDS/PAGE. Figure 6 shows that AT1receptor immune complexes co-precipitated a protein that was recognized by Ras antibody. The level of this protein increased with time of incubation with Ang II in a transient fashion. Figure 7shows that Ras immune complexes co-precipitated a protein that was recognized by the Raf-1 antibody. The concentration of this protein was significantly higher in cells treated with Ang II compared with the control neurons. Further confirmation of the AT1receptor-Ras and Ras-Raf-1 interactions in neurons was provided by the immunocytochemical experiments. Double-staining with the use of AT1 receptor and Ras antibodies was carried out to determine the effect of Ang II on their distribution. Both AT1 receptors (red color) and Ras (green color) were distributed throughout the plasma membrane in control neurons (Fig.8a). It was also apparent that there was little overlap between the staining of these two proteins. After Ang II treatment, a co-localization pattern of the AT1 receptor immunoreactivity on the plasma membrane with Ras was seen as evident by the presence of yellow color (Fig. 8b). Ras and Raf-1 immunoreactivities were diffusely distributed throughout the perinuclear region of the cell soma in the neurons. In addition, certain basal levels of immunoreactivities representing both Ras and Raf-1 were also co-localized in the plasma membrane region of control neurons (Fig. 9a). A dramatic redistribution of these immunoreactivities from the cytoplasm to the plasma membrane was observed when neurons were incubated with 100 nm Ang II for 10 min. There were discrete, patchy regions on the membrane showing yellow color representing the presence of both Ras and Raf-1 in a close proximity with each other (Fig. 9b).
Fig. 3.
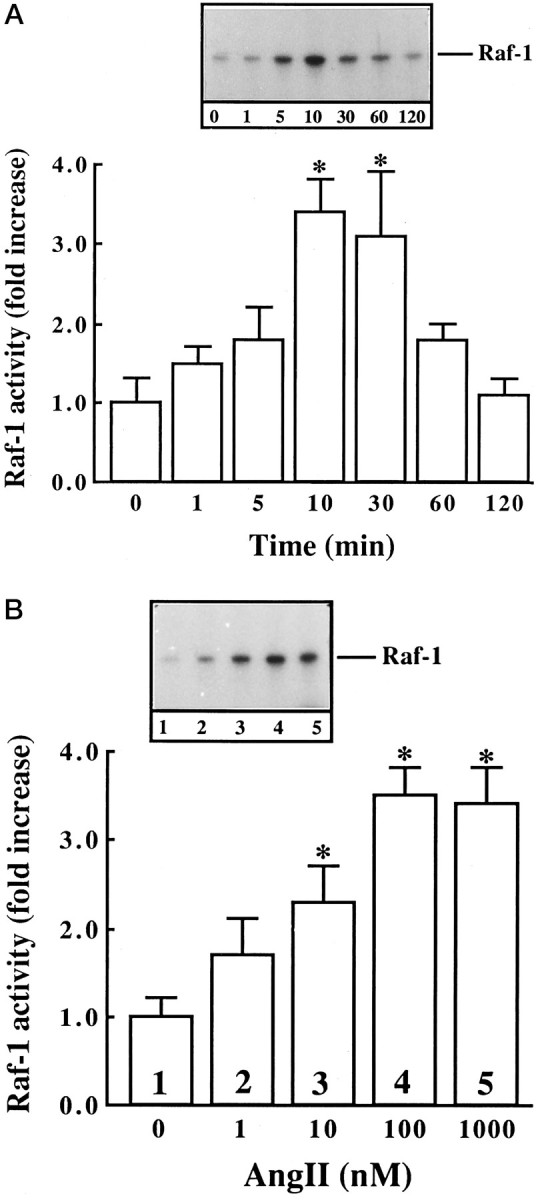
Activation of Raf-1 by Ang II as a function of time and Ang II concentration in neuronal cultures. Neuronal cultures were incubated with 100 nm Ang II for indicated time periods (A) or for 10 min with indicated concentrations of Ang II (B). Cells were lysed, Raf-1 was immunoprecipitated with the use of specific anti-Raf-1 antibody, and autophosphorylation of Raf-1 was carried out essentially as described in Materials and Methods. Top, Representative autoradiogram.Bottom, Bands corresponding to Raf-1 from three experiments were quantitated as described in Materials and Methods and are presented as mean ± SE. Asterisks indicate significantly different from zero time (A) or without Ang II (B) (p < 0.05).
Fig. 4.
The effect of Ang II receptor subtype antagonists on the activation of Raf-1 in neuronal cultures. Neuronal cultures were incubated without or with 100 nm Ang II for 10 min in the absence or presence of 10 μmlosartan or PD123319. Active Raf-1 was determined as described in the legend to Figure 3. Top, Representative autoradiogram.Bottom, Data from three experiments are mean ± SE.Asterisks indicate significantly different from control (p < 0.05); double asterisk indicates significantly different from Ang II-treated cells (p < 0.05).
Fig. 5.
Immunoblot of Raf-1 stimulated by Ang II in neuronal cultures. Experimental protocol was essentially the same as described in the legend to Figure 3. Immunoblots were developed essentially as described in Materials and Methods. Top, Representative autoradiogram. Bottom, Bands corresponding to phosphorylated Raf-1 (p-Raf-1) were quantitated, and data from three immunoblots were presented as mean ± SE.Asterisks indicate significantly different from the zero time density (p < 0.05).
Fig. 6.
Co-precipitation of AT1receptor with Ras. Neuronal cultures were incubated with 100 nm Ang II for the indicated time. Cell lysates were immunoprecipitated with AT1 receptor antibody. Immunoblots of the immunoprecipitates were then probed with anti-Ras antibody. Top, Representative autoradiogram.Bottom, Bands corresponding to Ras were quantitated, and data from three immunoblots were presented as mean ± SE.Asterisks indicate significantly different from the zero time density.
Fig. 7.
Co-precipitation of Raf-1 with Ras. Neuronal cultures were stimulated with 100 nm Ang II for the indicated times (min). Cell lysates were immunoprecipitated with anti-Ras antibody. Western blots of the immunoprecipitates were then probed with anti-Raf-1 antibody. Top, Representative autoradiogram. Bottom, Bands corresponding to Raf-1 were quantitated, and data from three immunoblots were presented as mean ± SE. Asterisks indicate significantly different from the zero time density.
Fig. 8.
Co-localization of AT1receptor and Ras in neurons. Neuronal cultures were incubated without (a) or with (b) 100 nm Ang II for 15 min at 37°C. Rabbit anti-AT1 receptor and mouse anti-Ras were used as primary antibodies. Confocal microscopy was used for image analysis (Lu et al., 1996). Magnification: 5000×.
Fig. 9.
Co-localization of Ras and Raf-1 in neurons. Neuronal cultures were grown and treated without (a) or with (b) 100 nm Ang II for 15 min at 37°C (Lu et al., 1996). This was followed by double immunocytochemical staining with rabbit anti-Raf-1 and mouse anti-Ras antibodies, followed by staining with rhodamine-labeled anti-rabbit and FITC-labeled anti-mouse IgG. Confocal microscopy was used for image analysis (Lu et al., 1996). Magnification: 5000×.
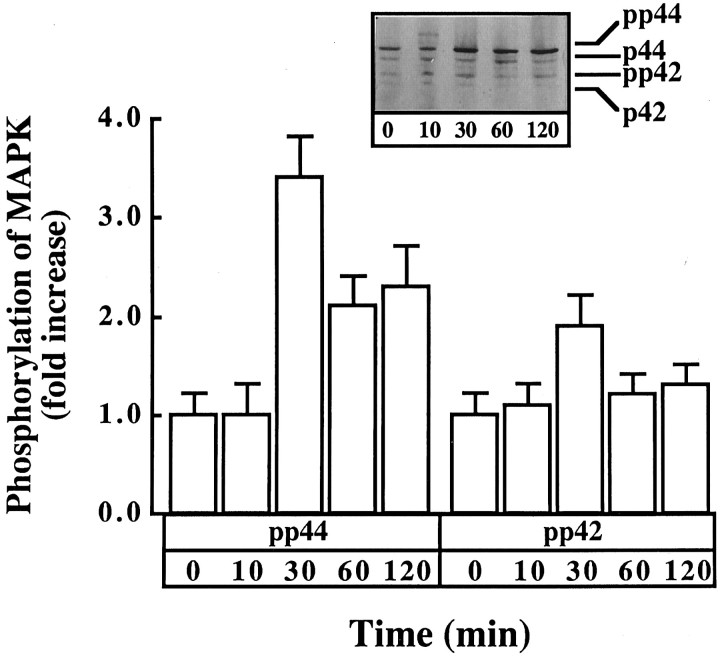
The role of MAP kinase in the downstream propagation of AT1 receptor signaling was studied by determining the effect of Ang II on MAP kinase activity. Ang II caused a time- and dose-dependent increase in MAP kinase activity. A maximal stimulation of ∼fourfold was observed in 5–10 min with 100 nm Ang II (Fig.10A). The stimulation was blocked by 10 μm losartan but not by PD123319 (Fig.10B), confirming the involvement of AT1 receptor subtype in this stimulation. Further confirmation of the activation of MAP kinase by Ang II was provided by immunoblot analysis of neurons treated with Ang II. The antibody to MAP kinase recognizes two isoforms, identified as P44and P42. Ang II caused an increase in the phosphorylation of both isoforms of MAP kinase (Fig.11). A maximal increase of threefold was observed with 100 nm Ang II in 30 min.
Fig. 10.
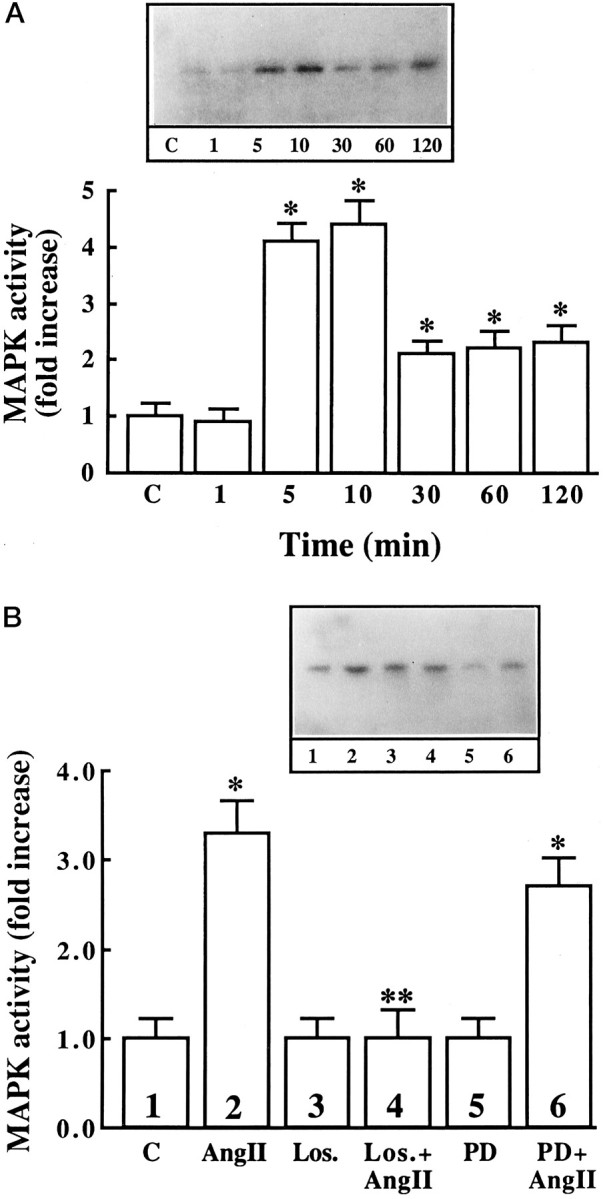
The effect of Ang II on MAP kinase activity in neuronal cultures. A, Neuronal cultures were incubated with 100 nm Ang II for indicated time periods, cell extracts were prepared in lysis buffer, and MAP kinase was immunoprecipitated by specific antibody (ERK-2). The resulting immunoprecipitates were electrophoresed on a 10% SDS/PAGE containing 0.5 mg/ml myelin basic protein. This was followed by an in-gel assay for MAP kinase as described in Materials and Methods. Top, Representative autoradiogram. Bottom, Data from three in-gel assays were presented as mean ± SE. Asterisks indicate significantly different from zero time control (p < 0.05). B, Neuronal cultures were incubated without or with 100 nm Ang II for 10 min in the absence or presence of 10 μm losartan (Los.) or 10 μm PD123319 (PD) as indicated. MAP kinase activity was determined as described in the legend to Figure 9.Top, Representative autoradiogram. Bottom, Data from three in-gel assays presented as mean ± SE. Asterisksindicate significantly different from untreated control (p < 0.05); double asterisk indicates significantly different from Ang II-treated neurons.
Fig. 11.
Immunoblot analysis of MAP kinase in neuronal cultures simulated by Ang II. Experimental protocol was essentially the same as described in the legend to Figure 9. Immunoblotting was carried out with the use of anti-ERK-I-III antibody essentially as described in Materials and Methods. Top, Representative autoradiogram.Bottom, Bands corresponding to P44 and P42 were quantitated, and data from three experiments were presented as mean ± SE.
Role of MAP kinase in Ang II stimulation of NET and TH mRNA levels
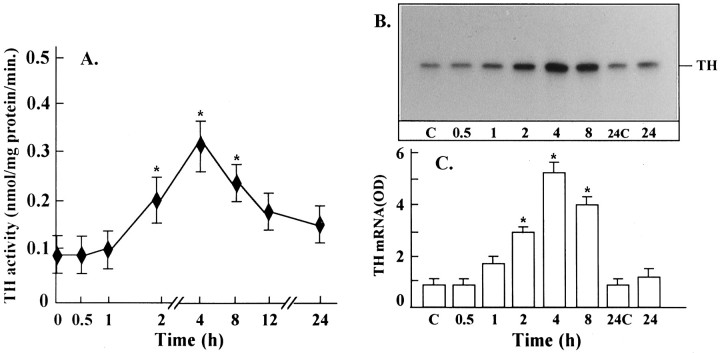
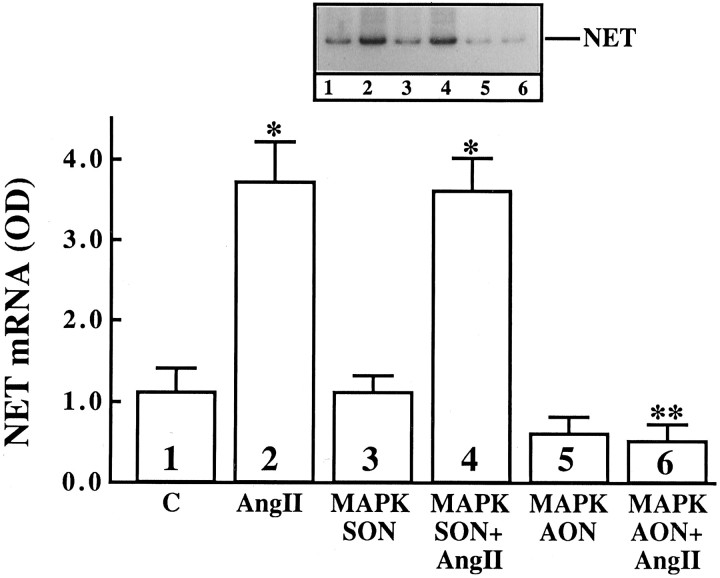
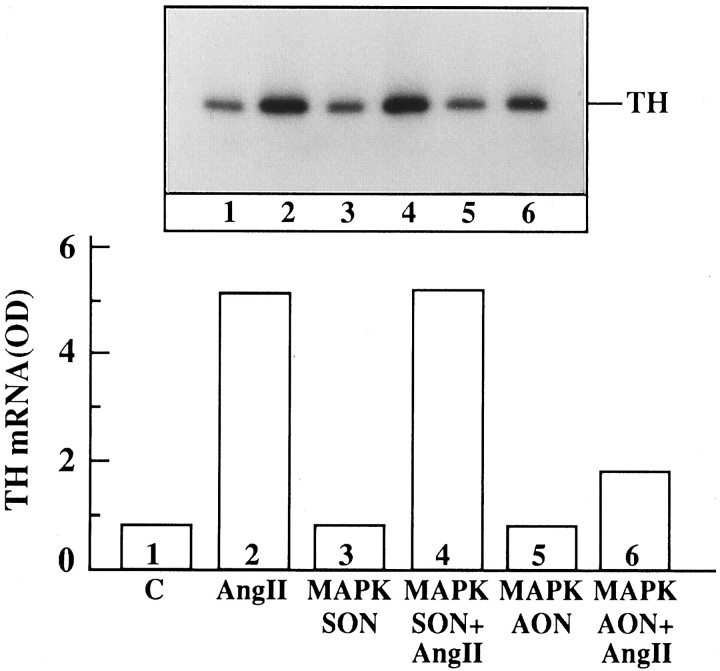
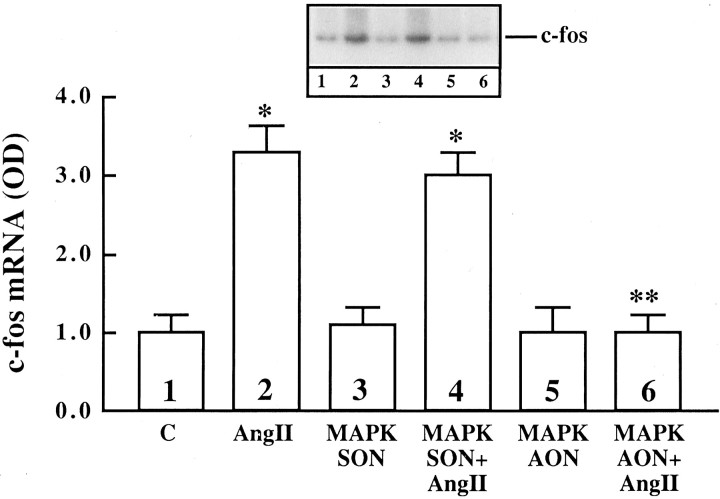
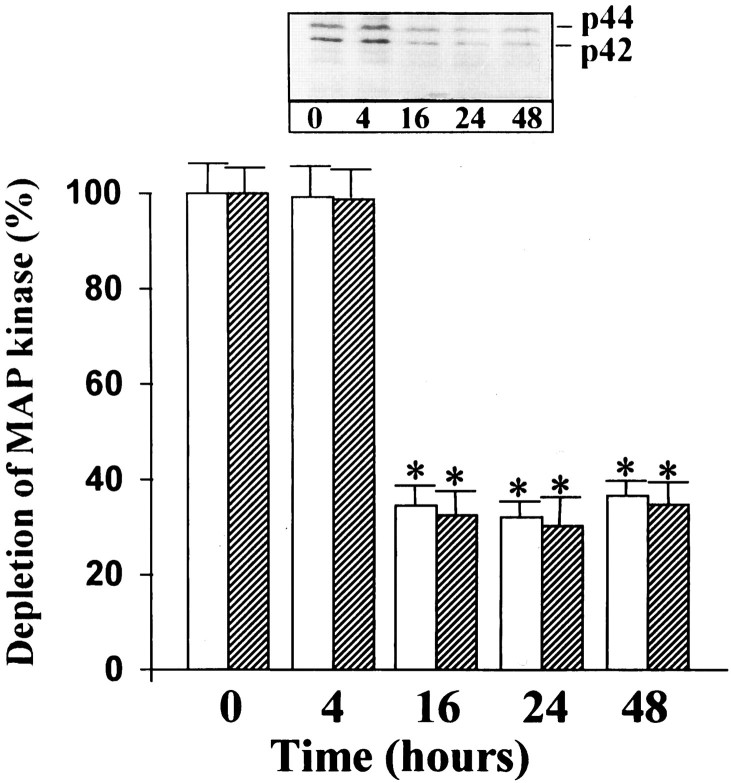
Ang II stimulates uptake, synthesis, and release of NE in neuronal cultures (Sumners and Raizada, 1986; Raizada et al., 1994). In addition, chronic stimulation of the NE uptake system by Ang II is associated with an increase in gene expression for NET and involves c-fos gene expression (Lu et al., 1996). Ang II also stimulated TH activity in a time-dependent fashion, and a maximal increase of twofold was observed in 4 hr with 100 nm Ang II (Fig. 12). The increase was blocked completely by 10 μm cycloheximide, indicating that transcriptional and translational processes may be involved in this stimulation. This conclusion is supported further by our data (Fig. 12B,C), which showed that Ang II caused a time-dependent increase in the mRNA for TH, with maximal stimulation of ∼fivefold in 4 hr. The stimulation of both TH activity and its mRNA by Ang II was inhibited by losartan, indicating the involvement of AT1 receptor subtypes in this action. These observations, coupled with our previous studies (Raizada et al., 1994;Lu et al., 1996), have led us to suggest that the chronic neuromodulatory actions of Ang II involve its effects on NET and TH mRNAs. Thus, in all subsequent studies we have used the stimulation of NET and TH mRNAs as a measure of assessing the role of MAP kinase in the neuromodulatory action of Ang II in neurons. AON to MAP kinase designed to inhibit both P42 and P44 subtypes was used for this purpose. Neuronal cultures were preincubated with MAP kinase AON or SON for 24 hr, as described in Materials and Methods. This was followed by incubation of cultures with 100 nm Ang II. Treatment with MAP kinase AON resulted in attenuation of Ang II stimulation of NET mRNA levels (Fig. 13). SON to MAP kinase showed no effect. Similar to its effect on NET mRNA, MAP kinase AON attenuated Ang II stimulation of TH mRNA (Fig. 14). In addition, MAP kinase AON resulted in an attenuation of Ang II stimulation of c-fos mRNA in these cultures (Fig. 15). Preincubation conditions for MAP kinase AON resulted in a time-dependent decrease in MAP kinase immunoreactivity, and a maximal decrease of 70% was observed in 24 hr (Fig. 16). This indicated that MAP kinase AON significantly inhibits the expression of this enzyme in neurons. These observations demonstrate that Ang II stimulation of MAP kinase is involved in the actions of Ang II on TH and NET genes.
Fig. 12.
Ang II stimulation of TH activity and TH mRNA in neuronal cultures. A, Fifteen-day-old neuronal cultures grown in 100 mm culture dishes were used for the determination of TH activity after incubation with 100 nm Ang II for indicated time periods, essentially as described previously (Park et al., 1990). Data are mean ± SE (n = 3, * p < 0.05). B and C, Poly(A+) RNA from cells treated with 100 nm Ang II in a parallel experiment was isolated and subjected to a semi-quantitative RT-PCR with the use of specific primers for TH, as described in Materials and Methods. B, A representative autoradiogram.C, Density of bands in autoradiograms from three independent experiments was analyzed and quantitated by using SW 5000 Gel Analysis, a PC computer software, and the data were presented as OD units (Lu et al., 1996). Density units were presented as a ratio of TH mRNA product to β-actin mRNA product. Data are mean ± SE. Asterisksindicate significantly different from control (p < 0.05).
Fig. 13.
The effect of MAP kinase AON on Ang II (AngII) stimulation of NET mRNA levels in the neuronal cultures. Neuronal cultures were incubated without or with 1 μm SON (MAPK SON) or AON (MAPK AON) for MAP kinase for 24 hr at 37°C. Ang II (100 nm) was added for 4 hr. Total poly(A+) RNA was isolated and subjected to RT-PCR protocol for the quantitation of NET mRNA levels, essentially as described in Materials and Methods. Top, Representative autoradiogram. Bottom, Data are mean ± SE from three different experiments. Asterisks indicate significantly different from control (p < 0.05);double asterisk indicates significantly different from Ang II-treated cells (p < 0.05).
Fig. 14.
The effect of MAP kinase AON on Ang II stimulation of TH mRNA levels in the neuronal cultures. Experimental conditions are identical to those described in the legend to Figure 13. TH mRNA was measured essentially as described in the legend to Figure12. Top, Representative autoradiogram. Bottom, Mean of two experiments and normalized for β-actin mRNA.
Fig. 15.
The effect of MAP kinase AON on Ang II stimulation of c-fos mRNA in the neurons. Neuronal cultures were preincubated with 1 μm SON (MAPK SON) or AON (MAPK AON) for MAP kinase for 24 hr, followed by a 20 min incubation with 100 nm Ang II. Poly(A+) RNA was isolated and c-fos mRNA levels were determined as described in Materials and Methods. Top, Representative autoradiogram.Bottom, Mean ± SE of three experiments.Asterisks indicate significantly different from control (p < 0.05); double asterisk indicates significantly different from Ang II-treated cells (p < 0.05).
Fig. 16.
The effect of MAP kinase AON on MAP kinase immunoreactivity in the neurons. Neuronal cultures were incubated with 1 μm AON to MAP kinase for 48 hr at 37°C, essentially as described in Materials and Methods. Cell extracts were prepared in lysis buffer, and MAP kinase was immunoprecipitated by ERK-2 antibody. Immunoblotting was carried out with the use of anti-erk-1-III antibody, essentially as described in the legend to Figure 10. Top, Representative autoradiogram.Bottom, Bands corresponding to P44(white column) and P42 (hatched column) were quantitated, and data from three experiments were presented as mean ± SE. Asterisks indicate significantly different from zero time.
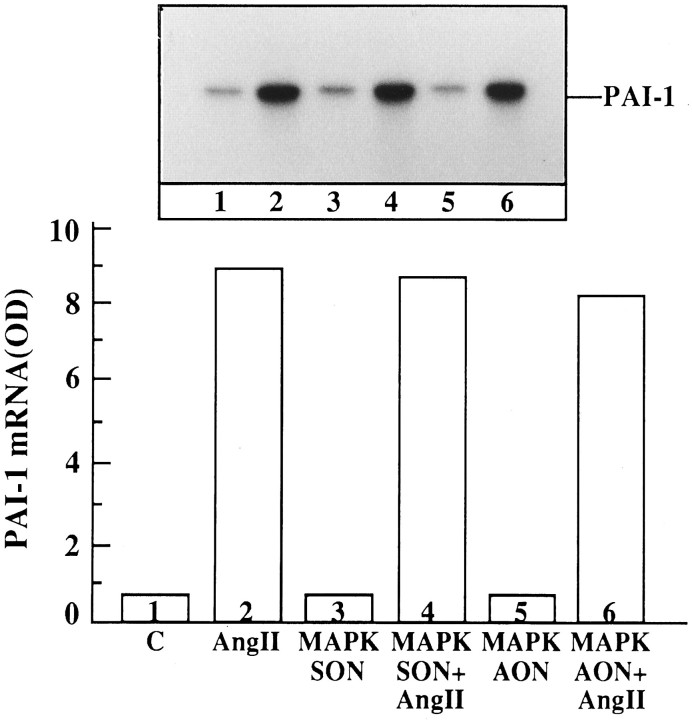
Finally, the effect of MAP kinase AON on Ang II stimulation of PAI-1 mRNA was studied. The rationale behind this experiment was based on our previous studies that have implicated PAI-1 in the trophic action of Ang II in the neurons (Rydzewski et al., 1993). Thus, we hypothesized that if MAP kinase activation is involved in the actions of Ang II on NET and TH mRNA levels, then AON for MAP kinase would not influence Ang II stimulation of PAI-1 mRNA. Ang II stimulated PAI-1 mRNA in neuronal cultures, and a maximal stimulation of ninefold was observed with 100 nm Ang II in 2 hr. This stimulation was blocked completely by 10 μm losartan, suggesting the involvement of AT1 receptors in this action. Preincubation of neuronal cultures for 24 hr with 1 μm MAP kinase AON followed by stimulation with 100 nm Ang II under optimal conditions showed no attenuation of Ang II stimulation of PAI-1 mRNA (Fig.17).
Fig. 17.
The effect of MAP kinase AON on Ang II stimulation of PAI-1 mRNA levels in neuronal cultures. Experimental conditions are identical to those described in legend to Figure 13, except that PAI-1 mRNA was measured with the use of specific PAI-1 primers. Top, Representative autoradiogram.Bottom, Data from two independent experiments, and normalized for β-actin.
DISCUSSION
The observations presented in this study are the first demonstration that both Ras and Raf-1 are activated by Ang II and that the activation of MAP kinase is an important regulatory event in Ang II stimulation of NET and TH genes in the neurons.
Previous studies have established that chronic exposure of the brain neurons to Ang II results in a persistent stimulation of specific NE uptake that is accompanied by the stimulation of NET gene expression (Lu et al., 1996). Complementary to these observations is our present data, which show that chronic stimulation of neurons with Ang II also stimulates TH activity and also is associated with a parallel increase in the TH mRNA levels. Thus, it is reasonable to conclude that the stimulation of TH and NET mRNA levels could be used as a measure of long-term neuromodulatory actions of Ang II at the cellular and molecular levels. Indeed, the evidence showing the rationale for this is supported further by the observations with the SH rat brain. The brain of the SH rat has higher levels of Ang II, NE, and NET mRNA compared with normotensive control rats (Yang et al., 1991; Raizada et al., 1994; Lu et al., 1996). Associated with these increases is an increase in the sympathetic activity in the brain of SH rats (Amana et al., 1983; Goldstein, 1983).
The following data presented in this study support the notion that activation of MAP kinase is the key signaling event in this neuromodulatory action of Ang II. (1) The stimulatory effects of Ang II on NET and TH mRNA are attenuated by preincubation of neurons with the AON to MAP kinase under the conditions that cause a 70% decrease in MAP kinase immunoreactivity. This attenuation is specific, because SON for MAP kinase is without any effect. (2) Ang II stimulation of c-fos mRNA also is attenuated by MAP kinase AON. This observation is relevant because our studies have shown that c-fos is involved in Ang II stimulation of NET (Lu et al., 1996) and TH (unpublished data). (3) Ang II stimulation of PAI-1 mRNA is not affected by MAP kinase AON. PAI-1 has been implicated in the trophic effect of Ang II in the neurons (Rydzewski et al., 1993).
An important question arising from these data concerns the downstream mechanism after the activation of MAP kinase in the AT1 receptor-mediated stimulation of TH and NET. It is tempting to hypothesize that MAP kinase activation results in its translocation into the nucleus, where it mediates phosphorylation of the transcription factor(s) relevant to the activation of AP-1 binding sites. The activated transcription factor(s) bind to the AP-1 binding sites on the promotor regions of the TH and NET genes to stimulate their transcription. There is much evidence to support this hypothesis. (1) AP-1 binding sites, which are Ang II-responsive, are demonstrated in the promotor region of the TH gene (Goc and Stachoviak, 1994); (2) MAP kinase stimulates activation of various transcription factors such as Jun and Fos, which interact with the AP-1 sites (Chen et al., 1992; Blenis, 1993); (3) MAP kinase is involved in the stimulation of the c-fos gene and the activation ofFos (Gille et al., 1992). This, in combination withJun, is important in the activation of AP-1 sites (Abate et al., 1993). The fact that Ang II stimulates c-fos and that the c-fos expression is important in Ang II stimulation of NET and TH genes further supports our hypothesis. In addition, our initial observations have shown that Ang II also stimulates c-Jun-N-terminal kinase (JNK) (unpublished observation). JNK is an important mediator in the activation of AP-1 sites (Davis, 1993, 1994). Although these are significant arguments in favor of the involvement of MAP kinase in neuromodulation, they are indirect. Thus, additional experiments will have to be conducted to provide a more direct link between the two events influenced by Ang II.
Another issue relates to the involvement of Ras and Raf-1 in these Ang II-mediated cellular actions. Our data demonstrating the co-precipitation of AT1 receptor with Ras and Ras with Raf-1 and co-localization of AT1 receptor immunoreactivity with Ras and Ras immunoreactivity with Raf-1 in Ang II-treated neurons strongly argues in favor of this pathway. This view also is supported by the evidence in the literature demonstrating the co-localization of Ras with Raf-1 in the brain and a well established role of Raf-1 in the activation of MAP kinase (Koide et al., 1993;Moodie et al., 1993). This would indicate that interaction of Ang II with AT1 receptor initiates its association with Ras on the membrane leading to the activation of Ras. Activated Ras then interacts with Raf-1, leading to its activation. It is interesting to point out that interaction of AT1 receptors with Ras is transient and reaches maximal in 5 min, followed by dissociation within 10 min (Fig. 6). This observation, coupled with the data on Ras-Raf-1 interaction (Fig. 7), would suggest that a stable interaction of Ras with AT1 receptor may not be required for its interaction with Raf-1. These are exciting observations and provide indirect evidence for an interaction between the AT1 receptor and Ras; however, direct evidence is lacking at the present time to prove this view. Recent studies have shown the involvement of PYK2 and Shc in Ras-mediated regulation of signaling pathway for G-protein-coupled receptors such as bradykinin (Lev et al., 1995; Van Belsen et al., 1995). It would also be interesting to determine the role of PYK2 and Shc in AT1 receptor-mediated signaling of neuromodulation.
Finally, the mechanism by which a seven-transmembrane receptor such as the AT1 receptor could initiate kinase cascade of signaling events remains to be determined. It is likely that the AT1 receptor possesses intrinsic tyrosine kinase and/or serine threonine kinase activity, which has yet to be identified. Lacking a kinase activity, the AT1receptor must recruit intracellular protein(s) after stimulation with Ang II to do so. Evidence for this possibility is provided by the observations that Ang II directly stimulates pp60and several known substrates for pp60 such as pp120, FAK125, JAK2, and STAT-1 (Bhat et al., 1994; Schorb et al., 1994; Marrero et al., 1995). In addition, antibodies to pp60 inhibit Ang II stimulation of phospholipase Cγ phosphorylation and inositol triphosphate formation (Dhar and Shukla, 1994). Nonetheless, our observations reveal a unique role of Ras, Raf-1, and MAP kinase cascade in the neuromodulatory actions of Ang II in the neurons and set the stage to investigate the interactions between the AT1 receptor and other signaling proteins that are capable of initiating the kinase cascade of events.
Footnotes
This research was supported by National Institutes of Health Grant 33610. K.Y. and D.L. were predoctoral and postdoctoral fellows, respectively, of the American Heart Association, Florida Affiliate. We thank Elizabeth Brown for neuronal cultures, and Jennifer Brock for typing and preparing this manuscript. The Confocal Microscopy Core of the Structural Biology Center and the DNA Synthesis Core of the Interdisciplinary Center for Biotechnology Research provided valuable assistance during the completion of this investigation.
Correspondence should be addressed to Dr. Mohan K. Raizada, Professor of Physiology and Associate Dean for Graduate Education, Department of Physiology, University of Florida, College of Medicine, P.O. Box 100274, Gainesville, FL 32610.
REFERENCES
- 1.Abate C, Baker ST, Lees M, Anderson CW, Marshar DR, Curran T. Dimerization and DNA binding alter phosphorylation of Fos and Jun. Proc Natl Acad Sci USA. 1993;90:6766–6770. doi: 10.1073/pnas.90.14.6766. [DOI] [PMC free article] [PubMed] [Google Scholar]
- 2.Amana FW, Bolli P, Kiowski W, Buhler FR. Enhanced α-adrenoreceptor mediated vasoconstriction in essential hypertension. Hypertension. 1983;3:I119–I123. doi: 10.1161/01.hyp.3.3_pt_2.i119. [DOI] [PubMed] [Google Scholar]
- 3.Bhat GJ, Thekkumkara TJ, Thomas WG, Conrad KM, Baker KM. Angiotensin II stimulates sis -inducing factor-like DNA binding activity. Evidence that the AT1A receptor activates transcription factor-STAT91 and/or a related protein. J Biol Chem. 1994;269:31443–31449. [PubMed] [Google Scholar]
- 4.Blenis J. Signal transduction via the MAP kinase: proceed at your own RSK. Proc Natl Acad Sci USA. 1993;90:5889–5892. doi: 10.1073/pnas.90.13.5889. [DOI] [PMC free article] [PubMed] [Google Scholar]
- 5.Chen RH, Samecki C, Blenis J. Nuclear localization and regulation of erk- and rsk-encoded protein kinases. Mol Cell Biol. 1992;12:915–927. doi: 10.1128/mcb.12.3.915. [DOI] [PMC free article] [PubMed] [Google Scholar]
- 6.Davis RJ. The mitogen-activated protein kinase signal transduction pathway. J Biol Chem. 1993;268:14553–14556. [PubMed] [Google Scholar]
- 7.Davis RJ. MAPKs: New JNK expands the group. Trends Biochem Sci. 1994;19:470–473. doi: 10.1016/0968-0004(94)90132-5. [DOI] [PubMed] [Google Scholar]
- 8.Dhar A, Shukla SD. Electrotransjection of pp60c-src monoclonal antibody inhibits activation of phospholipase C in platelets. J Biol Chem. 1994;269:9123–9127. [PubMed] [Google Scholar]
- 9.Ding H, Zhou Q, Deng J, Lao HY, Yang K. Effect of the overactivated central renin-angiotensin system on the concentration of brain norepinephrine and epinephrine in stroke-prone spontaneously hypertensive rats and its signficancies. Sheng Li Hsueh Pao. 1990;42:379–384. [PubMed] [Google Scholar]
- 10.Dostal DE, Baker KM. Angiotensin II stimulation of left ventricular hypertrophy in adult rat heart: mediation by the AT1 receptor. Am J Hypertens. 1992;5:276–280. doi: 10.1093/ajh/5.5.276. [DOI] [PubMed] [Google Scholar]
- 11.Downward J, Graves JD, Warne PH, Rayter S, Cantrell DA. Stimulation of P21ras upon T-cell activation. Nature. 1990;346:719–723. doi: 10.1038/346719a0. [DOI] [PubMed] [Google Scholar]
- 12.Duronio V, Welhm MJ, Abraham S, Dryden P, Schrader JW. p21ras activation via hemopoietin receptors and c-kit requires tyrosine kinase activity but not tyrosine phosphorylation of p21rasGTPase-activating protein. Proc Natl Acad Sci USA. 1992;89:1587–1591. doi: 10.1073/pnas.89.5.1587. [DOI] [PMC free article] [PubMed] [Google Scholar]
- 13.Geisterfer AA, Peach MJ, Owens GK. Angiotensin II induces hypertrophy, not hyperplasia, of cultured rat aortic smooth muscle cells. Circ Res. 1988;62:746–756. doi: 10.1161/01.res.62.4.749. [DOI] [PubMed] [Google Scholar]
- 14.Gille H, Sharrocks AD, Shaw PE. Phosphorylation of transcription factor p62TCF by MAP kinase stimulates ternary complex formation at c-fos promotor. Nature. 1992;358:414–417. doi: 10.1038/358414a0. [DOI] [PubMed] [Google Scholar]
- 15.Goc A, Stachoviak MK. Bovine tyrosine hydroxylase gene promoter regions involved in basal and angiotensin II stimulated expression in non-transformed adrenal medullary cells. J Neurochem. 1994;62:834–843. doi: 10.1046/j.1471-4159.1994.62030834.x. [DOI] [PubMed] [Google Scholar]
- 16.Goldstein DS. Plasma catecholamines and essential hypertension: an analytical review. Hypertension. 1983;5:86–99. doi: 10.1161/01.hyp.5.1.86. [DOI] [PubMed] [Google Scholar]
- 17.Inagami T, Iwai N, Sasaki K, Yamano Y, Bardhan S, Chaki S, Guo DF, Furuta H. CRC; Boca Raton: 1993. Cloning, expression, and regulation of angiotensin II receptors. (Raizada MK, Phillips MI, Sumners C, eds), pp 273–291. . [Google Scholar]
- 18.Koide H, Satoh T, Nakafuka M, Kaziro Y. GTP-dependent association of Raf-1 with Ha-Ras: identification of Raf as a target downstream of Ras in mammalian cells. Proc Natl Acad Sci USA. 1993;90:8683–8686. doi: 10.1073/pnas.90.18.8683. [DOI] [PMC free article] [PubMed] [Google Scholar]
- 19.Leevers S, Paterson HF, Marshall CJ. Requirement for Ras in Raf activation is overcome by targeting Raf to the plasma membrane. Nature. 1994;369:411–414. doi: 10.1038/369411a0. [DOI] [PubMed] [Google Scholar]
- 20.Lev S, Moreno H, Martinez R, Canoll P, Peles E, Musacchio JM, Plowman GD, Rudy B, Schlessinger J. Protein tyrosine kinase PYK2 involved in Ca2+-induced regulation of ion channel and MAP kinase functions. Nature. 1995;376:737–745. doi: 10.1038/376737a0. [DOI] [PubMed] [Google Scholar]
- 21.Lu D, Raizada MK. Delivery of angiotensin II type-1 receptor antisense inhibits angiotensin action in neurons from hypertensive rat brain. Proc Natl Acad Sci USA. 1995;92:2914–2918. doi: 10.1073/pnas.92.7.2914. [DOI] [PMC free article] [PubMed] [Google Scholar]
- 22.Lu D, Yu K, Paddy MR, Rowland NE, Raizada MK. Regulation of norepinephrine transport system by angiotensin II in neuronal cultures of normotensive and spontaneously hypertensive rat brains. Endocrinology. 1996;137:763–772. doi: 10.1210/endo.137.2.8593828. [DOI] [PubMed] [Google Scholar]
- 23.Lu D, Yu K, Raizada MK. Retrovirus-mediated transfer of an angiotensin type-1 receptor antisense inhibits angiotensin action in neurons from hypertensive rat brain. Proc Natl Acad Sci USA. 1995;92:1162–1166. doi: 10.1073/pnas.92.7.2914. [DOI] [PMC free article] [PubMed] [Google Scholar]
- 24.Marrero MB, Schieffer B, Paxton WG, Heerdt L, Berk BC, Delafontaine P, Bernstein KE. Direct stimulation of Jak/STAT pathway by the angiotensin II AT1 receptor. Nature. 1995;375:247–250. doi: 10.1038/375247a0. [DOI] [PubMed] [Google Scholar]
- 25.Molloy CJ, Taylor DS, Weber H. Angiotensin II stimulation of rapid tyrosine phosphorylation and protein kinase activation in rat aortic smooth muscle cells. J Biol Chem. 1993;268:7338–7345. [PubMed] [Google Scholar]
- 26.Moodie SA, Willumsen BM, Weber MJ, Wolfman A. Complexes of Ras-GTP with Raf-1 and mitogen-activated protein kinase kinase. Nature. 1993;260:1658–1661. doi: 10.1126/science.8503013. [DOI] [PubMed] [Google Scholar]
- 27.Murphy TJ, Alexander RW, Griendling KK, Runge MS, Bernstein KE. Isolation of a cDNA encoding the vascular type-1 angiotensin II receptor. Nature. 1991;351:233–236. doi: 10.1038/351233a0. [DOI] [PubMed] [Google Scholar]
- 28.Ohmichi M, Pang L, Decker S, Saltiel AR. Nerve growth factor stimulates the activities of the raf-1 and the mitogen-activated protein kinases via the erk protooncogene. J Biol Chem. 1992;267:14604–14610. [PubMed] [Google Scholar]
- 29.Park DH, Park HS, Joh TH, Anwar M, Raggiero D. Strain difference between albino and pigmented rats in monoamine-synthesizing enzyme activities of brains, retina, and adrenal gland. Brain Res. 1990;508:301–304. doi: 10.1016/0006-8993(90)90412-5. [DOI] [PubMed] [Google Scholar]
- 30.Peach MJ. Molecular actions of angiotensin. Biochem Pharmacol. 1981;30:2745–2751. doi: 10.1016/0006-2952(81)90410-x. [DOI] [PubMed] [Google Scholar]
- 31.Phillips MI. Brain angiotensin. In: Gross P, editor. Circumventricular organs and body fluids, III. CRC; Boca Raton: 1987. pp. 163–182. [Google Scholar]
- 32.Phillips MI, Shen L, Richards EM, Raizada MK. Immunohistochemical mapping of angiotensin AT1 receptors in the brain. Regul Pept. 1993;44:95–107. doi: 10.1016/0167-0115(93)90233-x. [DOI] [PubMed] [Google Scholar]
- 33.Raizada MK, Lu D, Tang W, Kurian P, Sumners C. Increased angiotensin II type 1 receptor gene expression in neuronal cultures from spontaneously hypertensive rats. Endocrinology. 1993;132:1715–1722. doi: 10.1210/endo.132.4.8462471. [DOI] [PubMed] [Google Scholar]
- 34.Raizada MK, Lu D, Sumners C. Current concepts: tissue renin-angiotensin system as local regulators in reproductive and endocrine organs, Plenum; New York: 1994. AT1receptors and angiotensin actions in the brain and neuronal cultures of normotensive and hypertensive rats. pp. 331–348. [Google Scholar]
- 35.Raizada MK, Muther TF, Sumners C. Increased angiotensin II specific receptors in neuronal culture of spontaneously hypertensive rat brain. Am J Physiol. 1984;247:C364–C372. doi: 10.1152/ajpcell.1984.247.5.C364. [DOI] [PubMed] [Google Scholar]
- 36.Rydzewski B, Wozniak M, Sumners C, Raizada MK. The plasminogen activator system and its interactions with angiotensin II in the brain. In: Raizada MK, Phillips MI, Sumners C, editors. Cellular and molecular biology of the renin-angiotensin system. CRC; Boca Raton: 1993. pp. 485–512. [Google Scholar]
- 37.Saavedra JM. Brain and pituitary angiotensin. Endocr Rev. 1992;13:329–380. doi: 10.1210/edrv-13-2-329. [DOI] [PubMed] [Google Scholar]
- 38.Sadoshima J, Qiu Z, Morgan JP, Izumo S. Angiotensin II and other hypertrophic stimuli mediated by G protein-coupled receptors activate tyrosine kinase, mitogen-activated protein kinase, and 90 KD S6 kinase in cardiac myocytes: the critical roles of Ca2+-dependent signalling. Circ Res. 1995;76:1–15. doi: 10.1161/01.res.76.1.1. [DOI] [PubMed] [Google Scholar]
- 39.Sasaki K, Yamano Y, Bardhan S, Iwai N, Murray JJ, Hasegawa M, Matsuda Y, Inagami T. Cloning and expression of a complementary DNA encoding a bovine adrenal angiotensin II type 1 receptor. Nature. 1991;351:230–233. doi: 10.1038/351230a0. [DOI] [PubMed] [Google Scholar]
- 40.Saxena PR (1992) Interaction between the renin-angiotensin-aldosterone and sympathetic nervous systems. J Cardiovasc Pharmacol 19[Suppl 6]:S80–S88. [DOI] [PubMed]
- 41.Schorb W, Peeler TC, Madigan NN, Conrad KM, Baker KM. Angiotensin II-induced tyrosine phosphorylation in neonatal rat cardiac fibroblasts. J Biol Chem. 1994;269:19626–19632. [PubMed] [Google Scholar]
- 42.Steckelings U, Lebrun C, Quadri F, Veltman A, Unger T (1992) Role of brain angiotensin in cardiovascular regulation. J Cardiovasc Pharmacol 19[Suppl 6]:S73–S79. [DOI] [PubMed]
- 43.Sumners C, Raizada MK. Angiotensin II stimulates norepinephrine uptake in hypothalamus-brainstem neuronal cultures. Am J Physiol. 1986;250:C236–C244. doi: 10.1152/ajpcell.1986.250.2.C236. [DOI] [PubMed] [Google Scholar]
- 44. Sumners C, Raizada MK. Angiotensin II receptors subtypes in neuronal cells. Raizada MK, Phillips MI, Sumners C. Cellular and molecular biology of the renin-angiotensin system. 1993. 379 411 CRC; Boca Raton: Press. [Google Scholar]
- 45.Sumners C, Raizada MK, Kang J, Lu D, Posner P. Receptor mediated effects of angiotensin II on neurons. Front Neuroendocrinol. 1995;15:203–230. doi: 10.1006/frne.1994.1009. [DOI] [PubMed] [Google Scholar]
- 46.Timmermans PBMWM, Wang PC, Chiu AT, Herblin MF, Benfield P, Carini DJ, Lee RJ, Wexler RR, Saye JAM, Smith RD. Angiotensin II receptors and angiotensin II receptor antagonists. Pharmacol Rev. 1993;45:205–251. [PubMed] [Google Scholar]
- 47.Van Biesen T, Hawes BE, Luttrell DK, Krueger KM, Touhara K, Porfiri E, Sakaue M, Luttrell LM, Lefkowitz RJ. Receptor-tyrosine-kinase and GβY-mediated MAP kinase activation by a common signalling pathway. Nature. 1995;376:781–784. doi: 10.1038/376781a0. [DOI] [PubMed] [Google Scholar]
- 48.Williams NG, Roberts TM, Li P. Both p21 and pp60v-sre are required, but neither alone is sufficient, to activate the Raf-1 kinase. Proc Natl Acad Sci USA. 1992;89:2922–2926. doi: 10.1073/pnas.89.7.2922. [DOI] [PMC free article] [PubMed] [Google Scholar]
- 49.Wright JN, Harding JN. Brain angiotensin receptor subtypes in the control of physiological and behavioral responses. Neurosci Biobehav Rev. 1994;18:21–53. doi: 10.1016/0149-7634(94)90034-5. [DOI] [PubMed] [Google Scholar]
- 50.Yang K, Ding H, Zhou Q, Luo HY, Wu ZY. Central norepinephrine and angiotensin II contents in the brain regions of spontaneously hypertensive rats (SHR) and the interaction between them. Sheng Li Hsueh Pao. 1991;43:345–351. [PubMed] [Google Scholar]
- 51.Zelezna B, Richards EM, Tang W, Lu D, Sumners C, Raizada MK. Characterization of a polyclonal anti-peptide antibody to the angiotensin II type-1 (AT1) receptor. Biochem Biophys Res Commun. 1992;183:781–788. doi: 10.1016/0006-291x(92)90551-u. [DOI] [PubMed] [Google Scholar]


