Abstract
Three macaques were trained on a task in which a sequence of single visual images was presented serially, and the monkeys signaled whether the image was a new or a repeated one. The optic chiasm and splenium of the corpus callosum were transected, leaving the anterior commissure as the only path for cortical interhemispheric transfer. Images were presented to only one eye at a time. Re-presentations of images to the same eye were recognized correctly in >95% of trials. A robust stimulus-specific adaptation (i.e., a reduced response to a repeated image) was seen in the population of single units recorded from inferotemporal cortex during these same trials. When an interhemispheric transfer was demanded of the animals (i.e., the re-presentation was made to the other eye), recognition performance was somewhat reduced, to 86% correct. Interestingly, in this situation the stimulus-specific adaptation disappeared completely. The disappearance occurred regardless of whether the transfer direction was from the hemisphere ipsilateral to the recording site to the hemisphere contralateral to the recording site, or vice versa. Thus, stimulus-specific adaptation in inferotemporal cortex units is not required for recognition.
Keywords: visual memory, extrastriate cortex, inferotemporal cortex, macaque, memory, vision, interhemispheric relations
Inferotemporal cortex (IT) of the monkey appears to play an important role in visual memory processes. Severe memory disturbances were found when IT was damaged either permanently (Mishkin, 1966, 1982; Wilson et al., 1972; Dean, 1974; Delacour, 1977;Horel et al., 1987) or reversibly (Fuster et al., 1981; Horel et al., 1987). Memory processes are reflected in the single-unit activity recorded in IT (Brown et al., 1987; Miyashita and Chang, 1988; Miller and Desimone, 1994). One of the most evident and widely studied is stimulus-specific adaptation (SSA). This has also been termed “decremental response” (Brown et al., 1987) and “adaptive mnemonic filtering” (Miller and Desimone, 1994). In this phenomenon, the first presentation of an unfamiliar visual stimulus to a monkey generates a stronger response than the same stimulus when it is re-presented (Baylis and Rolls, 1987; Brown et al., 1987; Rolls et al., 1989; Miller et al., 1991; Riches et al., 1991; Fahy et al., 1993; Li et al., 1993; Sobotka and Ringo, 1993, 1994).
SSA has recently been reviewed (Ringo, 1996).
We were interested in experimental manipulation, which would transform this single-unit memory effect. Such a transformation, with a simultaneous measure of behavioral memory performance, would allow an experimental (rather than a correlational) investigation of the neural basis of a mnemonic behavior. To this end, we took advantage of the partially “split-brain” preparation to channel the sensory information coming into IT via two widely separated routes. The partial split-brain was created by transecting the optic chiasm and corpus callosum, leaving an intact anterior commissure (AC). In monkeys, the AC is fully capable of transferring visual information (Sullivan and Hamilton, 1973; Gross and Mishkin, 1977; Doty et al., 1988). Thus, with stimulation through only the eye ipsilateral to a recorded IT neuron, visual information can reach the cell via a cascade through striate and extrastriate areas in that hemisphere. With stimulation through only the eye contralateral to the recorded IT neuron, information must first advance up to IT on the contralateral side, then cross the AC to spread out in the ipsilateral IT. If the AC is cut, in addition to the optic chiasm and corpus callosum, almost no visual information reaches units in IT contralateral to the viewing eye (Ringo and O’Neill, 1993). Thus, with this preparation control over which eye views the stimulus dictates which of the different routes the information will take to IT.
We then asked what would happen when, having established SSA via repeated presentation through one eye, the same image was presented through the other eye. That is, what would happen if that which initially is the same visual information got to a cell via a different route.
MATERIALS AND METHODS
Subjects. Three adult female monkeys (twoMacaca mulatta and one Macaca nemestrina) were used in the experiment. All procedures and methods of this study were reviewed and approved by the appropriate institutional animal care and use committee.
Surgery. Each monkey underwent a two-stage, partially split-brain operation in which the optic chiasm and the posterior corpus callosum were cut leaving the AC intact (Trevarthen, 1972). In the first stage, the optic chiasm was transected via a transphenoidal approach. In a separate operation, the posterior 20 mm of the corpus callosum was transected via a dorsal approach. The completeness of these cuts was confirmed histologically. This surgery interrupted the commissural fibers serving cortical visual areas, except for those passing through the AC (Demeter et al., 1990).
After at least a 2 week recovery from these operations, the monkeys were prepared for single-unit recordings. Six to eight stainless steel guide tubes with outside diameters of 0.8 to 1.8 mm were permanently implanted and directed toward the IT. These guide tubes penetrated and remained 6 mm into the dorsal surface of the brain. During experimental sessions, recording electrodes were inserted through these tubes. After finishing the session, a stainless-steel obturator was inserted into the guide tube and the tube was covered with a plastic housing.
For each animal, a Teflon-coated coil of multistrand, stainless-steel wire was implanted under the conjunctiva of one eye to record eye position using the magnetic search coil system (Robinson, 1963; Judge et al., 1980). The guide tubes, their covers, and the connector for the eye coil were fixed with acrylic, which was in turn fixed to the skull using titanium and stainless-steel screws. Whenever possible, a thin sheet of Teflon was molded to the skull to separate it from the acrylic. The screws and guide tubes penetrated this sheet.
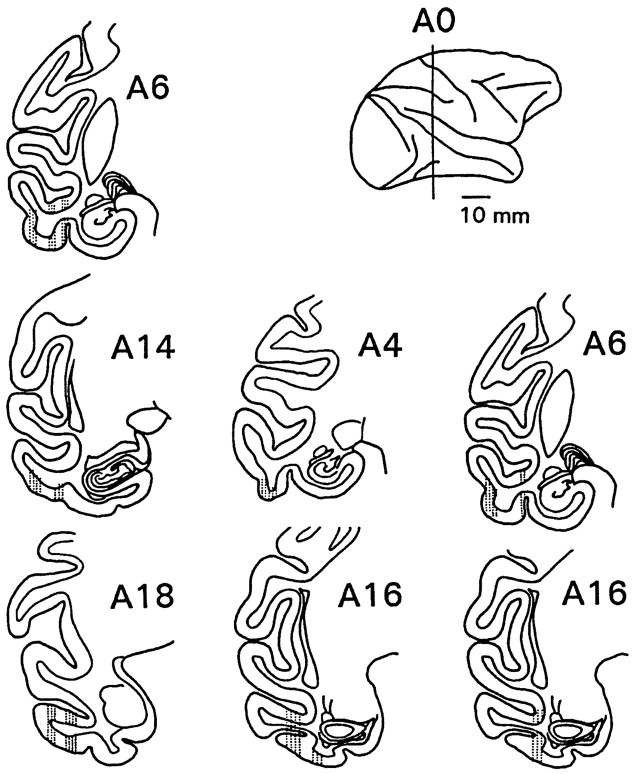
Histology. At the end of recording, lesions were made through each guide tube to assist in its localization. After all experimentation, the monkeys were given a lethal dose of barbiturate, then perfused transcardially with saline followed by 10% formalin. The brains were blocked stereotaxically, then removed. A small block containing the optic chiasm was sectioned separately with a section every 400 μm stained by the Weil method. The main blocks were embedded into polyethylene-glycol wax, then sectioned. A section every 200 μm was mounted and stained with thionin. Figure 1shows the regions from which unit activity was recorded in this experiment.
Fig. 1.
Locations of recording areas in IT of the three animals, plotted onto standard brain drawings (Winters et al., 1969). Sections in each column show locations for one animal. In the monkey presented on the left side of the figure, recording was made only from the right hemisphere, whereas in the two others, both left and right hemispheres were used. For these two monkeys, drawings are projected onto one hemisphere. The coronal level of the sections is listed with each section in millimeters anterior (A) to the zero (interaural) plane depicted in the side view in the upper right corner.
Unit recording. Parylene-coated tungsten electrodes (Microprobe) with impedance ∼1 MΩ (measured at 1 kHz) were protected by a 0.45 mm, stainless steel guard tube and lowered to within 5–10 mm of the recording site. A hydraulic microdrive advanced the electrodes into IT. Recording depths were measured with respect to the skull at the base of the brain, which was found by a single pass with a 125 μm probe. The permanently implanted guide tubes limited cell recordings to a few relatively well localized places in IT. No attempt was made to recover individual electrode tracts. Initial penetrations were devoted to finding cell-rich and cell-poor bands between the exit of the guide tube and the dura (which could usually be identified by a characteristic low-frequency electrical artifact subsequent to each microdrive advance).
During one session, one or two cells were recorded using a commercial recording and spike separation package (Datawave, Longmont, CO). When a cell was detected, all candidate spikes were recorded with low threshold for inclusion. Then, off-line, spikes belonging to one unit were separated from noise and other units using up to eight different parameters, such as spike amplitude, fit to a template, and the coefficients of the first and second principal components.
Visual stimulation. The monkey was seated in the experimental chair with its head held by a fixed padded face mask mounted over the snout and by a plate behind the head, which prevented withdrawal. Eye holes in the mask allowed each eye a view of the stimuli and shutters controlled by rotary solenoids regulated that view. The completeness of the block provided by the shutters was determined by examining for light leaks from a lighted display panel and was confirmed by running trials in which both shutters were closed. The monkeys did not respond on such trials. These methods have previously been shown to be effective in controlling the viewing eye (Ringo and O’Neill, 1993).
One problem in comparing cell activity evoked by visual stimulation to the two eyes in split-chiasm animals is that the eyes have different views of the same image. This occurs because each eye functions with just the temporal hemiretina and therefore sends on information from only the contralateral visual field. In such a situation, it is necessary to ensure that the same visual stimulus is given to each eye by making the stimuli bilaterally equivalent (Hamilton et al., 1973;Ringo, 1990). Examples of such images are those made from horizontal lines or color bands or those constructed from many horizontally repeated subelements. The experimental stimuli used in this study were of this bilaterally equivalent type. Four are shown in Figure2. These same issues arise in behavioral evaluation of interhemispheric transfer in the split-chiasm animal. There, our stimuli proved effective at providing equivalent inputs to the two eyes (Ringo, 1990).
Fig. 2.
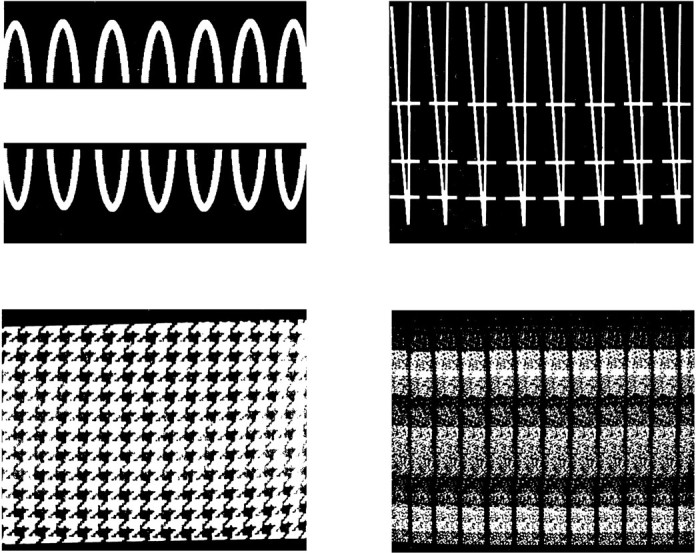
Four examples of the visual stimuli. Actual stimuli were in color. The stimuli were designed so that the left and right temporal hemiretinae had similar views.
Procedure. A running recognition task was used (Gaffan, 1977). Colored transparencies were displayed on a panel 27 cm in front of the monkey by a projector equipped with a fast shutter (opening time <5 msec). The size of the panel and projected images was 15 × 10 cm. Approximately 500 different bilaterally equivalent images were used. Twenty groups, each formed from seven transparencies, were presented during one session of cell recording, i.e., 140 trials. As we use the term here, each trial consisted of one presentation. Between presentations, there was a 4–5 sec intertrial interval, varied randomly for each trial.
In each “group of seven,” there were five copies of the same image (designated here as the experimental images) and two other images different from the experimental images (designated as supplemental images). Supplemental images were placed at random positions in the presentation sequence within each group of seven, with the restriction that not all five of the experimental images were to be presented in an uninterrupted sequence. The following is an example of the presentation sequence of 14 trials, composed of two groups of seven, with capital letters representing images, and the subscript indicating which eye viewed the image:
After use, a particular image was not reused for about 1 week. The requirement for bilateral equivalence was loosened for some of the supplemental images, because they were presented to only one eye and only once. The supplemental images were used to space out the repetitions of the experimental images and as probes to measure if the monkey’s response bias between new or repeat changes through the series or session.
The task of the monkey was to press the panel when a new image was displayed and to withhold its response when an image was repeated. Thus, in each group of seven the monkey was rewarded for pressing in response to the first presentation of an experimental image and to both supplemental images. The monkey was also rewarded for correctly not responding (nogo) to the repeated images, i.e., the 2nd, 3rd, 4th, and 5th presentations of the experimental image in each group of seven. Rewards were squirts of ∼0.5 ml of fruit juice. The monkey was informed about incorrect responses by a “puff” sound. The monkey viewed the panel monocularly. During the intertrial interval, both shutters were closed. At the beginning of each trial, one eye shutter was opened. One second later, a warning tone was given, and 500 msec later the eye position was checked. If gaze was within a 10° window centered in the middle of the display panel, the image was presented for 3 sec. If gaze was outside that window, the image was not presented, the shutter was closed, and the trial was repeated. Typically, <5% of trials were postponed because of such failures of fixation. The monkey could press the panel any time within the 3 sec display time. Not pressing the panel in that time period constituted anogo response.
The critical element of experimental manipulation in the present study was the presentation of an experimental image three times to one eye, followed by a switch in viewing eye and the presentation of the same image twice to the new eye. This is termed the “switching condition” and was used for one-half of the groups of seven. For comparison, the other half of the groups had all five presentations of the experimental image made to the same eye (termed the “nonswitching condition”). In addition, an independent distinction was made such that in one-half of the groups, the presentations started with the eye ipsilateral to the recorded unit, and in the other half with the eye contralateral to the recorded unit. Thus, one-quarter of the groups of seven had three ipsilateral presentations followed by two contralateral presentations; one-quarter had three contralateral presentations followed by two ipsilateral presentations; one-quarter had five ipsilateral presentations; and one-quarter had five contralateral presentations. These four types of groups were used in rotation. Five rotations through all four types constituted a session.
Typically, the monkeys ran five to six sessions each week. During experimentation, the monkeys had limited access to water. They received measured amounts of liquid per day (adjusted individually). The weights of the monkeys were monitored, and one day each week their access to water was unlimited.
Data analysis. The primary dependent variable was the spike count in the 100–400 msec period after onset of the image minus the spike count in the period from 300 to 0 msec before the onset. Except where specifically noted, all responses have the pre-onset spike count subtracted on a trial-by-trial basis.
Every re-presentation of an experimental image created a situation with a possible effect from previous exposure (memory). In the nonswitching condition, the viewing eye is unchanging, so memory effects were simply analyzed as a function of presentation number.
In the switching condition, the following three qualitatively different situations were analyzed for memory effects.
1. Initial memory: the response to the first presentation of the experimental image minus the response to the second presentation of that image.
2. Rebound from initial memory: the response to the fourth presentation of the experimental image minus the response to the third presentation (for switching conditions). This measure, of course, involves a change in viewing eye as well as a difference in previous experience. The difference in viewing eye was compensated for by averaging an equal number of ipsilateral-to-contralateral and contralateral-to-ipsilateral cases.
3. Memory after rebound: the response to the fourth presentation of the experimental image minus the response to the fifth presentation.
The time period for analysis was chosen to begin 100 msec after the image onset, because latencies in IT are typically ∼100 msec. The analysis period was stopped at 400 msec to limit any effects from response-related activity. The average latency for the behavioral response (the panel push) to the first experimental image was 660 msec, whereas 90% were longer than 524 msec.
In the analysis, differences at the p < 0.05 level were treated as statistically significant. Our analysis of the neuronal spike records was validated in two separate ways. First, the two authors wrote independent programs to measure the memory effects. These programs obtained the same values. Second, starting with a selection of spike records, peristimulus time histograms created by the analysis matched those from a commercial source (Datawave).
RESULTS
Cell selection
From 480 well isolated cells (123, 220, and 137 from the three monkeys), we selected cells for further analysis that were visually excited by both the ipsi- and contralateral stimulation and that did not show slow drifts in responsiveness (for example, a continuous increase or decrease of activity through the recording session). Only excited cells were examined, because a previous analysis that included these cells showed SSA to be much stronger in visually excited than in visually inhibited cells (Sobotka and Ringo, 1994).
Cell responsiveness (calculated separately for stimulation through each eye) was defined as the difference between averaged spike count in the period 100–400 msec after image onset and the period 0–300 msec before image onset. t tests were used for selection of cells with significant excited responses from each eye. A quadratic regression of response against sequential trial number was used to eliminate those cells with significant drifts in responsiveness across time (see Sobotka and Ringo, 1994). In this analysis, responses to the nonrepeated supplemental images were used (40 separate images for each cell), thereby avoiding any confound with SSA. A total of 92 cells (35, 38, and 19 from the three monkeys) qualified.
Behavioral data
The monkeys’ task was to press the display/response panel for the first presentation of an image and to withhold responses for repeated presentations. Figure 3 shows the average percentage of recognition responses (nogo) for the experimental images at each of the five positions (first through fifth presentation of the same image). Note that the monkeys, correctly, usually did not signal a recognition to the first presentation. Data are shown in two situations, first when all five presentations were made to the same eye (nonswitch), and second when there was a switch of eyes after the first three presentations (switch).
Fig. 3.
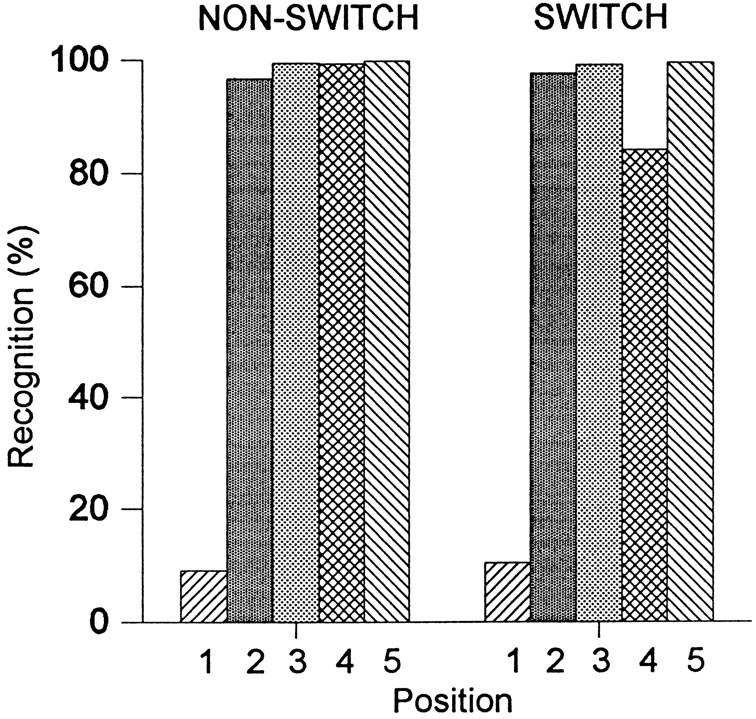
Percentage of behavioral recognition responses to presentations of the experimental images. Two conditions are shown. Thebars on the left show recognition responses when all images were presented to the same eye (NON-SWITCH). Thebars on the right show recognition responses when, after the first three presentations to one eye, the last two images were given to the other one (SWITCH). There are, appropriately, few recognition responses to the first presentations. The monkeys showed the most errors when they had to recognize the image as a repeat just after the viewing eye was switched (position 4 in the switching condition).
Recognition was clearly more difficult for the fourth presentation of the experimental image with a switch in the viewing eye than without the switch. After a switch of viewing eye before this fourth position, performance dropped to 86% correct. A repeated measures ANOVA on the monkeys’ performances with the repeated presentations (i.e., presentations two through five) shows an overall significant effect of presentation position (F(3,6) = 31.6;p < 0.0005). A significant interaction between condition (switch vs nonswitch) and position was also found (F(3,6) = 11.0; p < 0.05). Post hoc testing showed that, after the switch, recognition performance was lower than after any other re-presentation (minimumF(1,2) = 20.3; p < 0.05). As one might expect, there was no significant difference in performance for the first three presentations between the switching and nonswitching conditions (F(1,2) = 0.2;p > 0.1).
The behavioral data were also examined to determine if the monkeys maintained a consistent strategy throughout the testing. Two issues were addressed. First, did the animals show any change in strategy (or bias) in trials after a change in the viewing eye, and second, did the animals change strategy as trials progressed further into each group of seven, i.e., as the experimental image was presented more. To examine these issues, we analyzed the performances on the supplemental images which, because they were presented singly and pseudorandomly in the sequence, served as probes to measure bias. That is, if the animals were changing their bias between recognition and novelty, it would show up in changing performance on the supplemental images presented in those circumstances.
Performances on supplemental images are presented in Table1, categorized by the position of the experimental image before which they appeared. Performance was not significantly influenced by the position of the supplemental image as determined by a one-factor (position, with five levels) ANOVA using the monkeys’ performances as the source of variability (F(4,8) = 1.52; p > 0.1).
Table 1.
Percent of errors committed during presentation of supplemental images introduced before experimental images at five different positions
| 1st | 2nd | 3rd | 4th | 5th |
|---|---|---|---|---|
| 3.5% | 6.4% | 4.7% | 2.9% | 3.9% |
Each supplemental presentation was categorized by the position of the experimental presentation which might, pseudorandomly, have been presented instead.
To determine whether there was any change in the strategy adopted by the monkeys after a change in viewing eye, we examined the performances on supplemental images after such change, compared with performances on supplemental images still in the same position in the sequence but without a change in the viewing eye. The errors were analyzed in a two-factor ANOVA with the performances of the different monkeys as the source of variability. The first factor in the analysis was condition, change in viewing eye versus no change in viewing eye immediately before a supplemental image. The second factor was position, a supplemental image before the first presentation versus a supplemental image before the fourth presentation of an experimental image (these are the only two positions at which changes of viewing eye occurred). The analysis showed no significant effects, i.e., no apparent shifts in strategy. The animals’ performances were not influenced by a switch in the viewing eye (F(1,2) = 0.43;p > 0.1). Performance also did not depend on the position that the supplemental image occupied among the repeats of the experimental image (F(1,2) = 0.18;p > 0.1). Interaction between position and condition was not significant (F(1,2) = 3.31;p > 0.1). These results indicate that the monkeys used a consistent strategy regardless of position in the sequence or switching in the viewing eye.
Single-unit data
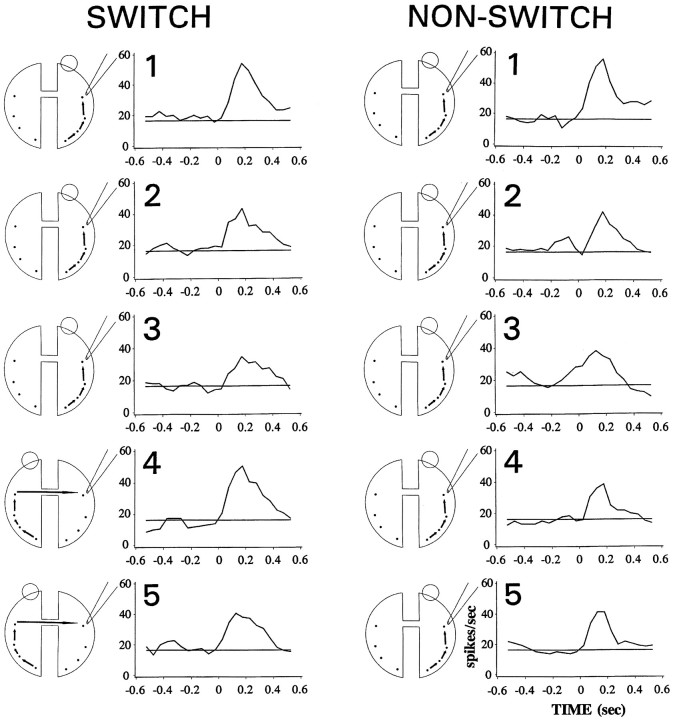
Figure 4 shows averaged peristimulus time histograms (PSTH) from a prototypical cell in the different experimental conditions. In the nonswitching condition, each experimental image was presented five times to the same eye. In the switching condition, the first three presentations were given to one eye, whereas the last two were presented to the other eye. In the nonswitching condition, spike frequency was greatest in response to the first presentation of the experimental images and decreased with repetition. In the switching condition, there was a reduced response to the re-presentation of the image to the same eye (positions 2 and 3). The critical point, however, is that there was a rebound from this adaptation when an image was presented for the first time to the new eye. The response elicited when an image was re-presented to the other eye was like the response to a new image.
Fig. 4.
Peristimulus time histograms from an IT cell to repeated presentations of the same image in the switching (left column) and nonswitching (right column) condition. The schematic drawings to the left of each PSTH show the presumed pathway through which visual stimulation reaches the recorded cell. Open circles represent the viewing eye; the other eye is covered. With repetition, there was a decrease in spike activity. However, when the viewing eye was switched (between the third and fourth presentation) a significant rebound from the decrement was observed. Zero on the abscissa is image onset.
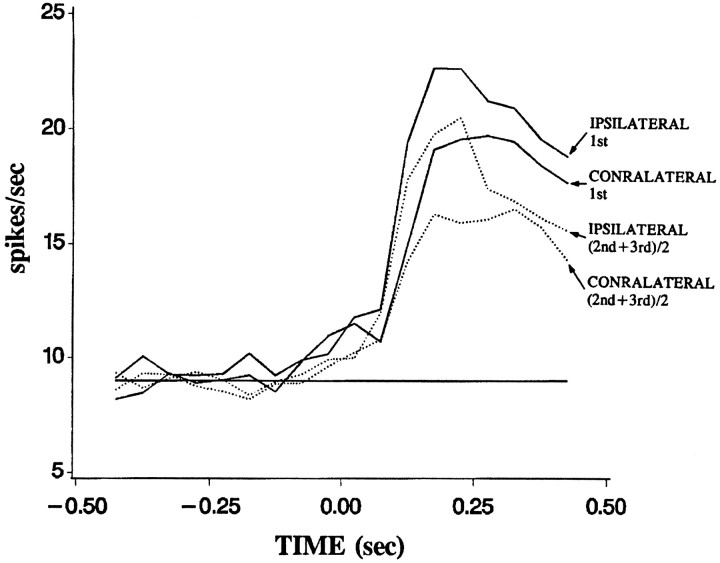
Memory effects in the period from 100–400 msec after image onset showed similar values regardless of whether presentations were ipsilateral or contralateral to the recorded side. Figure5 shows the response histograms averaged across all 92 cells, which passed the qualifiers listed above. The solid curves show the responses to ipsilateral and to contralateral first presentations, whereas the dashed curves show the responses to repeated presentations. While the magnitude of the response to the ipsilateral eye (contralateral visual field) is greater, the general shape and memory effects appear similar for ipsilateral and contralateral presentations. Initial memory effects, i.e., the difference in response between the first and second presentations, averaged 2.20 spikes/sec for ipsilateral presentation of the two images and 2.18 spikes/sec for contralateral presentation (averaged across all 92 cells). These values were not significantly different from each other (t = 0.01; p > 0.1). The memory rebound, i.e., the difference in response between the third presentation made to one eye and the fourth presentation made to the other eye, did not differ significantly for ipsilateral-to-contralateral switches and contralateral-to-ipsilateral switches. This issue is taken up again below. Memory after the rebound, i.e., the difference in response between the fourth and fifth presentation when those followed a switch in the viewing eye, averaged 2.7 spikes/sec for the ipsilateral eye and 2.8 spikes/sec for the contralateral eye. These did not differ significantly (t = 0.1; p > 0.1). Therefore, in subsequent analyses we present data averaged across the particular eye used, while, of course, maintaining the distinctions based on position in the sequence, and switching versus nonswitching conditions.
Fig. 5.
Response time courses. Population average of the spike density for the first presentation of the experimental stimuli to the ipsilateral eye (IPSILATERAL 1st), the re-presentations to the ipsilateral eye (IPSILATERAL (2nd+3rd)/2), initial presentation to the contralateral eye (CONTRALATERAL 1st), and the re-presentations to the contralateral eye (CONTRALATERAL (2nd+3rd)/2). Ipsilateral and contralateral responses to both initial and re-presentations are qualitatively similar. The re-presentations are the average of the second and third presentations.
Figure 6 shows the responses in the period from 100–400 msec after the onset of the image. Average data from all 92 cells are shown to subsequent repetitions of the same image when all five presentations were viewed by the same eye (nonswitch) and when there was a switch of viewing eye after the first three presentations (switch). Statistical analysis showed highly significant memory effects. In the switching condition, cell activity evoked by the first presentation of the experimental images was 10.2 spikes/sec above the baseline activity. The response was weaker when the same image was presented a second time (8.1 spikes/sec above baseline, a 21% decrease compared with the first presentation, t test:n = 92; t = 3.6; p < 0.001) or a third time (7.5 spikes/sec, 27% decrease;t = 3.6; p < 0.001).
Fig. 6.
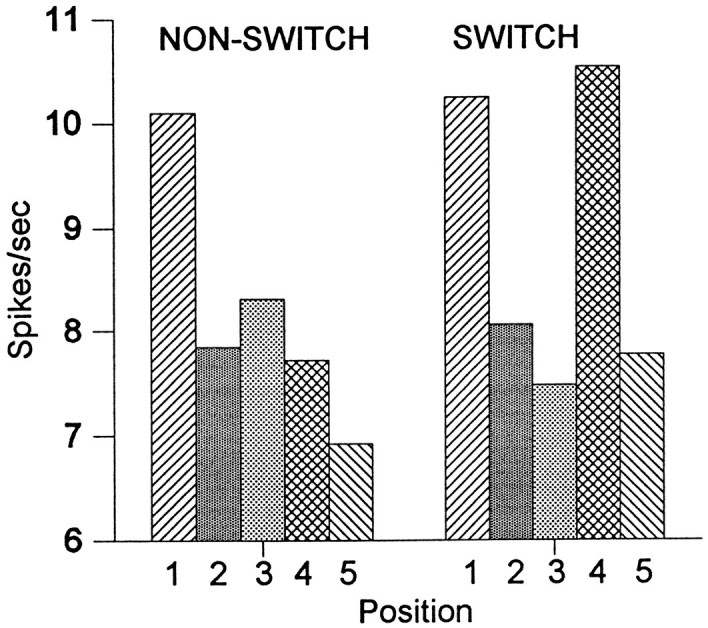
Population average of unit responses evoked by the five presentations of the same image in the nonswitching and switching conditions. There is a full rebound from adaptation of the unit activity in the fourth position in the switching condition. Values shown are the difference between the spike rate in the period from 100 to 400 msec after the image onset and the spike rate from 300 to 0 msec before image onset.
When the viewing eye was switched (the fourth presentation in the switching condition), a complete rebound from this adaptation was observed (4th-3rd: t = 5.4; p < 0.0001). The average response to the fourth presentation (10.5 spikes/sec) was not significantly different from that to the first one (t = 0.4; p > 0.1). In the switching condition, the last presentation of the image but only the second presentation to that eye again produced a decrease in cell activity (7.8 spikes/sec, 4th-5th: t = 5.7; p < 0.0001).
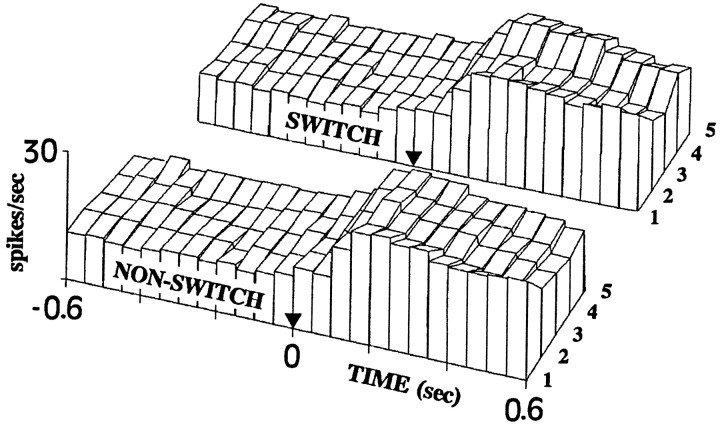
The three-dimensional surface graph in Figure 7 presents the time course of responses to the five repetitions of the experimental images in the nonswitching and switching conditions averaged across all cells. Spike frequency was calculated in 50 msec time bins from 0.6 sec before until 0.6 sec after the image onset.
Fig. 7.
Three-dimensional surface map of PSTHs to the five presentations of the experimental images. Histograms forming the map represent averaged (across all cells and images) frequency of spikes (in spikes/sec) in 50 msec time bins. There is a decrease of cell activity with repetition and a rebound from this decrement in the switching condition. Cell activity to the first presentation after the viewing eye is switched (4) returns to the level of a new presentation (1).
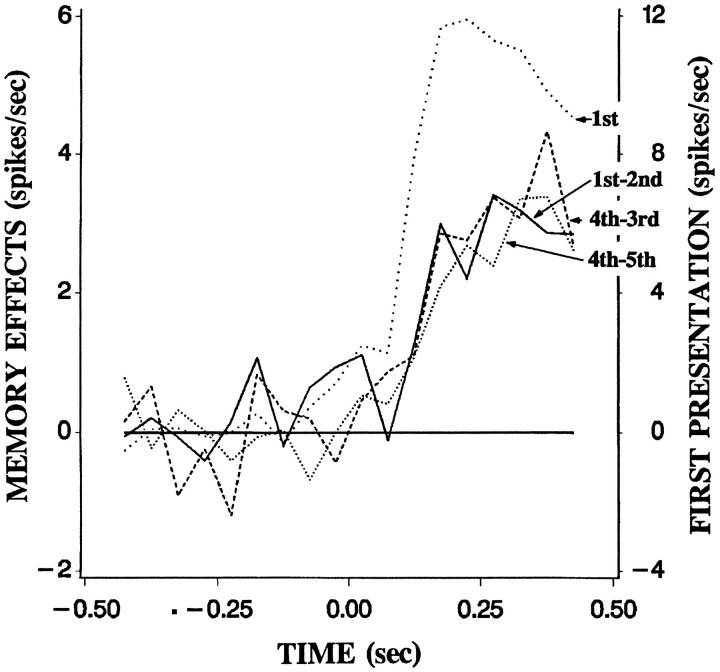
Figure 8 shows PSTHs to the first presentation and the three memory measurements observed in the switching condition. In the time period from 100 to 150 msec after image onset, visual responses were already evident (7.4 spikes/sec; t = 6.0;p < 0.0001). In contrast, the initial memory did not differ from zero (0.8 spikes/sec, t = 1.0;p > 0.1). The initial memory reached significance in the latter time period of 150–200 msec (3.1 spikes/sec;t = 3.5; p < 0.001). The rebound from memory and the memory after rebound had time courses similar to those of the initial memory.
Fig. 8.
Population average of unit activity evoked by the first presentation of the experimental images (dotted linelabeled 1st, referred to the right-hand scale) and the three measures of memory (referred to the left-hand scale). Thecontinuous line depicts initial memory, the difference in frequency of spikes between the first and second presentation. Thebroken line depicts the rebound from memory, the difference between the fourth and third presentation. The dotted linedepicts the memory after rebound, the difference between the fifth and fourth presentation. Averaged data from all cells in 50 msec time bins in the switching condition are shown.
Responses via the ipsilateral eye were somewhat larger than via the contralateral eye (overall by 1.22 times). This difference averaged out when an equal number of ipsilateral and contralateral responses contributed, as in the analyses above. However, for comparison of the two types of switches (contralateral-to-ipsilateral vs ipsilateral-to-contralateral) such averaging is not available. To allow this comparison, we adjusted the contralateral responses up to the level of the ipsilateral responses based on the responses to other trials (all those in the nonswitch condition). Adjustment was made on a cell-by-cell basis (similar results were obtained if a single, global adjustment was calculated and used across all cells). After adjustment, the contralateral-to-ipsilateral switch produced a rebound of 3.0 spikes/sec, while the ipsilateral-to-contralateral switch produced a rebound of 3.7 spikes/sec. These did not differ significantly (t = 0.3; p < 0.1).
The analysis presented previously showed a complete absence of SSA after a switch of viewing eye. That is, after an eye switch, the next repetition of the stimulus elicited the same response, on average, that the very first presentation did. This result is somewhat surprising. The analysis was done on the population of qualified cells, and that is the best overall summary, but could conceivably hide a balance of significantly positive and significantly negative responding individual units. Further analysis, however, fails to support such a possibility. Among the 92 qualified units examined individually with a ttest and a p = 0.05 significance threshold, only three showed a significant decrease and four showed a significant increase (comparing the first presentation with the fourth presentation, which followed the switch in viewing eye). Given the population size (92), one may expect approximately five such cells from chance fluctuation alone. If instead a p = 0.01 threshold was chosen, one cell showed significant decrease and one showed significant increase. In this case, one may expect approximately one such cell. No cells showed a consistent and strong enough change in either direction to meet a p = 0.001 significance threshold. Thus, as at the population level, there is no evidence of SSA at the individual unit level.
The above analyses are for all the units recorded in IT. However, there have been a number of studies implicating the more medial and ventral sections of IT and perirhinal cortex in recognition memory (Horel et al., 1987; Zola-Morgan et al., 1989; Gaffan and Murray, 1992). Therefore, we performed a separate analysis including only those cells recorded from the inferior temporal gyrus (these units were medial to the anterior medial temporal sulcus but lateral to the lateral bank of the rhinal sulcus). This subset (n = 30) showed the same characteristics as the whole set. In the nonswitch condition, there was a stimulus-specific reduction in the response amplitude with increasing presentation number. More importantly, in the switch condition there appeared to be a full recovery of response amplitude after the switch of viewing eye (the average spike rate, above baseline, in the 100–400 msec period after presentation for the five positions was, in sequential order, 7.2, 5.5, 4.4, 7.0, and 5.9 spikes/sec).
Examination of the unit response data affords an opportunity to test if our bilaterally equivalent images succeeded in providing equivalent stimuli to the two eyes. The technique we used was to determine whether the unit responses from stimulation through the two eyes correlated (across images). For comparison, we measured the correlation (across images) of responses to repeated presentations of the same image to the same eye. This latter measure provided an estimate of the correlation to expect from responses to perfectly similar conditions given the amount of averaging used. A lower correlation between responses from presentation to the two eyes compared with responses to separate presentations to the same eye could come from two sources. First, if the images are not fully equivalent between the two eyes, and second, if the unit responses are different for the two separate access pathways (one including the AC). Because we know that the second factor plays some role, a comparison of the two correlations provides a minimum estimate of how equivalent the images are between the eyes. We restricted this examination to the units that were significantly responsive to stimulation through either eye and further used only the half of the cells that showed the strongest stimulus-specific responses (because stimulus specificity is required to produce nonzero correlation).
Correlations for each cell were computed after averaging the activity to the first three and separately, the last two repetitions of each image. We used a nonparametric (rank order) correlation to eliminate the influence of differences in general responsiveness to ipsilateral and contralateral presentations. For each cell, correlations were calculated between these ranks in four different conditions: (1) the first three images viewed by the contralateral eye followed by the last two viewed by the ipsilateral eye; (2) contralateral to contralateral; (3), ipsilateral to contralateral; and (4), ipsilateral to ipsilateral. Averaged correlations across all 46 qualifying cells were 0.55 in the ipsilateral–ipsilateral condition; 0.52 in the contralateral–contralateral condition; 0.33 in the ipsilateral–contralateral condition; and 0.42 in the contralateral–ipsilateral condition. All four of those values were significantly different from zero (in all cases, after transformations to normalize; t > 4.5; p < 0.0001). Thus, the correlations between responses to the first three and the last two repeats in the switching condition are statistically significant and only moderately less than those in the nonswitching conditions. Considering that some of that difference in correlation must be accounted for by the different neural pathways, this result suggests a high similarity in the visual stimuli provided by our images through the left and the right eye.
Another examination of the data provides a further test of whether our images succeeded in providing equivalent stimuli, i.e., provided independence of view. For this test, we took the groups in which the presentations were all made to the same eye. We then asked if a cell’s SSA was greater in trials in which the gaze position on a repetition was similar to previous gaze positions compared with the SSA from trial in which gaze position fell outside of previous bounds. For this analysis, we let the gaze position on all earlier presentations of the experimental image define a box such that gaze positions within that box were between previous gaze fixation positions (both horizontally and vertically). Thus, for those trials in which the monkey’s gaze position (i.e., its view of the image) fell outside of this box, the view of the image would potentially be different (as far as our images allowed this). In fact, our images appeared sufficiently invariant for different views to prevent significant rebound from slightly new views of the image. There was no significant difference in the amount of adaptation seen for trials in which the view centered inside the box defined by previous views, compared with the adaptation found in trials in which the view centered outside that box. This was true for all the possible positions in the sequence of five presentations of the experimental image (all p > 0.1; t test). The average amplitude of the adaptation was actually slightly, but not significantly, higher for trials in which gaze rested outside of the previously defined box compared with trials in which gaze rested within the box. In the 78 cells (of the main group of 92) for which we have retained eye-position data, there was a 2.8 spike/sec reduction from the first presentation for trials with fixation within previous limits compared with a 3.1 spike/sec reduction from the first presentation for trials with fixation outside of those limits.
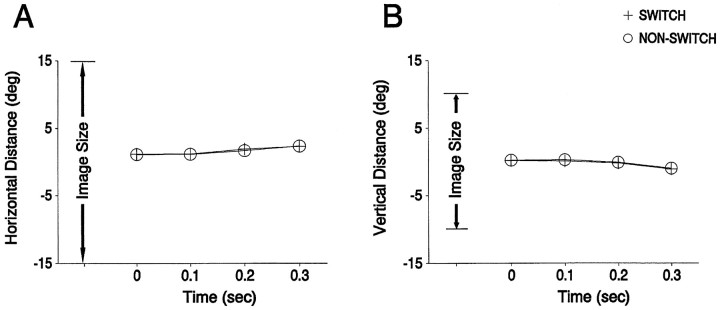
We examined the eye position data to determine whether some consistent difference in eye position or movement would explain the difference between IT unit responses for the fourth presentation of the experimental image in switch and nonswitch conditions. These positions are shown separately for switch and nonswitch trials in Figure9. It is apparent from Figure 9 that eye positions did not differ between switch and nonswitch conditions. This is confirmed by a three-factor ANOVA, with the four time points as one factor, the two movement directions (horizontal and vertical) as the second factor, and trial type (switch or nonswitch) as the third factor. There was no effect of trial type on eye position (F(1,77) = 0.55; p > 0.1) or any interaction between trial type and other factors (allp < 0.1). Trial-by-trial variability also did not differ between switch and nonswitch trials, as measured by the SD of the eye positions (which did not differ significantly).
Fig. 9.
Similarity of eye positions for switch and nonswitch presentations (in each case the fourth in the sequence). The average eye positions at four different times are shown for horizontal position (A) and for vertical position (B). The four time points (0, 100, 200, and 300 msec after image onset) for the times of the eye position measurement correspond to our analysis period of 100–400 msec after image onset, allowing for a 100 msec latency from image onset to IT response. These data are averaged across all 78 of our main group of 92 units, for which the eye-position data were retained.
Finally, we also examined whether the firing rates differed between trials in which the animal made an error compared with those trials performed correctly. No consistent effects were seen, although in many cases so few trials with errors were available that no analysis was possible. However, after a switch in viewing eye before the fourth presentation of the experimental image, there were sufficient errors to allow an examination. In that case, the average rebound was 2.4 spikes/sec on correct trials and 2.3 spikes/sec on error trials (in both cases, averaged for those cells, n = 60, which had at least one error in that circumstance).
DISCUSSION
In our animals, with a transected optic chiasm and corpus callosum and an intact AC, repeated monocular stimulation to the same eye (nonswitch condition) produced SSA in cells recorded from IT. This effect was observed equally regardless of viewing eye.
SSA disappeared when, after three presentations to one eye, the image was presented for the first time to the other eye. SSA disappeared regardless of whether the initial presentations were to the contralateral eye and the later presentation to the ipsilateral eye, or vice versa. That is, when on the fourth presentation viewing was switched to a new eye, SSA disappeared from IT in both hemispheres. Nonetheless, the great bulk of images presented in that situation were recognized by the animals. Thus, it appears that SSA in IT is not required for recognition. The SSA disappeared in the population average without any apparent sparing of a few “memory” cells. That is, our examination of the distribution of adaptation levels for the individual units found no more outliers than expected by chance (see Results). Similarly, a separate analysis of units from inferior temporal gyrus found that the switch in viewing eye eliminated SSA in that subset as well.
These results should not be over-interpreted. It may well be that SSA, when available, is a substantial contributor to recognition memory. Consistent with this idea, the interhemispheric step that (perhaps among other things) eliminated SSA, reduced performance by our monkeys. That reduction should not be dismissed as trivial. A drop from 99% correct to 86% correct, with a 10% false-positive rate, is a drop from 3.61 to 2.32 in d′ terms. The possibility that cells in other areas might still show SSA (which did not feedback or forward strongly enough to our IT units to influence recordings) is an interesting one to be pursued in future studies.
It should be noted that the above conclusion does not depend on what caused the disappearance of the SSA. Whatever one may suppose to have caused that disappearance, the situation was created in which behavioral recognition occurred in the absence of SSA in IT units. Nonetheless, a number of explanations seem unlikely. First, it seems unlikely that the animal changed its strategy when the viewing eye was switched, because the behavior to the probe stimuli did not change (Table 1). Second, it seems unlikely that the pattern of eye position changed with the switch because the average position and its SD are not different in switch and nonswitch trials (Fig. 9).
It is interesting to consider these results in terms of neural populations and assemblies. The disappearance of SSA after switching the viewing eye suggests a specificity to the memory pathway in this case. The failure of the SSA to generalize across viewing eye seems unlikely to be fully explicable in terms of ipsilateral/contralateral differences in the receptive fields or response specificities of the units involved. This is because the units we examined were responsive through either eye and showed well correlated response specificity between ipsilateral and contralateral views, as would be expected based on previous work (Gross and Mishkin, 1977). Nonetheless, the memory traces forming the SSA were retrieved only when the input came through the same visual pathway with which they were originally encoded.
Footnotes
This work was supported by Grants NS24217 and NS26526 from the National Institute of Neurological Diseases and Stroke. Sincere thanks to Chris Bunce, Mark Diltz, and Steve O’Neill for expert technical assistance and to Robert Doty for valuable discussion.
Correspondence should be addressed to James L. Ringo, Box 642, Department of Physiology, University of Rochester, Rochester, NY 14642-8642.
REFERENCES
- 1.Baylis GC, Rolls ET. Responses of neurons in the inferior temporal cortex in short and serial recognition memory tasks. Exp Brain Res. 1987;65:614–622. doi: 10.1007/BF00235984. [DOI] [PubMed] [Google Scholar]
- 2.Brown MW, Wilson FAW, Riches IP. Neuronal evidence that inferomedial temporal cortex is more important than hippocampus in certain processes underlying recognition memory. Brain Res. 1987;409:158–162. doi: 10.1016/0006-8993(87)90753-0. [DOI] [PubMed] [Google Scholar]
- 3.Dean P. Choice reaction times for pattern discriminations in monkeys with inferotemporal lesions. Neuropsychologia. 1974;12:465–476. doi: 10.1016/0028-3932(74)90076-1. [DOI] [PubMed] [Google Scholar]
- 4.Delacour J. Role of temporal lobe structures in visual short-term memory, using a new test. Neuropsychologia. 1977;15:681–684. doi: 10.1016/0028-3932(77)90072-0. [DOI] [PubMed] [Google Scholar]
- 5.Demeter S, Rosene DL, Van Hoesen GW. Fields of origin and pathways of the interhemispheric commissures in the temporal lobe of macaques. J Comp Neurol. 1990;302:29–53. doi: 10.1002/cne.903020104. [DOI] [PubMed] [Google Scholar]
- 6.Doty RW, Ringo JL, Lewine JL. Forebrain commissures and visual memory: a new approach. Behav Brain Res. 1988;29:267–280. doi: 10.1016/0166-4328(88)90031-9. [DOI] [PubMed] [Google Scholar]
- 7.Fahy FL, Riches IP, Brown MW. Neuronal activity related to visual recognition memory: long-term memory and the encoding of recency and familiarity information in the primate anterior and medial inferior temporal and rhinal cortex. Exp Brain Res. 1993;96:457–472. doi: 10.1007/BF00234113. [DOI] [PubMed] [Google Scholar]
- 8.Fuster JM, Bauer RH, Jervey JP. Effects of cooling inferotemporal cortex on performance of visual memory tasks. Exp Neurol. 1981;71:398–409. doi: 10.1016/0014-4886(81)90098-4. [DOI] [PubMed] [Google Scholar]
- 9.Gaffan D. Monkeys’ recognition memory for complex pictures and the effect of fornix transection. Q J Exp Psychol. 1977;29:505–514. doi: 10.1080/14640747708400626. [DOI] [PubMed] [Google Scholar]
- 10.Gaffan D, Murray EA. Monkeys (Macaca fascicularis ) with rhinal cortex ablations succeed in object discrimination learning despite 24 hr intertrial intervals and fail at matching to sample despite double sample presentations. Behav Neurosci. 1992;106:30–38. doi: 10.1037//0735-7044.106.1.30. [DOI] [PubMed] [Google Scholar]
- 11.Gross CG, Mishkin M. The neural basis of stimulus equivalence across retinal translation. In: Harnad S, Doty RW, Goldstein L, Jaynes J, Krauthamer G, editors. Lateralization in the nervous system. Academic; New York: 1977. pp. 109–122. [Google Scholar]
- 12.Hamilton CR, Tieman SB, Brody BA. Interhemispheric comparison of mirror image stimuli by chiasm-sectioned monkeys. Brain Res. 1973;58:415–425. doi: 10.1016/0006-8993(73)90011-5. [DOI] [PubMed] [Google Scholar]
- 13.Horel JA, Pytko-Joiner DE, Voytko ML, Salsbury K. The performance of visual tasks while segments of the inferotemporal cortex are suppressed by cold. Behav Brain Res. 1987;23:29–42. doi: 10.1016/0166-4328(87)90240-3. [DOI] [PubMed] [Google Scholar]
- 14.Judge SJ, Richmond BJ, Chu FC. Implantation of magnetic search coils for measurement of eye position: an improved method. Vision Res. 1980;20:535–538. doi: 10.1016/0042-6989(80)90128-5. [DOI] [PubMed] [Google Scholar]
- 15.Li L, Miller EK, Desimone R. The representation of stimulus familiarity in anterior inferotemporal cortex. J Neurophysiol. 1993;69:1918–1929. doi: 10.1152/jn.1993.69.6.1918. [DOI] [PubMed] [Google Scholar]
- 16.Miller EK, Desimone R. Parallel neuronal mechanisms for short-term memory. Science. 1994;263:520–522. doi: 10.1126/science.8290960. [DOI] [PubMed] [Google Scholar]
- 17.Miller EK, Lin L, Desimone R. A neural mechanism for working and recognition memory in inferior temporal cortex. Science. 1991;254:1377–1379. doi: 10.1126/science.1962197. [DOI] [PubMed] [Google Scholar]
- 18.Mishkin M. Visual mechanisms beyond the striate cortex. In: Russell R, editor. Frontiers of physiological psychology. Academic; New York: 1966. pp. 77–123. [Google Scholar]
- 19.Mishkin M. A memory system in the monkey. Philos Trans R Soc Lond [Biol] 1982;298:85–95. doi: 10.1098/rstb.1982.0074. [DOI] [PubMed] [Google Scholar]
- 20.Miyashita Y, Chang HS. Neuronal correlate of pictorial short-term memory in the primate temporal cortex. Nature. 1988;331:67–69. doi: 10.1038/331068a0. [DOI] [PubMed] [Google Scholar]
- 21.Riches IP, Wilson FAW, Brown MW. The effects of visual stimulation and memory on neurons of the hippocampal formation and the neighboring parahippocampal gyrus and inferior temporal cortex of the primate. J Neurosci. 1991;11:1763–1779. doi: 10.1523/JNEUROSCI.11-06-01763.1991. [DOI] [PMC free article] [PubMed] [Google Scholar]
- 22.Ringo JL. Interhemispheric transfer of visual discriminations in split-chiasm monkeys (Macaca nemestrina) and its measurement. Behav Neurosci. 1990;104:900–905. doi: 10.1037//0735-7044.104.6.900. [DOI] [PubMed] [Google Scholar]
- 23.Ringo JL (1996) Stimulus specific adaptation in inferior temporal and medial temporal cortex of the monkey. Behav Brain Res, in press. [DOI] [PubMed]
- 24.Ringo JL, O’Neill SG. Indirect inputs to ventral temporal cortex of monkey: the influence on unit activity of alerting auditory input, interhemispheric subcortical visual input, reward, and the behavioral response. J Neurophysiol. 1993;70:2215–2225. doi: 10.1152/jn.1993.70.6.2215. [DOI] [PubMed] [Google Scholar]
- 25.Ringo JL, Sobotka S, Diltz MD, Bunce CM. Eye movements modulate activity in hippocampal and inferotemporal neurons. J Neurophysiol. 1994;71:1285–1288. doi: 10.1152/jn.1994.71.3.1285. [DOI] [PubMed] [Google Scholar]
- 26.Robinson DA. A method of measuring eye movement using a scleral search coil in magnetic field. IEEE Trans Biomed Eng. 1963;10:137–145. doi: 10.1109/tbmel.1963.4322822. [DOI] [PubMed] [Google Scholar]
- 27.Rolls ET, Baylis GC, Hasselmo ME, Nalwa V. The effect of learning on the face selective responses of neurons in the cortex in the superior temporal sulcus of the monkey. Exp Brain Res. 1989;76:153–164. doi: 10.1007/BF00253632. [DOI] [PubMed] [Google Scholar]
- 28.Sobotka S, Ringo JL. Investigation of long term recognition and association memory in unit responses from inferotemporal cortex. Exp Brain Res. 1993;26:28–38. doi: 10.1007/BF00230436. [DOI] [PubMed] [Google Scholar]
- 29.Sobotka S, Ringo JL. Stimulus specific adaptation in excited but not in inhibited cells in inferotemporal cortex of Macaque. Brain Res. 1994;646:95–99. doi: 10.1016/0006-8993(94)90061-2. [DOI] [PubMed] [Google Scholar]
- 30.Sullivan MV, Hamilton CR. Memory establishment via the anterior commissure of monkeys. Physiol Behav. 1973;11:873–879. doi: 10.1016/0031-9384(73)90283-7. [DOI] [PubMed] [Google Scholar]
- 31.Trevarthen C. Specialized lesions: the split brain technique. In: Myers RD, editor. Methods in psychobiology. Academic; London: 1972. pp. 251–284. [Google Scholar]
- 32.Wilson M, Kaufman HM, Zieler RE, Lieb JP. Visual identification and memory in monkeys with circumscribed inferotemporal lesions. J Comp Physiol Psychol. 1972;78:173–183. doi: 10.1037/h0032819. [DOI] [PubMed] [Google Scholar]
- 33.Winters WD, Kado RT, Adey WR (1969) A stereotaxic brain atlas for Macaca nemestrina. Berkeley: University of California.
- 34.Zola-Morgan S, Squire LR, Amaral DG, Suzuki WA. Lesions of perirhinal and parahippocampal cortex that spare the amygdala and hippocampal formation produce severe memory impairment. J Neurosci. 1989;9:4355–4370. doi: 10.1523/JNEUROSCI.09-12-04355.1989. [DOI] [PMC free article] [PubMed] [Google Scholar]


