

Abstract
The mechanism of sensory transduction in chemosensory neurons of the vomeronasal organ (VNO) is not known. Based on molecular data, it is likely to be different from that mediating sensory transduction in the main olfactory system. To begin to understand this system, we have characterized the electrophysiological properties of dissociated mouse VNO neurons with patch-clamp recording. Sensory neurons were distinguished from nonsensory neurons by the presence of a dendrite, by immunoreactivity for olfactory marker protein, and by the firing of action potentials. The resting potential of VNO neurons was approximately −60 mV, and the average input resistance was 3 GΩ. Current injections as small as 1–2 pA elicited steady trains of action potentials that showed no sign of adaptation during a 2 sec stimulus duration. The voltage-gated conductances in VNO neurons are distinct from those in olfactory neurons. The Na+ current is composed of two components; the major component was TTX-sensitive (Ki = 3.6 nm). The outward K+ current activates at −30 mV with kinetics 10 times slower than for K+ currents in olfactory neurons. The Ca2+ current is composed of at least two components: an L-type current and a T-type current that activates at −60 mV and is not found in olfactory neurons. We find no evidence for cyclic nucleotide-gated channels in VNO neurons under a variety of experimental conditions, including those that produced large responses in mouse olfactory neurons, which is further evidence for a novel transduction pathway.
Keywords: mouse, olfactory, vomeronasal, sensory transduction, patch-clamp, voltage-gated channel, cyclic nucleotide-gated channel
Chemosensation in terrestrial vertebrates is achieved by at least two distinct nasal organs: the olfactory epithelium (OE) and the vomeronasal organ (VNO). The OE and VNO are thought to detect different classes of chemicals and to mediate different behavioral and neuroendocrine responses. In mice and other rodents, the VNO has been shown to mediate (at least in part) the response to pheromones, chemicals communicated between animals of the same species that convey information primarily regarding reproductive and social status (for review, see Keverne, 1983; Halpern, 1987;Wysocki and Meredith, 1987). In rodents and other mammals, the VNO consists of two epithelial tubes encased in bone that lie at the base of the rostral portion of the nasal cavity and send projections to the accessory olfactory bulb (Fig. 1) (Cajal, 1911; Barber and Raisman, 1974) (for review, see Keverne, 1983).
Fig. 1.

Schematic drawing of the mouse nasal cavity showing the location of the VNO and the turbinates of the OE. The VNO is shown encased in a bony shell. It communicates with the nasal cavity through a duct, not drawn to scale. OE, olfactory epithelium; VNO, vomeronasal organ; OB, olfactory bulb; AOB, accessory olfactory bulb.
Despite similarities in ontogeny (Garrosa et al., 1986) and morphology, olfactory neurons and VNO neurons are likely to use distinct mechanisms of sensory transduction. In olfactory neurons, one well studied pathway for transduction involves seven-transmembrane odorant receptors, a stimulatory heterotrimeric G-protein, adenylyl cyclase, and the generation of cAMP (for review, see Reed, 1992; Ronnett and Snyder, 1992). cAMP opens a cationic heteromeric cyclic nucleotide-gated (CNG) channel that depolarizes the membrane potential (Nakamura and Gold, 1987). Each of these components has been cloned, including a large family of receptors, a G-protein (Gαolf), an adenylyl cyclase (ACIII), and two CNG channel subunits (rOCNC1, rOCNC2;Jones and Reed, 1989; Bakalyar and Reed, 1990; Dhallan et al., 1990;Ludwig et al., 1990; Buck and Axel, 1991; Bradley et al., 1994; Liman and Buck, 1994). In situ hybridization, Northern blot, and PCR analyses have shown that Gαolf, rOCNC1, and ACIII are not expressed in the VNO (Dulac and Axel, 1995; Berghard et al., 1996). rOCNC2 is expressed in the VNO (Berghard et al., 1996), but it is also expressed in the OE, where it is a subunit of a channel with rOCNC1 (Bradley et al., 1994; Liman and Buck, 1994). Because rOCNC2 does not form detectable channels when expressed alone in a heterologous expression system, it is not clear whether it is functional in the VNO. Recently, putative pheromone receptors have been cloned from rat VNO, and they constitute a novel family of seven-transmembrane receptors with no sequence similarity to the olfactory receptors (Dulac and Axel, 1995).
To begin to understand transduction in the VNO, we have characterized the electrical properties of freshly dissociated mouse VNO neurons. Voltage- and ligand-gated conductances of olfactory neurons have been characterized for a number of different vertebrate species, including rat (Lynch and Barry, 1991; Trombley and Westbrook, 1991), mouse (Maue and Dionne, 1987), salamander (Trotier, 1986; Firestein and Werblin, 1987), frog (Schild, 1989; Pun and Gesteland, 1991), and fish (Miyamoto et al., 1992; Nevitt and Moody, 1992) and have established a role for CNG channels in mediating sensory transduction in these cells (Nakamura and Gold, 1987; Kurahashi, 1990; Firestein et al., 1991a; Dionne and Dubin, 1994; Ache and Zhainazarov, 1995). A characterization of electrical properties of VNO neurons has previously been undertaken only in the frog and turtle (Trotier et al., 1993, 1996; Taniguchi et al., 1995, 1996). In these experiments, no apparent differences were found between VNO and olfactory neurons. In contrast, we find that ion currents in mouse VNO neurons are distinct from those in olfactory neurons. Furthermore, we find no evidence for functional CNG channels in VNO neurons, which is additional evidence for different transduction pathways.
MATERIALS AND METHODS
Dissociation of vomeronasal and olfactory neurons.Six-week-old Cd1/nude mice were kept in an isolation facility and killed by cervical dislocation or CO2 inhalation. The dissociation protocol was a modification of that used by Maue and Dionne (1987) for the dissociation of mouse olfactory neurons. The VNO was removed by retracting the palate, breaking the front incisors, and pulling out the intact VNO within its bony encasing. The epithelium was dissected free of the bone, removed to divalent-free PBS supplemented with penicillin–streptomycin solution (1:100 dilution; Gibco, Gaithersburg, MD) and cut into small pieces. Crude collagenase (1 mg/ml of type I; Sigma, St. Louis, MO) and trypsin (1 mg/ml; Sigma) were added, and the tissue was incubated at 35°C for 30 min with agitation. The small pieces of tissue were transferred through several washes with divalent-free PBS to solution supplemented with DNase (40 mg/ml; Worthington Biochemical, Freehold, NJ). The tissue was gently triturated with a fire-polished Pasteur pipette, and cells were either immediately plated on a clean glass coverslip or stored at 4°C for up to 5 hr and then plated. VNO neurons were also prepared without enzymes by incubating the tissue in divalent-free PBS for 1–2 hr and then scraping the surface of the epithelium with forceps, followed by gentle trituration with a fire-polished Pasteur pipette. Mouse olfactory neurons were prepared without enzymes for whole-cell recording and either with or without enzymes for patch recording in an identical manner to that used for VNO neurons.
Immunocytochemistry. The VNO was dissected free, fixed for 16 hr in 5% formalin, embedded in paraffin, sectioned (5 μm), and cleared using standard protocols. A goat anti-rat olfactory marker protein (OMP) antiserum was kindly provided by Frank Margolis and is described in Farbman and Margolis (1980). OMP immunoreactivity was detected with biotin–avidin–horseradish peroxidase using protocols from Pixley (1992) and the manufacturer (Vectastain ABC Elite; Vector Laboratories, Burlingame, CA). Blocking of nonspecific binding was with 5% rabbit serum; incubation with primary antibody (1:2000 dilution) was for 1 hr at room temperature and incubation with biotinylated secondary antibody (rabbit anti-goat; 1:500 dilution) was for half an hour. Visualization with 3,3′-diaminobenzidine (DAB) substrate was as recommended by the manufacturer (Vector).
Dissociated cells were prepared as described above, plated on clean glass slides, and fixed for 5 min in PBS containing 4% paraformaldehyde. Detection of OMP immunoreactivity was similar to that described above except that nonspecific binding was blocked with 10% fetal bovine serum and by including 0.1% Triton X-100 in all solutions except those involved in the peroxidase reaction. Incubation with the anti-OMP antibody (1:1000 dilution) and the biotinylated secondary antibody (1:500 dilution) was for 1 hr at room temperature.
Electrophysiology. Voltage-clamp recordings were performed with an Axopatch 200A (Axon Instruments, Foster City, CA) or Yale MarkV patch-clamp amplifier. Currents were low-pass filtered at five times the sampling frequency (typically 5 or 10 kHz) and digitized with the LM900 Laboratory interface (Dagan, Minneapolis, MN). Patch pipettes were constructed from borosilicate microcapillary glass (VWR Scientific) and coated with SYLGARD (Dow Corning, Midland, MI). For whole-cell recording from VNO neurons, pipettes had resistances after fire polishing of 1–3 MΩ. For excised patches and whole-cell recording from olfactory neurons, pipettes were pulled to a smaller diameter (5–10 MΩ). Series resistance correction was used in most experiments. In experiments used for quantitative analysis, the uncorrected series resistance gave voltage errors of <5 mV. The bath was connected to ground via a 1 m KCl agar bridge. Junction potentials were measured to be <10 mV and were not corrected.
Perforated patch recording was performed essentially as described (Horn and Marty, 1988). Nystatin (Sigma) was dissolved in dimethylsulfoxide (50 mg/ml) and was used at a final concentration of 0.25 mg/ml. Stock and pipette solutions were discarded after 2 hr. Perforated patch mode, with series resistance values <50 MΩ, was achieved within 10–20 min. Experiments in which the capacitative current increased suddenly, indicating a rupture of the patch membrane, were discarded. The patch pipette solution (Nys1) contained Ba2+ to stabilize seal formation.
Fast (<1 sec) and complete solution exchange was achieved by gravity flow through an array of microcapillary tubes (1 μl; Drummond, Broomall, PA) that was manually positioned. In most experiments, the cell (or patch) was lifted from the bottom of the dish and positioned in front of the array. In some experiments, cells were left adherent to the bottom of the dish. Solution flow was directed downward by filing the ends of the microcapillary tubes at the lower edge, providing excellent solution exchange. Most traces are shown after leak subtraction using the scaled response to hyperpolarizing steps.
Current-clamp recordings were performed with an Axopatch 200A patch-clamp amplifier (Axon Instruments) in current-clamp mode. For olfactory neurons, it was important that the clamp be in normal mode, as the fast mode gave a ringing artifact. Curve fitting was performed with least-squares optimization using the Origin program (Microcal Software, Northampton, MA)
Recording solutions. The composition of solutions is shown in Table 1. All biochemicals were obtained from Sigma unless otherwise noted. Stock solutions of cAMP, cGMP, 8-Br-cGMP, 8-CPT-cAMP (Calbiochem, La Jolla, CA), ω-conotoxin GVIA (Alomone Laboratories, Jerusalem, Israel), and ω-Aga IVa (provided by Pfizer, Groton, CT) were stored frozen and were diluted in the intracellular or extracellular solution immediately before use. Cytochrome C (1 mg/ml) was added to the extracellular solution containing ω-Aga IVA. Stock solutions of nitrendipine and nifedipine were made in EtOH and stored at −20°C. GTP, ATP, and phosphocreatine were added to the pipette solution and stored as frozen aliquots.
Table 1.
Recording solutions
| Solution | Intracellular solutions | ||||||||
|---|---|---|---|---|---|---|---|---|---|
| K+ | Na+ | Cs+ | Ca2+ | Mg2+ | Ch3SO−4 | EGTA | EDTA | ATP | |
| Kin1 | 145 | 0.1 | 4 | 0.5 | 2 | ||||
| Kin2 | 145 | 4 | 0.5 | 2 | |||||
| Kin3 | 145 | 4 | 135 | 0.5 | 2 | ||||
| Kin4* | 130 | 6 | 125 | 0.5 | 4 | ||||
| Kpatch | 145 | 0.5 | |||||||
| Csin2 | 145 | 4 | 0.5 | 2 | |||||
| Csin3 | 145 | 4 | 135 | 0.5 | 2 | ||||
| Csin4* | 130 | 6 | 125 | 0.5 | 4 | ||||
| Nain | 145 | 4 | 140 | 0.5 | 2 | ||||
| Napatch | 145 | 0.5 | |||||||
| Solution | Extracellular solutions | ||||||||
|---|---|---|---|---|---|---|---|---|---|
| K+ | Na+ | NMDG+ | TEA+ | Ba2+ | Ca2+ | Mg2+ | Ch3SO−4 | Dextrose | |
| Tyrode’s | 5 | 140 | 2 | 1 | 10 | ||||
| Baout1 | 110 | 10 | 20 | 150 | 10 | ||||
| Kout1 | 5 | 140 | 2 | 1 | 10 | ||||
| Kout2 | 5 | 140 | 2 | 1 | 145 | 10 | |||
| Kout3 | 20 | 125 | 2 | 1 | 145 | 10 | |||
| Kout4 | 20 | 125 | 2 | 1 | 145 | 10 | |||
| Naout1 | 145 | 2 | 1 | 145 | 10 | ||||
| Naout2 | 145 | 0.05 | 0.1 | 145 | 10 | ||||
| Naout3 | 145 | ||||||||
| Nystl | 145 | 5 | 5 | 70 | |||||
All solutions contained HEPES at 5 mm (extracellular solutions) or 10 mm (intracellular solutions) and were adjusted to pH 7.4. Cl− was the major anion in all solutions except those containing methane sulfonate (CH3SO−4) where Cl− was at a concentration of 14 or 9 mm for Kin3/Csin3 and Kin4/Csin4, respectively, and 10 or 6 mm for Baout1 and Kout2/Kout3/Kout4/Naout1, respectively. *Kin4/Csin4 also contained 0.3 mm GTP and 14 mm phosphocreatine. Concentrations given are in millimolars.
RESULTS
Preparation and identification of VNO sensory neurons
The VNO sensory epithelium contains three types of cells: sensory neurons, supporting cells, and basal cells (Vaccarezza et al., 1981). The sensory neurons are bipolar cells that send an axon to the accessory olfactory bulb and a dendrite to the lumen of the epithelium. The dendritic process terminates in a tuft of microvilli, where transduction is likely to occur. The supporting cells form a layer close to the lumenal surface of the epithelium, and they also have microvilli, although they lack a dendritic process. Only sensory neurons are immunoreactive for OMP (Farbman and Margolis, 1980). Figure2A shows a section through the epithelium labeled with an anti-OMP antibody. Labeling is seen of cells in the deeper layers of the epithelium, the location of sensory neurons, and not of cells in the most lumenal layer, the location of supporting cells. The spotty labeling is similar to what has been shown previously (Graziadei et al., 1980). Labeling is also present at the lumen of the epithelium and likely corresponds to the labeling of dendritic processes of VNO sensory neurons (Johnson et al., 1993).
Fig. 2.

Photomicrographs of VNO sensory epithelium and VNO sensory neurons. A, A section through the VNO of the mouse labeled with an antibody to OMP and visualized with peroxidase staining. No staining was observed when the primary antibody was not included (not shown). Note staining of the cell bodies of neurons (n) and dendrites (d) but not of sustenticular cells (sc). B, A dissociated cell with a long dendritic process was labeled with anti-OMP antibody, confirming the identity of these cells as sensory neurons. C–E, Differential interference contrast photomicrographs of two dissociated VNO neurons (C, D) and an olfactory neuron (E). Scale bar is the same for all five panels (10 μm).
To obtain dissociated VNO neurons, the VNO and its bony encasing were removed from the nasal cavity and the epithelium was dissected free. At this anterior position in the nasal cavity, the OE is dorsal to the VNO and lies outside the bony encasing (Fig. 1), and thus no contamination of VNO neurons by olfactory neurons is expected. For most experiments, dissociated cells were prepared by incubating the epithelium in divalent-free solution containing trypsin and collagenase and then triturating gently. Dissociation using either of the two enzymes alone, or no enzyme, did not produce as many healthy-looking cells. To determine whether the enzymatic treatment altered the properties of the ion channels, some experiments were done without the use of enzymes; these experiments are explicitly stated as such. A population of cells were identified as sensory neurons by morphological criteria. These cells had an ovoid cell body with a mean diameter along the shorter axis of 11.1 ± 1.4 (mean ± SD; n = 12) and a dendritic process that varied in length and could be >40 μm. Some short dendrites were probably the result of retraction during the dissociation process. This identification was confirmed by labeling with anti-OMP antibody (Fig. 2A,B) and by the detection of action potentials in these cells (see next section). Two typical cells are shown in Figure 2, C and D, as visualized with differential interference contrast microscopy. Cells used for electrophysiology all had a similar appearance, with a clearly identifiable dendrite bearing microvilli. Mouse olfactory neurons were also dissociated for comparative experiments, and a typical cell is shown in Figure 2E at the same magnification. Note that VNO neurons are several times larger than olfactory neurons.
Action potentials in response to current injections
The electrical properties of VNO neurons were examined by whole-cell patch-clamp recording. The resting potential (Vm) of VNO neurons was −58.3 ± 2.7 mV (mean ± SEM unless otherwise noted; range −43 to −70 mV;n = 9; Kin2 and Tyrode’s solutions), which was significantly more depolarized than the resting potential of olfactory neurons measured under similar conditions (−81.8 ± 2.1 mV; n = 6). The input resistance of 3.3 ± 1.0 GΩ (n = 7) was similar to that for olfactory neurons (2.9 ± 0.8 GΩ; n = 8), and the capacitance (8.8 ± 0.3 pF; n = 39) was several times larger than that of olfactory neurons (1.8 ± 0.2 pF;n = 7). The responses of a VNO neuron to current injections of −4 to 4 pA are shown in Figure3A. The response to hyperpolarizing current injections gave a membrane time constant of 15.3 ± 2.2 msec (n = 7). VNO neurons showed a remarkable sensitivity to small current injections, firing repetitive action potentials with injections of 1–2 pA. This sensitivity was also observed in cell-attached patch-clamp recordings, in which we were routinely able to elicit action potentials in response to depolarization of the patch.
Fig. 3.
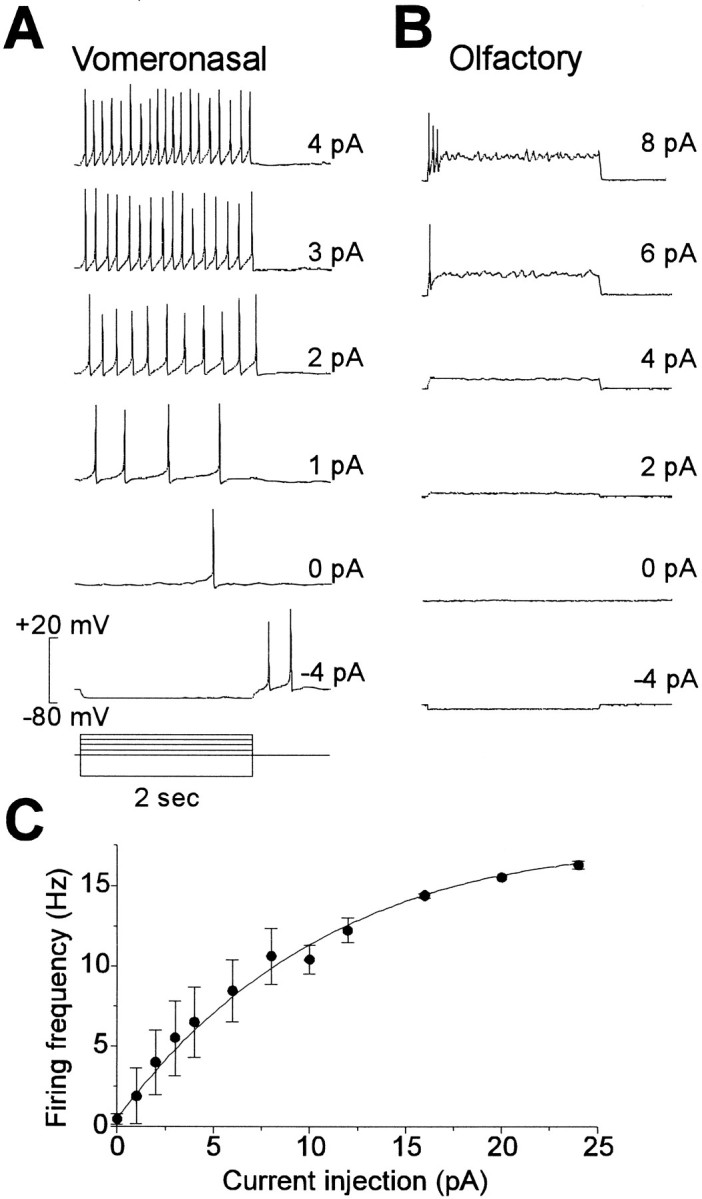
Different firing properties of VNO and olfactory neurons. Current-clamp recordings from a VNO (A) and an olfactory (B) neuron in response to current injections of −4 to 8 pA for 2 sec. Note the repetitive firing in the VNO neuron to current injections of just 1 or 2 pA. The olfactory neurons required larger current injections to elicit firing, and only fired one or a few action potentials. For both cells, the internal solution wasKin2 and the external solution was Tyrode’s. C, Firing frequency of VNO neurons as a function of current injection for eight cells that fired repetitively (mean ± SEM). The line was fit by eye.
VNO neurons fired repetitively with no sign of adaptation during a 2 sec step (Fig. 2A). This is in contrast to mouse olfactory neurons, which under these conditions fire only one or a few action potentials (Fig. 3B). The difference in response between cell types was consistent across many cells. Of 20 VNO neurons, 14 fired sustained trains of action potentials, whereas only 1 of 8 olfactory neurons displayed such behavior. The firing rate as a function of current injected is plotted in Figure 3C for data from eight VNO cells that showed no adaptation to the current injection. The firing frequency increased linearly for current injections between 1 and 8 pA and saturated at currents above 20 pA, at which point the membrane settled into oscillations. The maximal firing frequency was ∼16 Hz. Spontaneous action potentials were rarely observed at rest; of 20 cells, only 1 spontaneously fired repetitive action potentials. Similar properties were found for nonenzymatically prepared cells; input resistance was 8.9 ± 2.9 GΩ (n = 3), Vm was −61 ± 4 (n = 3), and repetitive firing could be elicited by injection of 1–6 pA of current in 2 of 3 cells. To confirm these results, we performed perforated patch recording from nonenzymatically prepared cells. No differences were found (n = 4 cells): input resistance was 3.1 ± 0.6 GΩ, Vm was −60 ± 4 mV, three of four cells fired repetitively with current injections of 1–2 pA, and spontaneous activity was observed in one cell.
To understand the firing properties, we compared the voltage-gated conductances in VNO and olfactory neurons. Figure 4shows representative current families for two VNO neurons (one prepared enzymatically and the other prepared nonenzymatically) and two olfactory neurons, and shows the corresponding I–V plots measured at the peak of the inward current or the end of the sustained outward current. The inward current corresponds primarily to the Na+ current (see next section), and differences between the inward currents in olfactory and VNO neurons are not apparent at this resolution. In contrast, clear differences are apparent between the outward currents, carried by K+, in the two cell types; the outward current in the olfactory neurons activates faster and is larger than that of VNO neurons. These findings prompted a more thorough investigation of voltage-gated conductances in VNO neurons.
Fig. 4.

Differences in voltage-gated currents between VNO and olfactory neurons. A, Whole-cell currents in two VNO neurons, dissociated either enzymatically (top set of traces) or mechanically (bottom set of traces). Voltage steps were in 10 mV increments from −70 to +60 mV from a prepulse potential of −120 mV. I–V curves were plotted from the family of currents at the top of the panel for the peak inward current (filled circles) or the sustained current at the end of the test pulse (open circles).B, Whole-cell currents in two olfactory neurons were recorded under identical conditions. I–V curves for thetop set of traces are shown. Note that the outward current in the olfactory neuron activated more rapidly. All recordings were with Kin2 in the pipette and Tyrode’s in the bath.
Na+ current
Na+ currents were recorded from nonenzymatically treated cells under conditions in which K+ currents were blocked. A family of Na+ currents in response to step depolarizations is shown in Figure 5A. The current is carried almost entirely by Na+ as it was abolished by replacing external Na+ with NMDG+ (data not shown). The peak currentI–V curve (Fig. 5B) shows that this current activates at −50 mV, reaching a maximum at 0 mV. The average magnitude of the Na+ current at 0 mV was 1272 ± 129 pA (n = 7).
Fig. 5.

Na+ currents in VNO neuronsA, A family of Na+ currents in response to voltage steps between −60 and +30 mV from a prepulse potential of −120 mV recorded with Csin1 in the pipette and Tyrode’s in the bath. B, I–Vcurves for the peak inward current from the data shown in A(closed circles) or in the presence of 10 nm TTX (open circles). C, Dose–response curve for TTX block of Na+currents. Na+ currents were evoked by a step to −10 mV from a prepulse potential of −120 (mean ± SEM from 6 cells). Dotted line is the fit to single-site binding isotherm (Ki = 6.4 nm). A better fit (solid line) is obtained by assuming that 10% of the current is insensitive to TTX; the remaining current is fit with a Ki of 3.6 nm. D, On-rates (filled circles) and off-rates (open circles) of TTX block. Solid lines are apparent linear fits from which kon andkoff were calculated. Data were obtained as shown in the inset for voltage step from −120 to −10 mV; block of the current and recovery are fitted with single exponential functions. E, Steady-state inactivation curve; a prepulse for 300 msec to the voltages shown was followed by a test pulse to −10 mV, and the current elicited was normalized to the maximal current. Data shown are from a single cell in control solution (filled circles) or with 30 nm TTX (filled squares) or from five cells (mean ± SEM; open circles). Lines are fits to a single Boltzmann equation (dotted and dashed lines) or the sum of two Boltzmann equations (solidline). F, Recovery from inactivation at −100 mV in control solutions (closed circles) or with 10 nm TTX (open circles). Using a paired-pulse paradigm, the current elicited by the second pulse was measured and normalized to the first preceding test pulse and plotted against the interpulse interval. The smooth curves are fits to a single exponential equation of the formI/Imax = 1 − e(t0−t)/τwith values of (τ, t0) for control and TTX experiments of (8.0, 0.28) and (20.2, 0.54), respectively. All data shown are from nonenzymatically prepared cells.
The Na+ current was sensitive to TTX; 10 nm blocked more than half the current as seen in the I–V curve of Figure 5B. However, high concentrations of TTX did not completely abolish the current, suggesting that a component of the current might be TTX-insensitive. Figure 5C shows dose–response data obtained from six cells. The data were poorly fitted by a single binding curve (Ki of 6.4 nm) and were better fitted by assuming that some channels were insensitive to TTX; in this case, the best fit is obtained with a value ofKi = 3.6 nm for most of the channels, and a TTX-insensitive component that is 10% of the total. The data were not sufficient to determine whether the second component might be sensitive to high concentrations of TTX. To confirm these results, we measured the on-rate and off-rate for TTX block at several concentrations (Fig. 5D). A linear fit to the on-rate gives a value of kon of 2.9 × 10⁶ s−1M−1 (calculated from the inverse of the slope) and koff of 10 × 10−3 s−1 (they-intercept). Separate measurements ofkoff at several concentrations, shown in Figure 5D, gave a similar value. The calculatedKi(koff/kon) of 3.4 nm is remarkably similar to the value obtained from the fit to the dose–response data and supports the assumption of a TTX-insensitive component of the current.
The kinetic and steady-state properties of the TTX-sensitive and TTX-insensitive components of the Na+ current were compared by recording currents in the presence or absence of TTX (>10 nm). No difference was observed in activation properties. Both components of current activated at −50 to −40 mV (Fig. 5B, and data not shown). The time to half-maximal current, a measure of activation kinetics, was 0.62 ± 0.14 msec (n = 5) in the absence of TTX and was not significantly different in the presence of TTX at 10 nm (0.61 ± 0.13; n = 4), 100 nm (0.3 msec), or 300 nm(0.5 msec). In contrast, inactivation properties of the two currents were markedly different. Steady-state inactivation curves measured in the presence and absence of TTX are shown in Figure 5E. In the presence of 30 nm TTX, inactivation of the residual component was shifted by ∼30 mV in the hyperpolarizing direction. A Boltzmann equation fitted to the data gives values for the midpoint V1/2 = −94 mV and slopek = −12.8 mV where I/Imax = 1/[1 + exp((V1/2 − Vm)/k)]. If TTX-sensitive and -insensitive currents differ in steady-state inactivation, this should be evident in the shape of the combined inactivation curve in the absence of TTX. Indeed, the inactivation curve in the absence of TTX is not well fitted by a single Boltzmann equation (Fig. 4E); instead, it is well fitted by the sum of two Boltzmann equations, one of which has the shifted V1/2 obtained in the presence of TTX. The fit shown gives a value ofK1/2 for the TTX-sensitive component of −66 mV and slope of −5.9 mV. To confirm the difference in inactivation properties between the two currents, we measured the time course of recovery from inactivation using a paired-pulse paradigm. Figure 5F shows that at −100 mV, recovery from inactivation of the combined current could be fitted with a single exponential with a time constant of 6.7 msec (mean = 9.1 ± 0.9 msec;n = 4). In the presence of 10 nmTTX, recovery of the current was slower and was fitted with a time constant of 20 msec. Similar results were obtained in the presence of 30 nm TTX (τ = 30 msec).
These results are most readily explained by a difference in inactivation properties of the TTX-sensitive and -insensitive components; for the TTX-insensitive component, the inactivation state of the channel is stabilized relative to other states of the channel, perhaps by a higher affinity binding of the inactivating particle. An alternative explanation is that TTX alters the apparent inactivation properties of the TTX-sensitive channel via a state-dependent binding mechanism (Cohen et al., 1981; Bean et al., 1983). Although this can account for a hyperpolarizing shift in the inactivation curve obtained at concentrations at which the sensitive component is not entirely blocked, the poor fit by a single Boltzmann equation of the inactivation curve in the absence of TTX argues against this mechanism.
Na+ currents were also recorded from enzymatically treated cells, and similar values were obtained for gating properties, including the voltage at which currents were activated, the midpoint of inactivation, and the time constant for recovery from inactivation. In these cells, however, TTX sensitivity appeared to be diminished, and data from these experiments was, therefore, not included in the analysis.
A slowly activating K+ current
Outward K+ currents in response to step depolarizations of short and long duration are shown in Figure6, A and B; these were typical of the currents seen in most VNO neurons, either enzymatically or nonenzymatically prepared. Measurements of the reversal potential of tail currents in 5 mm K+and 20 mm K+ confirmed that the outward conductance is K+-selective (data not shown). The I–V curve in Figure 6C for the family of traces in Figure 6A shows that the current begins activating at potentials above −30 mV. This is also seen in an activation curve plotted from isochronal tail current measurements at −120 mV after voltage steps to varying potentials (Fig.6D). The activation curve was relatively shallow and was fit with a Boltzmann equation with V1/2 = −11.5 mV and K = 16 mV. During a prolonged depolarization lasting 50 sec, the K+ current displayed only slow inactivation; the time course of inactivation could be fitted with the sum of two exponential functions with time constants of 2.4 sec (67%) and 49 sec (33%; Fig. 6B). This is consistent with either the presence of at least two different channel species that inactivate at different rates or with a single channel type that has multiple open or inactivated states.
Fig. 6.

Outward K+ current.A, A family of K+ currents in response to step depolarizations between −30 and +80 mV from a prepulse potential of −120 mV. B, Time course of inactivation of the K+ current from a nonenzymatically prepared cell (+60 mV). The decay of the current was fit (solid line) with the sum of two exponential functions with time constants of 2.4 sec (67%) and 49 sec. C, I–V curve for currents inA measured at 100 msec. D, Activation curve, measured from the amplitude of the tail current at −120 mV after a 100 msec depolarizing step to the potentials indicated (filled circles). The data were fitted by a Boltzmann equation withV1/2 = 9.2 mV and K = 18 mV. E, Time to half activation measured from enzymatically prepared VNO neurons (solid circles; n = 7), nonenzymatically prepared VNO neurons (solid squares;n = 5), and olfactory neurons (open circles;n = 5). Note that the y-axis is a logarithmic scale. F, I–V curves, measured as inB in the presence of 2 mmCa2+ (control, open circles) in nominally Ca2+-free solution (with Mg2+ replacing Ca2+,closed circles) and in the presence of 10 mm TEA (diamonds). Solutions for most recordings were Kin4 and Kout2 + TTX (10 μm).
The activation of K+ currents was relatively slow at all potentials. This was quantified by measuring the time to half-maximal activation as a function of voltage (Fig. 6E). At +40 mV, the current reached half activation in 12.0 ± 1.3 msec (n = 7) in enzymatically prepared cells and was not significantly different in nonenzymatically prepared cells (8.5 ± 1.0 msec; n = 5). The VNO K+ current activated an order of magnitude slower than the outward current in mouse olfactory neurons, which reaches half activation in 1.3 ± 0.1 msec (n = 5; Fig. 6E). Our value is similar to that previously reported for rat olfactory neurons (1.5 msec; Lynch and Barry, 1991). Because the time it takes for an action potential to go from 0 to +40 mV in VNO cells is only 1–3 msec, only a fraction of the K+ current would be activated during an action potential.
Little if any of the macroscopic K+ current could be attributed to Ca2+-activated K+ channels. This was assessed either by removing Ca2+ in the external bath (and replacing it with Mg2+) or by adding 100 mmCd2+ or 2 mmCo2+ to the bath. The currents in Figure6F are representative of the majority of cells; theI–V curve does not show the “N” shape characteristic of Ca2+ activated K+ currents, and removal of Ca2+ actually enhanced the current (most likely because of surface-charge effects). In this cell, the absence of a Ca2+-activated K+ current could not be attributed to rundown of Ca2+ channels, because a robust Ca2+ current could be elicited in the presence of 20 Ba2+ at the end of the experiment. Of 14 cells tested, 13 showed little evidence of a Ca2+-activated K+ current. Removal of Ca2+ caused a 0.7 ± 5% increase in the current (n = 5; +30 mV). Cd2+at 100 mm, a concentration that was effective at completely abolishing the Ca2+ current (next section), had little effect on the K+ currents, with only 7.2 ± 3.5% block (n = 7; +30 mV). This small amount of block is most likely attributable to nonspecific effects, as it was similar at all potentials. On the other hand, the K+ current was sensitive to block by 10 mm tetraethylammonium (78 ± 2% block,n = 7; +30 mV) and 5 mm4-aminopyridine (40 ± 8% block; n = 2; +30 mV).
An inward-rectifier potassium current
We determined the magnitude of the inward-rectifier K+ current with hyperpolarizing ramps in the presence of elevated extracellular K+. In these experiments, equimolar Na+ was replaced by K+ in the external solution, and Na+ channels were blocked with 5 mm TTX. Voltage ramps in the presence and absence of 20 mm K+ showed that a K+ conductance was present at voltages more negative than −50 mV (Fig. 7A). The difference current is shown in the bottom panel. The current was roughly linear over the voltage range of −120 to −50 mV, and the mean slope conductance for four cells was 0.75 ± 0.19 nS (n = 4). The extrapolated reversal of −44.4 ± 2.5 mV (n = 4) is closed to the Nernst potential of −50 mV predicted for a K+-selective conductance.
Fig. 7.

An inward-rectifier K+current. A, Response to voltage ramps (0.88 V/sec) in the absence of external K+ and with 20 mm K+ replacing Na+ in the bath solution. The difference curve shows that the conductance carried by K+activates at close to the reversal potential for K+ (approximately −50 mV) and is linear between −80 and −50 mV. B, Voltage steps in the presence and absence of 20 mm external K+. The inward K+conductance activates with depolarizing voltage as seen by the tail currents at repolarization to −120 mV. Plotted below is a steady-stateI–V curve measured at the end of a 100 msec test pulse. Note that the current saturates below −120 mV. External solution was Naout1 or Kout4, and internal solution was Kin3.
The inward K+ current, examined with step hyperpolarizations, showed evidence of deactivation at negative potentials (Fig. 7B). During a hyperpolarizing step from −120 to −140 mV, the current relaxed to a smaller value, whereas depolarizing steps led to activation of the current as seen in the increase in the currents at repolarization to −120 mV. This is also apparent in the I–V curve measured at the end of the test pulse (Fig. 7B), which shows a saturation in the size of the currents below −120 mV. The small magnitude of the inward-rectifier current (−21.6 ± 4.9 pA at −78 mV in 20 mmK+; n = 5) is consistent with the high input resistance of these cells and might be sufficient to maintain the resting potential. [Since submission of this manuscript, a report has appeared showing that the resting potential in frog VNO neurons is set by the balance between a hyperpolarizing sodium pump and a slowly activating, depolarizing cation conductance,Ih; (Trotier and Doving, 1996). In perforated patch recording from nonenzymatically prepared mouse VNO neurons, we have also observed a current that, based on kinetics, is likely to be Ih.]
Two components of Ca2+ current
Ca2+ currents recorded with 20 Ba2+ in the external solution are shown in Figure8A. At this slow time scale, two components of current are apparent. A transient component activated at depolarization to −60 mV and reached a peak at −20 mV. Inactivation of this current proceeded to near completion with a time constant 38 ± 4 msec (measured at −10 mV; n = 9). A second, sustained component activated at −10 mV and reached maximal conductance at +20 mV (Fig. 8A, bottom panel). I–V relations shown in Figure 8Bwere measured from the traces in Figure 8A either at the peak of the current or late in the voltage step (at the times indicated by the filled circle and square in Fig.8A). The bimodal I–V relationship for the late current (squares) is indicative of two components of current; at negative potentials, the current is carried by the transient component (that is not fully inactivated), whereas at positive potentials it is carried by the sustained component. TheI–V relationship of the peak current at negative potentials (below −10 mV) reflects the activation of the transient component alone, whereas at positive potentials it reflects the activation of both components. Both components were blocked by the addition of Cd2+ (100 μm), which abolished 92.6 ± 2.2% (n = 4) of the current (measured at +10 mV). In three nonenzymatically prepared cells, similar currents were observed, and the time constant for decay of the transient component at −10 mV (32 ± 6 msec; n = 3) was similar to the value obtained from enzymatically prepared cells (see above).
Fig. 8.

Two components of Ca2+current. A, A family of Ca2+ currents recorded with 20 Ba2+ as the charge carrier. Currents in response to depolarizations from a prepulse potential of −100 mV to −60 to −20 mV in 10 mV steps are shown in the top panel. Currents in response to depolarizations to −10 to +70 mV in 20 mV steps from same prepulse potential are shown in thebottom panel. Two components of current are apparent in these traces, a transient current that is activated at low voltages and a sustained current that is activated at high voltages. B,I–V curves from the family of currents in Ashowing the peak current (filled circles) and the sustained current (filled squares) measured at the times indicated in A by the same symbols. The open diamonds are the current calculated by multiplying the peak current by the fractional inactivation at that potential (fromC). C, Steady-state inactivation curve measured as the peak current elicited by a step depolarization to −10 mV after a 500 msec prepulse to varying potentials. The solid line is a fit to the Boltzmann equation withV1/2 = −54 mV and K = −8 mV. D, The amplitude of the sustained component of Ca2+ current plotted against the transient component (at −10 mV) for individual cells. No correlation was apparent. E, Block of transient and sustained components by 100 μmNi2+, 10 μm Nitrendipine (DHP), and 200 nmw-aga-IVa. The transient and sustained components were measured at the peak and at the end of the pulse for 100 msec voltage steps from −80 to 0 mV. The peak current should be the sum of both transient and sustained components, whereas the current at the end of the pulse will mainly represent the sustained component. For all measurements of Ca2+ currents, the internal solution was Csin3 or Csin4, and external solution was Baout.
To characterize the transient component further, we measured the voltage dependence of inactivation (Fig. 8C). A fit to the Boltzmann equation gives values of V1/2 = −50.0 ± 1.2 mV (n = 3) and K = −8.5 ± 0.1 mV (n = 3). Multiplying the inactivation curve by the peak current gives the values plotted in Figure 8B(open diamonds), which are nearly identical to those of the late current at these potentials, confirming that this part of the late current is the same as the noninactivated portion of the transient component. On average, the magnitude of the peak transient current was 169 ± 13 pA at −10 mV (n = 25), and the magnitude of the sustained component at the same potential was 134 ± 24 (n = 25; −10 mV). The two components, plotted against each other for individual cells (Fig. 8D), were seen to vary independently, and distinct populations of cells expressing one component or the other were not observed. The sustained component displayed more variability and was also more labile.
The pharmacology of both components was examined (Fig. 8E). The transient component was insensitive to ω-conotoxin (3 μm; 2.7 ± 7.8% increase; n = 3) and ω-aga-IVA (200 nm; 1.3 ± 2.3% increase; n = 3), but was blocked by Ni2+ (100 μm; 74 ± 1% decrease; n = 5). The sustained component was partially blocked by dihydropyridines (37 ± 3% block by 10 μm nitrendipine, n = 5; 62 ± 11% block by 1 μm nifedipine,n = 3), partially blocked by ω-conotoxin GVIA (3 μm; 21 ± 3.6% decrease, n = 3), and was relatively insensitive to ω-aga IV (200 nm; 7 ± 4% decrease, n = 3). The kinetics and pharmacology of the transient component are consistent with its identification as T-type current, whereas the sustained component appears to be composed mainly of L-type, and perhaps some N-type current.
CNG channels
We used a variety of approaches to try to detect a CNG conductance in VNO neurons. Based on the properties of vertebrate and invertebrate olfactory, retinal, and gustatory CNG channels (Michel and Ache, 1992;Gomez and Nasi, 1995; Kolesnikov and Margolskee, 1995; Yau and Chen, 1995), we assumed that CNG channels, if present in the VNO, would be localized on microvilli, be permeant to either Na+ or K+ or both, and be blocked by divalent cations. The most straightforward approach was to excise patches under divalent-free conditions and to expose the intracellular surface to cyclic nucleotide. Because the extremely small size of the microvilli precluded patch-clamp recording, we instead obtained excised patches from the dendritic knob. In olfactory neurons, the corresponding region has a relatively high density of CNG channels (Frings et al., 1992).
In 17 patches excised from the dendritic knob of enzymatically prepared VNO neurons and in 6 patches excised from nonenzymatically prepared cells, we detected no response to saturating concentrations of cAMP or cGMP (0.5–1.0 mm), as measured with ramp depolarizations from −80 to +80 mV. In many of these patches, square openings of single voltage-activated K+ or Na+ channels were seen, indicating that the cytoplasmic surface of the patch was not obstructed. In all experiments, the patch pipette contained a low-divalent Na+ solution (Naout3), and the bath contained divalent-free Na+ solution (6 experiments; Napatch) or K+ solution (17 experiments; Kpatch).
In olfactory neurons, in contrast, we obtained responses in three out of four patches from the dendritic knob of enzymatically prepared cells and four out of five patches from nonenzymatically prepared cells (Fig.9B). The response to saturating concentrations of cAMP or 8-CPT-cAMP (0.5–1 mm) averaged −12 ± 5 (n = 3) and −20 pA ± 12 pA (n = 4) in patches from enyzmatically and nonenzymatically prepared cells, respectively (measured at −70 mV; Naout3 and Napatchsolutions). Responses of similar magnitude were obtained with cGMP or 8-Br-cGMP (0.5–1 mm).
Fig. 9.

Response of VNO and olfactory neurons to cyclic nucleotides. A, Holding current for a VNO neuron exposed to 0.5 mm 8-Br-cGMP in whole-cell recording at −80 mV. Responses to ramp depolarizations (0.22 V/sec) are shown below for time points before and during 8-Br-cGMP exposure, as indicated by thearrows in the time course. Recordings were performed with Csin3 solution in the pipette and low divalent (Naout2) external solution. No change in the current was observed, even though a change of only 1 pA would have been detected. B, Current at −80 mV in an excised patch from the dendritic knob of an olfactory neuron exposed to the same solution of 0.5 mm 8-Br-cGMP. A large current was evoked that declined rapidly after removal of 8-Br-cGMP. Shown below are responses to ramp depolarizations (1.3 V/sec) before and at the peak of the response (indicated by thearrows). Solutions were Csin3 in the pipette and low divalent (Naout2) in the bath.
The failure to observe a response to cyclic nucleotides in excised patches from VNO neurons might be attributed to a low density of channels, consistent with the extremely high sensitivity of VNO cells to current injections. To improve our ability to detect a CNG conductance, we used whole-cell recording. In one series of experiments, cells were dialyzed with cAMP or 8-Br-cGMP, a treatment that elicits several hundred picoamperes of current in olfactory neurons. Solution exchange between the patch pipette and the cell occurred within seconds of patch rupture, as monitored by loading the pipette with high Na+ solution (Nain) and observing the change in the reversal potential of the Na+ current. The diffusion of cyclic nucleotide at high concentrations is expected to be only 2–3 times slower than that of Na+ (Pusch and Neher, 1988). Thus, at the time when dialysis with Na+is 95% complete, the cyclic nucleotide will be at >50% of its final concentration. With 0.5 mm cAMP or cGMP in the pipette, this gives a concentration of 0.25 mm in the cell, which is a saturating concentration for most CNG channels. Because dialysis with Na+ was faster than we could measure (<5 sec), we slowed the onset of dialysis in some experiments by loading the tip of the pipette with Cs+-containing solution. In these experiments, we found no evidence for an increased conductance during the time course of the dialysis. Measuring the current at −120 mV at a time well after dialysis was complete (130–800 sec), we found an increase of only 2 ± 10 pA with 0.5 mm 8-Br-cGMP (n = 3) and 0.5 ± 1.2 pA with 0.5 mm cAMP (n = 3). The negligible size of the induced current under conditions of high concentrations of cyclic nucleotide indicates that CNG channels are unlikely to be present or to mediate transduction.
In a second series of experiments, we measured the response of whole-cell currents to bath perfusion of membrane-permeant analogs of cAMP or cGMP. To enhance the likelihood of seeing a response, we used two different conditions: a high K+ (20 mm) external solution to reveal a K+-selective conductance or a low divalent external solution to unblock channels. In neither condition did we see any significant response. With 20 mmK+ and 125 mmNa+ in the bath (Kout4), an inward-rectifier current was evident at −78 mV, but the magnitude of the current, −20 ± 4 pA (n = 4), was unaffected by constant perfusion for >1 min with 1 mm8-Br-cGMP (−20 ± 5 pA; n = 4). In the presence of low divalent external solution, the holding current at −78 mV was −14 ± 4 pA (n = 4), and no significant increase was seen after exposure to 0.5 mm 8-Br-cGMP (−15 pA ± 4, n = 4). Figure 9A shows the results of one experiment performed under these conditions. No change in the whole-cell current was observed in response to application of 8-Br-cGMP, although an increase in the current of only 1 pA would have been detectable. As a control, an excised patch from an olfactory neuron was exposed to the same solution of 8-Br-cGMP; it gave a response of 10–20 pA (Fig. 9B). Finally, to test for the unlikely possibility that a CNG channel was not detected because of “rundown” from internal perfusion of the cell or patch, we recorded responses in perforated-patch mode. In current-clamp mode, in which 1–2 pA was sufficient to elicit action potentials, no activity was elicited by bath application for several minutes of 8-CPT-cAMP (0.5 or 1 mm; n = 2) or 8-Br-cGMP (1 mm; n = 2).
DISCUSSION
High sensitivity and temporal integration in single sensory neurons
Mouse VNO neurons, like mouse olfactory neurons (Maue and Dionne, 1987; Lynch and Barry, 1989), fired action potentials to current injections of just 1–2 pA. This remarkable sensitivity is attributable in part to the high input resistance of the cell membrane of olfactory and VNO neurons. Our measurement of ∼3 GΩ, on average, underestimates the real membrane resistance (Schild, 1989). A better estimate is the highest input resistances that we measured, 8 GΩ (from enzymatically prepared cells) and 16 GΩ (from nonenzymatically prepared cells), which are similar to values reported for olfactory neurons (Trotier, 1986; Firestein and Werblin, 1987; Lynch and Barry, 1989, 1991). A current injection of 0.5–1 pA thus could cause a depolarization of 8–16 mV, bringing Vm to −50 to −40 mV, which is just the voltage range over which the Na+ current is steeply activated. The sensitivity of VNO neurons may be enhanced by a resting potential (approximately −60 mV) that is close to the firing threshold, and by the contribution of the transient Ca2+ current that is activated close to the resting potential.
We found that mouse VNO neurons fire tonically to maintained current injections of as little as 1 pA, without sign of adaptation. Under similar conditions of whole-cell recording, rodent and amphibian olfactory neurons fire only a single or short burst of action potentials, and repetitive firing can only be elicited with a pulsitile current injection protocol (Trombley and Westbrook, 1991). With perforated patch recording, sustained firing of olfactory neurons has been observed, but only at higher current levels (5–8 pA, which is near saturation for VNO neurons) (Leinders-Zufall et al., 1995). The sustained firing of VNO neurons would allow temporal integration, enhancing sensitivity in the detection of small signals—perhaps even the binding of single pheromone/odorant molecules. This higher sensitivity may be unnecessary for the olfactory system, which may achieve additional sensitivity by the large numbers of sensory neurons and the enormous degree of convergence in the olfactory bulb (Kauer, 1986; Ressler et al., 1994; Vassar et al., 1994). Instead, olfactory neurons may be optimized to detect changes in the environment, showing adaptation to sensory input at several different levels.
It is not known whether sensory transduction results in an increase or a decrease in the activity of VNO neurons. In reptiles, stimuli detected by the VNO generally cause an increase in activity in the accessory olfactory bulb (Tucker, 1971; Jiang et al., 1990); in mammals, similar experiments have been more difficult. Our data are consistent with either possibility. Most VNO neurons did not fire spontaneously, suggesting that information might be encoded by an increase in firing frequency. However, our results also suggest that VNO neurons could fire tonically in vivo if a small inward current was activated at rest, and sensory transduction might, then, reduce firing frequency.
Contribution of voltage-activated currents to electrical response properties
The Na+ current in mouse VNO neurons consists of a major component that is TTX-sensitive and a minor component that is TTX-insensitive. These currents are similar in inactivation properties and pharmacology to two Na+ currents, TTX-sensitive and TTX-insensitive, described in rat olfactory neurons. However, in rat olfactory neurons both currents have not been shown to coexist in the same cell; the TTX-insensitive current is seen in freshly dissociated rat olfactory neurons (Rajendra et al., 1992), whereas the TTX-sensitive current is seen in cultured rat olfactory neurons (Trombley and Westbrook, 1991). In both VNO and olfactory neurons, the TTX-sensitive Na+ current inactivates at more depolarized potentials (midpoint is approximately −65 mV for both VNO and olfactory neurons) than the TTX-insensitive Na+current (midpoint is approximately −94 mV and −110 mV in VNO and olfactory neurons, respectively). The response properties of VNO neurons will be dominated by the larger TTX-sensitive Na+ current, whereas the response properties of rodent olfactory neurons may be dominated by the TTX-insensitive current. The greater availability of the TTX-sensitive channel at rest, and faster recovery from inactivation, may enhance the excitability of VNO neurons relative to olfactory neurons.
The outward K+ current in mouse VNO neurons was carried predominantly by slowly inactivating delayed-rectifier-type channels. This current was an order of magnitude slower in activation kinetics than the K+ current in olfactory neurons. Because the action potential in VNO neurons goes from 0 to +40 mV in 1–3 msec, little of the K+ current will be activated; this may allow the cell to respond more quickly to sustained current with additional action potentials. The negligible inactivation of the K+ current may allow repetitively firing without adaptation; this is in contrast to the K+current in freshly dissociated rat olfactory neurons, which inactivates with τ = 22 and 143 msec, (Lynch and Barry, 1991), and thus may inactivate sufficiently during a maintained current injection to prevent repolarization of the action potential and repriming of Na+ channels.
The two components of Ca2+ current in VNO neurons have properties similar to those of T-type and L-type Ca2+ channels described in other cell types (Tsien et al., 1987; Bean, 1989; Hess, 1990). In contrast, only L-type Ca2+ current has been detected in olfactory neurons (Trotier, 1986; Firestein and Werblin, 1987; Schild, 1989;Trombley and Westbrook, 1991; Nevitt and Moody, 1992). Although not well characterized, the Ca2+ current in frog VNO neurons also appears to contain a component of T-type current (Trotier et al., 1993). The presence of T-type current in VNO and not in olfactory neurons indicates that it may play a role in defining the distinct electrical properties of VNO neurons. T-type current is activated close to the resting potential of VNO neurons (approximately −60 mV); thus, it may lower the threshold for initiation of an action potential (Hagiwara et al., 1988).
CNG channels may not mediate transduction
The transduction of chemical into electrical signals in many vertebrate and invertebrate sensory systems, including olfactory, visual, and gustatory systems (Fesenko et al., 1985; Nakamura and Gold, 1987; Michel and Ache, 1992; Kolesnikov and Margolskee, 1995; Gomez and Nasi, 1995), is accomplished by the gating of a CNG channel. Our experiments suggest that this may not be true for transduction in the VNO. We have been unable to detect the activation of either a Na+ or a K+ current in response to either cAMP or cGMP using a variety of approaches. These included excised patch recording in which olfactory neurons produced tens of picoamperes of current, and whole-cell recording, in which olfactory neurons reportedly produce currents of 100–400 pA (Kurahashi, 1990; Firestein et al., 1991a). Our results differ from a recent report that described a CNG current in turtle VNO neurons (Taniguchi et al., 1996). This may represent a species difference, because in turtle the VNO is not sequestered from the main OE.
These physiological results are consistent with recent molecular investigation of transduction in the VNO. Most of the known components of transduction in the olfactory system are not expressed in the VNO, including the family of odorant receptors, the G-protein (Gαolf), adenylyl cyclase III, and a CNG channel (rOCNC1; Dulac and Axel, 1995; Berghard et al., 1996). The only transduction component that is expressed in both cell types is a second (or β) subunit of the CNG channel (rOCNC2) that does not form a functional channel when expressed alone in heterologous cell types (Bradley et al., 1994; Liman and Buck, 1994). Our current results suggest that in VNO neurons, as well, this subunit does not form a functional CNG channel. An unlikely possibility that we cannot rule out is that this subunit forms a channel gated by another second messenger or with a very unusual ion selectivity. Alternatively, if the expression of rOCNC2 is without functional consequence, the detection of rOCNC2 in the VNO may be the result of a transcriptional control mechanism that has not evolved to be tightly regulated.
Although the mechanism of sensory transduction in the VNO remains obscure, recent evidence suggests that it is likely to involve G-proteins and G-protein-coupled-receptors. First, studies in snake have shown that pheromone binding to VNO membranes is GTP-dependent (Luo et al., 1994). Second, two G-proteins (Gαi2 and Gαo) are found at high levels in the vomeronasal system (Shinohara et al., 1992;Luo et al., 1994; Halpern et al., 1995; Berghard and Buck, 1996). Third, Dulac and Axel (1995) have recently identified a family of VNO-specific seven-transmembrane-receptors that are putative pheromone receptors. How activation of pheromone receptors and G-proteins affects the electrical excitability of VNO neurons remains to be elucidated. The characterization of ion channels that we have conducted lays the foundations for such an endeavor.
Footnotes
This work was supported by a grant from the National Institutes of Health (R03 DC 02889-01) to E.R.L. and by the Howard Hughes Medical Institute. E.R.L. is an Associate and D.P.C. is an Investigator of the Howard Hughes Medical Institute. We thank Don Arnold, Steve Cannon, Jeff Holt, and Jim Morrill for helpful discussions.
Correspondence should be addressed to Emily R. Liman, Wellman 414, Massachusetts General Hospital, 50 Blossom Street, Boston, MA 02114.
REFERENCES
- 1.Ache B, Zhainazarov A. Dual second-messenger pathways in olfactory transduction. Curr Opin Neurobiol. 1995;5:461–466. doi: 10.1016/0959-4388(95)80006-9. [DOI] [PubMed] [Google Scholar]
- 2.Bakalyar HA, Reed RR. Identification of a specialized adenylyl cyclase that may mediate odorant detection. Science. 1990;250:1403–1406. doi: 10.1126/science.2255909. [DOI] [PubMed] [Google Scholar]
- 3.Barber PC, Raisman G. An autoradiographic investigation of the projection of the vomeronasal organ to the accessory olfactory bulb in the mouse. Brain Res. 1974;81:21–30. doi: 10.1016/0006-8993(74)90476-4. [DOI] [PubMed] [Google Scholar]
- 4.Bean BP. Classes of calcium channels in vertebrate cells. Annu Rev Physiol. 1989;51:367–384. doi: 10.1146/annurev.ph.51.030189.002055. [DOI] [PubMed] [Google Scholar]
- 5.Bean BP, Cohen CJ, Tsien RW. Lidocaine block of cardiac sodium channels. J Gen Physiol. 1983;81:613–642. doi: 10.1085/jgp.81.5.613. [DOI] [PMC free article] [PubMed] [Google Scholar]
- 6.Berghard A, Buck L. Sensory transduction in vomeronasal neurons: evidence for Gαo, Gαi, and adenylyl cyclase II as major components of a pheromone signalling cascade. J Neurosci. 1996;16:909–918. doi: 10.1523/JNEUROSCI.16-03-00909.1996. [DOI] [PMC free article] [PubMed] [Google Scholar]
- 7.Berghard A, Buck LB, Liman ER. Evidence for distinct signalling mechanisms in two mammalian olfactory sense organs. Proc Natl Acad Sci USA. 1996;93:2365–2369. doi: 10.1073/pnas.93.6.2365. [DOI] [PMC free article] [PubMed] [Google Scholar]
- 8.Bradley J, Li J, Davidson N, Lester H, Zinn K. Heteromeric olfactory cyclic nucleotide-gated channels: a subunit that confers increased sensitivity to cAMP. Proc Natl Acad Sci USA. 1994;91:8890–8894. doi: 10.1073/pnas.91.19.8890. [DOI] [PMC free article] [PubMed] [Google Scholar]
- 9.Buck L, Axel R. A novel multigene family may encode odorant receptors: a molecular basis for odor recognition. Cell. 1991;65:175–187. doi: 10.1016/0092-8674(91)90418-x. [DOI] [PubMed] [Google Scholar]
- 10.Ramon y Cajal S. Norbert Maloine; Paris: 1911. Histologie du systeme nerveux de l’homme et des vertebre. . [Google Scholar]
- 11.Cohen CJ, Bean BP, Colatsky TJ, Tsien RW. Tetrodotoxin block of sodium channels in rabbit Purkinje fibers. Interactions between toxin binding and channel gating. J Gen Physiol. 1981;78:383–411. doi: 10.1085/jgp.78.4.383. [DOI] [PMC free article] [PubMed] [Google Scholar]
- 12.Dhallan RS, Yau KW, Schrader KA, Reed RR. Primary structure and functional expression of a cyclic nucleotide-activated channel from olfactory neurons. Nature. 1990;347:184–187. doi: 10.1038/347184a0. [DOI] [PubMed] [Google Scholar]
- 13.Dionne VE, Dubin AE. Transduction diversity in olfaction. J Exp Biol. 1994;194:1–21. doi: 10.1242/jeb.194.1.1. [DOI] [PubMed] [Google Scholar]
- 14.Dulac C, Axel R. A novel family of genes encoding putative pheromone receptors in mammals. Cell. 1995;83:195–206. doi: 10.1016/0092-8674(95)90161-2. [DOI] [PubMed] [Google Scholar]
- 15.Farbman AI, Margolis FL. Olfactory marker protein during ontogeny: immunohistochemical localization. Dev Biol. 1980;74:205–215. doi: 10.1016/0012-1606(80)90062-7. [DOI] [PubMed] [Google Scholar]
- 16.Fesenko EE, Kolesnikov SS, Lyubarsky AL. Induction by cyclic GMP of cationic conductance in plasma membrane of retinal rod outer segment. Nature. 1985;313:310–313. doi: 10.1038/313310a0. [DOI] [PubMed] [Google Scholar]
- 17.Firestein S, Werblin FS. Gated currents in isolated olfactory receptor neurons of the larval tiger salamander. Proc Natl Acad Sci USA. 1987;17:6292–6296. doi: 10.1073/pnas.84.17.6292. [DOI] [PMC free article] [PubMed] [Google Scholar]
- 18.Firestein S, Darrow B, Shepherd GM. Activation of the sensory current in salamander olfactory receptor neurons depends on a G protein-mediated cAMP second messenger system. Neuron. 1991a;6:825–835. doi: 10.1016/0896-6273(91)90178-3. [DOI] [PubMed] [Google Scholar]
- 19.Firestein S, Zufall F, Shepherd GM. Single odor-sensitive channels in olfactory receptor neurons are also gated by cyclic nucleotides. J Neurosci. 1991b;11:3565–3572. doi: 10.1523/JNEUROSCI.11-11-03565.1991. [DOI] [PMC free article] [PubMed] [Google Scholar]
- 20.Frings S, Lynch JW, Lindemann B. Properties of cyclic-nucleotide-gated channels mediating olfactory transduction. J Gen Physiol. 1992;100:45–67. doi: 10.1085/jgp.100.1.45. [DOI] [PMC free article] [PubMed] [Google Scholar]
- 21.Garrosa M, Coca S, Mora OA. Histological development of the vomeronasal complex in the pre- and postnatal rat. Acta Otolaryngol. 1986;102:291–301. doi: 10.3109/00016488609108679. [DOI] [PubMed] [Google Scholar]
- 22.Gomez M, Nasi E. Activation of light-dependent K+ channels in ciliary invertebrate photoreceptors involves cGMP but not the Ip3/Ca2+cascade. Neuron. 1995;15:607–618. doi: 10.1016/0896-6273(95)90149-3. [DOI] [PubMed] [Google Scholar]
- 23.Graziadei GA, Stanley RS, Graziadei PP. The olfactory marker protein in the olfactory system of the mouse during development. Neuroscience. 1980;5:1239–1252. doi: 10.1016/0306-4522(80)90197-9. [DOI] [PubMed] [Google Scholar]
- 24.Hagiwara N, Irisawa H, Kameyama M. Contribution of two types of calcium currents to the pacemaker potentials of rabbit sino-atrial node cells. J Physiol (Lond) 1988;395:233–253. doi: 10.1113/jphysiol.1988.sp016916. [DOI] [PMC free article] [PubMed] [Google Scholar]
- 25.Halpern M. The organization and function of the vomeronasal system. Annu Rev Neurosci. 1987;10:325–362. doi: 10.1146/annurev.ne.10.030187.001545. [DOI] [PubMed] [Google Scholar]
- 26.Halpern M, Shapiro LS, Jia C. Differential localization of G proteins in the opossum vomeronasal system. Brain Res. 1995;677:157–161. doi: 10.1016/0006-8993(95)00159-n. [DOI] [PubMed] [Google Scholar]
- 27.Hess P. Calcium channels in vertebrate cells. Annu Rev Neurosci. 1990;13:337–356. doi: 10.1146/annurev.ne.13.030190.002005. [DOI] [PubMed] [Google Scholar]
- 28.Horn R, Marty A. Muscarinic activation of ionic currents measured by a new whole-cell recording method. J Gen Physiol. 1988;92:145–159. doi: 10.1085/jgp.92.2.145. [DOI] [PMC free article] [PubMed] [Google Scholar]
- 29.Jiang XC, Inouchi J, Wang D, Halpern M. Purification and characterization of a chemoattractant from electric shock-induced earthworm secretion, its receptor binding, and signal transduction through the vomeronasal system of garter snakes. J Biol Chem. 1990;265:8736–8744. [PubMed] [Google Scholar]
- 30.Johnson EW, Eller PM, Jafek BW. An immuno-electron microscopic comparison of olfactory marker protein localization in the supranuclear regions of the rat olfactory epithelium and vomeronasal organ neuroepithelium. Acta Otolaryngol. 1993;113:766–771. doi: 10.3109/00016489309135898. [DOI] [PubMed] [Google Scholar]
- 31.Jones DT, Reed RR. Golf: an olfactory neuron specific-G protein involved in odorant signal transduction. Science. 1989;244:790–795. doi: 10.1126/science.2499043. [DOI] [PubMed] [Google Scholar]
- 32.Kauer JS. Coding in the olfactory system. In: Finger TE, Silver WL, editors. Neurobiology of taste and smell. Wiley; New York: 1986. pp. 205–231. [Google Scholar]
- 33.Keverne EB. Pheromonal influences on the endocrine regulation of reproduction. Trends Neurosci. 1983;6:381–384. [Google Scholar]
- 34.Kolesnikov SS, Margolskee RF. A cyclic-nucleotide-suppressible conductance activated by transducin in taste cells. Nature. 1995;376:85–88. doi: 10.1038/376085a0. [DOI] [PubMed] [Google Scholar]
- 35.Kurahashi T. The response induced by intracellular cyclic AMP in isolated olfactory receptor cells of the newt. J Physiol (Lond) 1990;430:355–371. doi: 10.1113/jphysiol.1990.sp018295. [DOI] [PMC free article] [PubMed] [Google Scholar]
- 36.Leinders-Zufall T, Sheperd GM, Zufall F. Regulation of cyclic nucleotide-gated channels and membrane excitability in olfactory receptor cells by carbon monoxide. J Neurophysiol. 1995;74:1498–1508. doi: 10.1152/jn.1995.74.4.1498. [DOI] [PubMed] [Google Scholar]
- 37.Liman ER, Buck LB. A second subunit of the olfactory cyclic nucleotide-gated channel confers high sensitivity to cAMP. Neuron. 1994;13:611–621. doi: 10.1016/0896-6273(94)90029-9. [DOI] [PubMed] [Google Scholar]
- 38.Ludwig J, Margalit T, Eismann E, Lancet D, Kaupp UB. Primary structure of cAMP-gated channel from bovine olfactory epithelium. FEBS Lett. 1990;270:24–29. doi: 10.1016/0014-5793(90)81226-e. [DOI] [PubMed] [Google Scholar]
- 39.Luo Y, Lu S, Chen P, Wang D, Halpern M. Identification of chemoattractant receptors and G-proteins in the vomeronasal system of garter snakes. J Biol Chem. 1994;269:16867–16877. [PubMed] [Google Scholar]
- 40.Lynch JW, Barry PH. Action potentials initiated by single channels opening in a small neuron (rat olfactory receptor). Biophys J. 1989;55:755–768. doi: 10.1016/S0006-3495(89)82874-7. [DOI] [PMC free article] [PubMed] [Google Scholar]
- 41.Lynch JW, Barry PH. Properties of transient K+ currents and underlying single K+ channels in rat olfactory neurons. J Gen Physiol. 1991;97:1043–1072. doi: 10.1085/jgp.97.5.1043. [DOI] [PMC free article] [PubMed] [Google Scholar]
- 42.Maue R, Dionne V. Patch-clamp studies of isolated mouse olfactory receptor neurons. J Gen Physiol. 1987;90:95–125. doi: 10.1085/jgp.90.1.95. [DOI] [PMC free article] [PubMed] [Google Scholar]
- 43.Michel WC, Ache BW. Cyclic nucleotides mediate an odor-evoked potassium conductance in lobster olfactory receptor cells. J Neurosci. 1992;12:3979–3984. doi: 10.1523/JNEUROSCI.12-10-03979.1992. [DOI] [PMC free article] [PubMed] [Google Scholar]
- 44.Miyamoto T, Restrepo D, Teeter JH. Voltage-dependent and odorant-regulated currents in isolated olfactory neurons of the channel catfish. J Gen Physiol. 1992;99:505–530. doi: 10.1085/jgp.99.4.505. [DOI] [PMC free article] [PubMed] [Google Scholar]
- 45.Nakamura T, Gold GH. A cyclic nucleotide-gated conductance in olfactory receptor cilia. Nature. 1987;325:442–444. doi: 10.1038/325442a0. [DOI] [PubMed] [Google Scholar]
- 46.Nevitt GA, Moody WJ. An electrophysiological characterization of ciliated olfactory receptor cells of the coho salmon Oncorhynchus kisutch . J Exp Biol. 1992;166:1–17. doi: 10.1242/jeb.166.1.1. [DOI] [PubMed] [Google Scholar]
- 47.Pixley SK. CNS glial cells support in vitro survival, division, and differentiation of dissociated olfactory neuronal progenitor cells. Neuron. 1992;8:1191–1204. doi: 10.1016/0896-6273(92)90139-5. [DOI] [PubMed] [Google Scholar]
- 48.Pun RY, Gesteland RC. Somatic sodium channels of frog olfactory receptor neurones are inactivated at rest. Pflügers Arch. 1991;418:504–511. doi: 10.1007/BF00497779. [DOI] [PubMed] [Google Scholar]
- 49.Pusch M, Neher E. Rates of diffusional exchange between small cells and a measuring patch pipette. Pflügers Arch. 1988;411:204–211. doi: 10.1007/BF00582316. [DOI] [PubMed] [Google Scholar]
- 50.Rajendra S, Lynch JW, Barry PH. An analysis of Na+ currents in rat olfactory receptor neurons. Pflügers Arch. 1992;420:342–346. doi: 10.1007/BF00374468. [DOI] [PubMed] [Google Scholar]
- 51.Reed RR. Signaling pathways in odorant detection. Neuron. 1992;8:205–209. doi: 10.1016/0896-6273(92)90287-n. [DOI] [PubMed] [Google Scholar]
- 52.Ressler KJ, Sullivan SL, Buck LB. Information coding in the olfactory system: evidence for a stereotyped and highly organized epitope map in the olfactory bulb. Cell. 1994;79:1245–1255. doi: 10.1016/0092-8674(94)90015-9. [DOI] [PubMed] [Google Scholar]
- 53.Ronnett GV, Snyder SH. Molecular messengers of olfaction. Trends Neurosci. 1992;15:508–513. doi: 10.1016/0166-2236(92)90104-g. [DOI] [PubMed] [Google Scholar]
- 54.Schild D. Whole-cell currents in olfactory receptor cells of Xenopus laevis . Exp Brain Res. 1989;78:223–232. doi: 10.1007/BF00228894. [DOI] [PubMed] [Google Scholar]
- 55.Shinohara H, Asano T, Kato K. Differential localization of G-proteins Gi and Go in the accessory olfactory bulb of the rat. J Neurosci. 1992;12:1275–1279. doi: 10.1523/JNEUROSCI.12-04-01275.1992. [DOI] [PMC free article] [PubMed] [Google Scholar]
- 56.Taniguchi M, Kashiwayanagi M, Kurihara K. Intracellular injection of inositol 1,4,5-trisphosphate increases a conductance in membranes of turtle vomeronasal receptor neurons in the slice preparation. Neurosci Lett. 1995;188:5–8. doi: 10.1016/0304-3940(95)11379-b. [DOI] [PubMed] [Google Scholar]
- 57.Taniguchi M, Kashiwayanagi M, Kurihara K. Intracellular dialysis of cyclic nucleotides induces inward currents in turtle vomeronasal receptor neurons. J Neurosci. 1996;16:1239–1246. doi: 10.1523/JNEUROSCI.16-03-01239.1996. [DOI] [PMC free article] [PubMed] [Google Scholar]
- 58.Trombley PQ, Westbrook GL. Voltage-gated currents in identified rat olfactory receptor neurons. J Neurosci. 1991;11:435–444. doi: 10.1523/JNEUROSCI.11-02-00435.1991. [DOI] [PMC free article] [PubMed] [Google Scholar]
- 59.Trotier D. A patch-clamp analysis of membrane currents in salamander olfactory receptor cells. Pflügers Arch. 1986;407:589–595. doi: 10.1007/BF00582636. [DOI] [PubMed] [Google Scholar]
- 60.Trotier D, Doving KB. Direct influence of the sodium pump on the membrane potential of vomeronasal chemoreceptor neurones in frog. J Physiol (Lond) 1996;490:611–621. doi: 10.1113/jphysiol.1996.sp021171. [DOI] [PMC free article] [PubMed] [Google Scholar]
- 61.Trotier D, Doving KB, Rosin J. Voltage-dependent currents in microvillar receptor cells in the frog vomeronasal organ. Eur J Neurosci. 1993;5:995–1002. doi: 10.1111/j.1460-9568.1993.tb00951.x. [DOI] [PubMed] [Google Scholar]
- 62.Tsien RW, Fox AP, Hess P, McCleskey EW, Nilius B, Nowycky MC, Rosenberg RL. Multiple types of calcium channel in excitable cells. Soc Gen Physiol Ser. 1987;41:167–187. [PubMed] [Google Scholar]
- 63.Tucker D. Nonolfactory responses from the nasal cavity: Jacobson’s organ and the trigeminal system. In: Beidler LM, editor. Chemical senses part 1—olfaction. Springer; Berlin: 1971. pp. 151–181. [Google Scholar]
- 64.Vaccarezza OL, Sepich LN, Tramezzani JH. The vomeronasal organ of the rat. J Anat. 1981;132:167–185. [PMC free article] [PubMed] [Google Scholar]
- 65.Vassar R, Chao SK, Sitcheran R, Nunez JM, Vosshall LB, Axel R. Topographic organization of sensory projections to the olfactory bulb. Cell. 1994;79:981–991. doi: 10.1016/0092-8674(94)90029-9. [DOI] [PubMed] [Google Scholar]
- 66.Wysocki CJ, Meredith M. The vomeronasal system. In: Finger TE, Silver WL, editors. Neurobiology of taste and smell. Wiley; New York: 1987. pp. 125–150. [Google Scholar]
- 67.Yau K-W, Chen T-Y. Cyclic nucleotide-gated channels. In: North RA, editor. Ligand and voltage-gated ion channels. CRC; Boca Raton: 1995. pp. 307–335. [Google Scholar]