Abstract
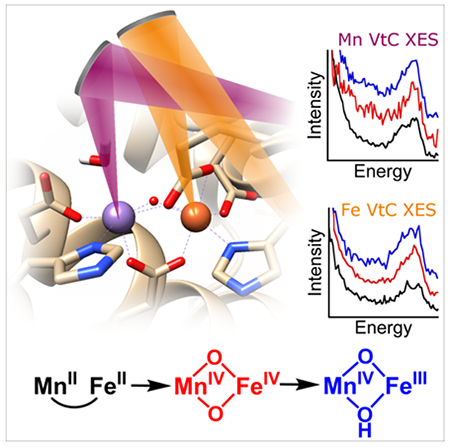
Proton transfer reactions are of central importance to a wide variety of biochemical processes, though determining proton location and monitoring proton transfers in biological systems is often extremely challenging. Herein, we use two-color valence-to-core x-ray emission spectroscopy (VtC XES) to identify protonation events across three oxidation states of the O2-activating, radical-initiating manganese-iron heterodinuclear cofactor in a class I-c ribonucleotide reductase. This is the first application of VtC XES to an enzyme intermediate and the first simultaneous measurement of two-color VtC spectra. In contrast to more conventional methods of assessing protonation state, VtC XES is a more direct probe applicable to a wide range of metalloenzyme systems. These data, coupled to insight provided by DFT calculations, allow the inorganic cores of the MnIVFeIV and MnIVFeIII states of the enzyme to be assigned as MnIV(μ-O)2FeIV and MnIV(μ-O)( μ-OH)FeIII, respectively.
Keywords: x-ray emission spectroscopy, valence-to-core, bioinorganic, metalloenzymes, two-color
Two-color valence-to-core x-ray emission spectroscopy is used to probe the protonation patterns of several metallocofactor oxidation states involved in the activation of a class I-c ribonucleotide reductase from Chlamydia trachomatis. These spectra—augmented by insight from DFT computations—allow assignment of MnIV(O)2FeIV and MnIV(O)(OH)FeIII states during enzyme activation.

Nature employs metalloenzymes to catalyze some of its most challenging chemical reactions, including C-H activation, water splitting, and dinitrogen reduction.[1] In these reactions, biological systems must generate highly reactive species and control them to avoid cell damage through adventitious reactions, such as production of reactive oxygen species and enzyme auto-oxidation. To limit this danger, enzymes have evolved various mechanisms to control these reactive species, including forming intermediates in the protective environment of the enzyme and doing so only when substrate is present.[2] Another mechanism of control is to modulate reactivity via precise transfer of protons to and from the active site. Changes in protonation state can significantly influence redox potential and aid in bond activation, and, because enzymes can control access to protons via hydrogen bond networks and conformational changes, they can thereby both prevent the formation of reactive intermediates until the enzyme is poised for turnover and shield them from unproductive decay.
A classic example of enzymes harnessing the power of high valent metals occurs in class I ribonucleotide reductases (RNRs), enzymes that reduce ribonucleotides to deoxyribonucleotides.[3] The reaction is initiated when an active-site cysteine residue in the catalytic α subunit is oxidized by a stable oxidant in the β subunit through a series of proton-coupled electron transfers along a pathway of aromatic and acidic amino acids.[4] A particularly interesting example is the class I-c RNR from the pathogen Chlamydia trachomatis (Ct), which utilizes an unusual MnIVFeIII heterodinuclear cofactor, with the MnIV ion serving as the stable oxidant.[5] This cofactor is assembled by reaction of the MnIIFeII state (2/2) with O2 via a transient MnIVFeIV intermediate (4/4), which is reduced by an exogenous electron source to the catalytically active MnIVFeIII (4/3) (Scheme 1).[6]
Scheme 1.

Putative protonation pattern of the inorganic core of Ct RNR-β during enzyme activation.
The precise structures and protonation states of these and other high-valent biological Fe and Mn complexes have excited considerable interest and investigation.[7] Unfortunately, the protonation pattern of Ct RNR-β remains poorly understood and is the subject of ongoing research. Only recently was a combined EXAFS / ENDOR study able to suggest, based on Mn-Fe distance and absence of strong hyperfine coupling to hydrogen, that 4/4 possesses a di-μ-oxo MnIV(O)2FeIV core and terminal OH ligand bound to Mn.[7e] Previously, 4/3 was proposed to have a MnIV(O)(OH)FeIII core,[7b, 8] suggesting the protonation pattern depicted in Scheme 1. These assignments rely, however, on indirect arguments, as intermetallic distances and absence of magnetic coupling are only proxies for the protonation state of the metallocofactor.
This situation exemplifies a general problem in bioinorganic chemistry; namely, despite their importance, protons are notoriously difficult to track in biological systems. Neutron diffraction—likely the most direct means of probing for the presence of protons—has sample requirements that largely preclude its application to biological systems. Of the methods commonly applied to enzymes, x-ray crystallography and EXAFS can only infer protonation state via metrics such as metal-ligand bond lengths. Vibrational techniques like resonance Raman and nuclear resonance vibrational spectroscopy, as well as electron paramagnetic resonance methods, can more directly probe protonation, but these require isotope substitution, accessible absorption features, and half-integer spin states, limiting their applications for enzyme systems.
Valence-to-core Kβ x-ray emission spectroscopy (VtC XES) provides a more general approach to assessing protonation states in metallocofactors.[9] In this element selective technique, a high energy x-ray photon generates a 1s core hole on an absorbing metal atom. Following ionization, electrons from higher-lying orbitals fill the core hole, emitting x-ray fluorescence; when these electrons originate in ligand-localized valence orbitals (i.e. VtC transitions),[10] the resulting spectra are sensitive to the electronic structure of the ligands. The identity[11] and number of ligands,[12] the degree of activation of diatomic ligands,[13] and, in some cases, bond angles[14] can all be probed by VtC XES. Indeed, the sensitivity of VtC XES to ligand electronic structure is sufficient to identify ligand protonation events in small molecule systems, both theoretically[15] and experimentally.[16] To date, however, VtC XES has not been used to assess protonation changes throughout an enzyme reaction.
The challenges presented by tracking protons in metalloenzymes are compounded in systems with heterometallic cofactors—a category that includes the class I-c RNRs, photosystem II, MoFe and VFe nitrogenases, and NiFe hydrogenases. In order to fully understand reactivity of heterometallic cofactors, knowledge of the chemistry occurring at all metal centers, during each reaction step, is required. Studies of such systems using element-specific x-ray spectroscopies typically involve serial measurement of each metal, a strategy that can lead to errors from sample variability and difficulty in assessing photoreduction of all metal centers.[7e] Serial data collection also multiplies required collection time and sample quantity, a nontrivial consideration with enzyme intermediates. Ideally, data from all metals in a heterometallic cofactor should be collected simultaneously.
To this end, XES offers an opportunity: If all metals in a sample can be excited at a common incident energy (i.e. the absorption edges are similar in energy), all will generate x-ray emission that can be collected. Indeed, such “two-color” data collection has recently been implemented.[17] This method reduces or eliminates the impact of sample inhomogeneity and radiation damage on the two spectra.
Herein, we investigate the protonation patterns of three oxidation states of the Ct RNR-β metallocofactor using the dual array valence emission spectrometer (DAVES) at CHESS C-line[17a] to collect Mn and Fe XES spectra simultaneously. These data are, to our knowledge, the first VtC spectra of an enzyme intermediate and also the first two-color VtC to be reported. Supported by DFT calculations, these data allow for assignment of protonation state in this challenging metalloenzyme system.
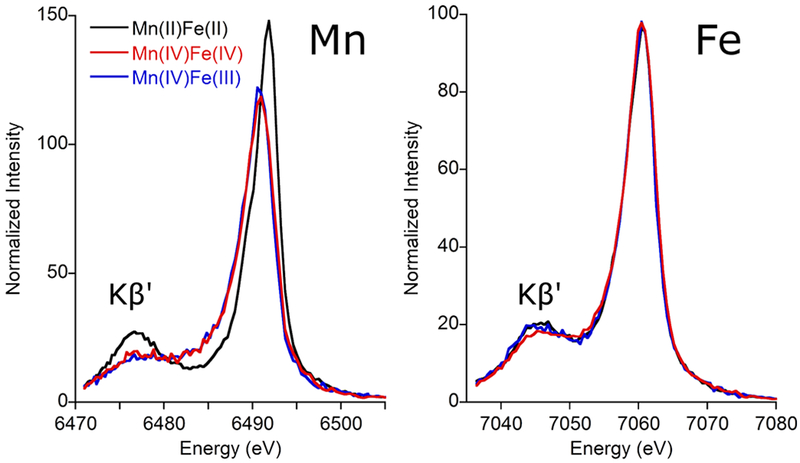
The Kβ mainline XES spectra (Fig. 1) arise from metal-centered 3p → 1s transitions and are sensitive to metal spin state and metal-ligand covalency.[18] For Mn, the S=5/2 MnII in 2/2 is clearly distinct from the S=3/2 MnIV in 4/4 and 4/3. The Fe mainline spectra for 2/2 and 4/3, on the other hand, are nearly identical despite differences in metal oxidation state; this similarity is well-known and arises because the increased covalency of FeIII complexes relative to those of FeII cancels out the effect of increased spin state.[15b, 19] The S=2 FeIV in 4/4 is both more covalent and of lower spin; correspondingly, it shows a slight decrease in intensity of the low energy Kβ’ line (Fig. 1, red). This modest change relative to the mainlines of FeII and FeIII is consistent with previously reported FeIV data[19] and potentially also reflects the presence of a small amount of FeIII (~15%) in the sample of 4/4 (Fig. S2).
Figure 1.

The Kβ mainline spectra for Mn (left) and Fe (right) in Ct RNR-β.
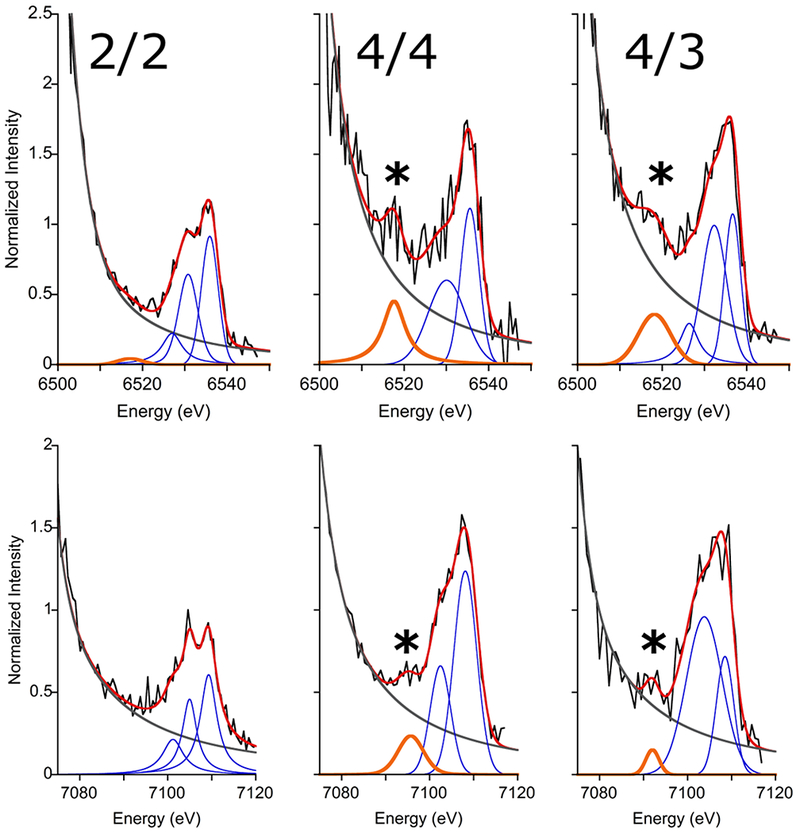
The VtC XES spectra (Fig. 2) are ~100x weaker than the Kβ mainlines and comprise two primary components: the lower-energy Kβ” region (orange fit) and the higher energy Kβ2,5 region (blue fit). Kβ” features arise when electrons residing in ligand ns orbitals decay to the fill the metal 1s core hole. The Kβ2,5 region, on the other hand, encompasses transitions arising from a mixture of ligand ns and np orbitals and thus often requires a more complicated interpretation than the Kβ” peaks. Such an analysis can be challenging when the Kβ2,5 transitions are poorly resolved from each other and when spectra have low signal-to-noise, as is the case here. As such, our analysis will focus on the Kβ” region, the intensity of which can be related to ligand protonation.
Figure 2.

Representative fits to the VtC spectra for Mn (top) and Fe (bottom). In all panels: data (black), fit (red), background (grey), Kβ” (orange, also marked with *), and Kβ2,5 peaks (blue).
The Kβ” intensity is governed by overlap between ligand 2s and the metal np orbitals—larger overlap leads to greater intensity—resulting in the established exponential dependence of Kβ” intensity on M-L bond length.[15b] Kβ” energy, meanwhile, is determined by donor 2s orbital ionization energy, with larger ionization energies yielding lower XES energies. In Ct RNR-β, the (hydr)oxo ligands in 4/4 and 4/3 exhibit significantly shorter M-L bonds than the rest of the ligands[7b, 7e] and therefore dominate the Kβ” region. Conversion from 4/4 to 4/3 is proposed to result in protonation of one oxo ligand in the di-μ-oxo core of 4/4 (Scheme 1), which should elongate the M-O bonds and delocalize O 2s character away from the metals; both effects would reduce metal np overlap and thus reduce Kβ” intensity. As such, monitoring the Kβ” feature should allow an assessment of protonation during 4/4 to 4/3 conversion.
In order to quantify the intensity of the Kβ” feature, the VtC spectra were fit using a series of pseudo-Voigt functions; the reported values (Table 1) represent the average of statistically-equivalent, physically-reasonable fits. The declining background (Fig. 2, grey line) is the high energy tail from the fit to the Kβ mainline; because the mainlines are intense and well-resolved, errors resulting from the background are expected to be small. Additional support for these values and details of the data fitting and statistics are found in the Supporting Information.
Table 1.
Numerical parameters for Mn and Fe VtC fits.a
| Mn | VtC Area | Kβ” Area | Kβ” IWAEb (eV) |
|---|---|---|---|
| 2/2 | 11.13 (11) | 0.32 (1) | 6517.1 (1) |
| 4/4 | 17.58 (22) | 4.81 (22) | 6517.6 (1) |
| 4/3 | 18.76 (38) | 3.72 (37) | 6518.2 (1) |
| Fe | VtC Area | Kβ” Area | Kβ” IWAEa (eV) |
| 2/2 | 9.04 (90) | — | — |
| 4/4 | 13.31 (1.70) | 1.48 (76) | 7095.3 (5) |
| 4/3 | 13.92 (1.39) | 0.58 (6) | 7092.0 (1) |
Parenthetical values indicate uncertainty in final digits.
Intensity-weighted average energies.
The VtC spectra of 2/2 exhibit low total intensity and minimal Kβ” intensity for Mn and Fe (Fig. 2), as expected given the long M-L bonds of high-spin, divalent metal ions.[15b, 20] Upon conversion to 4/4, the overall VtC intensities increase for both metals and Kβ” features become apparent in both spectra, consistent with the formation of oxo bridge(s). Subsequent reduction to 4/3 does not significantly impact the total VtC intensity for either metal but does modulate the Kβ” features. For Fe, the Kβ” is markedly diminished (by ~60%), likely due to the bond elongation associated with reduction from FeIV to FeIII. Mn, on the other hand, shows a comparatively modest decrease in Kβ” intensity (~25%). This observed reduction in Kβ” intensity suggests loss of an oxo bridge while the significant remaining intensity implies that 4/3 retains oxo ligation. The data, then, are consistent with the protonation patterns in Scheme 1; conversion of 4/4 to 4/3 results in protonation of one oxo bridge of the inorganic core, whereas the other remains intact.
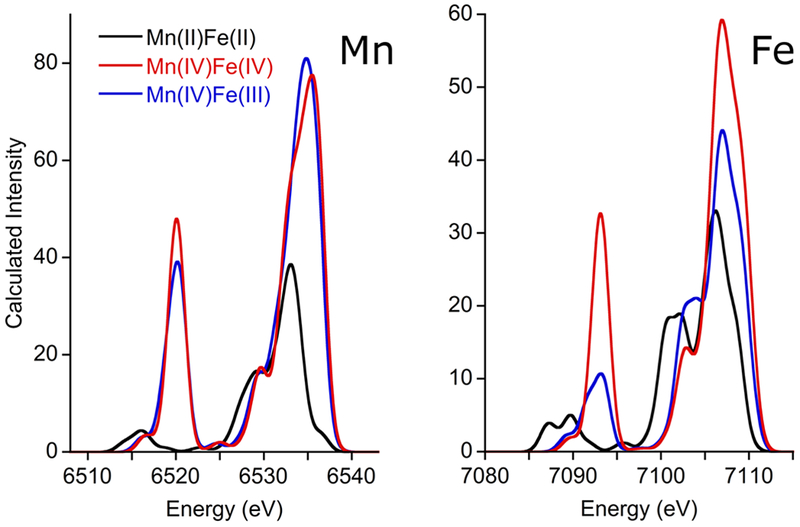
Unfortunately, in the absence of detailed structural data, it is not possible to relate the magnitude of Kβ” intensity directly to the number of oxo ligands, as many other factors, including the M-O bond lengths and M-O-M bond angles, contribute to the Kβ” intensity.[14] Therefore, to interpret the experimental data more deeply, we calculated VtC spectra using DFT (Fig. 3). For both Mn and Fe, these methods have been shown to reliably reproduce experimental VtC data.[15b, 20] Previously reported models of the 2/2, 4/4, and 4/3 cofactors[21] were pared down to the first shell residues and geometry optimized with ORCA[22] (Fig. S6). In all cases, the obtained structures satisfactorily matched available metrical data (Table S2), and so the optimized models were used to calculate VtC spectra for all three species.
Figure 3.

Calculated VtC spectra for Mn (left) and Fe (right) of 2/2, 4/4, and 4/3. The calculated spectra have been broadened by 2 eV and shifted to align with experiment.
The calculated spectra generally reproduce the observed intensity changes, including the small reduction in Mn Kβ” intensity and the significant reduction in Fe Kβ” intensity seen for 4/3 relative to 4/4 (Fig. 3). Inspection of the optimized structures provides an immediate explanation for the Mn VtC experimental observations. On conversion of 4/4 to 4/3, protonation of the oxo bridge results in significant (~0.12 Å) elongation of the corresponding Mn-O bond; concurrently, the extant Mn-Ooxo bond contracts by ~0.08 Å. This contraction of the already short Mn-O bond partially compensates for the Kβ” intensity lost upon protonation of the other oxo. Moreover, the terminal Mn-OH bond is quite short for both 4/4 and 4/3 (~1.82 Å), providing additional Kβ” intensity that further mitigates the diminution of this feature upon oxo protonation. Both of these structural elements—the short terminal Mn-OH bond and the Mn-Ooxo contraction in the 4/3—have been seen in previous DFT calculations on Ct RNR-β.[7b, 21] The possibility of protonation occurring at the terminal Mn-bound OH was also explored and found to be inconsistent with the data (details in the Supporting Information). The calculated spectra for Fe are also consistent with experiment; specifically, an intense Kβ” peak calculated for 4/4 is predicted to become markedly less intense upon conversion to 4/3, consistent with the loss of one oxo moiety and the generally longer bonds present for FeIII compared to FeIV. We note that the calculations predict the overall Fe VtC intensity should be greater for 4/4 than for 4/3, though the experimental areas are not statistically different. Higher quality data might permit this increase to be seen experimentally; it is also possible that the calculations systematically overestimate the intensity for FeIV, as very few experimental FeIV VtC spectra are available for comparison to computations.
In summary, the two-color VtC XES data have allowed the protonation patterns in the 4/4 and 4/3 states of Ct RNR-β to be assigned as MnIV(μ-O)2FeIV and MnIV(μ-O)(μ-OH)FeIII, respectively. This study has the advantage over previous investigations of this system of probing the (hydr)oxo electronic structure and thus enabling a more direct assignment of the core protonation state. More generally, we demonstrate that, although experimentally challenging, the long-proposed application of VtC XES to enzyme intermediates is indeed feasible. For metalloenzyme intermediates with well-defined outstanding questions regarding active site structure–including such notable examples as methane monooxygenase intermediate Q and the S2 and S3 states of photosystem II–VtC XES investigation is thus established as a viable experimental approach.
Supplementary Material
Acknowledgements
C.J.P. and E.J.B. thank the National Institutes of Health for National Research Service Awards (GM113389-01 and GM116353-01). This material is based upon work supported by the National Science Foundation Graduate Research Fellowship Program under grant no. DGE1255832 (R.J.M.) and by the National Institutes of Health (GM55365 to J.M.B. and C.K.). This work is based upon research conducted at the Cornell High Energy Synchrotron Source (CHESS) which is supported by the National Science Foundation under award DMR-1332208.
Footnotes
Supporting information for this article is given via a link at the end of the document.
Contributor Information
Ryan J. Martinie, Department of Chemistry, The Pennsylvania State University, 318 Chemistry Building, University Park, PA 16802, USA
Dr. Elizabeth J. Blaesi, Department of Chemistry, The Pennsylvania State University, 318 Chemistry Building, University Park, PA 16802, USA
Prof. Dr. J. Martin Bollinger, Jr., Departments of Chemistry and Biochemistry, The Pennsylvania State University, 318 Chemistry Building, University Park, PA 16802, USA
Prof. Dr. Carsten Krebs, Departments of Chemistry and Biochemistry, The Pennsylvania State University, 318 Chemistry Building, University Park, PA 16802, USA
Dr. Kenneth D. Finkelstein, Cornell High Energy Synchrotron Source, Wilson Laboratory, Cornell University, Ithaca, NY 14853, USA
Dr. Christopher J. Pollock, Department of Chemistry, The Pennsylvania State University, 318 Chemistry Building, University Park, PA 16802, USA.
References
- [1].Lippard SJ; Berg JM, Principles of Bioinorganic Chemistry. University Science Books: Mill Valley, CA, 1994. [Google Scholar]
- [2].Bollinger JM Jr.; Chang W.-c.; Matthews ML; Martinie RJ; Boal AK; Krebs C, 2-Oxoglutarate-Dependent Oxygenases RSC Metallobiology; Royal Society of Chemistry: Cambridge, UK, 2015. [Google Scholar]
- [3].Cotruvo JA Jr.; Stubbe J, Annu. Rev. Biochem 2011, 80, 733–767. [DOI] [PMC free article] [PubMed] [Google Scholar]
- [4].Stubbe J; Nocera DG; Yee CS; Chang MCY, Chem. Rev 2003, 103, 2167–2202. [DOI] [PubMed] [Google Scholar]
- [5].a) Jiang W; Bollinger JM Jr.; Krebs C, J. Am. Chem. Soc 2007, 129, 7504–7505 [DOI] [PMC free article] [PubMed] [Google Scholar]; b) Jiang W; Yun D; Saleh L; Barr EW; Xing G; Hoffart LM; Maslak M-A; Krebs C; Bollinger JM Jr., Science 2007, 316, 1188–1191. [DOI] [PubMed] [Google Scholar]
- [6].a) Jiang W; Yun D; Saleh L; Bollinger JM Jr.; Krebs C, Biochemistry 2008, 47, 13736–13744 [DOI] [PMC free article] [PubMed] [Google Scholar]; b) Jiang W; Hoffart LM; Krebs C; Bollinger JM Jr., Biochemistry 2007, 46, 8709–8716. [DOI] [PMC free article] [PubMed] [Google Scholar]
- [7].a) Shu LJ; Nesheim JC; Kauffmann K; Münck E; Lipscomb JD; Que L Jr., Science 1997, 275, 515–518 [DOI] [PubMed] [Google Scholar]; b) Younker JM; Krest CM; Jiang W; Krebs C; Bollinger JM Jr.; Green MT, J. Am. Chem. Soc 2008, 130, 15022–15027 [DOI] [PMC free article] [PubMed] [Google Scholar]; c) Banerjee R; Proshlyakov Y; Lipscomb JD; Proshlyakov DA, Nature 2015, 518, 431–434 [DOI] [PMC free article] [PubMed] [Google Scholar]; d) Doan PE; Shanmugam M; Stubbe J; Hoffman BM, J. Am. Chem. Soc 2015, 137, 15558–15566 [DOI] [PMC free article] [PubMed] [Google Scholar]; e) Martinie RJ; Blaesi EJ; Krebs C; Bollinger JM Jr.; Silakov A; Pollock CJ, J. Am. Chem. Soc 2017, 139, 1950–1957 [DOI] [PMC free article] [PubMed] [Google Scholar]; f) Pushkar Y; Davis KM; Palenik MC, J. Phys. Chem. Lett 2018, 9, 3525–3531. [DOI] [PubMed] [Google Scholar]
- [8].Kwak Y; Jiang W; Dassama LMK; Park K; Bell CB; Liu LV; Wong SD; Saito M; Kobayashi Y; Kitao S; Seto M; Yoda Y; Alp EE; Zhao J; Bollinger JM Jr.; Krebs C; Solomon EI, J. Am. Chem. Soc 2013, 135, 17573–17584. [DOI] [PMC free article] [PubMed] [Google Scholar]
- [9].Pollock CJ; DeBeer S, Acc. Chem. Res 2015, 48, 2967–2975. [DOI] [PubMed] [Google Scholar]
- [10].Glatzel P; Bergmann U, Coord. Chem. Rev 2005, 249, 65–95. [Google Scholar]
- [11].a) Bergmann U; Horne CR; Collins TJ; Workman JM; Cramer SP, Chem. Phys. Lett 1999, 302, 119–124 [Google Scholar]; b) Lancaster KM; Roemelt M; Ettenhuber P; Hu Y; Ribbe MW; Neese F; Bergmann U; DeBeer S, Science 2011, 334, 974–977 [DOI] [PMC free article] [PubMed] [Google Scholar]; c) Pushkar Y; Long X; Glatzel P; Brudvig GW; Dismukes GC; Collins TJ; Yachandra VK; Yano J; Bergmann U, Angew. Chem. Int. Ed 2010, 49, 800–803. [DOI] [PMC free article] [PubMed] [Google Scholar]
- [12].Stieber SCE; Milsmann C; Hoyt JM; Turner ZR; Finkelstein KD; Wieghardt K; DeBeer S; Chirik PJ, Inorg. Chem 2012, 51, 3770–3785. [DOI] [PubMed] [Google Scholar]
- [13].Pollock CJ; Grubel K; Holland PL; DeBeer S, J. Am. Chem. Soc 2013, 135, 11803–11808. [DOI] [PMC free article] [PubMed] [Google Scholar]
- [14].Pollock CJ; Lancaster KM; Finkelstein KD; DeBeer S, Inorg. Chem 2014, 53, 10378–10385. [DOI] [PMC free article] [PubMed] [Google Scholar]
- [15].a) Smolentsev G; Soldatov AV; Messinger J; Merz K; Weyhermuller T; Bergmann U; Pushkar Y; Yano J; Yachandra VK; Glatzel P, J. Am. Chem. Soc 2009, 131, 13161–13167 [DOI] [PMC free article] [PubMed] [Google Scholar]; b) Lee N; Petrenko T; Bergmann U; Neese F; DeBeer S, J. Am. Chem. Soc 2010, 132, 9715–9727 [DOI] [PubMed] [Google Scholar]; c) Kropp H; King AE; Khusniyarov MM; Heinemann FW; Lancaster KM; DeBeer S; Bill E; Meyer K, J. Am. Chem. Soc 2012, 134, 15538–15544. [DOI] [PubMed] [Google Scholar]
- [16].a) Lassalle-Kaiser B; Boron TT; Krewald V; Kern J; Beckwith MA; Delgado-Jaime MU; Schroeder H; Alonso-Mori R; Nordlund D; Weng T-C; Sokaras D; Neese F; Bergmann U; Yachandra VK; DeBeer S; Pecoraro VL; Yano J, Inorg. Chem 2013, 52, 12915–12922 [DOI] [PMC free article] [PubMed] [Google Scholar]; b) Mijovilovich A; Hamman S; Thomas F; de Groot FMF; Weckhuysen BM, Phys Chem Chem Phys 2011, 13, 5600–5604. [DOI] [PubMed] [Google Scholar]
- [17].a) Finkelstein KD; Pollock CJ; Lyndaker A; Krawcyk T; Conrad J, AIP Conference Proceedings 2016, 1741, 030009 [Google Scholar]; b) Gul S; Ng JWD; Alonso-Mori R; Kern J; Sokaras D; Anzenberg E; Lassalle-Kaiser B; Gorlin Y; Weng T-C; Zwart PH; Zhang JZ; Bergmann U; Yachandra VK; Jaramillo TF; Yano J, Phys Chem Chem Phys 2015, 17, 8901–8912. [DOI] [PMC free article] [PubMed] [Google Scholar]
- [18].a) Peng G; de Groot FMF; Hamalainen K; Moore JA; Wang X; Grush MM; Hastings JB; Siddons DP; Armstrong WH; Mullins OC; Cramer SP, J. Am. Chem. Soc 1994, 116, 2914–2920 [Google Scholar]; b) Pollock CJ; Delgado-Jaime MU; Atanasov M; Neese F; DeBeer S, J. Am. Chem. Soc 2014, 136, 9453–9463. [DOI] [PMC free article] [PubMed] [Google Scholar]
- [19].Gamblin SD; Urch DS, J. Electron Spectrosc. Relat. Phenom 2001, 113, 179–192. [Google Scholar]
- [20].Beckwith MA; Roemelt M; Collomb M.-N. l.; DuBoc C; Weng T-C; Bergmann U; Glatzel P; Neese F; DeBeer S, Inorg. Chem 2011, 50, 8397–8409. [DOI] [PubMed] [Google Scholar]
- [21].Han W-G; Giammona DA; Bashford D; Noodleman L, Inorg. Chem 2010, 49, 7266–7281. [DOI] [PMC free article] [PubMed] [Google Scholar]
- [22].Neese F, Wiley Interdisciplinary Reviews : Computational Molecular Science 2012, 2, 73–78. [DOI] [PMC free article] [PubMed] [Google Scholar]
Associated Data
This section collects any data citations, data availability statements, or supplementary materials included in this article.


