Abstract
At early neural tube stages, individual stem cells can generate neural crest cells as well as dorsal or ventral spinal cord cells. To determine whether this pluripotency is lost as development proceeds, we back-transplanted quail spinal cells from different developmental stages and different spinal locations into the crest migratory pathways of st 16–20 chicken host embryos. The transplanted spinal cells from st 27 dorsal cord and st 18 ventral cord differentiated within the new crest environment into sensory and sympathetic neurons, satellite and Schwann cells, and melanocytes. St 27 ventral cells still generated several crest derivatives but not sensory or sympathetic neurons. This loss in ability to produce neurons correlates with the end of neurogenesis in ventral cord. The end of neurogenesis in the cord, therefore, results from an intrinsic change in the potential of spinal neuroepithelial cells to generate neurons.
Keywords: neuroepithelial cells, cell fate, cell determination, neural crest, spinal cord, transplantation
At early neural tube stages, cells from the most dorsal aspects of the tube migrate into the surrounding tissue where they give rise to many different cell types, including sensory and autonomic neurons, satellite cells, Schwann cells, and melanocytes (Weston, 1981; Le Douarin, 1982). The emerging view is that at early neural tube stages individual neuroepithelial cells are pluripotent and can give rise to all types of neural crest (NC) derivatives as well as neurons and glia that remain in the spinal cord (Scherson et al., 1993;Selleck et al., 1993; Artinger et al., 1995). Once crest cells have migrated away from the tube, there is a progressive restriction in their developmental potential (Anderson, 1989; Weston, 1991).
A progressive restriction of cell fates for neuroepithelial cells remaining within the neural tube is less clear. Neuroepithelial cells at stages before neural tube closure are able to generate both dorsal and ventral phenotypes within the spinal cord as well as NC derivatives. Placement of a notochord adjacent to the dorsal region of a newly closed neural tube induces dorsal neuroepithelial cells to express ventral cord markers (Artinger et al., 1995). If the dorsal portion of the neural tube is removed before NC emigration, the remaining ventral portion is able to generate normal NC derivatives (Scherson et al., 1993). But if the deletion is made shortly after emigration, NC derivatives are not generated (Scherson et al., 1993;Sechrist et al., 1995). When do neuroepithelial cells within the cord become truly restricted in their potential to generate progeny with crest phenotypes?
The recent demonstration of a second major emigration of neuroepithelial cells away from the neural tube into sensory ganglia shows that at least some cells within the tube retain their ability to develop as crest cells until well after normal crest migration (Sharma et al., 1995). Only the cells within the dorsal half of the spinal cord contribute to this late-migrating population, and they contribute only to a subset of possible crest phenotypes. These results, together with those of Bronner-Fraser and coworkers (Scherson et al., 1993; Sechrist et al., 1995), might reflect both a loss in potential of cells in the ventral cord to develop as crest cells and a restriction in the possible crest-like fates of the dorsal cells.
To test these possibilities, we have transplanted cells from dorsal or ventral spinal cord into the crest migratory pathway of younger embryos and then followed their development over time to analyze their phenotypes. Cells from the dorsal spinal cord even 1–2 d after the end of normal crest emigration continue to divide after transplantation, migrate along the crest migratory pathways, and give rise to a variety of crest derivatives including peripheral neurons. In contrast, cells from the ventral cord at the same stage are restricted in their developmental potential. Although they also continue to divide after transplantation, ventral cells migrate less extensively and do not produce peripheral neurons.
MATERIALS AND METHODS
Transplantation experiments. White Leghorn chick embryos (SPAFAS) were used as hosts and quail embryos as donors in all experiments. Host and donor embryos were staged according to Hamburger and Hamilton (1951). St 17–28 quail spinal cords were separated into dorsal and ventral halves with tungsten needles. Donor cells were dissociated by incubation for 10 min in calcium/magnesium-free (CMF)-trypsin solution (0.1 mg/ml) at 22°C followed by trituration with a fire-polished Pasteur pipette. After centrifugation, the cell pellet was resuspended in MEM with 0.01% Fast Green for visualization during transplantation. Approximately 200–500 cells were drawn into a polished glass electrode (tip diameter 10–30 μm) in 0.5 μl of solution. Chick embryo hosts (st 16–20) were exposed for transplantation by opening the vitelline membrane. The tip of the electrode was then positioned just beneath the host ectoderm and just lateral to the neural tube in the cranial half of a somite, and the cells were injected with pressure pulses under visual control. All transplantations were made at the level of the wing bud. Eggs were then sealed with cellophane tape and returned to the incubator.
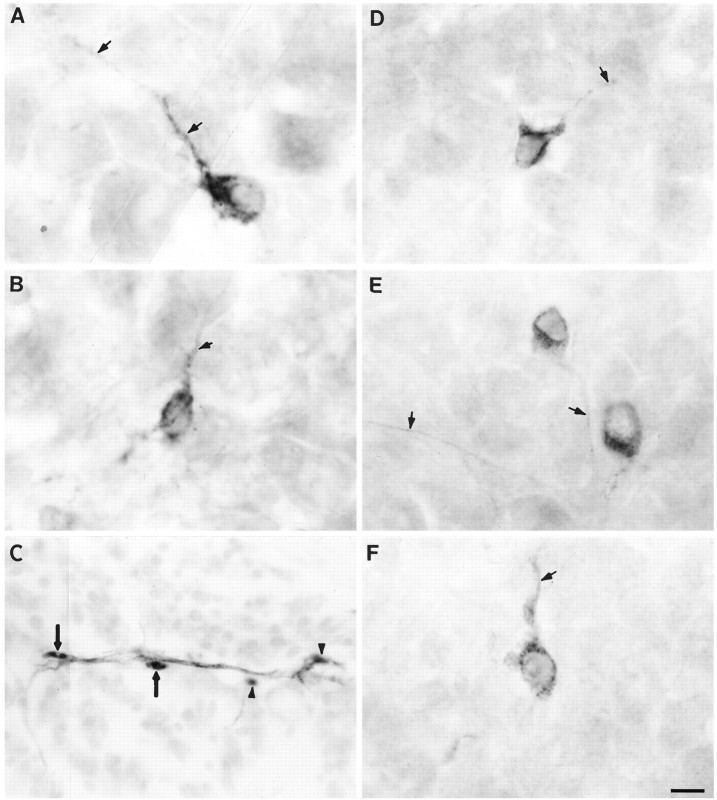
Immunohistochemistry. Host embryos were killed 1–10 d after transplantation (st 20–40). Embryos up to st 25 were processed as described by Oakley and Tosney (1991). Older embryos were perfused transcardially with 4% paraformaldehyde in PBS. The brachial region was separated and post-fixed for 4–10 hr in the same fixative. Alternate serial 20 μm cryostat sections were collected on separate slides. One set of sections was used to locate and count donor cells by staining with a quail-specific antibody, QC/PN (Developmental Hybridoma Bank) using the staining protocol described in Sharma et al. (1994). The second set was stained with anti-tubulin antibody, TuJ1 (a gift from Dr. Anthony Frankfurter, University of Virginia), to identify small peripheral nerves in muscles (see Fig. 3C) or with a quail-specific neuron-specific antibody, QN (a gift from Dr. Hideaki Tanaka, Kumamoto University) to identify neuronal donor cells (see Fig.3A,B,D–F). Staining protocols have been described previously (Moody et al., 1989;Tanaka et al., 1990; Sharma et al., 1995).
Fig. 3.
Phenotypes of transplanted cells within host embryos. A and B show transplanted dorsal cells stained with QN (quail-specific neuron-specific Ab) that differentiated into peripheral neurons within the host DRG (arrows point to stained neurites). C, Transplanted donor cells (black-stained with Q/CPN) associated with the branch of a small muscle nerve (gray-stained with TuJ1). Two transplanted dorsal cells (arrows) have the morphology of Schwann cells; the other two are out of focus (arrowheads).D–F show transplanted younger ventral cells (stained with QN Ab) within the host DRG that also differentiated into neurons. Arrows point to stained neurites. Scale bar, 10 μm.
Identification of donor cell phenotypes. The phenotypes of donor cells were classified in st 34–40 host embryos, 7–10 d after transplantation. Donor melanocytes were easily recognized by their characteristic quail pigmentation in the white chicken hosts (see Fig.4). Quail cells with elongated, QC/PN-positive nuclei and located in peripheral nerves and spinal roots were classified as Schwann cells (see Figs. 2E, 3C), because they appeared identical to Schwann cells in normal quail embryos (Fig.2F). The possibility exists, however, that these cells were oligodendrocytes rather than Schwann cells. The antibody QN was a useful marker for quail peripheral neurons at these stages (Tanaka et al., 1990; Sharma et al., 1995) (our unpublished observations). By st 30, developing white matter tracts in the quail spinal cord are QN-positive, as well as sensory axons in dorsal roots, but no neuronal somata in the spinal cord or peripheral ganglia are stained. Many quail DRG and sympathetic neuronal somata become QN-positive by st 34, and this staining persists until at least st 39–40. Throughout this time period, however, neuronal somata within the spinal cord show only background levels of staining for QN. No chicken cells were QN-positive through st 40.
Fig. 4.
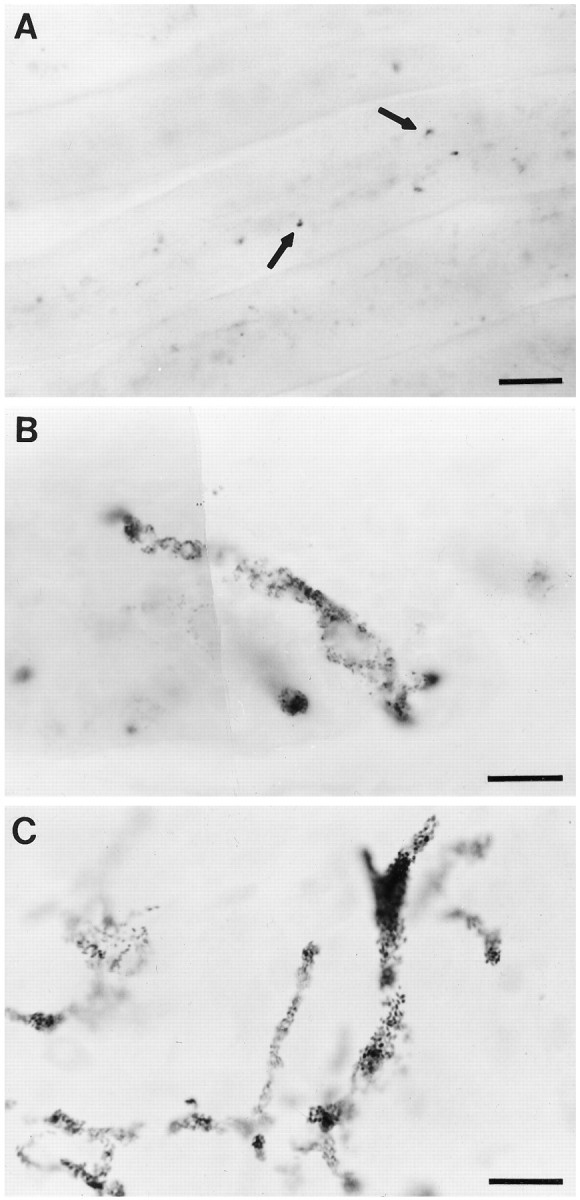
Quail melanocytes in chicken host and normal quail embryos. A, Quail pigmentation is visible in feathers of host embryos above the transplantation site. Arrowspoint to the clusters of melanocytes within the feathers.B, A melanocyte derived from a transplanted donor cell within host skin. The black granules within the cell are characteristic of quail melanocytes. C, Quail melanocytes in a normal quail embryo for comparison with those in chick hosts. Scale bars:A, 300 μm; B, C, 20 μm.
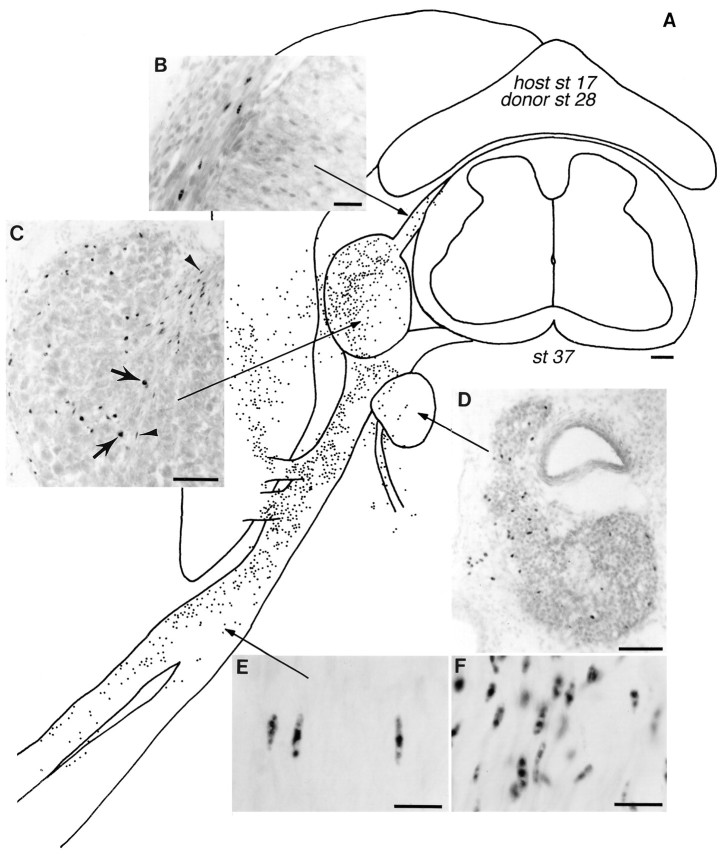
Fig. 2.
Distribution of transplanted dorsal cells within a host embryo. A, Camera lucida reconstruction of the distribution of st 28 dorsal quail cells 8 d after transplantation into a st 17 host embryo. This composite drawing shows dorsal cells (indicated by dots) found within one segment of the host embryo. Donor cells are located in the DRG, sympathetic ganglia, peripheral nerves, and muscle (total number 6932 quail cells, not including melanocytes). All sections inB–F were stained with QC/PN.B, Transplanted dorsal cells within the dorsal root have elongated nuclei characteristic of differentiated Schwann cells (compare with E andF). C, Donor cells within the DRG include neurons (solid arrows), satellite cells, and Schwann cells (arrowheads). D, Donor cells in a sympathetic ganglion. E, Most donor cells within peripheral nerves are Schwann cells. F, Schwann cells in a normal st 40 quail peripheral nerve. Scale bars:A, 100 μm; B, 25 μm;C, D, 50 μm; E,F, 15 μm.
Labeling of dividing cells. Bromodeoxyuridine (BrdU) was used to label dividing cells. A 100 μl aliquot of 50 mg/ml BrdU in PBS was applied to the host chorioallantoic membrane 4–8 hr before killing. In control experiments, we found this protocol sufficient to maximize the number of labeled cells and, therefore, likely to label all dividing cells. Donor quail cells were identified by double labeling with QC/PN. Sections were treated in 2N HCl for 40 min, incubated in blocking buffer for 30 min, and then incubated in QC/PN hybridoma supernatant for 1 hr. A Cy3-labeled goat anti-mouse IgG secondary antibody was applied for 1 hr, after which the sections were fixed for 30 min in 4% paraformaldehyde, rinsed, and incubated in blocking buffer for 30 min. Sections were then incubated in monoclonal anti-BrdU antibody (Sigma, St. Louis, MO) for 1 hr followed by FITC-labeled goat anti-mouse IgG secondary antibody. The fraction of donor cells that continued to divide after transplantation was calculated in chimeric embryos exposed to BrdU as the fraction of QC/PN-positive cells that were also BrdU-positive (refer to example in Fig. 7A).
Fig. 7.
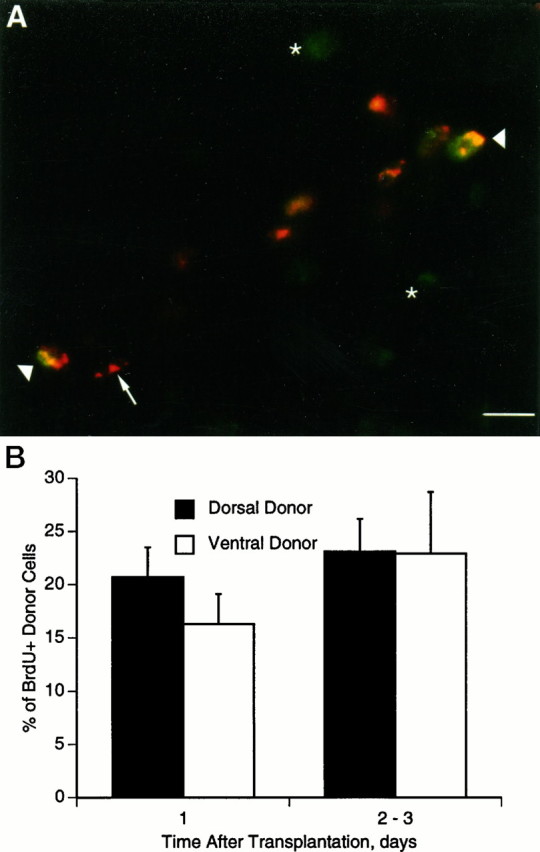
Transplanted donor cells divide within host embryos. A, Double labeling of transplanted quail cells that incorporated BrdU after transplantation. The host embryo received BrdU 64 hr after transplantation and was fixed at 72 hr. Transplanted donor cells are red (QC/PN, arrow), and host cells that divided are green (anti-BrdU,star). Double-labeled cells are yellow(arrowheads). Arrow indicates a transplanted donor cell with a morphology characteristic for Schwann cells. Scale bar, 10 μm. B, Division of donor cells after transplantation. BrdU was injected into host embryos 16, 40, or 64 hr after transplantation, and the embryos were fixed 8 hr later. Both dorsal and ventral cells continue to divide 1 and 2–3 d after transplantation.
Analysis. A complete camera lucida reconstruction of the location and number of donor cells was made for each case using the alternate sections stained with QC/PN. A representative section from the center of the transplant region was used as a schematic, and individual donor cells were indicated as dots on this schematic drawing. Examples of these reconstructions are shown in Figures 2, 5, and 6. The total number of donor cells (see Table 2) was calculated as 2 times the number of QC/PN-positive cells counted in the alternate sections. The cell counts do not include quail melanocytes, which were scored separately and only semiquantitatively because of their large numbers.
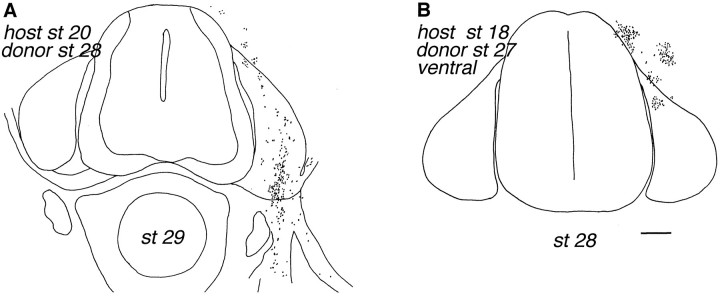
Fig. 5.
Distribution of dorsal versus older ventral donor cells 3 d after transplantation. Transplanted st 28 dorsal cells have migrated extensively at this time (A), whereas st 27 ventral cells remain clustered near the site of injection (B). The total number of donor cells was 558 inA and 340 in B. Scale bar, 100 μm.
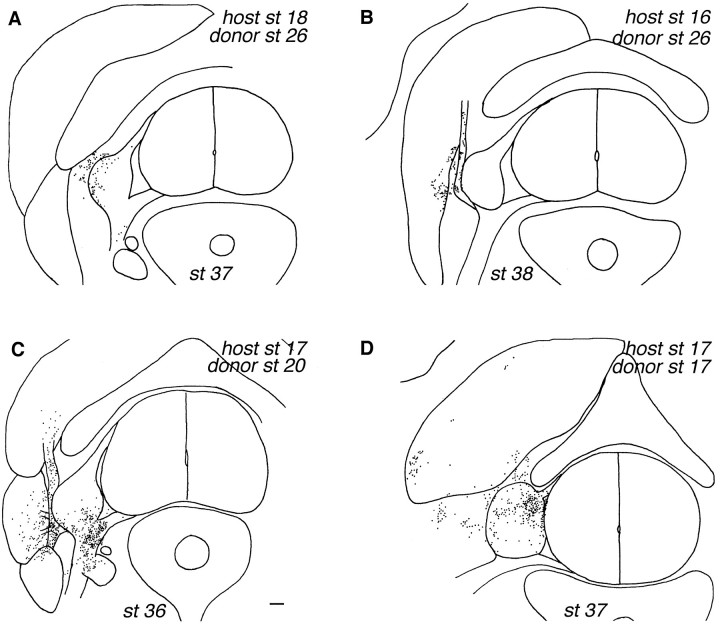
Fig. 6.
Distribution of older (A,B) versus younger (C, D) ventral donor cells 8–10 d after transplantation. In A, older ventral cells have settled in the DRG, peripheral nerve, and connective tissue surrounding the DRG, whereas in B they are located only within the dorsal ramus nerve branch and the intervertebral muscle. The distribution of older ventral cells is restricted compared to that of dorsal cells (compare with Fig.2A). In C, younger ventral cells have settled in DRG, sympathetic ganglia, peripheral nerves, and muscle, whereas in D they are located within DRG and the longissimus muscle. The total number of donor cells was 222 inA, 576 in B, 1976 in C, and 1590 in D. Scale bar, 100 μm.
Table 2.
Total numbers of donor cells in host embryos
| Embryo number | Dorsal | Older ventral | Younger ventral |
|---|---|---|---|
| 1 | 10 | 26 | 30 |
| 2 | 62 | 32 | 60 |
| 3 | 90 | 56 | 202 |
| 4 | 148 | 156 | 272 |
| 5 | 224 | 222 | 500 |
| 6 | 480 | 256 | 1590 |
| 7 | 504 | 290 | 1976 |
| 8 | 518 | 296 | 2892 |
| 9 | 568 | 576 | 3838 |
| 10 | 1208 | 684 | 16000 |
| 11 | 1308 | 1220 | 16100 |
| 12 | 2294 | 1294 | |
| 13 | 2692 | 1718 | |
| 14 | 3712 | 1874 | |
| 15 | 6932 |
Includes all cases in which donor cells were injected into st 16–20 host embryos, the embryos developed to st 34–40, and some donor cells were found in at least one crest target tissue. Counts exclude melanocytes (see Materials and Methods).
An estimate of the extent of donor cell migration was made by calculating the average number of crest target tissues these cells occupied in each chimeric embryo for each type of transplant (st 26–28 dorsal cells, st 26–28 ventral cells, and st 17–20 ventral cells). The seven crest target tissues are listed in the columns of Table 1 and include DRG, sympathetic ganglia, dorsal and ventral roots, peripheral nerves, muscle, and skin.
Table 1.
Locations of transplanted cells within crest target tissues
| Cases1-a | Transplanted dorsal cells | |||||||
|---|---|---|---|---|---|---|---|---|
| DRG | Sym | DorN | PerN | DR | VR | Mus | Skin | |
| 1 | x | |||||||
| 1 | x | |||||||
| 1 | x | x | ||||||
| 1 | x | x | ||||||
| 2 | x | x | x | |||||
| 1 | x | x | x | |||||
| 1 | x | x | x | |||||
| 1 | x | x | x | x | ||||
| 1 | x | x | x | x | ||||
| 1 | x | x | x | x | x | |||
| 1 | x | x | x | x | x | |||
| 1 | x | x | x | x | x | x | ||
| 1 | x | x | x | x | x | x | x | |
| 1 | x | x | x | x | x | x | x | |
| 1 | x | x | x | x | x | x | x | x |
| Transplanted older ventral cells | ||||||||
|---|---|---|---|---|---|---|---|---|
| DRG | Sym | DorN | PerN | DR | VR | Mus | Skin | |
| 11-b | ||||||||
| 3 | x | |||||||
| 2 | x | |||||||
| 2 | x | x | ||||||
| 1 | x | x | ||||||
| 1 | x | x | ||||||
| 2 | x | x | x | |||||
| 1 | x | x | x | |||||
| 1 | x | x | x | |||||
| 1 | x | x | x | x | ||||
| 1 | x | x | x | x | ||||
| 1 | x | x | x | x | x | x | ||
| 1 | x | x | x | x | x | x | x | |
| Transplanted younger ventral cells | ||||||||
|---|---|---|---|---|---|---|---|---|
| DRG | Sym | DorN | PerN | DR | VR | Mus | Skin | |
| 11-c | ||||||||
| 1 | x | |||||||
| 1 | x | x | ||||||
| 1 | x | x | x | |||||
| 1 | x | x | x | x | ||||
| 1 | x | x | x | x | x | |||
| 1 | x | x | x | x | x | |||
| 1 | x | x | x | x | x | |||
| 1 | x | x | x | x | x | |||
| 1 | x | x | x | x | x | x | ||
| 2 | x | x | x | x | x | x | ||
DRG, Dorsal root ganglia; Sym, sympathetic ganglia; DorN, dorsal ramus of spinal nerve; PerN, main spinal nerve; DR, dorsal root; VR, ventral root; Mus, muscle.
Number of embryos.
All cells were within spinal cord.
All cells were within connective tissue.
RESULTS
The ability of neuroepithelial (NE) cells within the spinal cord to develop as neural crest cells was determined by back-transplanting quail cells into the crest migratory pathway in chicken host embryos. The transplantation of donor cells to host embryos is shown schematically in Figure 1A. To minimize possible influences of the transplanted cells on the host environment, we injected relatively small numbers (200–500) of dissociated cells. The normal period of neural crest migration is between st 13 and 22, so donor cells were injected into st 16–20 host chicken embryos. Shortly after injection (0.25–6 hr, n= 5), transplanted cells were found clustered near the dorsolateral quadrant of the neural tube, below the ectoderm and medial to the dermomyotome (Fig. 1B). In this position, they were in the host migratory pathway and among migrating host neural crest cells.
Fig. 1.
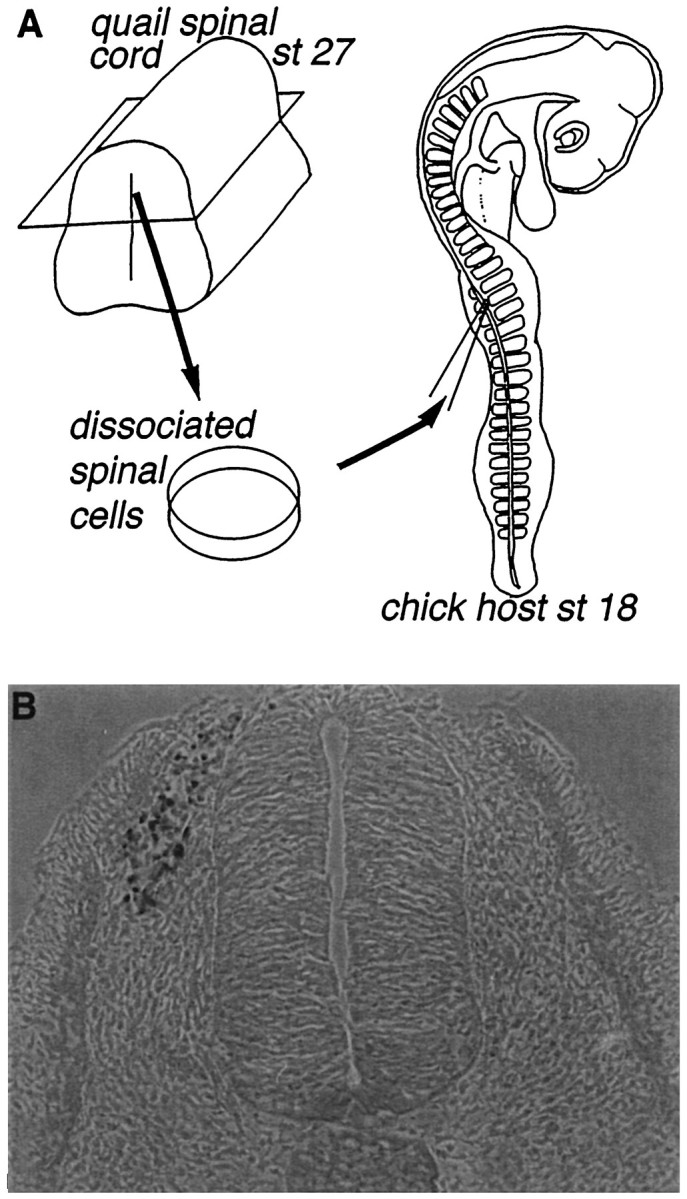
Transplantation procedure. A, Chimeric embryos were created using quail spinal cord cells transplanted into chicken embryo hosts. Dissociated cells from the dorsal or ventral halves of quail spinal cords were pressure-injected into the neural crest migratory pathway in st 16–20 chick hosts.B, Donor cells stained with QC/PN (quail-specific perinuclear Ab) 30 min after transplantation are located adjacent to the dorsolateral neural tube just ventral to dorsal ectoderm. Scale bar, 50 μm.
Dorsal cells migrate and differentiate as normal crest cells
The first issue was to determine whether the limited phenotypes of normal late-migrating spinal cells in DRG (Sharma et al., 1995) result from an intrinsic limitation in the developmental potential of these cells. Late-migrating cells originate from the dorsal spinal cord at the level of the dorsal root entry zone and migrate out of the cord into DRG between st 26 and 29. We therefore used dorsal spinal cells from st 26–28 quail embryos but placed them into a st 16–20 host environment where normal crest cells are actively migrating and developing.
Unlike late-migrating cells, transplanted dorsal cells migrated well beyond the bounds of the DRG and differentiated into a variety of crest-type phenotypes. A serial reconstruction of an embryo in which st 28 dorsal cells were transplanted into a st 17 host and allowed to develop until st 37 is illustrated in Figure2A. At this stage, donor cells had probably achieved their adult pattern of distribution. Although donor dorsal cells remained largely confined to one spinal segment, as do normal crest cells, they migrated ventrally, dorsally, and laterally into the dermis (see Fig. 4A), dorsal root (Fig.2B), DRG (Fig. 2C), sympathetic ganglia (Fig. 2D), and peripheral nerves (Fig.2E).
In st 34–40 embryos (n = 16), we could identify some phenotypes simply by comparing the QC/PN (quail-specific Ab) staining of donor cells in host embryos with QC/PN staining of normal quail embryos (compare the staining of Schwann cells in Fig.2E and 2F). To confirm that large QC/PN-positive cells within DRG were peripheral neurons, we compared QC/PN staining with staining for QN (a second quail-specific antibody) in alternate sections. As described in Materials and Methods, QN stains the somata of many DRG and sympathetic neurons but does not stain cell bodies (of neurons or glia) within the spinal cord. It therefore provides a useful marker for peripheral, and thus crest-derived, quail neurons. QN staining indicated that many dorsal spinal cord cells within DRG and sympathetic ganglia had differentiated into peripheral neurons (Fig.3A,B). Of 933 quail cells within DRG (checked in 4 embryos), 190 (20%) were QN-positive. DRG also contained quail Schwann cells (identified by their elongated nuclei) and satellite cells (small nuclei adjacent to neurons). Schwann cells were present within peripheral nerves (Fig. 2E) and dorsal and ventral roots (Fig. 2B). Melanocytes within the skin were also common (Fig.4A,B). In some cases, the characteristic quail pigmentation was macroscopically visible in the host embryos above the site of transplantation (Fig.4A). Many donor cells were also present in muscle. Based on their elongated shape and location within nerve branches (identified by staining for β-tubulin), many of these were Schwann cells (Fig. 3C). There were also donor cells that could not be classified both within muscles and in connective tissue around the DRG and between muscle masses.
The overall distribution of transplanted dorsal cells in different structures of host embryos is shown in the top of Table1. The major conclusion is that there was widespread distribution of these cells to various neural crest target tissues. In 6 of 16 cases, dorsal cells were present in five or more crest tissues, and in only 2 of 16 cases were they present in fewer than two target tissues. Individual cases with larger numbers of cells were more likely to have cells distributed in all crest target tissues (data not shown), as would be expected by chance. On average, dorsal donor cells were found in four different crest target tissues in each chimeric embryo.
Migration of ventral spinal cells depends on the stage of the donor
Transplanted dorsal spinal cells from st 26–28 donors migrate in synchrony with host neural crest cells and adopt phenotypes characteristic of normal crest cells. These cells include the subpopulation of late-migrating cells that normally contribute to the DRG. Could ventral cells, which normally do not contribute to crest derivatives, also migrate and adopt crest phenotypes when transplanted into the crest pathway? We tested this possibility by transplanting ventral cord cells into st 16–20 host embryos, using the same protocol as for dorsal cells. In contrast to the results with dorsal cells, however, ventral cells at a similar stage in development (st 26–28) migrated much less extensively than normal crest cells. This difference in migration was apparent even at short times after transplantation, as illustrated in Figure5, A and B. Three days after transplantation into st 16–20 host embryos, dorsal cells had already migrated into DRG and peripheral nerve (Fig. 5A;n = 9), but st 26–28 ventral cells (hereafter called older ventral cells) remained clustered near the injection site (Fig.5B; n = 7).
Older ventral cells remained more restricted than dorsal cells even by st 34–40, 7–10 d after transplantation (n = 18). Two examples of host embryos at these later stages with older ventral donor cells are shown in Figure 6, A andB, and the distribution of these cells is summarized in the middle of Table 1. Although older ventral cells could be found in any of the crest target tissues we examined, they typically occupied fewer of these targets in any one embryo. In 5 of 18 cases, older ventral cells were present in fewer than two crest derivatives, and in only 2 of 18 cases were they present in five or more target tissues. On average, old ventral cells were found in two to three target tissues, compared with four for dorsal cells. Moreover, the progeny of older ventral cells were less likely to be found in DRG (only 28% of embryos with older ventral cells vs 81% with dorsal cells).
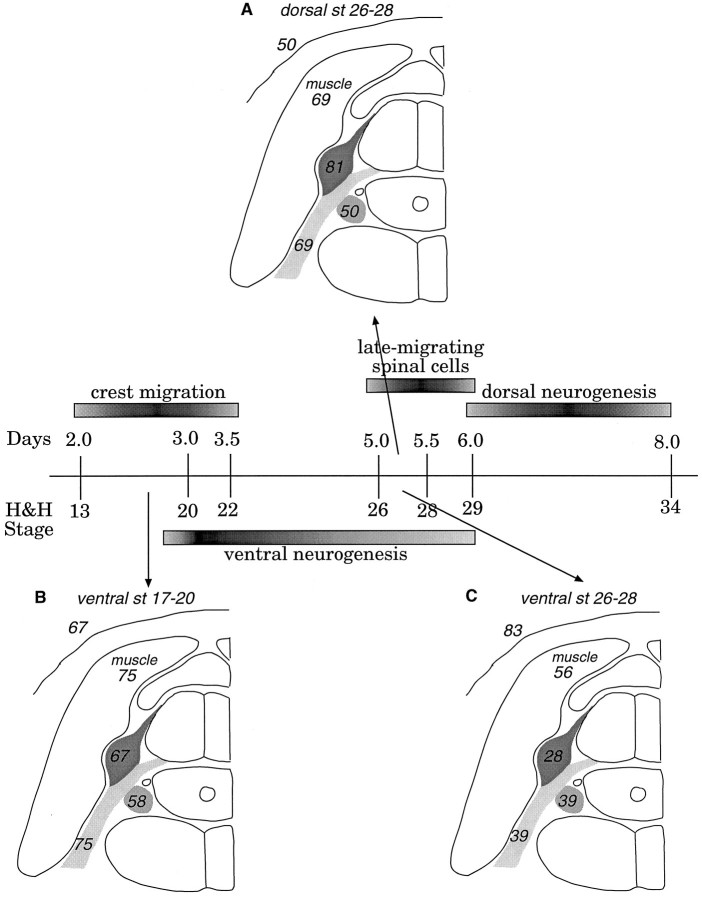
The phenotypes of older ventral cells were most commonly those characteristic of crest cells in the tissues they occupied. For example, 83% of embryos with ventral cells had donor melanocytes in the skin overlying the injection site, compared to 50% of the embryos with dorsal cells (Fig. 8A,C, Table1). When quail cells were present in DRG, some QC/PN-positive nuclei had the elongated shape characteristic of Schwann cells. The other quail nuclei in DRG were round and of small to medium diameter. Based on their size and shape, these cells could be either satellite cells or small- to medium-sized neurons. Particularly striking, however, was the paucity of peripheral neurons after ventral spinal transplants. None of the older ventral donor cells within DRG was stained with QN (0 of 172 DRG cells in all 5 embryos), although we did detect two QN-positive axons in the DRG of one embryo. In contrast, 20% of dorsal donor cells were QN-positive. Older ventral cells within spinal roots and peripheral nerves, including small nerves within muscle, had the nuclear morphology of Schwann cells. A number of donor cells located within muscle could not be classified and, as with dorsal donor cells, some embryos (5 of 18) had older ventral cells in connective tissue. Thus, although ventral spinal cells retain the ability to generate some crest-like phenotypes (Schwann cells and melanocytes) as late as st 26–28, the cells do not migrate as well as dorsal cells on crest pathways and none of the progeny are peripheral neurons.
Fig. 8.
Summary of the distribution of transplanted spinal cells. The timeline summarizes the timing of developmental events in dorsal and ventral spinal cord and indicates the stages at which dorsal and ventral spinal cells were taken from donor embryos. The three schematic drawings summarize the distribution of the three classes of donor cells. Numbers in these drawings indicate the percentage of embryos with donor cells in various locations. Dorsal cells from st 26–28 and younger ventral cells from st 17–20 have a similar distribution, but st 26–28 ventral cells behave differently. The older ventral cells are less likely to be located in DRGs and sympathetic ganglia and are more commonly found as melanocytes in skin.
At much earlier developmental stages (st 10–12), ventral cord cells can be induced to migrate and populate crest derivatives by signals arising from the dorsal ectoderm (Sechrist et al., 1995). Even at st 17–20, ventral cells are still generating neuronal precursors (Langman and Haden, 1970; Hollyday and Hamburger, 1977) (see timeline in Fig.8), so we tested the potential of ventral cells at these stages (hereafter called younger ventral cells) to migrate and generate crest derivatives when transplanted into a st 16–20 crest pathway. As shown in the reconstructions in Figure 6, C and D, younger ventral spinal cells migrated like normal crest cells and were found in the same range of crest derivatives as dorsal spinal cells (n = 12; data summarized in bottom of Table 1). In 7 of 12 cases, younger ventral cells were present in five or more crest derivatives, and in only 1 of 12 cases were they present in fewer than two target tissues. The distribution of younger ventral cells was similar to that of dorsal cells; on average, they occupied four crest target tissues in each chimeric embryo. Staining with QN showed that 27% of transplanted younger ventral cells within DRG were peripheral neurons (156 of 567 DRG cells in 3 embryos; Fig.3D–F), similar to the result with dorsal donor cells. Ventral cord cells, therefore, retain the ability to develop a wide range of crest phenotypes, including peripheral neurons, at least until st 17–20.
Dorsal and ventral cells divide after transplantation
The reduced developmental plasticity of older ventral cells might be because they failed to divide after transplantation. The ratio of dividing ventral to dorsal cells at the time of transplantation is ∼0.5 (Corliss and Robertson, 1963; Hamburger, 1948). We confirmed that fewer ventral cells had recently divided shortly before transplantation by labeling donor embryos at these stages with BrdU 4 hr before spinal cells were isolated and then counting the percentage of BrdU-labeled donor cells 1 d after transplantation. Over one-half of the dorsal cells (58 ± 10%; n = 9) but only one-third of older ventral cells (32 ± 15%;n = 3) were labeled. If some postmitotic cells die after transplantation (for example, neurons deprived of needed trophic support), the actual difference in the number of transplanted mitotically active cells would be even greater.
Despite this difference in the dorsal versus older ventral populations of transplanted cells, a significant fraction of the surviving cells in both populations continued to divide after transplantation. This was demonstrated by injecting BrdU at various times after transplantation and fixing the embryos 4 hr later. Approximately 20% of the donor cells were dividing, whether BrdU was injected 1, 2, or 3 d after transplantation (Fig. 7). The fraction of dividing cells was nearly the same for older ventral and dorsal donor cells. A straightforward interpretation of these seemingly contradictory results concerning mitotic activity before and after transplantation is that nondividing cells were more likely to die after transplantation. This would tend to equalize the fraction of dividing cells in the two populations.
Older ventral cells also gave rise to smaller total numbers of cells than dorsal cells did. The number of donor cells in individual embryos of both groups varied over a wide range (Table 2), presumably reflecting variability in the number of cells successfully injected into the crest pathway and/or surviving the transplantation procedure. Nevertheless, although approximately equal numbers of donor cells were injected for each type of transplantation, cell counts of all donor cells (excluding melanocytes) in st 34–40 embryos were about half as large when using older ventral versus dorsal cells (median 293 vs 518 cells; n = 15 for each group). This difference is consistent with the smaller number of older ventral cells that were dividing at the time of transplantation, and it supports further the suggestion that a significant fraction of postmitotic transplanted cells may die in the host embryo. Despite these caveats, however, these results show that by st 26–28, ventral cord cells that continue to divide after transplantation have nevertheless lost the ability to respond to environmental cues required for the acquisition of the full complement of crest phenotypes. In particular, their progeny migrate less extensively and are unlikely to become peripheral neurons.
DISCUSSION
During embryonic development, neural crest cells emigrate from the most dorsal region of the neural tube and produce a wide variety of cell types that populate the peripheral nervous system. In chicken embryos, their emigration is complete by st 22 (Serbedzija et al., 1989; Oakley et al., 1994). Our results show that NE cells left within the spinal cord after this emigration is complete also retain the ability to differentiate into cells with crest-like phenotypes, including sensory and sympathetic neurons, satellite cells, Schwann cells, and melanocytes. Even 2 d after normal crest cell emigration has ceased, spinal cells back-transplanted into a crest migratory pathway migrate and develop as normal crest cells. The transplanted cells follow the temporal and spatial pattern of the host crest cells and differentiate into various cell types appropriate for the host neural crest environment.
Earlier experiments had shown that NE cells leaving the spinal cord at st 26–28 gave rise to a limited number of phenotypes, specifically neurons and non-neuronal cells in DRG (Sharma et al., 1995). The present results show that this limitation in phenotypic diversity does not reflect an intrinsic restriction of developmental potential because when these cells are transplanted into a younger crest migratory pathway they differentiate with a wider variety of crest phenotypes. Instead, the limited phenotypes of the late-migrating cells are probably a consequence of the temporally changing environment of the crest pathway. Our experiments show that the end of the normal period of crest cell emigration away from the neural tube is not caused by a depletion of appropriate progenitor cells within the tube because cells there remain competent to produce crest-like progeny for several more developmental stages. A likely alternative explanation is that further emigration is halted by the development of a barrier around the tube that is not permissive for migration (Newgreen and Erickson, 1986). Late-migrating NE cells avoid this barrier by leaving the cord via the dorsal roots rather than moving directly away from the spinal cord (Sharma et al., 1995). Migration through ventral roots at these later stages has also been reported (Lunn et al., 1987).
One function of this emigration barrier might be to prevent stem cells from entering the periphery at a time when the crest pathway no longer supports appropriate differentiation. In the present experiments, when spinal cord cells were transplanted into host embryos at st 21–24, near the end of normal crest emigration, the cells migrated less extensively and did not populate sympathetic ganglia, as for normal crest cells at these stages (data not shown). The restricted pathway of the late-migrating (st 26–28) spinal NE cells within dorsal roots leads them to the DRG, which supports the genesis of sensory neurons and satellite cells until st 35 (Carr and Simpson, 1978).
The ability of ventral spinal cells to produce crest phenotypes has been demonstrated previously but only at earlier stages of development. When the lateral neural plate, which will form the dorsal neural tube, is removed from the hindbrain region at st 10, remaining cells in the medial plate migrate from the tube and express characteristic crest cell markers (Scherson et al., 1993; Sechrist et al., 1995). Contact of neural plate cells with overlying ectoderm is sufficient to induce neural crest characteristics (Dickinson et al., 1995); members of the TGFβ family present within the dorsal ectoderm, particularly BMP4 and BMP7, are capable of causing this induction (Liem et al., 1995). In the present experiments, it is likely, therefore, that proximity of the transplanted spinal cells to the dorsal ectoderm induced the crest phenotypes. These experiments extend earlier results by showing that spinal cells retain the ability to develop crest phenotypes even at relatively late embryonic stages (st 26–28 vs st 10–12). They reinforce the idea (Selleck et al., 1993) that neural crest progenitors do not represent a specialized subpopulation of cells within the neural tube and that some cells within the tube retain the ability to give rise to crest-type progeny well after normal crest cell emigration.
Not all dividing cells within the cord retain the ability to generate a wide variety of crest phenotypes until late stages, however. Back-transplantation of dissociated cells from the ventral half of st 26–28 cords resulted in a restricted pattern of migration even though the migratory pathway promoted extensive migration of dorsal spinal cord cells. Transplanted dorsal cells migrated extensively from the injection site to normal crest target areas, whereas older ventral cells were usually located nearer the site of injection. Moreover, older ventral cells were less likely to populate DRG (compare Fig.8A with 8C) and gave rise to virtually no peripheral neurons even when they were located there. Ventral cord cells from earlier developmental stages (st 17–20) did migrate extensively, however, and gave rise to a variety of crest phenotypes, including peripheral neurons. In all respects we measured, the st 17–20 ventral spinal cells were indistinguishable from st 26–28 dorsal spinal cells after transplantation into the crest pathway (Fig. 8B). The inability of older ventral spinal cord cells to generate peripheral neurons parallels their changing role in the spinal cord. After st 23, genesis of motoneurons is complete, and virtually all ventral cord neurons have been generated by st 26 (Hollyday and Hamburger, 1977). The present results show that the end of neurogenesis in the ventral spinal cord is not simply because the environment of the ventral cord no longer supports neurogenesis; instead, there is an intrinsic change in the ability of ventral cord cells to generate neurons.
Many donor cells found in host embryos at st 34–40 resulted from cell division after transplantation. Injection of BrdU into host embryos after transplantation labeled ∼20% of the donor cells independent of their source (older ventral vs dorsal cord). Moreover, many of these cells continued to divide repeatedly because the labeling index was the same whether BrdU was injected 1, 2, or 3 d after the transplantation. The smaller number of dividing cells in older ventral versus dorsal cord was probably responsible for the smaller total numbers of donor cells in host embryos. Many motoneurons are normally dying at these stages (st 26–28), so it is likely that many postmitotic ventral cells, which include motoneurons, are also dying after transplantation. The continued division of a substantial number of older ventral cells after transplantation coupled with the probable loss of many postmitotic cells argues strongly that dividing cells made a substantial contribution to the final population of donor cells in host embryos. Thus, the inability of older ventral donor cells to produce neurons and to migrate extensively is not because they are postmitotic.
Transplanted progenitor cells from other parts of the CNS also give rise to progeny in accord with their host environment (McConnell, 1988;Eisen, 1991; Brüstle et al., 1995). In the neocortex, the ability of a cell to migrate to the appropriate host layer depends on its position within the cell cycle at the time of transplantation (McConnell and Kaznowski, 1991). Because many of the late ventral cells that we transplanted continued to divide, one might have expected them to develop crest phenotypes appropriate for their host tissue; yet they did not. Interestingly, cortical progenitors also lose this ability at late stages of development. The progeny of stem cells from the subplate region of postnatal day 1 ferrets transplanted into younger hosts migrate according to the age of the donor, not the host (McConnell, 1995). Apparently, there is a progressive temporal restriction in the ability of certain CNS progenitor populations to generate phenotypes appropriate for a novel spatiotemporal environment.
Footnotes
Support for this work and for Z̆.K. was provided by National Institutes of Health Grant NS24373 and a McKnight Investigator Award to E.F. We thank Dr. Cynthia Lance-Jones for advice during these experiments and on this manuscript, Dr. Anthony Frankfurter for the TuJ1 antibody, Dr. Hideaki Tanaka for the QN antibody, and Dr. Kamal Sharma for help with the initial experiments. Ms. Xiaoping Chen provided technical assistance. The cell line producing QC/PN was obtained from the Developmental Hybridoma Bank.
Correspondence should be addressed to Dr. Eric Frank, Department of Neurobiology, BST W1452, University of Pittsburgh School of Medicine, Pittsburgh, PA 15261.
REFERENCES
- 1.Anderson D. The neural crest lineage problem: neuropoiesis? Neuron. 1989;3:1–12. doi: 10.1016/0896-6273(89)90110-4. [DOI] [PubMed] [Google Scholar]
- 2.Artinger KB, Fraser S, Bronner-Fraser M. Dorsal and ventral cell types can arise from common neural tube progenitors. Dev Biol. 1995;172:591–601. doi: 10.1006/dbio.1995.8038. [DOI] [PubMed] [Google Scholar]
- 3.Brüstle O, Maskos U, McKay RDG. Host-guided migration allows targeted introduction of neurons into the embryonic brain. Neuron. 1995;15:1275–1285. doi: 10.1016/0896-6273(95)90007-1. [DOI] [PubMed] [Google Scholar]
- 4.Carr V, Simpson SB. Proliferative and degenerative events in the early development of chick dorsal root ganglia. I. Normal development. J Comp Neurol. 1978;182:727–740. doi: 10.1002/cne.901820410. [DOI] [PubMed] [Google Scholar]
- 5.Corliss C, Robertson G. The pattern of mitotic density in the early chick neural epithelium. J Exp Zool. 1963;153:125–140. doi: 10.1002/jez.1401530205. [DOI] [PubMed] [Google Scholar]
- 6.Dickinson ME, Selleck M, McMahon AP, Bronner-Fraser M. Dorsalization of the neural tube by the non-neural ectoderm. Development. 1995;121:2099–2106. doi: 10.1242/dev.121.7.2099. [DOI] [PubMed] [Google Scholar]
- 7.Eisen JS. Determination of primary motoneuron identity in developing zebrafish embryos. Science. 1991;252:569–572. doi: 10.1126/science.1708527. [DOI] [PubMed] [Google Scholar]
- 8.Hamburger V. The mitotic patterns in the spinal cord of the chick embryo and their relation to histogenetic processes. J Comp Neurol. 1948;88:221–283. doi: 10.1002/cne.900880204. [DOI] [PubMed] [Google Scholar]
- 9.Hamburger V, Hamilton HL. A series of normal stages in the development of chick embryos. J Morphol. 1951;88:49–92. [PubMed] [Google Scholar]
- 10.Hollyday M, Hamburger V. An autoradiographic study of the formation of the lateral motor column in the chick embryo. Brain Res. 1977;132:197–208. doi: 10.1016/0006-8993(77)90416-4. [DOI] [PubMed] [Google Scholar]
- 11.Langman J, Haden CC. Formation and migration of neuroblasts in the spinal cord of the chick embryo. J Comp Neurol. 1970;138:419–432. doi: 10.1002/cne.901380403. [DOI] [PubMed] [Google Scholar]
- 12.Le Douarin N. The neural crest, 259 pp. Cambridge UP; Cambridge, UK: 1982. [Google Scholar]
- 13.Liem KFJ, Tremmi G, Roelink H, Jessell TM. Dorsal differentiation of neural plate cells induced by BMP-mediated signals from epidermal ectoderm. Cell. 1995;82:969–979. doi: 10.1016/0092-8674(95)90276-7. [DOI] [PubMed] [Google Scholar]
- 14.Lunn E, Scourfield J, Keynes R, Stern C. The neural tube origin of ventral root sheath cells in the chick embryo. Development. 1987;101:247–254. doi: 10.1242/dev.101.2.247. [DOI] [PubMed] [Google Scholar]
- 15.McConnell SK. Fates of visual cortical neurons in the ferret after isochronic and heterochronic transplantation. J Neurosci. 1988;8:945–974. doi: 10.1523/JNEUROSCI.08-03-00945.1988. [DOI] [PMC free article] [PubMed] [Google Scholar]
- 16.McConnell SK. Constructing the cerebral cortex: neurogenesis and fate determination. Neuron. 1995;15:761–768. doi: 10.1016/0896-6273(95)90168-x. [DOI] [PubMed] [Google Scholar]
- 17.McConnell SK, Kaznowski CE. Cell cycle dependence of laminar determination in developing neocortex. Science. 1991;254:282–285. doi: 10.1126/science.254.5029.282. [DOI] [PubMed] [Google Scholar]
- 18.Moody SA, Quigg MS, Frankfurter A. Development of the peripheral trigeminal system in the chick revealed by an isotype-specific anti-β-tubulin monoclonal antibody. J Comp Neurol. 1989;279:567–580. doi: 10.1002/cne.902790406. [DOI] [PubMed] [Google Scholar]
- 19.Newgreen D, Erickson C. The migration of neural crest cells. Int Rev Cytol. 1986;103:89–145. doi: 10.1016/s0074-7696(08)60834-7. [DOI] [PubMed] [Google Scholar]
- 20.Oakley RA, Tosney KW. Peanut agglutinin and chondroitin-6-sulfate are molecular markers for tissues that act as barriers to axon advance in the avian embryo. Dev Biol. 1991;147:187–206. doi: 10.1016/s0012-1606(05)80017-x. [DOI] [PubMed] [Google Scholar]
- 21.Oakley RA, Lasky CJ, Erickson CA, Tosney KW. Glycoconjugates mark a transient barrier to neural crest migration in the chicken embryo. Development. 1994;120:103–114. doi: 10.1242/dev.120.1.103. [DOI] [PubMed] [Google Scholar]
- 22.Scherson T, Serbedzija G, Fraser S, Bronner-Fraser M. Regulative capacity of the cranial neural tube to form neural crest. Development. 1993;118:1049–1061. doi: 10.1242/dev.118.4.1049. [DOI] [PubMed] [Google Scholar]
- 23.Sechrist J, Nieto MA, Zamanian RT, Bronner-Fraser M. Regulative response of the cranial neural tube after neural fold ablation: spatiotemporal nature of neural crest regeneration and up-regulation of Slug. Development. 1995;121:4103–4115. doi: 10.1242/dev.121.12.4103. [DOI] [PubMed] [Google Scholar]
- 24.Selleck M, Cherson T, Bronner-Fraser M. Origins of neural crest cell diversity. Dev Biol. 1993;159:1–11. doi: 10.1006/dbio.1993.1217. [DOI] [PubMed] [Google Scholar]
- 25.Serbedzija G, Bronner-Fraser M, Fraser S. A vital dye analysis of the timing and pathways of avian trunk neural crest cell migration. Development. 1989;106:809–816. doi: 10.1242/dev.106.4.809. [DOI] [PubMed] [Google Scholar]
- 26.Sharma K, Korade Z, Frank E. Development of specific muscle and cutaneous sensory projections in cultured segments of spinal cord. Development. 1994;120:1315–1323. doi: 10.1242/dev.120.5.1315. [DOI] [PubMed] [Google Scholar]
- 27.Sharma K, Korade Z, Frank E. Late-migrating neuroepithelial cells from the spinal cord differentiate into sensory ganglion cells and melanocytes. Neuron. 1995;14:143–152. doi: 10.1016/0896-6273(95)90248-1. [DOI] [PubMed] [Google Scholar]
- 28.Tanaka H, Kinutani M, Agata A, Yakashima Y, Obata K. Pathfinding during spinal tract formation in the chick-quail chimera analysed by species-specific monoclonal antibodies. Development. 1990;110:565–571. doi: 10.1242/dev.110.2.565. [DOI] [PubMed] [Google Scholar]
- 29.Weston JA. The regulation of normal and abnormal neural crest cell development. In: Riccardi VM, Mulvihill JJ, editors. Advances in neurology. Raven; New York: 1981. [PubMed] [Google Scholar]
- 30.Weston JA. Sequential segregation and fate of developmentally-restricted intermediate cell populations in the neural crest lineage. Curr Top Dev Biol. 1991;25:133–153. doi: 10.1016/s0070-2153(08)60414-7. [DOI] [PubMed] [Google Scholar]


