

Abstract
The rising prevalence of cardiovascular disease worldwide necessitates novel therapeutic approaches to manage atherosclerosis. Intravenously administered nanostructures are a promising noninvasive approach to deliver therapeutics that reduce plaque burden. The drug Liver X Receptor agonist GW3965 (LXR) can reduce atherosclerosis by promoting cholesterol efflux from plaque but causes liver toxicity when administered systemically at effective doses, thus preventing its clinical use. We investigated here the ability of peptide amphiphile nanofibers containing apolipoprotein A1-derived targeting peptide 4F to serve as nanocarriers for LXR delivery (ApoA1-LXR PA) in vivo. These nanostructures were found to successfully target atherosclerotic lesions in a mouse model within 24 hours of injection. After eight weeks of intravenous administration, the nanostructures significantly reduced plaque burden in both male and female mice to a similar extent as LXR alone in comparison to saline-treated controls. Furthermore, they did not cause increased liver toxicity in comparison to LXR treatments, which may be related to more controlled release by the nanostructure. These findings demonstrate the potential of supramolecular nanostructures as safe, effective drug nanocarriers to manage atherosclerosis.
Keywords: nanomedicine, atherosclerosis, peptide amphiphiles, supramolecular nanofibers, apolipoprotein A1
Graphical Abstract
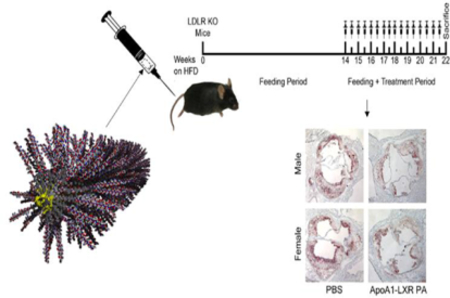
ApoA1 peptide amphiphile nanofibers containing Liver X Receptor Agonist (shown in yellow) are intravenously administered to atherosclerotic mice, reducing plaque burden after eight weeks of treatment.
Introduction
Atherosclerosis, the mechanism responsible for cardiovascular disease, is the leading cause of death and disability in the United States.[1] Currently, treatment of atherosclerosis includes risk factor modification and administration of high-dose statin medications. On high-dose statins there is still a 22% rate of death or major adverse cardiovascular events at 2 years.[2] Despite the best medical therapy with statins, medications have not been able to induce clinically relevant atherosclerotic plaque regression. Many patients with ideal levels of serum cholesterol continue to experience cardiovascular events.[3] Therefore, there is a need to develop a novel therapy to treat atherosclerosis.
Developments in bionanotechnology have provided several biomedical platforms for use in imaging, targeted therapy, and targeted drug delivery for oncologic and surgical applications.[4] The aim of this project was to develop a nanoscale therapy for the treatment of atherosclerosis. This novel therapy was designed to be administered systemically, and then target atherosclerotic plaque to induce plaque regression by causing cholesterol efflux from within the plaque. This technology is based on our prior experience with functionalized peptide amphiphile (PA) nanofibers.[5] PA nanofibers are composed of peptide sequence monomers that self-assemble in solution to form nanofibers. Because these peptide sequences are composed of simple amino acids and hydrocarbon tails, they are safe, bioresorbable, and biocompatible.[6] Another advantage of the nanofiber for intravascular applications pertains to its shape. Nanofibers are superior to spheres and micelles for intravascular applications due to their increased surface area for wall contact and drug delivery; their shape also facilitates marginalization to the sides of the arterial wall when in circulation, thus further increasing surface area contact to the endothelium of the vessel wall.[7]
Apolipoprotein A1 (ApoA1) is the main protein component of high density lipoprotein (HDL) cholesterol and is capable of promoting cholesterol efflux from atherosclerotic plaques in animals.[8] However, since ApoA1 is a large and hydrophobic protein (21–31 kDa), synthesis and incorporation into a therapeutic agent is impractical. Instead, our approach was to target atherosclerotic plaque by covalently bonding to PAs an 18 amino acid ApoA1 mimetic peptide, known as “4F”. This peptide is approximately 1/10th the size of endogenous ApoA1, making it easier to synthesize and incorporate into nanomaterials, while also retaining the cholesterol efflux and binding actions of ApoA1 in animals.[9] The ability of 4F to bind to oxidized lipids is particularly useful since the increased presence of oxidized lipids correlates with atherosclerotic severity.[10] The dissociation constant of 4F for the oxidized phospholipid PEIPC (1-palmitoyl-2-(5,6-epoxyisoprostane E2)-sn-glycero-3-phosphorylcholine) was discovered to be over six orders of magnitude lower than that of native ApoA1-PEIPC binding (0.01 nM vs. 50 μM), indicating much higher affinity between the oxidized lipid and 4F than between the lipid and ApoA1 protein.[11] Furthermore, D-4F (4F synthesized with all D-amino acids) increases HDL-mediated cholesterol efflux from human macrophages in vitro and enhances reverse cholesterol transport from cholesterol-rich macrophages injected intraperitoneally into ApoE knockout mice.[12] Thus, we incorporated the 4F peptide into PAs to generate a plaque-targeting nanocarrier platform, ApoA1 PA.
The ApoA1 PAs can serve as drug delivery carriers that enable retrofitting of therapeutics shown to be effective in reducing plaque burden, but which are toxic when administered systemically. For example, the liver X receptor (LXR) agonist acts as a cholesterol sensor and induces cholesterol efflux from macrophages.[13] When activated, the LXR on macrophages directly reduces foam cell formation and lesion cholesterol content.[14] However, in systemic doses, LXR agonists cause liver steatosis and are consequently precluded from being used systemically in humans.[15] Therefore, we evaluated the ability of our targeted ApoA1 PA nanofiber to deliver an LXR agonist directly to sites of atherosclerosis, in smaller doses than have been used systemically in the past, to induce atherosclerotic plaque regression. Our hypothesis is that systemic administration of an ApoA1 PA nanofiber containing LXR agonist will target atherosclerotic lesions, deliver the therapeutic agent, and induce atherosclerotic plaque regression.
Results
Design and characterization of PA supramolecular nanostructures
The ApoA1 PA co-assembly retained the alpha-helical secondary structure of the targeting sequence alone (4F peptide), evidenced by the negative ellipticity peaks near 208 and 222 nm (Figure 1A). The ApoA1 PA also showed β-sheet character with a shifted positive ellipticity peak, an effect likely caused by co-assembly with the diluent PA, which showed strong β-sheet character, demonstrated by the presence of a broad negative peak near 218 nm.[16] In contrast, the secondary structure of PA nanofibers co-assembled with a scrambled targeting sequence (Scr PA) closely resembled the β-sheet structure of the diluent PA. Incorporating LXR into either the ApoA1 PA co-assembly (ApoA1-LXR PA) or the 4F peptide (4F-LXR) dampened the alpha-helical structure, as shown in Figure 1B and Supplemental Figure 1. Similar patterns of secondary structure were observed at physiological temperature (37°C).
Figure 1.

Characterization of PAs and peptides. (A-B) Circular dichroism spectroscopy analysis for secondary structure of ApoA1 PA co-assembly, diluent PA, 4F peptide (4F), 4F-LXR, ApoA1-LXR PA co-assembly, and scrambled PA (Scr PA) co-assembly taken at 25°C. (C) Dynamic light scattering analysis of PAs and peptides taken at 25°C and 37°C, n = 3 independent experiments analyzed per condition, error bars represent SEM, *p<0.05. (D) TEM images of 4F and 4F-LXR peptides; ApoA1, ApoA1-LXR, and Scr PA co-assemblies; and diluent PA. Scale bar equals 200 nm.
Dynamic light scattering was used as an indicator of nanofiber formation, as higher β-sheet content is correlated with increased light scattering.[16] PA nanofiber formation was indicated by significantly higher molar light scattering values than peptide controls at both 25°C (p<0.034) and at 37°C (p<0.004), as shown in Figure 1C. No significant differences were observed in molar light scattering between PAs or peptides at either temperature.
We visualized the nanofiber structure using conventional and cryogenic transmission electron microscopy (TEM, Figure 1D and Supplemental Figure 2). No nanofiber formation was seen with the 4F and 4F-LXR peptides, as expected. The average diameter for ApoA1, ApoA1-LXR, scrambled, and diluent PAs was 9.6 ± 1.7 nm, 10.3 ± 2.2 nm, 13.8 ± 2.4 nm, and 12.3 ± 3.1 nm, respectively. The median nanofiber length for ApoA1, ApoA1-LXR, scrambled, and diluent PAs was 616, 712, 258, and 2541 nm, respectively (Table 1).
Table 1.
Characterization of PA nanofibers for diameter and length. Values represent 30 measurements taken from three separate images.
| Diameter (nm) | Length (nm) | |||||||||
|---|---|---|---|---|---|---|---|---|---|---|
| Median | Average | Std. Dev. | Min. | Max. | Median | Average | Std. Dev. | Min. | Max. | |
| ApoA1 PA | 9.5 | 9.6 | 1.7 | 6.2 | 14.4 | 615.9 | 626.9 | 415.6 | 39.4 | 2183.3 |
| ApoA1-LXR PA | 10.5 | 10.3 | 2.2 | 6.4 | 16.5 | 712.1 | 832.8 | 565.5 | 148.7 | 1922.6 |
| Scr PA | 14.2 | 13.8 | 2.4 | 8.8 | 18.3 | 257.6 | 403.8 | 350.8 | 30.0 | 1472.9 |
| Diluent PA | 12.4 | 12.3 | 3.1 | 4.6 | 18.6 | 2541.4 | 3024.4 | 2554.8 | 163.3 | 9308.7 |
Targeting and drug delivery efficacy of ApoA1 PA nanofibers
Targeted ApoA1 PA, ApoA1-LXR PA, and the targeting sequence alone (4F peptide) localized to areas of atherosclerosis within 24 hours after injection as indicated by red fluorescence from the conjugated Alexa Fluor® 546 dye (Figure 2). Scrambled PA and the targeting peptide sequence covalently bonded to the LXR agonist without the PA platform (4F-LXR) did not localize to areas of atherosclerosis. The optimum concentration of targeted ApoA1 PA nanofiber was determined at a constant dose of 8 mg/kg. When we quantified fluorescent pixels in the aortic roots of mice given concentrations of 4 mg/mL vs. 2 mg/mL at 24 hours after injection, there was no significant difference (Figure 3A–B). These concentrations were chosen because a concentration of 1 mg/mL required a prohibitively high volume of injection, and greater than 4 mg/mL yielded volumes too low for accurate injection with a 0.3 mL syringe. There was no significant difference between concentrations; thus, a 2 mg/mL concentration was used for all subsequent studies.
Figure 2.

Nanofiber-mounted ApoA1 peptide is superior to naked 4F peptide for targeting atherosclerosis and drug delivery. (A) Timeline for low density lipoprotein receptor knockout mice (LDLR KO) fed the high fat diet, injection, and sacrifice. (B) Spectrally unmixed confocal images of aortic root sections. Blue = DAPI-stained cell nuclei, Green = autofluorescent elastic laminae and atherosclerosis, and Red = Alexa Fluor® 546-labeled injected compound.
Figure 3.

Determination of optimum dose and concentration of ApoA1 PA for targeting atherosclerosis through IV injection. Groups labeled as control are age matched and high-fat diet non-injected mice. (A) Determination of optimum concentration of ApoA1 PA in PBS at 8 mg/kg dose with (B) representative images. (C) Determination of optimum dose of ApoA1 in at 2 mg/mL concentration in PBS with (D) representative images. (E) Comparison of targeting efficacy of ApoA1 PA between males and females with (F) representative images. All images are fluorescent microscopy of representative sections displayed at 5x magnification, n = 3–5 per group. *p<0.05.
The optimal dose of ApoA1 PA was determined at a constant concentration of 2 mg/mL. Doses of 8 mg/kg and 6 mg/kg were superior to 4 mg/kg, which was superior to 1.7 mg/kg (Figure 3C–D). Compared to non-injected and scrambled PA controls, a dose of 8 mg/kg and 6 mg/kg yielded nearly identical localization at areas of atherosclerosis as measured by fluorescent pixel quantification at the aortic root. Therefore, 6mg/kg dosing was used for all subsequent studies. Finally, we evaluated localization of the targeted ApoA1 PA in male versus female LDLR KO mice and found no statistically significant difference in localization between the sexes (Figure 3E–F).
Regarding binding duration, targeted ApoA1 PA localized to areas of atherosclerosis within the first 24 hours after injection. ApoA1 PA nanofibers remained localized to areas of atherosclerosis at high concentrations for two days. By 3–7 days after injection, ApoA1 PA nanofibers diminished in concentration within areas of atherosclerosis. After 10–14 days post injection with ApoA1 PA, fluorescent pixel analysis was not different from control non-injected mice (Figure 4A–B).
Figure 4.

Binding duration of ApoA1-targeted nanofiber in the aortic root. (A) Red fluorescent pixel quantification in the aortic root. (B) Fluorescent microscopy images of representative sections at 5x magnification, n = 3–5 per group. *p<0.05.
In order to identify off-target localization of ApoA1 PA nanofibers, fluorescent pixel analysis was performed in internal organs (lung, liver, kidney, spleen) from 1–14 days post injection. There was minimal detection of ApoA1 PA in the lung, liver, and kidney. ApoA1 PA was detected in the spleen between 1–10 days post injection, with maximum concentrations between 3–7 days (Figure 5A). Representative images of internal organs, especially splenic sections with high concentrations of red pixels, appear yellow due to high background levels of green autofluorescence (Figure 5B). However, in all internal organs, red fluorescent pixels returned to non-injected control levels by 10–14 days post injection.
Figure 5.

Pharmacokinetics of ApoA1 PA circulation through internal organs. (A) Red fluorescent pixel quantification in the 1) Lung, 2) Liver, 3) Kidney, and 4) Spleen from 1 day to 2 weeks post injection. (B) Fluorescent microscopy images of representative sections at 20x magnification, n=3–5 per group.
Treatment of atherosclerosis
To investigate the therapeutic potential of PAs in reducing plaque burden, we examined intravenous injection of PAs in male and female LDLR KO mice that had developed atherosclerosis after 14 weeks on a high fat diet. The mice were treated with ApoA1-LXR PA, ApoA1 PA, LXR, scrambled PA, or saline twice per week over eight weeks with the effects of each condition evaluated by the percent of atherosclerosis in the aortic root (Figure 6A). For both sexes, atherosclerosis progression was significantly decreased in comparison to the PBS control after treatment with LXR (p < 0.0001), ApoA1 PA (p = 0.012), scrambled PA (p = 0.034), or ApoA1-LXR PA (p = 0.0001) (Figure 6B). The ability of each treatment to reduce atherosclerotic plaque size was variable based on sex (Figure 6C–D). For example, ApoA1-LXR PAs significantly enhanced plaque reduction in comparison to scrambled PA treatments in males (p = 0.0165), an observation not seen in females. Additionally, scrambled PAs showed greater effects upon reducing atherosclerosis in females in comparison to males (p = 0.0487). Treatments with LXR showed similar therapeutic effects as ApoA1-LXR PA treatments in both males (p = 0.3978) and females (p = 0.2258). Surprisingly, treatment with ApoA1-LXR PA showed no significant improvement on plaque reduction in females versus ApoA1 PAs (p = 0.6928). In contrast, while not significant, a trend was observed in males for ApoA1-LXR PA treatment having greater effects on plaque reduction in comparison to ApoA1 PA treatments (p = 0.0687). LXR and ApoA1-LXR treatments reversed atherosclerosis from baseline levels in both sexes by approximately 5%.[17] No additional reduction in plaque content within the aortic root was observed in ApoA1-LXR treatments in comparison to LXR alone. This finding is in contrast to our previously reported in vitro cholesterol efflux results, where we observed significantly higher macrophage cholesterol efflux in ApoA1-LXR treatments in comparison to LXR, ApoA1 PA, and scrambled PAs.[17] Possible reasons for the therapeutic effect with ApoA1 PAs could be from the cholesterol efflux potential of the 4F peptide.[12] The PAs may also reduce availability of macrophages to migrate to the plaque due to uptake and clearance of the PA nanofibers, which is consistent with the scrambled PAs that are able to reduce plaque progression without directly targeting the plaque site.
Figure 6.

Atherosclerosis Treatment Study. (A) Timeline for low density lipoprotein receptor knockout (LDLR KO) mice fed the high fat diet, treatment injections, and sacrifice. (B) Effects of treatment on atherosclerosis progression. *p<0.05, error bars are S.E.M. Atherosclerosis represented as percentage of aortic root in all mice. PBS: n=8 mice—5 male, 3 female; Scr PA: n=10 mice—5 male, 5 female; LXR: n=9 mice—4 male, 5 female; ApoA1 PA: n=10 mice—5 male, 5 female; ApoA1 LXR PA: n=9 mice—4 male, 5 female. At least four cross sections were analyzed per treatment. (C) Effects of treatment and sex on plaque size reduction. With respect to sex, the percentage of atherosclerosis per treatment was subtracted from the averaged PBS control. *p<0.05, #p<0.05 against male scrambled PA. Error bars are S.E.M. (D) Brightfield images of representative sections of Oil Red O-stained aortic roots at 5x magnification.
Importantly, while LXR and scrambled PA treatments reduce plaque burden, they also increased liver toxicity in male mice based on significantly elevated levels of aspartate aminotransferase (AST) in the blood in comparison to the PBS conditions (p = 0.0207 and p=0.0018, respectively; Table 2). Neither ApoA1-LXR PAs nor ApoA1 PAs increased AST levels in male mice in comparison to the PBS control (p=0.3117 and p=0.1348, respectively). Interestingly, female mice showed no significant differences in AST levels in comparison to the PBS control for the LXR (p=0.2002), scrambled PA (p=0.1636), or ApoA1-LXR PA (p=0.5832) treatments. No significant differences in blood levels of cholesterol, alanine aminotransferase, or alkaline phosphatase were observed between treatments or sex.
Table 2.
Treatment study serum chemistry data. Data are shown as group medians with ranges in parentheses.
| Test/Tx All Females Males |
PBS N=9 N=5 N=4 |
LXR N=10 N=5 N=5 |
ApoA1 PA N=9 N=4 N=5 |
Scr PA N=10 N=5 N=5 |
ApoA1-LXR PA N=9 N=5 N=4 |
|---|---|---|---|---|---|
| Cholesterol (mg/dL) | 1755 (288–2932) 611 (489–2932) 2233(288–2535) |
2000.5(803–3554) 2029(803–2396) 1972(1106–3554) |
1619 (1128–2237) 2020(1768–2237) 1455(1128–1619) |
2003.5 (170–3091) 1980(695–2636) 2027(170–3091) |
1877 (829–2533) 2323(1836–2533) 1600.5(829–2360) |
| Aspartate Aminotransferase (AST, U/L) | 82(8–290)*# 89(8–290) 54.5(27–82) |
135(78–214) 142(91–166) 102(78–214) |
95(52–216) 182.5(138–216) 90(52–95) |
154.5(65–629) 153(65–157) 199(79–629) |
74(32–145)*# 74(32–145) 74.5(46–109) |
| Alanine Aminotransferase (ALT, U/L) | 28(4–81) 28(22–81) 19.5(4–49) |
40(18–136) 33(18–45) 47(24–136) |
39(6–88) 19(6–88) 70(28–87) |
35(16–277) 22(16–127) 205(34–277) |
44(18–122) 44(25–85) 46(18–122) |
| Alkaline phosphatase (U/L) | 50(24–98) 33(24–98) 53(36–57) |
65.5(8–78) 73(8–78) 41(40–77) |
46(33–80) 68(54–80) 40(33–46) |
55.5(26–97) 57(45–77) 45(26–97) |
58(40–83) 66(55–75) 56.5(40–83) |
| Total Bilirubin (mg/dL) | 0.3(0.1–0.5) 0.2(0.1–0.3)* 0.4(0.3–0.5) |
0.4(0.2–0.9) 0.6(0.5–0.9)$ 0.3(0.2–0.3) |
0.3(0.2–0.5) 0.45(0.2–0.5) 0.2(0.2–0.4) |
0.3(0.1–0.5) 0.3(0.1–0.5) 0.2(0.2–0.3) |
0.4(0.1–0.7) 0.4(0.1–0.7) 0.35(0.3–0.5) |
| Bilirubin - Conjugated (mg/dL) | 0(0–0.1) 0(0–0.1) 0(0–0.1) |
0.05(0–0.3) 0(0–0.3) 0.1(0–0.1) |
0.1(0–0.2) 0.1(0.1–0.2) 0(0–0.1) |
0.1(0–0.2) 0(0–0.2) 0.1(0–0.2) |
0.1(0–0.3) 0.1(0–0.3) 0.05(0–0.1) |
| Bilirubin - Unconjugated (mg/dL) | 0.2(0.1–0.5) 0.2(0.1–0.2)* 0.4(0.2–0.5) |
0.3(0.1–0.8) 0.5(0.3–0.8)$ 0.2(0.1–0.3) |
0.2(0.1–0.4) 0.3(0.1–0.4) 0.2(0.2–0.4) |
0.15(0–0.5) 0.3(0.1–0.5) 0.1(0–0.3) |
0.4(0–0.5) 0.4(0–0.5) 0.35(0.2–0.4) |
| Creatine Kinase (U/L) | 126(80–351) 126(101–351) 129.5(80–166) |
137.5(102–198) 136(126–198) 138(102–150) |
177(84–575) 309.5(167–575) 131(84–182) |
144.5(67–356) 146(95–356) 143(67–322) |
150(32–250) 140(32–165) 158.5(103–250) |
| Total Protein (g/dL) | 5.2(4.3–5.6)^ 4.5(4.3–5.6) 5.45(5.1–5.6) |
5.45(5.1–5.7) 5.4(5.1–5.7) 5.5(5.3–5.7) |
5.6(5.1–6)* 5.45(5.1–5.6) 5.8(5.6–6) |
5.4(2.5–5.7) 5.4(4.7–5.7) 5.4(2.5–5.7) |
5.4(5.1–5.8) 5.4(5.4–5.8) 5.55(5.3–5.7) |
| Globulin (g/dL) | 2.5(2.3–2.9) 2.4(2.3–2.5) 2.65(2.5–2.9) |
2.7(2.1–3) 2.3(2.1–2.9) 2.8(2.7–3) |
3.2(2.1–3.4)* 2.45(2.1–2.8)& 3.3(3.2–3.4) |
2.35(1.3–2.8) 2.3(2.2–2.5) 2.6(1.3–2.8) |
2.6(2.1–2.8) 2.4(2.1–2.7) 2.65(2.6–2.8) |
| Sodium (mmol/L) | 141(134–156) 154(134–156) 140(137–148) |
139.5(131–146) 140(138–146) 139(131–142) |
141.5(137–145) 137(137–140) 143(141–145) |
138(134–155) 138(135–155) 138(134–149) |
144(136–147) 144(136–147) 141(138–146) |
| Potassium (mmol/L) | 4.4(3.6–4.9)*% 4.3(3.6–4.9) 4.75(4.2–4.9) |
5.2(3.8–9.6) 4.6(3.8–9.6) 5.2(5.2–6.1) |
4.75(4.2–5.7) 4.8(4.6–5.4) 4.7(4.2–5.7) |
5.15(4.4–5.6) 4.8(4.7–5.3) 5.2(4.4–5.6) |
5.1(4.7–6.2) 5(4.7–6.2) 5.2(4.8–5.8) |
| Chloride (mmol/L) | 107(97–118) 114(97–118) 105(103–112) |
103(99–109) 102(101–109) 104(99–107) |
105(102–106) 102(102–105) 105(103–106) |
100.5(97–119) 100(99–117) 101(97–119) |
104(100–109) 107(102–109) 102(100–105) |
| Bicarbonate and CO2 (mmol/L) | 12(8–14)^ 10(8–13) 12(11–14) |
12(9–16) 10(9–12) 14(12–16) |
12(11–15) 11.5(11–12) 13(11–15) |
13(10–16) 14(10–16) 13(11–16) |
11(9–15) 11(9–15) 11.5(10–13) |
| Blood Urea Nitrogen (mg/dL) | 23(17–34) 22(17–34) 26(19–29) |
23(18–32) 21.5(18–24) 24(20–32) |
19(13–22) 21.5(20–22) 16(13–19) |
22(14–31) 18.5(14–26) 24(18–31) |
24(13–30) 19.5(13–30) 24.5(24–26) |
| Creatine (U/L) | 0(0–0.1) 0(0–0.1) 0(0–0) |
0(0–0.2) 0(0–0.2) 0(0–0) |
0(0–0.1) 0(0–0.1) 0(0–0.1) |
0(0–0.1) 0(0–0.1) 0(0–0.1) |
0(0–0.2) 0(0–0.2) 0(0–0.1) |
| Glucose (mg/dL) | 226(136–279) 226(136–277) 202.5(160–279) |
237(134–332) 203(134–226) 259(248–332) |
196(154–271) 204(160–271) 196(154–242) |
200.5(29–424) 198(184–333) 203(29–424) |
210(95–410) 210(190–241) 228.5(95–410) |
Black text: all, red text: female, blue text: male.
p<0.05 vs. LXR
p<0.05 vs. Scr PA
p<0.05 vs. ApoA1 PA
p<0.05 vs. ApoA1-LXR PA
p<0.05 female LXR vs. male LXR
p<0.05 female ApoA1 PA vs male ApoA1 PA.
n=21 male and 24 female blood samples analyzed per condition.
Discussion
In this study, we found that long-aspect ratio PAs containing an apolipoprotein A1-mimetic peptide, 4F, serve as effective nanocarriers to target LXR agonists to atherosclerotic plaque in vivo. Using an amphiphile control of the 4F peptide directly conjugated to the hydrophobic LXR drug, we found a lack of nanofiber formation (Figure 1D) and no targeting (Figure 2). These results are in agreement with our previous study that demonstrated the importance of β-sheet forming peptides in PA nanofiber formation and subsequent targeting to diseased vasculature. [17]
Previous work by Yu et al. has also demonstrated the potential of intravenously administered nanocarriers to locally deliver LXR agonist GW3965 to plaque using spherical nanoparticles comprised of PEGylated phospholipid 1,2-distearoylphosphatidylethanolamine and a collagen-IV targeting peptide.[18] While their findings demonstrated significant reductions in macrophage content within atherosclerotic lesions in comparison to saline and non-targeted nanoparticle treatments, the effect of LXR agonist on reducing plaque burden was not quantified, and the mice did not continue a high fat diet during the treatment, preventing accurate comparisons between the efficacy of each nanocarrier system. A potential hypothesis for the lack of enhanced plaque reduction in ApoA1-LXR PA vs. LXR is the mechanism of drug release from the PA. PA nanofibers incorporate the LXR agonist through hydrophobic collapse rather than covalent linkages. As the PA nanofibers can undergo reversible self-assembly, some LXR agonist may be lost during intravenous transport. Further work on the interactions of the PA nanofibers with blood components would provide valuable insight to learn whether hydrophobic proteins such as albumin may extract the LXR from ApoA1 LXR PAs, potentially disrupting the nanofiber structure. Additionally, upon reaching plaque, the LXR agonist may not readily release from the hydrophobic interior of the nanofibers to reach the intracellular nuclear target within macrophage foam cells. Thus, our future work will investigate physiochemical analysis on PA and blood interactions as well as methods to covalently tether LXR agonists to PA nanofibers with atheroma niche-cleavable linkages to control local release and improve overall therapeutic efficacy.
Conclusion
We have shown that ApoA1 PA nanofibers with an incorporated LXR agonist can be used for safe, targeted delivery to areas of atherosclerotic plaque to reverse atherosclerosis in a preclinical in vivo model.
Experimental Section
Synthesis and characterization of targeted peptides, targeted nanofibers and therapeutic nanofibers
PA molecules were synthesized using 9-fluorenyl methoxycarbonyl (Fmoc) solid-phase peptide chemistry with low-loading Rink amide 4-methylbenzhydrylamine resin, as previously described.[17] Synthesis was performed on a CEM Liberty or CEM Liberty Blue automated microwave peptide synthesizer. Coupling reactions on the Liberty were performed using 4 molar equivalents (eq.) of Fmoc-protected amino acid or palmitic acid; 4 eq. of O-benzotriazole-N, N, N′, N′-tetramethyluronium hexafluorophosphate (HBTU); and 8 eq. of N,N-diisopropylethylamine (DIEA); and removal of Fmoc groups on resin-attached amino acids was achieved with 30% 4-methylpiperidine and 0.1 M hydroxybenzotriazole (HOBt) in N,N-dimethylformamide (DMF). Coupling reactions on the Liberty Blue were performed using 4 eq. of Fmoc-protected amino acid or palmitic acid; 4 eq. of N, N′-diisopropylcarbodiimide (DIC); and 8 eq. of ethyl(hydroxyimino)cyanoacetate (Oxyma pure); and removal of Fmoc groups on resin-attached amino acids was achieved with 20% 4-methylpiperidine in DMF.
Covalent attachment of GW3965 to peptides was achieved by direct conjugation of the carboxylic acid of GW3965 to the N-terminal amine of the peptide on resin using 1.2 eq. GW3965-HCl, 1.1 eq. HBTU, and 8 eq. DIEA. PAs and peptides were cleaved off resin in a 95:2.5:2.5 trifluoroacetic acid (TFA)/triisopropylsilane (TIPS)/H2O mixture (cysteine-containing peptides included 3% 2,2′-(Ethylenedioxy)diethanethiol (DODT) and 92% TFA with the same TIPS/ H2O mixture). Purification was accomplished using HPLC on a C18 Phenomenex Gemini column in a water-acetonitrile gradient containing 0.1% v/v NH4OH. Fractions with the desired product were identified using electrospray ionization mass spectrometry and combined. Rotary evaporation followed, and after removal of volatile solvents, the resulting product was lyophilized to dryness. Fluorophore labelling was achieved by reacting PA/peptide in 2–3x molar excess with Alexa Fluor® 546-C5-maleimide and Tris(2-carboxyethyl)phosphine (TCEP) hydrochloride (5 eq. with respect to PA/peptide) in pH 8 Tris buffer or potassium phosphate buffer pH 7.8. Pure product was isolated following HPLC purification as described above.
Alexa-tagged PA/peptide was present at 10 wt% concentration in the final co-assembly as described below. PA/peptide co-assemblies and LXR agonist-encapsulations were prepared using a solvent evaporation method as described previously.1 Briefly, each component of the co-assembly or encapsulation was dissolved in 1,1,1,3,3,3-hexafluoro-2-propanol (HFIP). For 40% ApoA1 PA co-assembly, solutions of the ApoA1 PA (sequence: C16-V2A2E2-G-DWFKAFYDKVAEKFKEAF-NH2) and diluent PA (sequence: C16-V2A2E2-NH2) were mixed at a 40 mol% ApoA1 PA/ 60 mol% diluent PA ratio. Similarly, the 40% scrambled-ApoA1 sequence PA co-assembly (Scr PA) was made with a 40 mol% Scr PA (sequence: C16-V2A2E2-C-DWFAKDYFKKAFVEEFAK-NH2) / 60 mol% diluent PA ratio. Co-assemblies with Alexa fluorophore had 10 wt% Alexa-tagged ApoA1 or Scr PA, with the 40 mol% concentration of respective PA maintained. LXR agonist-encapsulations were made by adding HFIP-dissolved GW3965 to the appropriate PA mixture in a 1:1 wt. LXR/PA ratio. After component solutions were combined, the mixtures were sonicated in a water bath for 15 minutes, frozen in liquid nitrogen, and kept under vacuum until dry. The resulting materials were then reconstituted in ultrapure water, pH-adjusted with 200 mM NaOH to dissolution, probe-sonicated for 30 seconds, and lyophilized to dry powder. Peptide sequences are shown in Schematic 1.
Schematic 1.

Chemical structures of the nanofibers (ApoA1 PA: ApoA1-targeted PA nanofiber, Scr PA: scrambled ApoA1 sequence PA nanofiber) and targeted peptides (4F peptide, LXR-4F peptide). The portion of the structures shown in black is the hydrophobic region, β-sheet forming region, and charged sequence that together facilitate nanofiber formation. The pink sphere represents Alexa Fluor® 546 maleimide, the blue region is the 4F sequence (ApoA1: Apolipoprotein A1-mimetic sequence), the green region is a scrambled 4F sequence, and the red region is the liver X receptor (LXR) agonist GW3965.
PA characterization
PA and peptide secondary structure was investigated using a Chirascan™-plus Circular Dichroism Spectrometer (Applied Photophysics). Samples were analyzed at 0.5 mM, with respect to ApoA1 or Scr PA in co-assemblies, in 0.1 M phosphate buffer at pH 7.4 with a 0.1 mm pathlength Suprasil® quartz cuvette (Sigma-Aldrich). Each sample was analyzed at 25°C and 37°C using a wavelength spectrum of 185 to 260 nm with a step of 0.3 nm and analysis time of 1.25 seconds per data point. Spectrum data was averaged from two scans and the phosphate buffer values were subtracted from each sample. Predictions of secondary structure fractions in ApoA1 PA before and after LXR addition were performed using CD spectral data at 37C using CDPro software package.[19] The predicted results from CONTIN, SELCON3, and CDSSTR methods were averaged for each PA.
Dynamic light scattering measurements were performed on a Zetasizer Nano ZS instrument (Malvern). Samples were prepared at 0.1 to 1 mM in PBS and passed through a 0.1–0.2 μm pore size Whatman™ syringe filter using a 1 mL Monoject™ insulin syringe. The mean count rate was averaged from three runs per experiment, with 12–32 scans per run.
Samples at 1 mM in PBS were prepared for TEM by plating on copper supports covered with thin carbon foil 400-mesh that were treated with glow discharge. Samples were adsorbed on the grid for approximately two minutes, rinsed with water, and stained with 2% uranyl acetate before imaging on a FEI Tecnai T-12 TEM at 80 kV with a Gatan Orius® 2k x 2k CCD camera. Due to the overlapping fibers, automated tools including FiberApp could not be used to analyze the nanofibers. Instead, the TEM images were analyzed manually for nanofiber diameter and length using ImageJ software. Cryogenic TEM of samples was also performed using a JEOL 1230 at 100 kV accelerating voltage and Gatan 831 CCD camera, as previously reported.[20] PAs were pipetted at 5.0 μL volumes onto 300-mesh copper grids with lacey carbon support (Electron Microscopy Sciences) that were pretreated with glow discharge for 20 seconds. Samples were prepared at 1mM in PBS blotted once for 3 seconds before plunging into liquid ethane using a Vitrobot Mark III (FEI) vitrification robot. After vitrification, the samples were transferred under liquid nitrogen to a Gatan 626 cryo-holder for imaging.
Mouse model of atherosclerosis
To study atherosclerosis we use the LDLR KO mouse. LDLR KO mice are fed a high fat “western” diet (Teklad TD.88137) starting at 4 weeks of age. This diet consists of 20% fat, 0.2% cholesterol, and 34% high sucrose. LDLR KO mice fed this diet typically develop severe hypercholesterolemia (>800 mg/dL) and hypertriglyceridemia (>300 mg/dL) after only 2 weeks.[21] By 12 weeks on the high fat diet, atherosclerotic lesions are detected in the aortic root and aortic arch on cryosections stained with Oil Red O (Sigma).[22] Atherosclerosis was quantified in the aortic root as a percentage of the aortic root by taking the atherosclerotic area divided by the total aortic root area. Measurements were made with ImageJ software. All protocols for the animal model and procedures in this manuscript were approved by Northwestern University’s Institutional Animal Care and Use Committee.
Injection of PA nanofibers
PA nanofibers were dissolved at 2–4 mg/mL concentration in room temperature phosphate buffered saline (PBS). After 14 weeks on the high fat diet, mice received intravenous injections of PA nanofiber dissolved in PBS (dorsal penile vein in males, retro-orbital injection in females) using a 31 G hypodermic insulin needle on a 0.3 mL syringe under sterile conditions and magnification (NIKON SMZ 645 Zoom Stereomicroscope). Mice were briefly anesthetized for injection with inhaled isoflurane. Mice were monitored and allowed to recover from anesthesia in a heated oxygen chamber.
Dose and concentration study
To determine the optimum concentration for targeting efficacy and safety, LDLR KO mice fed the high fat diet for 14 weeks were injected with PA nanofiber at concentrations of 1 mg/mL, 2 mg/mL, and 4 mg/mL at 8 mg/kg in PBS. Similarly, to determine the optimum dose for targeting efficacy and safety, LDLR KO mice fed the high fat diet for 14 weeks were injected at PA nanofiber doses of 8 mg/kg, 6 mg/kg, 4 mg/kg, 3.3 mg/kg, and 1.7 mg/kg at 2 mg/mL in PBS. Safety, optimum dose, and concentration for targeting was assessed by survival of the animal and fluorescent pixel quantification in the aortic root, liver, lungs, kidneys, and spleen.
Treatment study
LDLR KO mice fed the high fat diet for 14 weeks were briefly anesthetized with inhaled isoflurane and injected twice per week for 8 weeks with either PBS alone, the LXR agonist GW3965, ApoA1 PA, Scr PA, or ApoA1-PA with GW3965 (ApoA1-LXR PA). Injections were given at a dose of 6 mg/kg PA or 6 mg/kg PA + 6 mg/ kg LXR for ApoA1-LXR PA. Blood samples were collected at the end of the treatment study for toxicology analysis. Mice were euthanized three days after their 16th treatment.
Tissue processing and imaging
Mice were sacrificed and euthanized under inhaled isoflurane anesthesia by diaphragm disruption and exsanguination. Phlebotomy was performed through direct right ventricular cardiac puncture using a 1 mL syringe and 25 G needle. Perfusion was performed through left ventricular cardiac puncture with 10 mL PBS and 10 mL 10% sucrose solution. The lungs, liver, spleen, kidney, aortic root, aortic arch, and descending aorta were harvested and stored in 10% sucrose for 20 minutes. Organs and vessels were then flash-frozen in Optimal Cutting Temperature embedding medium 4583 (Tissue-Tek®) with liquid nitrogen. Frozen specimens were stored at −80°C and cryosectioned at 8 μm. Confocal microscopy was performed on a Nikon A1R microscope. Two sets of images were acquired with a 10x Plan Fluor NA 0.3 objective. PAs were identified through quantification of the Alexa Fluor® 546 conjugated dye with 561 nm excitation and a 600/50 nm emission filter.
Images were acquired with spectral detection and spectrally umixed to accurately separate green autofluorescence from the red Alexa Fluor® 546 signal. Brightfield and fluorescent microscopy were performed using a Zeiss Axio Imager.A2 microscope with AxioVision software (release 4.8.2, 06–2010). All confocal and fluorescent sections were mounted with ProGold Diamond mounting media (Sigma). Slides were stained with Oil Red O to image and quantify atherosclerosis under brightfield microscopy. The elastic laminae were identified using the green fluorescent protein (GFP) filter with an exposure time of 3500 ms under 5x magnification. Nanofibers were identified in the aortic root by presence of Alexa Fluor® 546 on the Cy3 filter under 5–10x magnification, and in the internal organs under 20x magnification. Fluorescent pixel quantification in the aortic root and within organs was performed with ImageJ software.
Statistics
The effect of treatments and sex on atherosclerosis progression in mice was analyzed using one- or two-factor analysis of variance (ANOVA) followed by a post-hoc student’s t-test. The toxicological effects of treatments were also analyzed using two-factor ANOVA and a post-hoc student’s t-test. Toxicological effects of treatments on liver proteins AST, ALT, and ALP were further analyzed using ordinal logistic regression models of likelihood ratio tests, followed by a post-hoc Wald test.
Supplementary Material
ACKNOWLEDGMENTS
The authors would like to acknowledge Mrs. Lynnette Dangerfield and Mrs. Katherine Wallace for their administrative and editorial assistance.
Funding Sources
Author N.A.M. is partially supported by a National Institutes of Health Grant (2T32HL094293-06) and American Medical Association Foundation 2016 Seed Grant. Author E.B.P. was supported by the American Heart Association Postdoctoral Fellowship 18POST33960499. Author M.M.S. was supported by a National Defense Science and Engineering Graduate Fellowship (NDSEG). Author T.D.C is supported by an American Australian Association Dow Chemical Company Fellowship
This research was supported by funding from the National Institutes of Health (NIH)/NHLBI Bioengineering Research Partnership grant (5R01HL116577); the Northwestern Memorial Foundation Dixon Translational Research Innovation Award; the NUCATS Institute funded, in part, by the National Center for Advancing Translational Sciences (NCATS) of the NIH research grant UL1TR001422 NUCATS. S.I.S acknowledges funding from a catalyst award by the Louis A. Simpson & Kimberly Querrey Center for Regenerative Nanomedicine at Northwestern University.
Peptide amphiphile synthesis was performed in the Peptide Synthesis Core Facility of the Simpson Querrey Institute at Northwestern University. The U.S. Army Research Office, the U.S. Army Medical Research and Materiel Command, and Northwestern University provided funding to develop this facility and ongoing support is being received from the Soft and Hybrid Nanotechnology Experimental (SHyNE) Resource (NSF ECCS-1542205). Imaging work was performed in part at the Northwestern University Center for Advanced Microscopy, generously supported by NCI CCSG P30 CA060553 awarded to the Robert H. Lurie Comprehensive Cancer Center. Multiphoton microscopy was performed on a Nikon A1R multiphoton microscope, acquired through the support of NIH 1S10OD010398-01. This work made use of the BioCryo facility of Northwestern University’s NUANCE Center, which has received support from the Soft and Hybrid Nanotechnology Experimental (SHyNE) Resource (NSF ECCS-1542205); the MRSEC program (NSF DMR-1720139) at the Materials Research Center; the International Institute for Nanotechnology (IIN); and the State of Illinois, through the IIN.
Circular dichroism spectroscopy was performed at the UNC Macromolecular Interactions Facility, supported by the National Cancer Institute of the National Institutes of Health under award number P30CA016086. We gratefully acknowledge Dr. Jack Griffith at UNC for his assistance with TEM imaging.
References
- [1].Benjamin EJ, Blaha MJ, Chiuve SE, Cushman M, Das SR, Deo R, de Ferranti SD, Floyd J, Fornage M, Gillespie C, Isasi CR, Jimenez MC, Jordan LC, Judd SE, Lackland D, Lichtman JH, Lisabeth L, Liu S, Longenecker CT, Mackey RH, Matsushita K, Mozaffarian D, Mussolino ME, Nasir K, Neumar RW, Palaniappan L, Pandey DK, Thiagarajan RR, Reeves MJ, Ritchey M, Rodriguez CJ, Roth GA, Rosamond WD, Sasson C, Towfighi A, Tsao CW, Turner MB, Virani SS, Voeks JH, Willey JZ, Wilkins JT, Wu JH, Alger HM, Wong SS, Muntner P, American C Heart Association Statistics, S. Stroke Statistics, Circulation. 2017, 135, e146. [DOI] [PMC free article] [PubMed] [Google Scholar]
- [2].Cannon CP, Braunwald E, McCabe CH, Rader DJ, Rouleau JL, Belder R, Joyal SV, Hill KA, Pfeffer MA, Skene AM, Pravastatin or Atorvastatin E, Infection I Therapy-Thrombolysis in Myocardial Infarction, N Engl J Med. 2004, 350, 1495. [DOI] [PubMed] [Google Scholar]
- [3].Sampson UK, Fazio S, Linton MF, Curr Atheroscler Rep. 2012, 14, 1. [DOI] [PMC free article] [PubMed] [Google Scholar]
- [4] a).Morgan CE, Wasserman MA, Kibbe MR, Ann Surg. 2016, 263, 900. [DOI] [PMC free article] [PubMed] [Google Scholar]; b) Nie S, Xing Y, Kim GJ, Simons JW, Annu Rev Biomed Eng. 2007, 9, 257. [DOI] [PubMed] [Google Scholar]
- [5].Aida T, Meijer EW, Stupp SI, Science. 2012, 335, 813. [DOI] [PMC free article] [PubMed] [Google Scholar]
- [6].Webber MJ, Kessler JA, Stupp SI, J Intern Med. 2010, 267, 71. [DOI] [PMC free article] [PubMed] [Google Scholar]
- [7].Doshi N, Prabhakarpandian B, Rea-Ramsey A, Pant K, Sundaram S, Mitragotri S, J Control Release. 2010, 146, 196. [DOI] [PMC free article] [PubMed] [Google Scholar]
- [8].Mendis S, Puska P, Norrving B, World Health Organization., World Heart Federation., World Stroke Organization., Global atlas on cardiovascular disease prevention and control, World Health Organization in collaboration with the World Heart Federation and the World Stroke Organization, Geneva: 2011. [Google Scholar]
- [9].Navab M, Anantharamaiah GM, Reddy ST, Hama S, Hough G, Grijalva VR, Yu N, Ansell BJ, Datta G, Garber DW, Fogelman AM, Arterioscler Thromb Vasc Biol. 2005, 25, 1325. [DOI] [PubMed] [Google Scholar]
- [10] a).Briley-Saebo KC, Cho YS, Shaw PX, Ryu SK, Mani V, Dickson S, Izadmehr E, Green S, Fayad ZA, Tsimikas S, J Am Coll Cardiol. 2011, 57, 337. [DOI] [PMC free article] [PubMed] [Google Scholar]; b) Ito T, Fujita H, Tani T, Ohte N, Atherosclerosis. 2015, 239, 311. [DOI] [PubMed] [Google Scholar]; c) Parthasarathy S, Raghavamenon A, Garelnabi MO, Santanam N, Methods Mol Biol. 2010, 610, 403. [DOI] [PMC free article] [PubMed] [Google Scholar]
- [11].Van Lenten BJ, Wagner AC, Jung CL, Ruchala P, Waring AJ, Lehrer RI, Watson AD, Hama S, Navab M, Anantharamaiah GM, Fogelman AM, J Lipid Res. 2008, 49, 2302. [DOI] [PMC free article] [PubMed] [Google Scholar]
- [12].Navab M, Anantharamaiah GM, Reddy ST, Hama S, Hough G, Grijalva VR, Wagner AC, Frank JS, Datta G, Garber D, Fogelman AM, Circulation. 2004, 109, 3215. [DOI] [PubMed] [Google Scholar]
- [13].Levin N, Bischoff ED, Daige CL, Thomas D, Vu CT, Heyman RA, Tangirala RK, Schulman IG, Arterioscler Thromb Vasc Biol. 2005, 25, 135. [DOI] [PubMed] [Google Scholar]
- [14].Im SS, Osborne TF, Circ Res. 2011, 108, 996. [DOI] [PMC free article] [PubMed] [Google Scholar]
- [15].Grefhorst A, Elzinga BM, Voshol PJ, Plosch T, Kok T, Bloks VW, van der Sluijs FH, Havekes LM, Romijn JA, Verkade HJ, Kuipers F, J Biol Chem. 2002, 277, 34182. [DOI] [PubMed] [Google Scholar]
- [16].Dodero VI, Quirolo ZB, Sequeira MA, Front Biosci (Landmark Ed). 2011, 16, 61. [DOI] [PubMed] [Google Scholar]
- [17].So MM, Mansukhani NA, Peters EB, Albaghdadi MS, Wang Z, Perez CMR, Kibbe MR, Stupp SI, Adv Biosyst. 2018, 2. [DOI] [PMC free article] [PubMed] [Google Scholar]
- [18].Yu M, Amengual J, Menon A, Kamaly N, Zhou F, Xu X, Saw PE, Lee SJ, Si K, Ortega CA, Choi WI, Lee IH, Bdour Y, Shi J, Mahmoudi M, Jon S, Fisher EA, Farokhzad OC, Adv Healthc Mater. 2017, 6. [DOI] [PMC free article] [PubMed] [Google Scholar]
- [19].Sreerama N, Woody RW, Anal Biochem. 2000, 287, 252. [DOI] [PubMed] [Google Scholar]
- [20].Peters EB, Tsihlis ND, Karver MR, Chin SM, Musetti B, Ledford BT, Bahnson EM, Stupp SI, Kibbe MR, Adv Healthc Mater. 2019, 8, e1801545. [DOI] [PMC free article] [PubMed] [Google Scholar]
- [21].Ishibashi S, Brown MS, Goldstein JL, Gerard RD, Hammer RE, Herz J, J Clin Invest. 1993, 92, 883. [DOI] [PMC free article] [PubMed] [Google Scholar]
- [22].Ma Y, Wang W, Zhang J, Lu Y, Wu W, Yan H, Wang Y, PloS One. 2012, 7, e35835. [DOI] [PMC free article] [PubMed] [Google Scholar]
Associated Data
This section collects any data citations, data availability statements, or supplementary materials included in this article.