

Abstract
The behavioral version of the collision technique was used to study the existence of axonal linkage between reward-relevant sites in the ventral tegmental area (VTA) and posterior mesencephalon (PM) in six rats trained to self-administer trains of electrical brain stimulation. The combined use of fixed and moveable stimulation electrodes allowed us to carry out collision tests at a total of 46 different combinations of VTA-PM sites, and collision-like effects were observed at 24 of these. Stimulation of the VTA and the most caudal PM sites generally resulted in collision curves that were characterized by a single increase in paired-pulse effectiveness (E-values), whereas recovery in those collision curves obtained from stimulation of the VTA and more rostral PM sites was generally slower, and often characterized by a double rise. Despite little variability in interelectrode distances (1.0–3.8 mm), collision intervals varied widely, ranging from 1.5 to 7.3 msec. Recovery from refractoriness (initial 25%) was also estimated and ranged from 0.7 to 1.0 msec, resulting in conduction-time estimates of 0.7–6.3 msec. The lack of correspondence between interelectrode distances and conduction times suggests the presence of axonal branching. Results of this study constitute the first behavioral evidence of a reward-relevant axonal link between the VTA and the PM. In addition, the finding that in one animal the anterior electrode was located within the posterior portion of the lateral hypothalamus (LH) suggests that the reward-relevant axonal bundle linking the LH and VTA may extend as far back as the caudal regions of the PM.
Keywords: collision, refractory periods, reward, self-stimulation, ventral tegmental area, posterior mesencephalon
A major challenge in the study of the neural substrates of behaviors induced by electrical brain stimulation is to determine which neurons located within the stimulation field control the behavior. One approach that has been used to characterize reward-relevant neurons, for instance, uses responding for electrical brain stimulation [self-stimulation (SS)] and consists of determining trade-off functions that describe different combinations of two stimulation parameters that support a constant level of responding. This psychophysical approach rests on the assumption that these trade-off functions reflect anatomical and physiological characteristics of neurons that contribute directly to the evoked behavior (Gallistel et al., 1981).
Previous mapping studies that used the psychophysical approach have revealed the presence of a continuous band of reward-relevant sites extending between the ventral tegmental area (VTA) and central gray (Rompré and Miliaressis, 1985; Rompré and Boye, 1989). Such continuity suggests the presence of a reward-relevant pathway traveling between these sites. This hypothesis is supported by psychophysical data, which show that directly stimulated reward-relevant neurons in the medial mesencephalon have refractory periods that are comparable to those of reward-relevant neurons in the VTA (Rompré and Miliaressis, 1987).
One way to test the hypothesis of a common pathway is to apply the behavioral version of the collision technique, which has been used previously to reveal reward-relevant axonal linkage between the lateral hypothalamus (LH) and the VTA (Shizgal et al., 1980; Bielajew and Shizgal, 1982, 1986; Durivage and Miliaressis, 1987; Gratton and Wise, 1988; Murray and Shizgal, 1994). This technique takes advantage of the conduction failure that occurs because of the collision of ortho- and antidromic action potentials propagating along a common axon. The behavioral version of the collision technique consists of stimulating with pulse pairs: each site receives one pulse from each pair, and the number of pulse pairs required to maintain a constant level of responding is determined at different interpulse intervals. An increase in the required number of pulse pairs at short interpulse intervals suggests that (1) behaviorally relevant action potentials are lost because of collision and (2) the two sites are linked directly by reward-relevant neurons.
The collision technique has been used previously in an attempt to reveal a reward-relevant axonal link between the LH and the posterior mesencephalon (PM) (Bielajew et al., 1981; Kofman and Yeomans, 1988). Although these earlier studies did not provide evidence of collision-like effects, the observed summation between reward-relevant signals triggered at each site suggested that PM and LH rewarding effects are mediated by neural elements that converge on a common substrate. In the present study, we attempted to reveal axonal linkage between sites in the VTA and the PM. Contrary to previous studies, however, we used moveable stimulation electrodes to circumvent the problem created by the large dispersion of reward-relevant sites in the PM (see Miliaressis and Philippe, 1983).
MATERIALS AND METHODS
Subjects and surgery. Subjects were male Long–Evans rats (Charles River breeding farms)that weighed between 350 and 450 gm at the time of surgery. They were housed individually in plastic cages with free access to food and water and were maintained on a reversed 12 hr light/dark cycle (lights on at 8 P.M.).
Surgery was conducted under general anesthesia induced by sodium pentobarbital (65 mg/kg, i.p.). Atropine sulfate was administered 20 min before anesthesia to reduce mucous secretion. Each animal was implanted with a moveable electrode (Kinetrods, SME-01) and either one or two fixed monopolar stimulation electrodes. Fixed electrodes were constructed from stainless steel wires (0.25 mm), insulated with Formvar, and crimped to a male amphenol pin; the tip of each electrode was honed to a hemispherical shape. Fixed electrodes were aimed at the VTA using the following flat skull stereotaxic coordinates: 4.8–5.3 mm posterior to bregma, 0.8–1.8 mm lateral to the midline, and 7.3–8.2 mm below dura. The moveable electrode was aimed at the midline PM, 7.3–8.0 mm posterior to bregma and 5.5–7.0 mm below the skull surface. An uninsulated stainless steel wire, crimped at one end to a male amphenol pin, was wrapped around four to five skull screws and served as the inactive electrode. Acrylic dental cement was used to chronically secure the electrode assembly to the skull.
Apparatus. Operant chambers (25 × 25 × 70 cm) were equipped with a rodent lever located 6 cm above the wire mesh floor. Depression of the lever allowed the animal to trigger the delivery of trains of electrical pulses. Stimulation pulses were produced by a dual constant-current unit driven by a two-channel pulse generator (Mundl, 1980). Current intensity was monitored by reading the voltage drop across a 1KΩ resistor in series with the rat. A light located above the lever served as a discriminative cue and signaled the availability of the stimulation.
Training and stabilization. One week after surgery, animals were screened for VTA SS. Stimulation parameters consisted of 500 msec trains of cathodal rectangular pulses of constant duration (0.1 msec). Once responding was established, animals were allowed to self-stimulate for 1 hr daily for 3 consecutive days with current intensity and pulse number adjusted to support continuous responding. Only animals that learned to self-administer stimulation via the VTA electrode were included in the study. For animals with bilateral VTA electrodes, both sites were screened and the one that sustained SS at the lowest current intensity or did not induce stimulation-bound reactions was used in the collision tests.
Subjects were subsequently trained to lever-press for stimulation of the PM. If the subject did not learn the task within a single session, the electrode was lowered (0.32 mm), and the new site was tested the following day. Once a PM site that supported SS was found, subjects were allowed to self-stimulate for 1 hr daily for 3 consecutive days.
During the stabilization period, functions relating response rates to the number of pulses within a train of stimulation (rate–number curve) were obtained repeatedly. Each curve consisted of first determining the number of pulses required to produce maximal responding during a 30 sec trial and then decreasing this number by ∼10% (0.05 log10 unit steps) to the closest pulse number until responding extinguished. Number thresholds, defined as the number of pulses required to support a half-maximal rate of responding, were extrapolated from individual rate–number curves. Self-stimulation was considered stable when number thresholds did not vary by more than ∼40% (0.15 log10 units) within and across three to four test sessions.
Collision test. Collision tests consisted of determining the number thresholds for single- and paired-pulse stimulation conditions. Each test session began with a warm-up single-pulse number threshold determination for each site; these data were not included in the analyses. Throughout the session, three additional single-pulse number thresholds were obtained from each site; these were interspersed among paired-pulse number threshold determinations. In the paired-pulse condition, stimulation consisted of delivering the first pulse of each pair (conditioning- or C-pulse) to one site and the second pulse (test- or T-pulse) to the other, at different C–T intervals. The stimulation site that received the first pulse from each pair alternated from day to day [anterior-posterior (AP): C-VTA, T-PM; posterior-anterior (PA): C-PM, T-VTA]. The order in which different C–T intervals (0.2–32 msec) were tested was first determined randomly and then counterbalanced daily. At some sites, train duration was increased (up to 750 msec) to test very long C–T intervals. The data from a session were discarded if for either site the range of single-pulse number thresholds exceeded 0.15 log10 units.
The effectiveness of paired-pulse stimulation (E-value) at each C–T interval was estimated using the following equation:
where E = effectiveness of paired-pulse stimulation,NTspl = lower of the two single-pulse number thresholds, NTc-t = paired-pulse number threshold, and NTsph = higher of the two single-pulse number thresholds. In the equation above, an E-value of 1 results when the paired-pulse number threshold is half the single-pulse number threshold, and suggests that C and T pulses contribute equally to the behavior. Conversely, an E-value of zero results when the paired-pulse number threshold is the same as the single-pulse number threshold, and suggests that T pulses do not contribute to the behavior.
At each site, the AP condition was always tested first. If after two to four replications the curve relating E-values to C–T interval (collision curve) did not show a clear differentiation in E-values between short and long C–T intervals, the electrode was lowered (0.16 or 0.32 mm), and the new site was tested the following day. In cases where a differentiation in E-values was evident, additional AP–PA collision curves were obtained until four to six replications of each were completed. Two collision curves were obtained daily, counterbalancing whenever possible between AP and PA conditions. When sufficient replications had been obtained, the electrode was lowered to the next site. At each new PM site, the current intensity was adjusted to obtain a number threshold of ∼13 pulses; once this was achieved, the current intensity was kept constant for all subsequent collision tests carried out at that site. Occasionally, current intensities used for stimulation of the VTA were also readjusted before the start of the collision tests at a new site.
Data analysis. Data were analyzed with a two-way ANOVA for repeated measures. Missing data were estimated using Yates’ formula (Kirk, 1968), and degrees of freedom were adjusted accordingly.
Refractory period test. In some cases, at the end of the collision tests refractory periods were estimated from at least one of the two stimulation sites. As with the collision tests, estimation of refractory periods consisted of number threshold determinations for single- and paired-pulse conditions, but with both pulses delivered via the same electrode. To reduce the contribution of local potential summation and to obtain a better estimate of the earliest recovery from refractoriness (initial 25%), we used C-pulses that were 1.2–1.4 times greater in amplitude than T-pulses (Yeomans, 1979; Bielajew et al., 1982; Rompré and Miliaressis, 1987). Relative T-pulse effectiveness was calculated with the formula used for the collision test.
Each test session began with one warm-up single-pulse number threshold determination for each of the two pulse intensities. During the remainder of the test, three additional single-pulse number threshold determinations were obtained at each current intensity; these were interspersed among paired-pulse threshold determinations. Interpulse intervals ranged from 0.2 to 17.0 msec, and the order in which they were tested was first determined randomly and then counterbalanced from day to day. The refractory period test was replicated four times. The data from a session were discarded if the range of single-pulse number thresholds for either current intensity exceeded 0.15 log10 units.
Histology. At the end of the study, animals were anesthetized with sodium pentobarbital, and the tissue surrounding each electrode tip was marked by passing a direct anodal current of 100 μA for 15 sec. Animals were then perfused intracardially with saline (0.9%), followed by a formalin solution containing potassium ferrocyanide (3%), potassium ferricyanide (3%), and trichloroacetic acid (0.5%). The bone surrounding the bottom half of the brain was then removed, and the brain was lowered from the skull; this procedure minimized the degree of damage to tissue surrounding the electrode and allowed direct measurement of the distance between electrode tips. Brains were then kept in 10% formalin. Before sectioning, brains were immersed for consecutive 24 hr periods in each of three sucrose-formalin solutions (10%, 20%, and 30%). Brains were then sliced in 40 μm sections and subsequently stained with a formalin-thionin solution. Reconstruction of the dorsoventral locations of sites tested with the moveable electrode was made by first locating the lesion and then inferring the position of each site using a record of the distances by which the electrode had been lowered.
RESULTS
Location of SS sites
The location of each tested site is shown in Figures1-6, along with the results of the respective collision tests. In five subjects, the tip of the anterior electrode was located within the VTA (4.8–5.3 mm posterior to bregma), and in subject F18, the tip of the anterior electrode was located in the posterior part of the LH (4.52 mm posterior to bregma). In four subjects, the PM electrode was located on the midline, and in two others it penetrated the brain at a mediolateral angle. A total of 61 PM sites were tested, and of these, 49 supported SS. Collision tests were carried out at 46 VTA-PM site combinations.
Fig. 1.

Collision data from subject F17. Each graph shows changes in E-values as a function of C–T interval and represents data obtained from a single site. Graphs show AP curves (open squares, dashed lines), PA curves (filled squares, solid lines), or their average (filled triangles, solid lines). Theasterisk or cross next to the site number indicates symmetry or asymmetry between AP and PA curves, respectively. Data points represent the mean ± SEM. The two numbers in the upper left corner of each graph indicate the current intensities (in μA) used for the anterior and posterior electrodes, respectively. The VTA (left) and PM (right) electrode tip locations were reconstructed onto tracings of the Paxinos and Watson (1986) atlas of the rat brain. Numbers above each tracingindicate distance (mm) from bregma. Filled squares indicate sites that did not support SS, and filled circles show the locations of sites that did support SS. scp, Superior cerebellar peduncle; ml, medial lemniscus; MP, medial posterior mammillary nucleus; CG, central gray;DR, dorsal raphe; VTg, ventral tegmental nucleus.
Collision tests
In cases where AP–PA collision curves were not significantly different (symmetrical curves, p > 0.01), only the averaged curves (filled triangles) are shown. At sites where AP–PA curves were statistically different (asymmetrical curves, p < 0.01), both AP (open squares) and PA (filled squares) curves are shown. The presence of a collision-like effect was inferred from a significant effect of C–T interval (p < 0.01). Sites at which symmetrical or asymmetrical collision-like effects were observed are indicated by anasterisk or a cross, respectively, next to the site number. All other graphs show only AP curves, or AP–PA curves that were replicated an unequal number of times.
Figure 1 shows data obtained from subject F17. Symmetrical collision-like effects were observed at sites 1–5 and 7. At these sites, most of the recovery from collision block occurred between 2 and 8 msec, and the magnitude of the collision-like effects, estimated from the percentage difference between low and high E-values, ranged from 22% (site 2) to 38% (site 5). Collision curves obtained from site 6 were asymmetrical and thus were not averaged. Most of the recovery at site 6 occurred from 4 to 16 msec.
Figure 2 shows collision curves obtained from subject F8. A symmetrical collision-like effect was observed only at site 13. At this site, E-values increased gradually. In addition, curves obtained from sites 8 and 12 were also characterized by an increase in E-values, but there was no effect of C–T interval at site 8 (p = 0.62), and an unequal number of replications at site 12 precluded statistical analysis.
Fig. 2.

Collision data from subject F8. See Figure 1 for details. CG, Central gray; scp, superior cerebellar peduncle; MP, medial posterior mammillary nucleus; VTg, ventral tegmental nucleus.
Figure 3 shows collision curves obtained from subject F11. Symmetrical collision-like effects were observed at sites 1, 3, and 4. Recovery from collision block at site 1 is slow (4–15 msec) and is characterized by a double increase in E-values. Collision curves obtained from sites 3 and 4 are characterized by a single rise over C–T intervals of 3–6 and 2–8 msec, respectively. In this subject, the magnitude of the collision-like effects ranged from 17% (site 3) to 35% (site 4).
Fig. 3.

Collision data from subject F11. See Figure 1 for details. VTA, Ventral tegmental area; DR, dorsal raphe; xscp, decussation of the superior cerebellar peduncle.
Figure 4 shows collision curves obtained from subject F9. Symmetrical collision-like effects were obtained at sites 7 and 8, and at these sites, collision curves were characterized by two rises, with an initial increase in E-values at 6 msec at both sites and a second increase at 17 and 24 msec, respectively. The magnitude of the collision-like effect was 41% at site 7 and 37% at site 8. Lowering the electrode from site 8 to site 9 resulted in asymmetrical AP–PA collision curves. At site 9, recovery is gradual and is delayed by 3 msec in the PA curve; this asymmetry is also present at site 10.
Fig. 4.
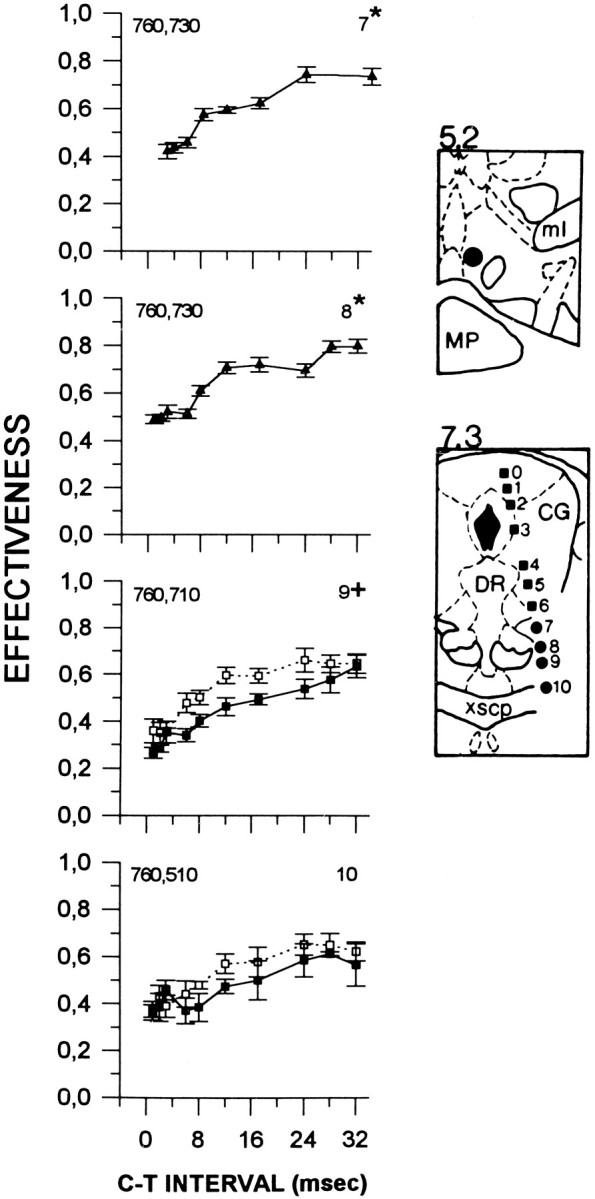
Collision data from subject F9. Locations of the anterior and posterior stimulation sites are illustrated in thetop and bottom panels, respectively. See Figure 1for details. ml, Medial lemniscus; MP, medial posterior mammillary nucleus; CG, central gray;DR, dorsal raphe; xscp, decussation of the superior cerebellar peduncle.
Figure 5 shows the results of collision tests carried out in subject F18. Symmetrical collision-like effects were observed at sites 0–2, 4, and 7–8. Collision curves obtained from sites 0, 1, 4, and 7 revealed two rising segments. Recovery occurred predominantly between 2 and 16 msec at sites 0–2, between 4 and 16 msec at site 4, and between 1 and 8 msec at sites 7 and 8. Although only AP curves were obtained from sites 3, 5, and 6, it is noteworthy that E-values increase over a similar range of C–T intervals. In this subject, the magnitude of the collision-like effects ranged from 24% (site 4) to 42% (site 0).
Fig. 5.

Collision data from subject F18. See Figure 1 for details. LH, Lateral hypothalamus; xscp, decussation of the superior cerebellar peduncle.
Figure 6 shows collision curves obtained from subject F12. Symmetrical collision-like effects were observed at sites 3, 4, 7, and 10. Unlike the curves obtained in the five other subjects, the shape of the collision curves in F12 differed substantially across sites. Recovery from collision block at site 3 occurred between 5 and 21 msec and was characterized by two rises, whereas at site 4, recovery was faster and occurred between 4 and 8.5 msec. Collision curves obtained from sites 7 and 10 were not characterized by a sharp rise but rather displayed a gradual increase. The largest collision-like effect was observed at site 3 (39%), and the smallest was observed at site 4 (21%).
Fig. 6.

Collision data from subject F12. Locations of the anterior and posterior stimulation sites are illustrated in thetop and bottom panels, respectively. See Figure 1for details. scp, Superior cerebellar peduncle;VTA, ventral tegmental area; MP, medial posterior mammillary nucleus; CG, central gray.
Refractory periods and conduction-time estimates
Twelve refractory-period estimates were obtained from a total of 10 sites at which collision-like effects were observed; estimates were obtained from either the anterior, the posterior, or both sites. To obtain estimates of the conduction time between the two stimulation sites, the C–T interval at which 25% recovery from refractoriness occurred was determined and subtracted from the C–T interval at which 25% recovery from collision block occurred. Results for each pair of sites are presented in Table 1. As can be seen, estimates of recovery from refractoriness varied by only 0.3 msec, from 0.7 to 1.0 msec. In contrast, estimates of recovery from collision block varied widely and ranged from 1.5 to 7.3 msec; such variability contributed to the wide range of conduction times (0.7–6.3 msec).
Table 1.
Estimates of conduction times
| Subject | Site | Collision interval (msec) | Refractory period (msec) | Conduction time (msec) |
|---|---|---|---|---|
| F17 | 1 | 2.5 | 0.9 (A), 0.8 (P) | 1.6–1.7 |
| 3 | 4.4 | 0.9 (A) | 3.5 | |
| 4 | 2.0 | 0.9 (P) | 1.1 | |
| 5 | 2.6 | 0.9 (A) | 1.7 | |
| 6 (PA) | 5.0 | 0.9 (A) | 4.1 | |
| 7 | 2.7 | 0.9 (A) | 1.8 | |
| F11 | 4 | 2.9 | 0.7 (A), 0.7 (P) | 2.2 |
| F9 | 7 | 7.2 | 1.0 (A) | 6.2 |
| 8 | 7.3 | 1.0 (A) | 6.3 | |
| 9 (AP) | 4.9 | 0.7 (P) | 4.2 | |
| 9 (PA) | 5.2 | 1.0 (A) | 4.2 | |
| F18 | 0 | 4.0 | 0.7 (A) | 3.3 |
| 1 | 3.6 | 0.7 (A) | 2.9 | |
| 2 | 4.0 | 0.7 (A) | 3.3 | |
| 4 | 6.2 | 0.8 (A) | 5.4 | |
| 7 | 1.5 | 0.8 (A) | 0.7 | |
| 8 | 1.8 | 0.8 (A), 0.9 (P) | 0.9–1.0 | |
| F12 | 10 | 6.9 | 0.9 (A) | 6.0 |
Conduction time estimates for sites at which collision-like effects were observed and at which refractory periods were measured. Conduction time estimates were obtained by subtracting the C–T interval corresponding to 25% recovery from refractoriness from the C–T interval corresponding to 25% recovery from collision block. For asymmetrical collision curves, the curve used (AP or PA) in the calculations is indicated in parentheses. For refractory periods, letters in parentheses (A or P) refer to the stimulation site (anterior or posterior) at which the refractory period was measured.
DISCUSSION
Symmetrical collision curves
Evidence of direct axonal linkage between two sites is inferred from collision curves that display (1) relatively lower E-values at short C–T intervals and (2) symmetry between AP and PA curves. The first characteristic reflects the loss of behaviorally relevant action potentials attributable to collision. The second characteristic is a consequence of the bidirectional nature of axonal conduction. In the present study, we observed symmetrical AP–PA curves at 22 different combinations of VTA-PM sites, and of these, 50% were characterized by a single increase in E-values (F17, sites 1–5 and 7; F11, sites 3 and 4; F18, sites 2 and 8; F12, site 4). At these sites, most of the recovery from collision block occurred between 2 and 8 msec. The presence of a single increase in E-values and the wide range of recovery times suggests the contribution of a physiologically heterogeneous population of neurons. Interestingly, the majority of curves characterized by a single rise in E-values was obtained generally from concurrent stimulation of the VTA and the most caudal PM sites tested.
In another 36% of symmetrical collision curves, recovery from collision block was characterized by two increases in E-values (F11, site 1; F9, sites 7 and 8; F18, sites 0, 1, 4, and 7; F12, site 3). In these, the initial recovery from collision occurred at C–T intervals that fall within the range of recovery times of those curves characterized by a single rise. In three animals (F9, F11, and F12), however, the second phase of recovery clearly occurred at much longer C–T intervals (i.e., 11–28 msec). The presence of a double rise suggests the contribution of at least two neuronal populations with either different conduction velocities, different refractory periods, or multiple axonal branches. In addition, in those cases in which recovery resumed at very long C–T intervals, the contribution of a supernormal period may have been relevant (Yeomans, 1979; Rompréand Miliaressis, 1987). In subjects F9 and F11, refractory period curves were obtained from the VTA site only (data not shown), but neither shows the contribution of a supernormal period. For subject F12, however, a supernormal period was evident at a C–T interval of 8 msec in the refractory period curve obtained from the VTA, and in this case, it might have contributed to the second phase of recovery in the collision curve. The majority of the curves characterized by a double rise were obtained from stimulation of the posterior LH or the VTA, and the most anterior PM sites.
The remaining 14% of symmetrical collision curves were not characterized by a sharp rise in E-values (F8, site 13; F12, sites 7 and 10). At these sites, E-values rise progressively and may reflect the contribution of a heterogeneous population of axons.
Asymmetrical collision curves
Symmetry between AP–PA curves depends on the relatively constant conduction time between the two stimulation sites and the similarity in refractory periods of the two axonal segments. Differences in refractory periods are expected to result in different ortho- and antidromic conduction times and will be reflected in AP–PA curves that recover over different C–T intervals. Likewise, the presence of one or more synapses between the two stimulation electrodes is expected to result in an asymmetrical delay in recovery, attributable to the unidirectional nature of synaptic transmission. In the present study, asymmetrical AP–PA curves were observed in only two subjects (F17, site 6; F9, site 9). The absence of refractory period estimates from these sites precludes assessment of the contribution of differences in this variable to the asymmetry.
The presence of a synapse between the two stimulation electrodes will limit the occurrence of collision to some site along the postsynaptic neuron. Assuming recruitment of a mixed population of uninterrupted and synaptically linked neurons, recovery from collision block will be delayed when the C-pulse is delivered via the electrode located upstream from the synapse. This delay results from the added time required for transmission across the synapse (see Yeomans and Buckenham, 1992). Inspection of curves obtained at site 9 of subject F9 reveals that recovery in the PA condition is delayed by ∼3 msec and suggests transmission of the reward signal in a caudorostral direction. The presence of a synapse also may be inferred from a reduction in E-values some time after an initial recovery has occurred in those axons directly linking the two sites. Again, the reduction in E-values will be expected to occur only when the C-pulse is delivered via the upstream electrode. Curves obtained from site 12 of subject F8 are consistent with such a model and are similar to transynaptic collision curves obtained in a previous study (Yeomans and Buckenham, 1992). The initial recovery in both curves at short C–T intervals and the subsequent reduction in E-values in the AP condition (12–32 msec) suggest that in addition to axons directly linking the two sites, the stimulation also may have recruited descending neurons that terminated in between.
Topography of the substrate
The present results reveal several important characteristics about the anatomical distribution of those reward-relevant axons responsible for the collision-like effects. First, these findings show that at least part of the substrate travels between the VTA and midline regions of the PM. The data obtained from subject F18 further suggest that the extent of this pathway may be greater and may extend to the LH. Indeed, the overlap in the range of collision intervals observed here and in a previous study (Murray and Shizgal, 1994) suggests the existence of a common axonal bundle traveling between anterior forebrain sites and the PM.
Second, the magnitude of the collision-like effects was generally small, ranging from 20 to 40%. This suggests that a significant proportion of axons stimulated by the anterior electrode did not pass through the stimulation field of the posterior electrode or vice versa. Accordingly, E-values at short C–T intervals were always >0. If the axons responsible for the collision-like effects are localized near the midline in the PM but distributed between both hemispheres in rostral mesencephalic regions, a subgroup of reward-relevant neurons stimulated by the medially implanted PM electrode will not be stimulated by the unilateral VTA electrode. The simplest model would predict a maximal collision-like effect of 50%, an estimate close to that obtained in the present study. In accordance with this model, collision-like effects were obtained between the PM and both left (F17, F9) and right (F8, F11, F12) VTA sites.
Third, the total percentage collision across all tested sites in three subjects (F17, F18, and F12) exceeds 100%, suggesting that some reward-relevant axons contributed to collision-like effects at more than one site. Indeed, the small distances by which the posterior electrode was lowered would in fact predict overlapping of the stimulation fields. In addition, the distance over which collision-like effects were observed suggests that reward-relevant axons are widely dispersed in PM regions and provides a possible explanation for the failure of previous studies to reveal an axonal link using fixed stimulation electrodes (Bielajew et al., 1981; Kofman and Yeomans, 1988). For example, comparison of the results obtained from F17 and F8 reveals that although these subjects had anterior and posterior electrodes located within the same coronal planes, their respective profiles differ. In effect, a greater number of collision-like effects were obtained when the posterior electrode was located just off the midline (compare F17 and F8). In addition, the high stimulation intensities used in subject F17 suggest that the reward-relevant axons responsible for the collision-like effects in F17 are located away from the midline or that these are small-caliber axons.
Last, it is interesting to note that with the exception of subject F9, stimulation intensities for the anterior electrode gradually increased as the posterior electrode was lowered through successive sites. Such an increase in the required intensity is consistent with a reduction in rewarding efficacy subsequent to destruction of some reward-relevant neurons, an observation that indirectly supports the collision-like effects observed here.
Refractory periods and conduction time estimates
Recovery from refractoriness began after 0.4–0.7 msec and was complete by 2–4 msec, times that are comparable to previous estimates (Bielajew et al., 1981; Rompré and Miliaressis, 1987). Estimates of conduction time between the two electrodes, based on 25% recovery from refractoriness and collision block, ranged from 0.7 to 6.3 msec (Table 1). The large variability in conduction times resulted mainly from the wide range of collision intervals (1.5–7.3 msec). Interestingly, straight-line interelectrode distances (1.0–3.8 mm) varied little, and similar to refractory periods, fail to account for the large variability in collision intervals. In fact, the negative correlation (r = −0.56) between interelectrode distance and conduction time suggests that the straight-line distance between the two electrode tips may not describe accurately the trajectory of those axons responsible for the present collision-like effects. One possible explanation for this lack of correspondence is the presence of axonal branching between the two stimulation fields. Stimulation of two different axon collaterals, depending on the relative distance of each electrode tip from the branch point separating the two stimulation sites, can result in collision intervals that are greater than would be predicted from knowledge of the refractory period and interelectrode distance. The presence of axonal branches would also lead to an underestimation of the axonal conduction velocity.
The present findings provide the first behavioral evidence that the PM and VTA are directly linked by reward-relevant axons. In addition, these findings place anatomical and physiological constraints on those mesencephalic neurons that can be considered as possible carriers of the reward signal. In effect, the trajectory of candidate neurons should extend at least between the medial PM and the VTA, their distribution should be diffuse in caudal regions and bilateral at the level of the VTA, and they should have refractory periods as short as 0.4–0.7 msec.
Footnotes
This work was supported by a grant from the Natural Sciences and Engineering Research Council of Canada (NSERC, 0119057) to P.-P. Rompré. S.M. Boye was supported by a National Sciences and Engineering Research Council of Canada studentship, and P.-P. Rompré is an FRSQ (Québec) chercheur-boursier. We thank Dr. R. Anderson for helpful comments on the manuscript.
Correspondence should be addressed to P.-P. Rompré, Centre de Recherche, Hôpital du Sacré-Coeur, 5400 Boulevard Gouin ouest, Montréal, Québec, Canada H4J 1C5.
REFERENCES
- 1.Bielajew C, Shizgal P. Behaviorally derived measures of conduction velocity in the substrate for rewarding medial forebrain bundle stimulation. Brain Res. 1982;237:107–119. doi: 10.1016/0006-8993(82)90560-1. [DOI] [PubMed] [Google Scholar]
- 2.Bielajew C, Shizgal P. Evidence implicating descending fibers in self-stimulation of the medial forebrain bundle. J Neurosci. 1986;6:919–929. doi: 10.1523/JNEUROSCI.06-04-00919.1986. [DOI] [PMC free article] [PubMed] [Google Scholar]
- 3.Bielajew C, Jordan C, Ferme-Enright J, Shizgal P. Refractory periods and anatomical linkage of the substrate for lateral hypothalamic and periaqueductal gray self-stimulation. Physiol Behav. 1981;27:95–104. doi: 10.1016/0031-9384(81)90305-x. [DOI] [PubMed] [Google Scholar]
- 4.Bielajew C, Lapointe M, Kiss I, Shizgal P. Absolute and relative refractory periods of the substrates for lateral hypothalamic and ventral midbrain self-stimulation. Physiol Behav. 1982;28:125–132. doi: 10.1016/0031-9384(82)90113-5. [DOI] [PubMed] [Google Scholar]
- 5.Durivage A, Miliaressis E. Anatomical dissociation of the substrates of medial forebrain bundle self-stimulation and exploration. Behav Neurosci. 1987;101:57–61. doi: 10.1037//0735-7044.101.1.57. [DOI] [PubMed] [Google Scholar]
- 6.Gallistel CR, Shizgal P, Yeomans JS. A portrait of the substrate for self-stimulation. Psychol Rev. 1981;88:228–273. [PubMed] [Google Scholar]
- 7.Gratton A, Wise RA. Comparisons of connectivity and conduction velocities for medial forebrain bundle fibers subserving stimulation-induced feeding and brain stimulation reward. Brain Res. 1988;438:264–270. doi: 10.1016/0006-8993(88)91345-5. [DOI] [PubMed] [Google Scholar]
- 8.Kirk RE (1968) Experimental design: procedures for the behavioral sciences. Betriont, CA: Wadsworth.
- 9.Kofman O, Yeomans JS. Cholinergic antagonists in ventral tegmentum elevate thresholds for lateral hypothalamic and brainstem self-stimulation. Pharmacol Biochem Behav. 1988;31:547–559. doi: 10.1016/0091-3057(88)90229-8. [DOI] [PubMed] [Google Scholar]
- 10.Miliaressis E, Philippe L. A dual moveable stimulating electrode and its application to the behavioral version of the collision test. Brain Res Bull. 1983;10:573–577. doi: 10.1016/0361-9230(83)90157-0. [DOI] [PubMed] [Google Scholar]
- 11.Mundl WJ. A constant-current stimulator. Physiol Behav. 1980;24:991–993. doi: 10.1016/0031-9384(80)90162-6. [DOI] [PubMed] [Google Scholar]
- 12.Murray B, Shizgal P. Evidence implicating both slow- and fast-conducting fibers in the rewarding effect of medial forebrain bundle stimulation. Behav Brain Res. 1994;63:47–60. doi: 10.1016/0166-4328(94)90050-7. [DOI] [PubMed] [Google Scholar]
- 13.Paxinos G, Watson C. Academic; New York: 1986. The rat brain in stereotaxic coordinates, 2nd ed. . [Google Scholar]
- 14.Rompré PP, Boye S. Localization of reward-relevant neurons in the pontine tegmentum: a moveable electrode mapping study. Brain Res. 1989;496:295–302. doi: 10.1016/0006-8993(89)91076-7. [DOI] [PubMed] [Google Scholar]
- 15.Rompré PP, Miliaressis E. Pontine and mesencephalic substrates of self-stimulation. Brain Res. 1985;359:246–259. doi: 10.1016/0006-8993(85)91435-0. [DOI] [PubMed] [Google Scholar]
- 16.Rompré PP, Miliaressis E (1987) Behavioral determination of refractory periods of the brainstem substrates of self-stimulation. Behav Brain Res 23: 205–219. [DOI] [PubMed]
- 17.Shizgal P, Bielajew C, Corbett D, Skelton R, Yeomans J. Behavioral methods for inferring anatomical linkage between rewarding brain stimulation sites. J Comp Physiol Psychol. 1980;94:227–237. doi: 10.1037/h0077668. [DOI] [PubMed] [Google Scholar]
- 18.Yeomans JS. The absolute refractory periods of self-stimulation neurons. Physiol Behav. 1979;22:911–919. doi: 10.1016/0031-9384(79)90336-6. [DOI] [PubMed] [Google Scholar]
- 19.Yeomans JS, Buckenham KE (1992) Electrically evoked turning: asymmetric and symmetric collision between anteromedial cortex and striatum. Brain Res 570:279–292. [DOI] [PubMed]