Abstract
To study relations between the basolateral (BL) amygdaloid complex and major electroencephalogram (EEG) rhythms of the entorhinal cortex (delta and theta), neurons of the lateral and BL nuclei were recorded in conscious cats. An essential task to this end was to obtain criteria allowing the identification of projection cells and interneurons. BL projection cells, identified by their antidromic response to parahippocampal stimuli, generated stereotyped high-frequency bursts (2–4 spikes at 140–250 Hz), which repeated at low rates. Projection cells of the lateral nucleus were virtually silent, but their presence was disclosed by cortical-evoked responses. In both nuclei, the firing rates and/or responsiveness of projection cells increased from waking to slow-wave sleep (S). In contrast with projection cells, presumed interneurons discharged at high rates (∼10–15 Hz) and displayed various discharge patterns ranging from tonic to phasic. The bipartite classification of BL neurons on the basis of their discharge patterns and synaptic responses was supported by the differential relation existing between EEG rhythms and the activity of the two cell types. Indeed, fast-firing and bursting cells of the BL nucleus tended to fire on opposite phases of the delta oscillation of S and entorhinal theta oscillation of paradoxical sleep. The unusual state-related changes in activity displayed by lateral and BL neurons point to functional similarities between the amygdala and hippocampus. This idea is supported by the presence of coherent theta oscillations in the amygdalo-hippocampal circuit that might favor the emergence of recurring time windows when synaptic interactions will be facilitated in this limbic network.
Keywords: amygdala, entorhinal cortex, perirhinal cortex, hippocampus, sleep, delta, theta
Criteria permitting the identification of different neuronal types on the basis of their extracellularly recorded firing patterns are essential tools to study neural networks in behaving animals. In the hippocampal formation, the possibility of distinguishing interneurons from pyramidal cells (Fox and Ranck, 1975,1981) has facilitated the analysis of cellular interactions contributing to the genesis of state-dependent events such as theta and sharp waves (for review, see Buzsáki et al., 1994). Unfortunately, progress in understanding the basolateral (BL) amygdaloid complex (lateral, BL, and basomedial nuclei) has proceeded at a slower rate partly because we lack such criteria.
In the amygdala, the task of correlating the firing pattern and neuronal identity is complicated by the fact that the different cell types are not segregated in laminae, as in the hippocampal formation, but are intermingled in random patterns. Golgi observations indicate that the BL complex contains two main cell types (Hall, 1972;Tömböl and Szafranska-Kosmal, 1972; Kamal and Tömböl, 1975) (for review, see McDonald, 1992). The most common type is a spiny multipolar neuron that often has a dominant dendrite giving it a pyramidal appearance. These cells are excitatory projection neurons because they have long axons that emit numerous collaterals and use an excitatory amino acid as transmitter (Christie et al., 1987; Fuller et al., 1987; Paré and Smith, 1994; Smith and Paré, 1994). The second cell type consists of a morphologically heterogeneous group of sparsely spiny neurons that have a locally ramifying axon, are immunopositive for GABA (McDonald, 1985;McDonald and Augustine, 1993; Paré and Smith, 1993), and thus constitute a class of inhibitory interneurons.
Recently, the physiological and morphological properties of BL amygdaloid neurons were correlated in intracellular studies performedin vitro (Washburn and Moises, 1992a; Rainnie et al., 1993) and in vivo (Paré et al., 1995b). In the latter study, two types of spiny projection neurons were identified by antidromic invasion from their projection fields. The first type of projection neuron predominated in the BL nucleus and generated stereotyped spike bursts upon depolarization. The second type of projection cell predominated in the lateral nucleus and generated slow membrane potential oscillations when steadily depolarized. However, their resting membrane potential was so negative that they rarely fired spontaneously. In contrast, aspiny neurons, presumed to be GABAergic local-circuit cells, were tonically active at rest and generated high-frequency, nonaccommodating spike trains in response to depolarizing current pulses.
This investigation was undertaken to corroborate these physiological criteria in conscious cats studied during the sleep–waking cycle. This knowledge was then used to study relations between the activity of BL amygdaloid neurons and major electroencephalogram (EEG) events of related cortical fields, namely delta and theta (Mitchell and Ranck, 1980; Alonso and Garcia-Austt, 1987), in an attempt to determine whether the anatomical ties existing between the amygdala and the hippocampal formation (Krettek and Price, 1977b) are expressed in their spontaneous activity. To these ends, isolated neurons were recorded extracellularly in the lateral and BL amygdaloid nuclei, and their activity was studied using first- and second-order statistical analyses. The relation between BL activity and EEG events of the parahippocampal cortices was studied using spike-triggered averaging (STA) and peri-event histograms (PEHs).
MATERIALS AND METHODS
Electrode implantation. Experiments were performed in five adult cats of either sex (2.5–3.5 kg) that were chronically implanted in a stereotaxic position under deep barbiturate anesthesia. The anesthesia was induced with ketamine (15 mg/kg, i.m.), and atropine sulfate (0.05 mg/kg, i.m.) was administered to prevent secretions. Then, sodium pentobarbital was injected gradually (Somnotol, ∼15 mg/kg, i.v.). Two silver-ball electrodes were fixed into the supraorbital cavity with dental cement to record eye movements (EOG). To monitor electromyographic (EMG) activity, two Teflon-insulated wires were inserted in the neck muscles. The EEG was recorded with stainless steel screws anchored to the bone overlying the pericruciate area. For more details, see Paré et al. (1995a).
To record the entorhinal (ENT) and perirhinal (PRH) EEG, three coaxial electrodes (distance between tip and ring, 1.0 mm) were lowered bilaterally into the ventrolateral or ventromedial ENT areas and adjacent sectors of the PRH cortex. Because the dorsoventral position of the ENT cortex varied among cats, the electrodes were lowered gradually until they touched the temporal bone and then retracted until the polarity of the EEG potentials recorded with their tip and ring was reversed (Paré et al., 1995a). The position of the electrodes in the PRH cortex was corrected as a function of the difference between the stereotaxically predicted position (Berman and Jones, 1982) and the actual position of the ENT electrodes.
The bone overlying the amygdaloid complex was removed bilaterally, and the exposed dura mater was covered with a polystyrene cylinder. Finally, four screws were cemented to the calvarium. These screws were later used to fix the cat’s head in a stereotaxic position without pain or pressure. Bicillin (i.m. daily for 3 d) and buprenorphine (0.03 mg/kg, i.m. every 12 hr for 24 hr) were administered postoperatively. Recording sessions began 6–8 d after the surgery. In between experimental sessions, the animals slept, ate, and drank ad libitum.
Recording and stimulating methods. During the recording sessions, the EEG, EOG, and EMG signals were used to distinguish behavioral states of vigilance on the basis of previously described electrographic criteria (Steriade and Hobson, 1976). Briefly, the waking (W) state was characterized by a desynchronized EEG, voluntary eye movements, and the presence of muscle tone, whereas in slow-wave sleep (S), the EEG became synchronized. The state of paradoxical sleep (PS) was characterized by a desynchronized EEG, muscular atonia, and clusters of rapid eye movements. Coaxial electrodes in the PRH and ENT cortices were used to study the ortho- and antidromic responsiveness of amygdala neurons (0.05–0.15 msec pulses of 0.1–1 mA). Cells that could be antidromically activated from one or more of these sites were formally identified as projection neurons. The criteria used for antidromic identification were fixed-response latency, collision with spontaneously or orthodromically evoked action potentials, and ability to follow high-frequency stimulation.
Unit discharges and related field potentials were recorded with tungsten microelectrodes (impedance 2–6 MΩ at 1 kHz) that were moved in 2–3 μm steps by a piezoelectric micromanipulator. These various signals (0.1 Hz to 10 kHz) were observed on a digital oscilloscope, printed on a chart recorder, digitized, and stored on tape.
Identification of the recording sites. Before retracting the microelectrodes, the location of their tip and/or their trajectory were routinely marked by two or more small electrolytic lesions (0.5 mA for 5 sec). To avoid confusion between different electrode tracks, no more than six tracks per hemisphere were performed in the amygdaloid complex, and the distance between the lesions marking each track was varied systematically. In addition, the position of the underlying temporal bone was noted. At the end of the experiments, the brains were perfused with 500 ml of a cold saline solution (0.9%) followed by 1 l of a fixative containing 2% paraformaldehyde and 1% glutaraldehyde in 0.1 m PBS, pH 7.4. The brains were then stored for 24 hr in a 30% glucose solution, sectioned on a freezing microtome (at 80 μm), and stained with thionin to verify the position of recording electrodes. The microelectrode tracks were reconstructed by combining micrometer readings with the histological controls.
Analysis. Analyses were performed off-line with the software IGOR (WaveMetrics) and homemade software running on Macintosh microcomputers. All cells were subjected to the same analyses: interspike interval histograms (ISIHs) with bins of 1–20 msec were computed during stable epochs (2–3 min) of quiet W, S, and/or PS. In addition, we performed PEHs and STA of concurrent EEG events bipolarly recorded from the ENT and PRH cortices. We verified whether the valleys and peaks of the PEHs were the result of a random process by computing PEHs after randomly changing the sequence of interspike intervals, a process called shuffling. Subtraction between deep and superficial EEG signals was made so that the resulting bipolar potentials had the same polarity as those recorded in deep cortical layers. State-dependent changes in antidromic and synaptic responsiveness were assessed from poststimulus histograms. Values of latencies and firing rates are expressed as mean ± SE.
RESULTS
Database and neuronal identification
A total of 831 cells were recorded in these experiments. Histological controls (Fig. 1A,B) revealed that 416 of these cells were located in the BL complex (Table1), 285 in other amygdala nuclei, and 130 in surrounding structures. Of the latter group, 23 cells were recorded in various hippocampal fields. In agreement with previous findings indicating that the BL complex projects to the parahippocampal cortices but the central nucleus does not (Krettek and Price, 1977a,b), 30% of tested cells in the BL complex (n = 121) could be antidromically invaded from the parahippocampal cortices and none could be antidromically invaded in the central nucleus (X2test, p < 0.001; Table 1, Fig. 1C).
Fig. 1.
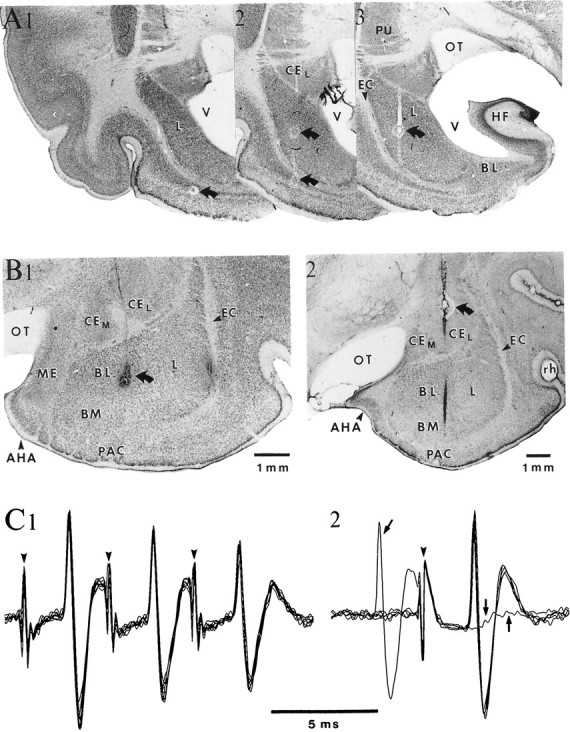
Histological localization and antidromic identification of neurons in the BL amygdaloid complex. A, Microelectrode track through the lateral nucleus on three consecutive frontal sections displayed from caudal (1) to rostral (3). B, Histological control of two microelectrode tracks (1–2) through the BL nucleus. InA and B, curved arrows point to electrolytic lesions performed to facilitate histological reconstruction of electrode tracks. C, ENT stimulation (arrowheads) elicits antidromic spikes in a neuron located in the caudal part of the BM nucleus. Note constant latency of antidromic responses, ability to follow high-frequency stimulation (C1), and collision with a spontaneous action potential (arrows in C2). AHA, Amygdalohippocampal area; HF, hippocampal formation;ME, medial amygdaloid nucleus; OT, optic tract;PAC, periamygdaloid cortex; PU, putamen;V, ventricle.
Table 1.
Distribution of recorded cells in the basolateral complex and central nuclei and their response to stimulation of the parahippocampal cortices
| Recording site | Basolateral complex | Central nucleus | |||||
|---|---|---|---|---|---|---|---|
| Lateral | BL | BM | Total | CEM | CEL | Total | |
| No. recorded cells | 124 | 212 | 80 | 416 | 46 | 70 | 116 |
| Antidromically invaded (%) | 42 | 15 | 13 | 30 | 0 | 0 | 0 |
| Latency (msec) | 12.3 ± 0.6 | 12.1 ± 1.6 | 2.3 | 12.6 ± 0.7 | – | – | – |
| Orthodromic spiking (%) | 32 | 43 | 38 | 36 | 64 | 40 | 45 |
| Latency (msec) | 15.1 ± 1.3 | 14.3 ± 1.0 | 11.2 ± 1.1 | 14.4 ± 0.7 | 12.3 ± 2.4 | 13.3 ± 1.3 | 12.9 ± 1.1 |
| Unresponsive units (%) | 26 | 43 | 50 | 34 | 36 | 60 | 55 |
| No. tested cells | 66 | 47 | 8 | 121 | 11 | 40 | 51 |
Subsets of 67 and 55 neurons of the BL and lateral nuclei, respectively, were selected for further analyses because they had a signal-to-noise ratio ≥6, they were recorded in at least two different behavioral states, and their action potentials were devoid of notches or other signs of injury.
Neurons of the BL nucleus
Bursting cells
Forty-two percent of BL neurons (n = 67) generated stereotyped, high-frequency spike bursts (2–4 spikes at 140–250 Hz; Fig. 2, insets) intermixed with single spikes. With one exception, all BL neurons that were physiologically identified as projection cells (n = 7) were bursting neurons (Table 1). When spike bursts comprised three or more action potentials, the duration of successive intraburst interspike intervals progressively increased as spike amplitudes gradually declined (Fig.2B, inset).
Fig. 2.
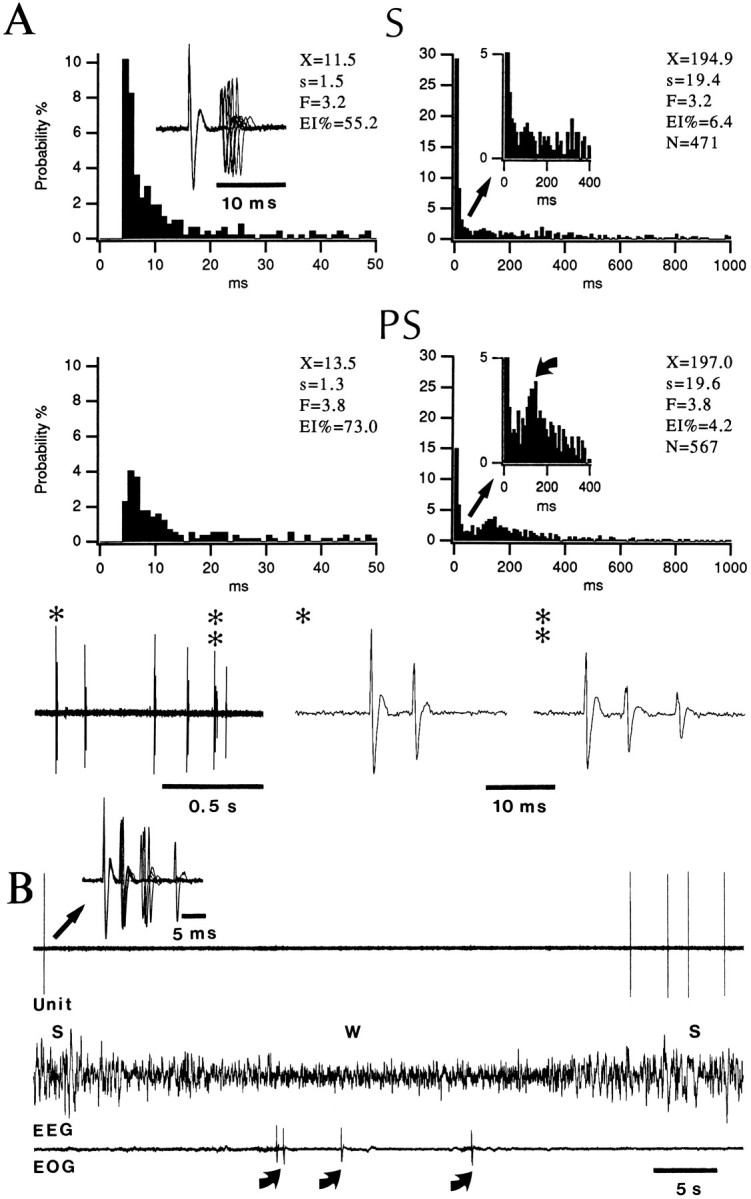
Bursting neuron of the BL nucleus. A, ISIHs of a BL neuron in S and PS. Bins of 1 msec (left) and 10 msec (right). X, Mean interval; s, standard deviation; F, firing rate in Hz; EI%, percentage of intervals outside the depicted range; N, number of intervals. The inset (upper left) shows superimposed spike doublets in S using the first spike as a temporal reference. Curved arrow in A points to late mode in ISIH of PS. Examples of isolated doublets (*) and bursts (**) in PS are displayed below the histograms. B, Silencing of BL bursting cell during a transient period of W and bursting discharge pattern in S. Curved arrows point to eye movements generated in the W. Inset shows superimposed spike bursts.
This discharge pattern translated into ISIHs characterized by a sharp mode at 4 msec (Fig. 2A; range 4–7 msec) with intervals shorter than 10 msec accounting for 29 ± 9% of intervals in S (mean ± SE). Also, ISIHs usually contained a high proportion of long intervals, which reflected the poor spontaneous activity of bursting cells in all states (mean rates <1 Hz; Table 2). The only consistent state-related change in firing rates occurred between the states of S and W (paired t test, p < 0.05) with the majority of bursting cells becoming virtually silent in W (Fig. 2B).
Table 2.
Discharge rates (spikes/sec) of BL and lateral amygdaloid neurons during the sleep–waking cycle
| BL nucleus | Lateral nucleus | ||||
|---|---|---|---|---|---|
| Bursting | Fast-firing | Silent | Tonic | ||
| Tonic | Phasic | ||||
| W | 0.5 ± 0.47 | 13.3 ± 6.1 | 15.1 ± 6.2 | <0.02 | 10.1 ± 4.1 |
| S | 0.92 ± 0.34 | 15 ± 6.4 | 18 ± 6.6 | <0.02 | 10.4 ± 4.3 |
| PS | 0.96 ± 0.86 | 13.7 ± 6.7 | 15.8 ± 6.9 | <0.02 | 12.2 ± 4.5 |
In most neurons, the bursting discharge pattern persisted in PS, but in 27% of cells (n = 28), spike bursts became less frequent and more single spikes were generated. In Figure 2A, for instance, close to 30% of interspike intervals lasted ≤10 msec in S compared with 15% in PS. This decreased proportion of short intervals in PS was often accompanied by the appearance of a late mode at 170–200 msec (Fig. 2A, curved arrow) because of the rhythmic occurrence of single spikes and spike bursts at 5–6 Hz (see Fig. 11). The neuron shown in Figure 2Awas the bursting cell with the highest firing rate of spikes and spike bursts recorded in this study (3.2 and 3.8 Hz in S and PS, respectively).
Fig. 11.
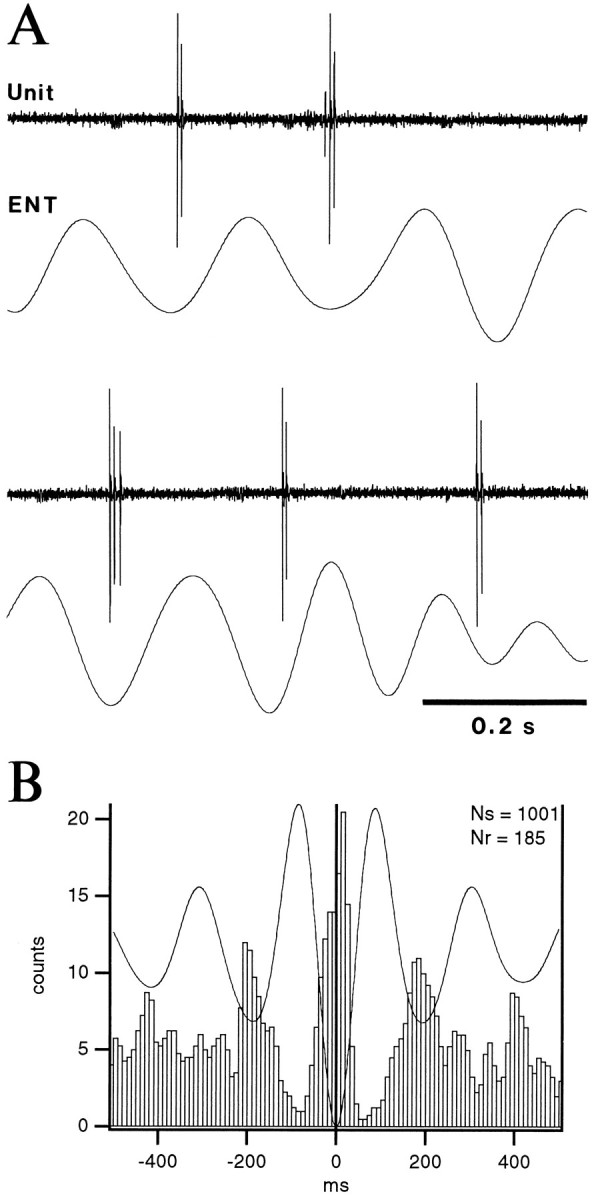
Bursting neurons of the BL nucleus fire during the depth-negative phase of ENT theta during PS. A, Samples of theta-related activity in a BL bursting cell. B, Superimposed STA and PEH using the negative peak of depth ENT EEG as zero-time. Same cell as in A. Bins of 10 msec. PEH was smoothed with a moving average of three bins.
Fast-firing neurons
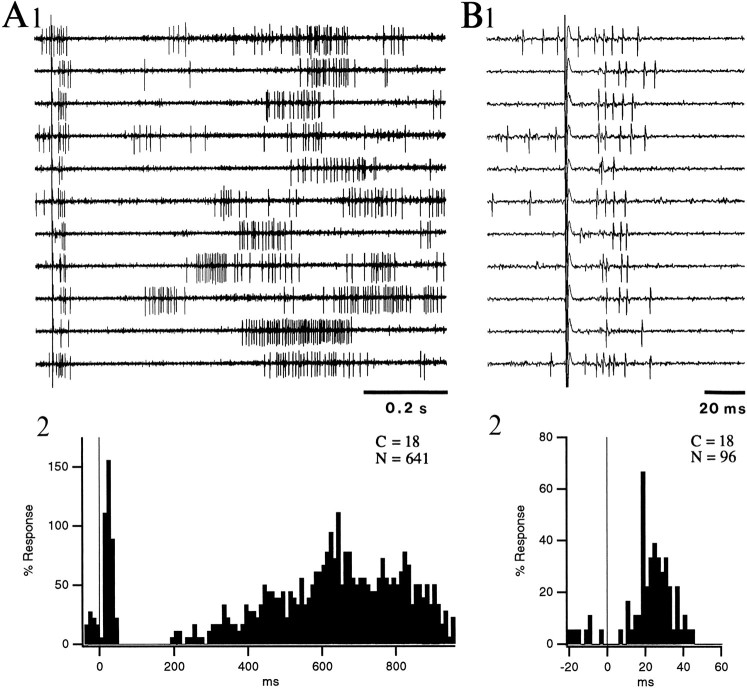
In contrast with bursting cells, 30% of BL neurons (n = 67) discharged at high rates throughout the sleep–waking cycle but displayed a variety of discharge patterns (Figs. 3, 4). None of the fast-firing cells could be backfired from the parahippocampal cortices, but all generated multiple orthodromic spikes in response to parahippocampal stimuli (12 tested cells). This contrasted with the single orthodromic spikes generated by bursting neurons in response to parahippocampal stimuli (n = 8).
Fig. 3.
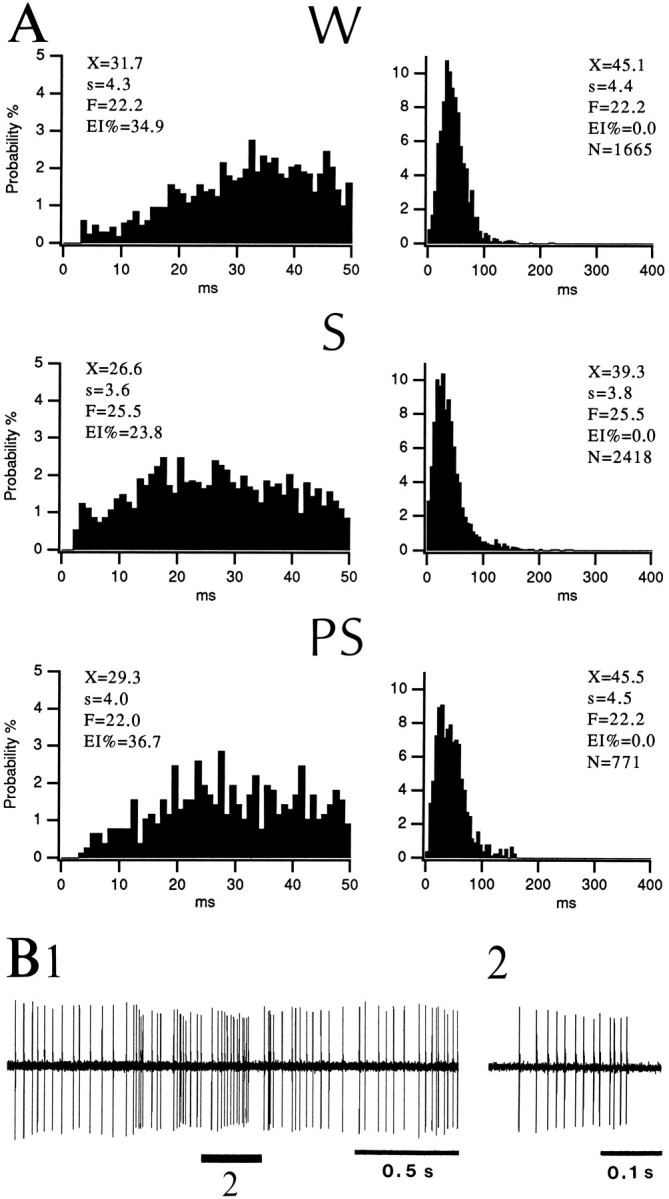
Tonically active neuron of the BL nucleus during the sleep–waking cycle. A, ISIHs of neuronal discharges inW, S, and PS with bins of 1 msec (left) and 5 msec (right). Abbreviations as in Figure 2. B, Sample of the activity generated by a tonic neuron in S. Same neuron as in A. The spike train marked by the number 2 in B1 is expanded inB2.
Fig. 4.
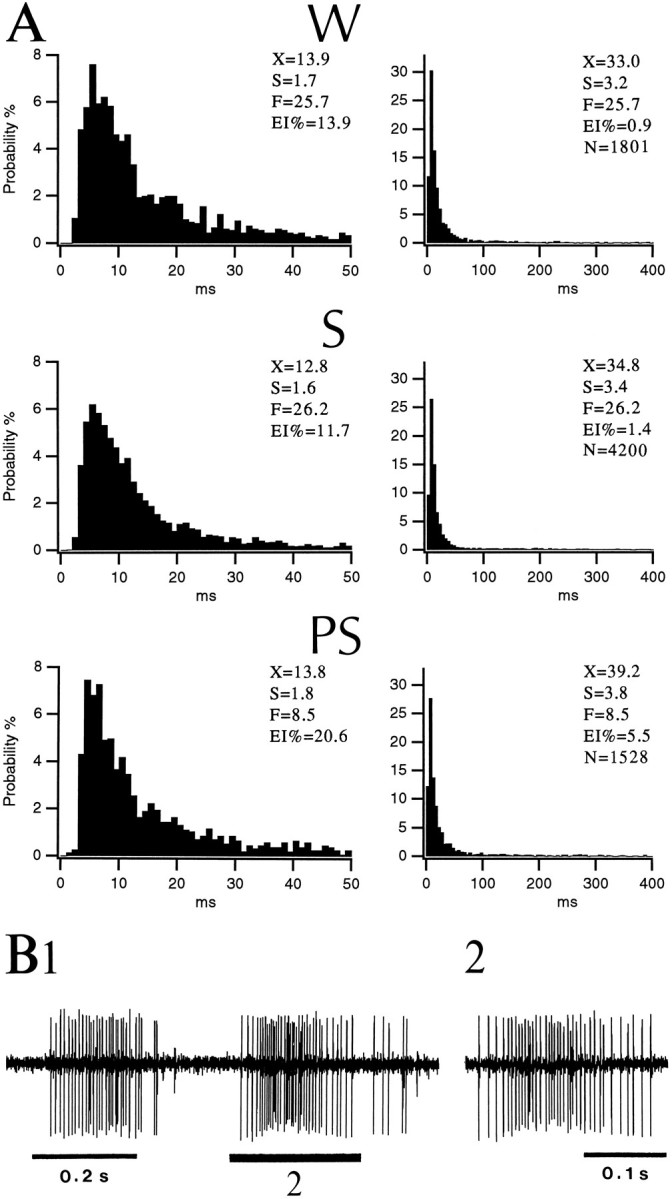
Fast-firing neuron of the BL nucleus generating high-frequency spike trains on a silent background. A, ISIHs of neuronal discharges in W, S, and PSwith bins of 1 msec (left) and 5 msec (right). Note presence of intervals longer than 400 msec (EI%) in all states (5.5% of intervals in PS compared with 0.9 and 1.4% in W and S, respectively). Abbreviations as in Figure 2. B, High-frequency spike trains occurring on a silent background in S. Same neuron as in A. The spike train marked by the number2 in B1 is expanded in B2.
Tonic cells. Fifty-five percent of fast-firing neurons (11 of 20 cells) maintained a tonic discharge pattern in all states. As in bursting cells, the firing rate of tonic neurons was significantly higher in S than in W (paired t test, p < 0.05), but variable changes were seen in PS (Table 2). The peak discharge rates of tonic neurons (integrated over 0.1 sec) ranged between 50 and 110 Hz in W and PS but reached 90–160 Hz in S. In all states, this firing pattern translated into a broad distribution of interspike intervals with modes ranging between 15 and 65 msec and with few intervals longer than 400 msec.
Figure 3 illustrates a representative tonically firing neuron. Note that the distributions of interspike intervals in W, S, and PS (Fig.3A) are similar, indicating a relatively state-independent firing pattern. The difference accounting for the higher firing rate of this cell in S (25.5 Hz compared with 22.2 Hz in W and PS) was a larger proportion of intervals shorter than 20 msec, a manifestation of S episodes with higher instantaneous firing rates (Fig. 3B).
Phasic neurons. Thirty percent of fast-firing neurons (6 of 20 cells) generated long-duration (up to 300 msec), high-frequency (100–300 Hz) spike trains separated by silent periods of various durations (0.1–3 sec; Fig. 4B). This phasic discharge pattern translated into a sharp distribution of interspike intervals with modes ranging between 5 and 8 msec and a significant proportion of long intervals (range 0.7–11%; Fig. 4). State-dependent differences in discharge rates varied from cell to cell and did not reach significance (Table 2). As in tonic cells, the highest instantaneous firing rates (integrated over 0.1 sec) were observed in S (range 160–380 Hz).
Figure 4 illustrates a phasic neuron with discharge rates of 25.7, 26.2, and 8.5 Hz in W, S, and PS, respectively. Note that in spite of these fluctuations in firing rate, the distribution of interspike intervals (Fig. 4A) remained relatively constant with the exception of intervals longer than 400 msec, which were more frequent in PS.
The other fast-firing cells displayed intermediate discharge patterns consisting of high-frequency accelerations but occurring on a tonic background. Their ISIHs had a mode in the 5–15 msec range and a distribution of interspike intervals highly skewed to the right.
In most fast-firing neurons (8 of 12 tested cells), orthodromic responses to parahippocampal stimuli consisted of three phases (Fig.5): (1) an early orthodromic activation (latencies ranged between 7 and 20 msec) that comprised 1–7 spikes followed by (2) a 100–300 msec period of decreased discharge probability and (3) a 200–400 msec period of increased firing probability. The robustness of these three phases increased in parallel as the stimulation intensity was augmented. In the other cells, parahippocampal stimuli evoked short-latency orthodromic spiking followed by little or no inhibitory period.
Fig. 5.
Orthodromic response of a phasic neuron of the BL nucleus to ENT stimuli. Orthodromic responses are shown with slow (A1) and fast (B1) time bases. Corresponding poststimulus histograms with bins of 10 msec (A2) and 2 msec (B2). C, Counts (number of shocks); N, number of spikes.
The remaining BL neurons (19 cells, or 28% of sample) had a poor and erratic spontaneous activity (0–2.1 Hz) that translated into indistinct ISIHs. State-related changes in firing rates were variable in these cells and did not reach significance (W, 0.94 ± 0.51; S, 0.97 ± 0.61; PS, 0.89 ± 0.72). One of these neurons was backfired from the ENT cortex.
State-dependent changes in synaptic excitability
The synaptic responsiveness of fast-firing (n = 6) and bursting (n = 4) cells was studied during the sleep–waking cycle. The intensity of parahippocampal stimuli was adjusted so that they elicited orthodromic spikes in ∼50% of trials in S. Compared with S, both types of cells (8 of 10) displayed a reduced synaptic responsiveness in W (mean reduction 26%; Walsh test;p < 0.05; n = 10). Inconsistent changes in responsiveness were seen in PS.
Neurons of the lateral nucleus
Silent cells
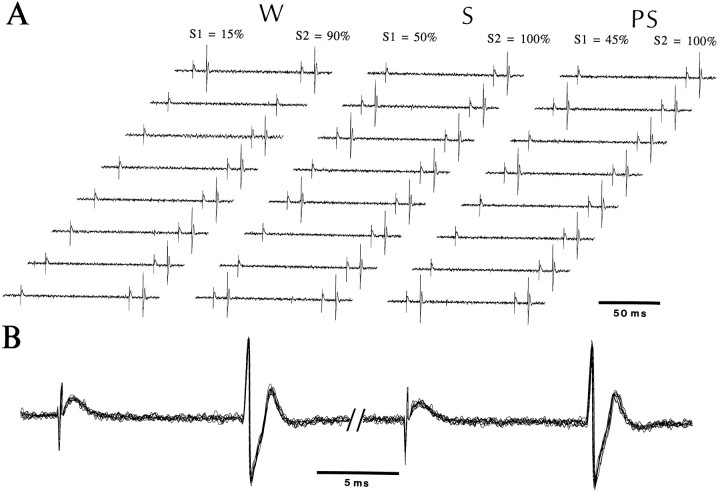
Fifty-five percent of cells (n = 55) had little or no spontaneous activity (≤0.1 Hz), but their presence was revealed by their orthodromic (17%) or antidromic (83%) responses to parahippocampal stimuli applied every 3–4 sec during the microelectrode descent. Silent cells accounted for 89% of physiologically identified projection neurons (n = 28) because only three antidromically activated cells discharged at rates >0.1 Hz (0.15, 0.4, and 1.9 Hz).
Although state-dependent differences in discharge rates were negligible among silent cells (Table 2), their antidromic responsiveness to parahippocampal stimuli was significantly lower in W than in S (in 5 of 6 tested neurons; Walsh test; p < 0.05; Fig.6). Average antidromic response probabilities were 19% in W, 80% in S, and 61% in PS (n = 6). Changes in responsiveness were variable in PS and did not reach significance. Also, when a double-shock paradigm was used (n = 6; intershock interval 90 msec), antidromic response probabilities were higher in response to the second (92 ± 7%) than to the first (53 ± 20%) shock, regardless of the behavioral state.
Fig. 6.
State-dependent fluctuations in antidromic responsiveness of a silent neuron of the lateral nucleus to PRH stimuli. Double-shock paradigm (interstimulus interval, 90 msec). InA, 20 pairs of PRH stimuli were applied in each state, but only 10 of the 20 shocks are displayed. Numbers at thetop of the figure indicate the proportion of shocks eliciting antidromic spikes for the first (S1) and second (S2) stimuli. In response to the first shock (left response), this silent projection cell generated 3, 10, and 9 antidromic responses in W, S, and PScompared with 18, 20, and 20 responses to the second shock (right response). B is a superimposition of antidromic responses in S with a faster time base, demonstrating the constant latency of antidromic spikes.
Fast-firing neurons
In the lateral nucleus, most spontaneously active cells (52%, or 13 cells) had discharge patterns similar to those of fast-firing BL neurons except that their firing rates were generally lower (Table 2). These cells discharged tonically in all states and had peak firing rates (integrated over 0.1 sec) that did not exceed 150 Hz. Their ISIHs were characterized by a broad mode around 25 msec (range of 16–40 msec) with varying degrees of skewness to the right. State-dependent differences in firing rates were variable and did not reach significance. Only two fast-firing neurons had a phasic discharge pattern.
As with the corresponding class of BL neurons, none of the fast-firing cells could be backfired from the parahippocampal cortices, but all generated multiple orthodromic spikes at latencies ranging between 8 and 18 msec in response to PRH and/or ENT stimuli (n = 7). This orthodromic activation was followed by a long period of silence (120–350 msec) in four of seven cells. The synaptic responsiveness of fast-firing neurons increased from W to S (mean increase 31%), but inconsistent changes were seen in PS (n = 4).
The remaining cells (n = 12) fired at low rates (<3 Hz) throughout the sleep–waking cycle and displayed an erratic discharge pattern, which translated into indistinct interspike interval distributions. State-related changes in firing rates were variable and did not reach significance. Three of these cells were backfired from the parahippocampal cortices.
Relations between unit activity in the BL complex and spontaneous EEG events of the ENT and PRH cortices
Synchronized EEG events of S: delta and ENT SPs
At the transition between W and S, the low amplitude, fast waves of the PRH and ENT EEGs were gradually replaced by a slow EEG oscillation in the delta range (1–4 Hz; Fig.7B), which increased in amplitude and regularity as S deepened. During well established S epochs, the ENT EEG was also characterized by large-amplitude (0.3–1.5 mV), depth-negative potentials, henceforth termed sharp potentials (SPs; Fig.9A) (Paré et al., 1995a). ENT SPs often appeared on the descending phase of depth-positive delta waves and occurred in small groups at 1–3 Hz (Fig. 9A).
Fig. 7.
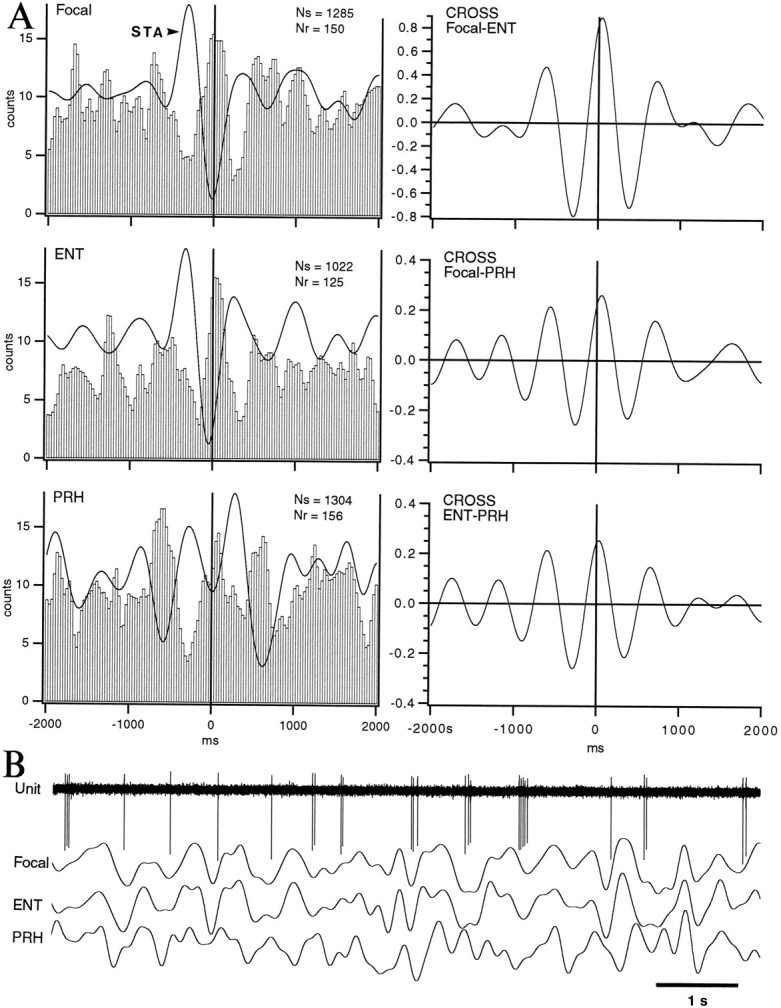
Rhythmic modulation of neuronal discharge in the delta frequency range during S. Lateral amygdaloid projection neuron that was backfired from the PRH cortex and had an average firing rate of 2.2 Hz in S. A, Left, Superimposed STA and PEH of neuronal discharges using the negative peak of digitally filtered (0.1–4 Hz) focal waves (top), ENT EEG (middle), or PRH EEG (bottom) as the zero-time. Bins of 30 msec. PEHs were smoothed with a moving average of three bins. See Paré et al. (1995) for methodological details. Ns, Number of spikes;Nr, number of references. Right, Cross-correlograms (CROSS) between focal waves and ENT EEG (top), between focal waves and PRH EEG (middle), and between ENT and PRH EEG (bottom). B, Epoch of spontaneous activity during S. Same cells as in A.
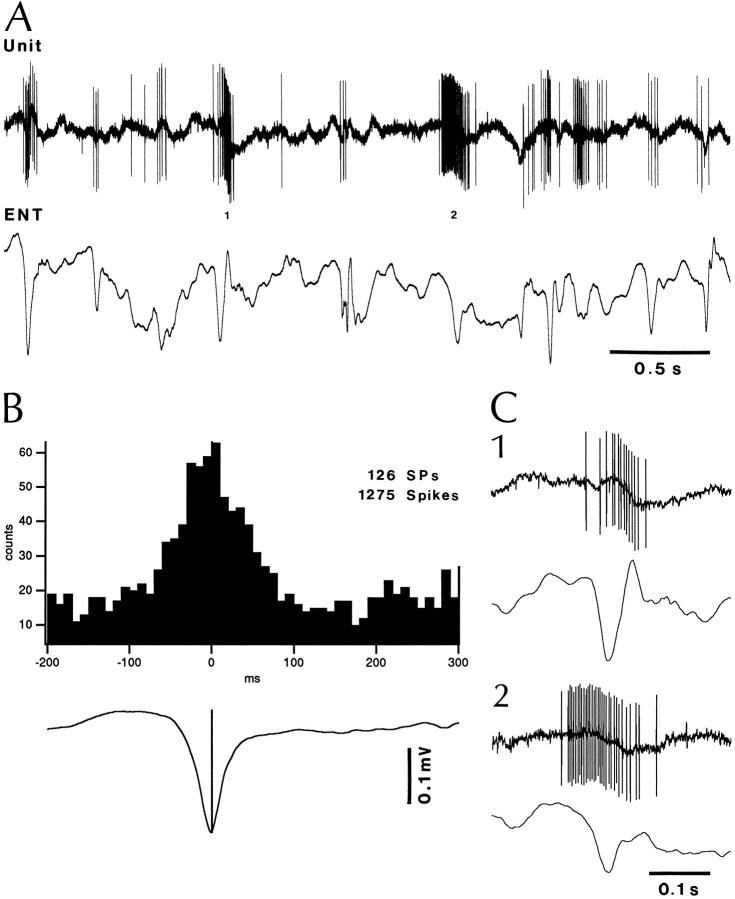
Fig. 9.
Activation of a phasic neuron of the BL nucleus in relation to ENT SPs. A, Simultaneously recorded phasic BL neuron and bipolar ENT EEG. The neuronal events marked by 1 and 2 in A are shown with a faster time base inC1 and C2, respectively. B, Peri-SP histogram of neuronal discharges for the same cell using the negative peaks of ENT SPs as zero-time. Bins of 10 msec.
To study the temporal relations between these EEG events and the activity of lateral and BL neurons, we performed STA and PEHs of neuronal discharges using the negative peak of delta waves or ENT SPs as a temporal reference. When studying the relation to delta waves, we chose epochs devoid of SPs.
Neurons of the lateral nucleus. Regardless of their firing pattern, a majority of spontaneously active lateral amygdaloid neurons (11 of 14) fired preferentially in relation to the negative phase of focal, ENT, and PRH delta waves (Fig. 7). Conversely, their firing probability decreased in relation to the positive phase of delta waves. Focal waves were recorded by the microelectrodes used to record unit activity in the lateral nucleus and represent the summed activity of a neuronal pool located in the vicinity of the microelectrode. Figure 7illustrates this point in one of the rare spontaneously active cells that was physiologically identified as a projection neuron. In this cell, PEHs show a central peak coinciding with a negative delta wave in the STAs of focal, ENT, and PRH signals. Furthermore, the firing probability during the central peak was several times higher than that associated with the flanking troughs in PEHs (range 1.4–13.5; mean 3.7). This was not a random phenomenon because the valleys and peaks of PEHs were leveled after shuffling of interspike intervals (not shown).
Relations between neuronal events in the lateral nucleus and EEG delta waves were also documented by performing cross-correlations (Bendat and Piersol, 1980) between focal waves and parahippocampal EEGs (Fig.7A, right). A high correlation was found between focal waves and ENT delta waves (0.8 in Fig. 7A; range 0.6–0.8; n = 3). In contrast, cross-correlations between focal or ENT waves with PRH delta resulted in a much lower correlation (Fig. 7A; range 0.2–0.3; n = 3). The dominant frequency observed in cross-correlograms and STAs ranged between 1 and 2 Hz.
The delta-related modulation of firing probability displayed by lateral amygdaloid neurons was not enhanced when we considered S epochs comprising ENT SPs. Consistent with this, PEHs of neuronal discharges using the negative peak of ENT SPs as temporal references were characterized by a wide peak (∼300 msec centered at +50 to 250 msec) that reflected the preferential association of ENT SPs with the descending phase of depth-positive delta waves.
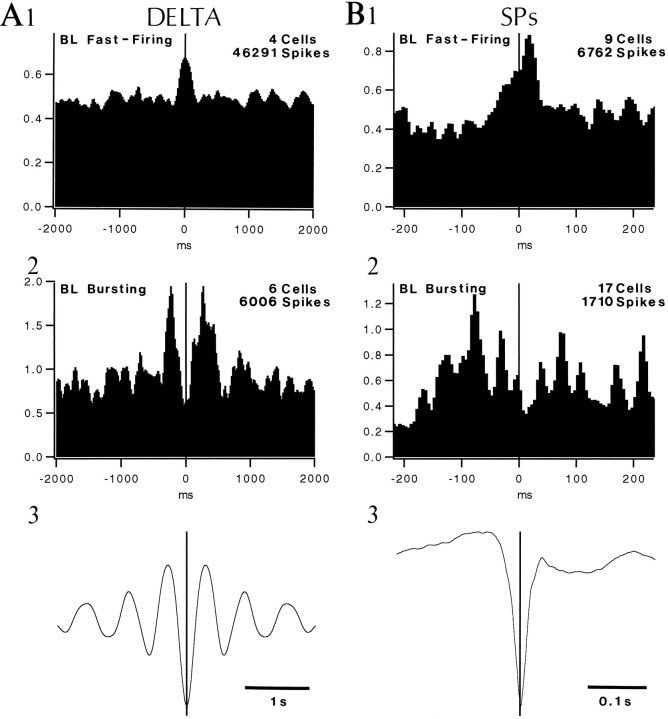
Neurons of the BL nucleus. In contrast to the lateral nucleus, where all types of neurons fired in phase with focal and depth-negative parahippocampal delta waves, fast-firing and bursting BL cells fired at opposite phases of the delta cycle. In 79% of fast-firing BL neurons recorded in S (n = 14), PEHs of neuronal discharges were characterized by a peak centered at the zero-time where their firing probability was 1.3–2.4 higher (mean of 1.7) than the average firing probability (Fig.8A1). Surprisingly, in 88% of delta-related bursting cells (n = 19), the peak of PEHs were offset by 100–320 msec on each side of the zero-time (mean of 236 msec; Fig.8A2). The delta-related modulation was stronger in bursting cells than in fast-firing neurons as the firing probability associated with the peaks was 2–7 higher than that observed at zero-time (mean of 4.2; Fig. 8A2).
Fig. 8.
Delta (A) and SP-related (B) modulation of neuronal activity in the BL nucleus. Grouped PEHs of fast-firing cells (1) and bursting neurons (2) using the depth-negative peak of digitally filtered ENT delta waves (A) and ENT SPs (B) as zero-time. Bins of 20 msec in A and 5 msec in B. Ordinate in 1 and 2 indicates percentage of spikes per bin. Average of ENT delta (A3) and ENT SPs (B3) obtained by computing an average of all delta waves and ENT SPs, giving an equal weight to all cells. Selection criteria for cells included in grouped PEHs: for delta, we considered only cells that were recorded for long (>90 sec) epochs of slow-wave sleep devoid of SPs for the grouped PEHs, whereas for SPs, only cells with a significant number of SPs (>20) were considered. In the grouped PEH displayed in A1, the flanking troughs that could be seen in individual PEHs were erased by variations in the delta frequency.
Peri-SP histograms of neuronal discharges revealed that the discharge probability of fast-firing BL neurons (64%; n = 14) was strongly modulated by ENT SPs. As shown in Figure 9, this phenomenon was clearest in phasic neurons because these cells generated high-frequency SP-related spike trains (up to 285 Hz in Fig.9C2) on a mostly silent background. The timing of these spike trains with respect to the peak of ENT SPs was variable (Fig.9C), but maximal increases in firing probability usually coincided with the peak of ENT SPs as seen in the peri-SP histograms of neuronal discharges (Fig. 9B).
The SP-related activity of BL bursting neurons proved difficult to study because of their low discharge rates. This contrasted with previous observations under barbiturate anesthesia (Paré et al., 1995a) in which most BL cells displayed clear SP-related increases in firing probability. Yet, grouped peri-SP histograms of bursting cells (Fig. 8B2) revealed that their firing probability increased ∼180 msec before the peak of ENT SPs, peaked at −80 msec, and returned to initial levels 10 msec after the reference time. A mirror image was seen in grouped peri-SP histograms of nine fast-firing neurons (Fig. 8B1). Indeed, the firing probability of fast-firing cells diminished 200 msec before the negative peak of ENT SPs and peaked 20 msec after the zero-time.
ENT theta oscillation of PS
During PS, the ENT EEG was characterized by a rhythmic slow theta oscillation in the 4–7 Hz range. To characterize this oscillation, we performed simultaneous recordings of hippocampal theta cells, of hippocampal theta (focal) waves, and of the ENT EEG. Autocorrelations of focal waves recorded at the border of strata oriens and pyramidale and of the ENT EEG revealed that the dominant component of this oscillation was at 5 Hz (range 4.8–5.3; n = 4). In agreement with previous findings (Mitchell and Ranck, 1980; Alonso and Garcia-Austt, 1987), cross-correlograms revealed that the hippocampal and ENT theta were correlated (coefficient 0.7) and nearly in-phase (time lag of 0–25 msec; n = 4 cases). Consistent with this, PEHs of neuronal discharges using the negative peak of hippocampal or ENT theta as temporal references revealed that hippocampal theta cells fired in phase with positive-going hippocampal and ENT theta waves. This was also confirmed by STA of ENT and focal hippocampal signals.
The theta-related modulation was less striking in amygdala neurons than in hippocampal theta cells. First, only 62% of fast-firing BL neurons (n = 13) displayed a rhythmic modulation of their firing probability at the theta frequency. Second, whereas the ratio between the firing probability associated with the highest peak and flanking troughs of PEHs ranged between 2.8 and 4.4 (average of 3.7) in hippocampal theta cells (n = 4), it ranged between 1.4 and 3.3 (average of 1.8) in fast-firing BL neurons.
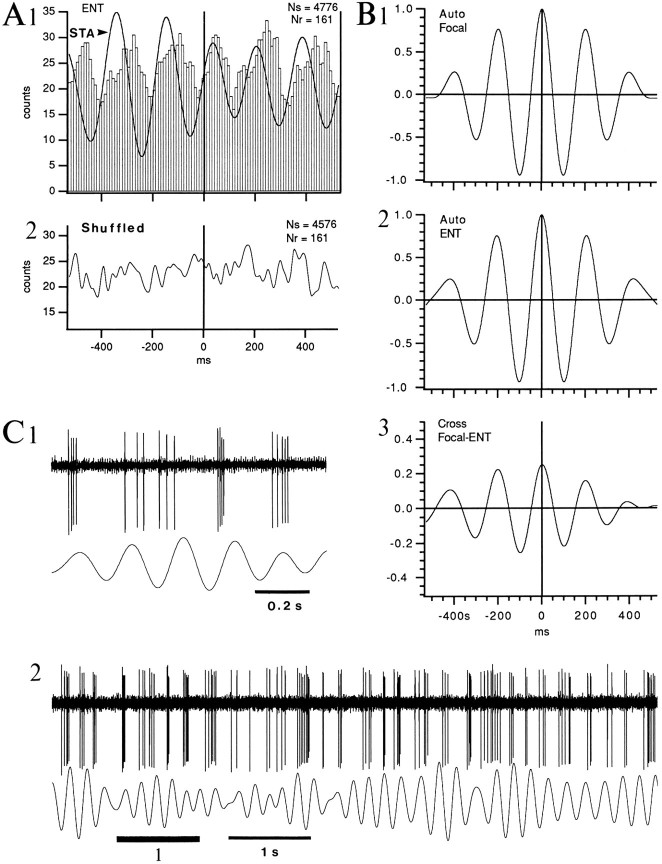
The theta-related activity of two fast-firing BL cells is illustrated in Figure 10. PEHs and STA of ENT theta (Fig.10A1) revealed that fast-firing neurons increased their firing probability during the ascending limb of positive-going theta waves. This was not a random phenomenon because the valleys and peaks of PEHs were leveled after shuffling of interspike intervals around temporal references (Fig. 10A2). As expected from the relatively weak theta-related modulation of BL unit activity in PS, a weaker correlation was found between ENT and focal theta waves (0.25; Fig. 10B3) than between hippocampal and ENT theta (0.7).
Fig. 10.
Theta-related modulation of unit activity in the BL nucleus during PS. A1, Superimposed STA and PEH of neuronal discharge using the negative peaks of ENT theta as zero-time. Bins of 10 msec. PEH was smoothed with a moving average of three bins.Ns, Number of spikes; Nr, number of references.A2, Envelope of PEH after shuffling the interspike intervals. B, Autocorrelogram (Auto) of Focal (1) and ENT (2) waves. B3, Cross-correlogram between focal and ENT waves. All waves digitally filtered between 4 and 8 Hz. C, Epoch of spontaneous activity during PS. The period marked by the number 1 inC2 is expanded in C1. Same cells as inA.
As with the ENT SPs of S, the relation between the activity of bursting cells and ENT theta was difficult to study because of their low discharge rates in PS. Nevertheless, 60% (n = 10) of the most active bursting cells fired preferentially during the depth-negative phase of the ENT theta oscillation (Fig.11). PEHs of their theta-related discharge were characterized by a central peak in which the firing probability was 4–49 times higher than that associated with the flanking troughs.
DISCUSSION
By correlating the spontaneous activity and responses of recorded neurons to central shocks, we determined that most physiologically identified projection neurons of the BL nucleus generate stereotyped, high-frequency spike bursts, whereas projection cells of the lateral nucleus remain virtually silent in resting conditions. Moreover, bursting and silent cells generated single spikes in response to parahippocampal stimuli. In contrast, presumed interneurons discharged at high rates and generated multiple orthodromic spikes in response to parahippocampal stimuli. This bipartite classification of BL neurons was supported by the phase-inverted modulation of firing probability observed in bursting and fast-firing neurons in relation to S delta waves and ENT theta.
Correspondence between discharge patterns and physiological properties
Most projection neurons of the BL nucleus generate stereotyped spike bursts
Previous in vitro (Washburn and Moises, 1992a; Rainnie et al., 1993) and in vivo (Paré et al., 1995b) intracellular studies have reported that the BL nucleus contains a class of spiny neurons that generate spike bursts upon depolarization and range in shape from pyramidal to star-like. In the in vivo study (Paré et al., 1995b), bursting cells were identified as projection neurons because they could be backfired from the basal forebrain or ENT cortex. The stereotyped spike bursts generated by these intracellularly recorded BL neurons are identical to those generated by the extracellularly recorded corticopetal cells of the present study. The bursting discharge pattern thus characterizes a high proportion of BL projection neurons. However, previous intracellular work indicates that some BL projection cells have a nonbursting discharge pattern (Washburn and Moises, 1992a; Rainnie et al., 1993; Paré et al., 1995b) and that some local-circuit cells generate spike bursts (Rainnie et al., 1993). Consequently, although the bursting discharge pattern is strongly indicative, antidromic invasion of BL neurons from their projection field must remain the decisive criterion for establishing the identity of BL projection neurons.
Fast-firing neurons of the BL and lateral nuclei may correspond to interneurons
It was reported that sparsely spiny to aspiny neurons of the BL complex (Washburn and Moises, 1992a; Rainnie et al., 1993;Paré et al., 1995b) have physiological properties similar to those of inhibitory interneurons located elsewhere in the brain (Schwartzkroin and Mathers, 1978; McCormick et al., 1985) and have morphological features reminiscent of the GABA-immunoreactive interneurons of the BL complex (McDonald, 1985; Carlsen, 1988). These neurons generated brief action potentials, responded to depolarizing current pulses with nonaccommodating spike trains, and had a relatively depolarized membrane potential allowing for high spontaneous discharge rates (Washburn and Moises, 1992a; Paré et al., 1995b). Moreover, in contrast to projection cells that generated single spikes in response to afferent volleys, one or more spikes were elicited in fast-firing cells depending on the stimulation intensity (Washburn and Moises, 1992a).
The extracellularly recorded fast-firing cells of the present study displayed a similar behavior and thus may correspond to local-circuit cells. Indeed, none of them could be backfired from the parahippocampal cortices and they generated multiple orthodromic spikes in response to parahippocampal stimuli. In addition, their high spontaneous firing rates contrasted with the poor activity of physiologically identified projection cells. Different types of fast-firing neurons were distinguished on the basis of their discharge patterns. Although this variability might reflect different patterns of activity in afferent neurons, it could be a consequence of physiological heterogeneity among local-circuit cells. In agreement with this, presumed interneurons of the BL amygdaloid complex exhibit considerable morphological and chemical variability (McDonald and Pearson, 1989) (for review, seeMcDonald, 1992).
Most corticopetal neurons of the lateral nucleus are silent in spontaneous conditions
The firing rates of lateral amygdaloid projection cells were so low that most would have remained undetected had they not been activated by parahippocampal stimuli. This finding implies that previous extracellular studies of lateral amygdaloid neurons were biased toward a class of spontaneously active neurons that probably represent local-circuit cells. A variety of nonexclusive mechanisms might account for the virtual silence of lateral amygdaloid projection cells. First, their membrane potential may be so hyperpolarized that they fire only when they receive strong depolarizing inputs. In support of this, these cells were found to have a higher resting potential (−74 mV) than BL bursting cells (−66 mV) in barbiturate-anesthetized cats (Paré et al., 1995b). However, barbiturates increase the mean open time of GABAA channels (Barker and McBurney, 1979), thus raising the possibility that differences in resting potential do not reflect distinct biophysical properties but do reflect dissimilar inhibitory networks in the lateral and BL nuclei.
Second, cortical and thalamic inputs to the lateral nucleus might not be spontaneously active or might be subjected to presynaptic inhibition (D. Paré and Y. Smith, unpublished electron microscopic observations). In agreement with this, only 17% of neurons responsive to parahippocampal stimuli were orthodromically activated, whereas 83% generated antidromic responses. Although it is unusual to find more antidromic than orthodromic responses in physiological experiments on reciprocally connected structures, this high proportion of antidromic invasions might reflect the fact that projection cells have highly collateralized axons (for review, see McDonald, 1992).
Third, the tonic activity of GABAergic local-circuit cells could prevent firing in projection cells. In support of this, the physiological properties of presumed local-circuit cells predispose them to tonic firing, and lesion studies have shown that they constitute the only source of GABA to the BL complex (Le Gal La Salle et al., 1978). Moreover, GABAergic boutons are concentrated strategically around the soma, proximal dendrites, and initial axonal segment of BL projection cells (Carlsen, 1988; Paré and Smith, 1993). Finally, it was shown that interneurons of the BL complex generate powerful inhibitory postsynaptic potentials through GABAA and GABAB receptors (Rainnie et al., 1991; Sugita et al., 1992; Washburn and Moises, 1992b).
If local-circuit cells exert a tonic inhibitory action on projection cells, events leading to a cessation of firing in presumed interneurons should lead to an increased responsiveness of projection cells through disinhibition. Thus, the long period of silence elicited by parahippocampal stimuli in a majority of fast-firing cells might explain why the antidromic responsiveness of projection cells was lower to the first than to the second parahippocampal stimuli in double-shock paradigms.
State-dependent changes in neuronal activities of the BL amygdaloid complex
In previous studies on the state-dependent activity of BL amygdaloid neurons, no attempt was made to identify the type of recorded neurons with central shocks. Nevertheless, it was reported that most cells have low discharge rates, and contradictory findings were obtained concerning state-dependent fluctuations (Jacobs and McGinty, 1971; Reich et al., 1983; Bordi et al., 1993). The present study goes one step further by showing that physiologically identified projection cells of the lateral and BL nuclei have low discharge rates. Although state-dependent differences in firing rates were negligible among projection cells of the lateral nucleus, their responsiveness to central shocks significantly increased from W to S. Signs of decreased neuronal excitability in W compared with S were also seen in the evoked and spontaneous activity of BL bursting cells.
This pattern of state-dependent fluctuations is at odds with that observed in most neuronal populations of the prosencephalon in which, compared with S, W is associated with an increased neuronal excitability (for review, see Steriade and Hobson, 1976). One exception to this rule is the hippocampal formation, where the excitability of pyramidal neurons is also higher in S than in W (Buzsáki et al., 1983). These considerations point to functional similarities between the hippocampal formation and the BL amygdala and suggest that they are subjected to different modulatory influences than the thalamocortical system.
Relation between unit activity and dominant EEG events of related cortical fields
Delta
As found previously in neocortical areas (Villablanca and Salinas-Zeballos, 1972; Steriade et al., 1993), the parahippocampal EEGs in S were characterized by coherent slow oscillations in the range of 1–4 Hz. STAs and PEHs revealed that a high proportion of lateral and BL neurons fired preferentially at a particular phase of the ENT and PRH delta. Whereas all types of neurons in the lateral nucleus displayed an increased probability of firing during the depth-negative component of PRH and ENT delta, bursting and fast-firing neurons of the BL nucleus displayed a phase-inverted relation to delta waves with the former firing preferentially during the depth-positive phase and the latter during the negative phase.
In the neocortex, depth-negative delta waves are correlated with an increased firing probability, whereas the positive phase is associated with neuronal silence (Ball et al., 1977; Buzsáki et al., 1988). Considering that cortical fibers contact both interneurons and projection cells of the BL nucleus (D. Paré and Y. Smith, unpublished observations), the inverse relation found between the activity of fast-firing and bursting neurons suggests that feedforward inhibition is strong enough to prevent cortical inputs from firing projection cells during the depth-negative phase. The firing of projection cells during the depth-positive delta waves raises the possibility that these spikes represent a rebound response mediated by the activation of a hyperpolarization-activated current during the depth-negative delta phase. This idea is supported by the presence in BL projection cells of a hyperpolarization-activated cation current (Womble and Moises, 1993), which is strong enough to generate rebound spikes at the termination of hyperpolarizing current pulses (Washburn and Moises, 1992a; Rainnie et al., 1993; Paré et al., 1995b).
Theta
During PS, we found that fast-firing cells fired preferentially during the depth-positive phase of ENT theta, whereas bursting cells discharged mainly during their negative phase. This situation is similar to that observed in field CA1 of the hippocampal formation, where presumed interneurons and projection cells fire preferentially during opposite phases of the local theta (Buzsáki et al., 1983). The inverted relation found between the activity of BL neurons in relation to ENT delta and theta suggests that these oscillations have a different origin. Moreover, the presence of theta-related activity in the BL nucleus constitutes further evidence of functional ties between the hippocampal formation and the amygdala. The rhythmic, theta-related modulation of neuronal activities in the amygdalohippocampal circuit may favor the emergence of recurring time windows when synaptic interaction will be facilitated in this limbic network.
Footnotes
This research was supported by Medical Research Council Grant MT-11562. We thank M. Steriade, E. Lang, and D. Contreras for helpful comments on an earlier version of this manuscript, as well as G. Oakson, P. Giguère, and D. Drolet for their assistance.
Correspondence should be addressed to Denis Paré, Département de Physiologie Faculté de Médecine, Université Laval, Québec (QUÉ), Canada G1K 7P4.
REFERENCES
- 1.Alonso A, García-Austt E. Neuronal sources of theta rhythm in the entorhinal cortex of the rat. Exp Brain Res. 1987;67:493–501. doi: 10.1007/BF00247282. [DOI] [PubMed] [Google Scholar]
- 2.Ball GJ, Gloor P, Schaul N. The cortical microphysiology of pathological delta waves in the electroencephalogram of cats. Electroencephalogr Clin Neurophysiol. 1977;43:346–361. doi: 10.1016/0013-4694(77)90258-9. [DOI] [PubMed] [Google Scholar]
- 3.Barker JL, McBurney RM. Phenobarbitone modulation of post-synaptic GABA receptor function on cultured mammalian neurones. Proc R Soc Series B. 1979;206:319–327. doi: 10.1098/rspb.1979.0108. [DOI] [PubMed] [Google Scholar]
- 4.Bendat JS, Piersol AG. Wiley; New York: 1980. Engineering applications of correlation and spectral analysis. . [Google Scholar]
- 5.Berman AL, Jones EG (1982) The thalamus and basal telencephalon of the cat. Madison: The University of Wisconsin.
- 6.Bordi F, LeDoux J, Clugnet MC, Pavlides C. Single-unit activity in the lateral nucleus of the amygdala and overlying areas of the striatum in freely behaving rats: rates, discharge patterns, and responses to acoustic stimuli. Behav Neurosci. 1993;107:757–769. doi: 10.1037/0735-7044.107.5.757. [DOI] [PubMed] [Google Scholar]
- 7.Buzsáki G, Leung LW, Vanderwolf CH. Cellular bases of hippocampal EEG in the behaving rat. Brain Res Rev. 1983;6:139–171. doi: 10.1016/0165-0173(83)90037-1. [DOI] [PubMed] [Google Scholar]
- 8.Buzsáki G, Bickford RG, Ponomareff G, Thal LJ, Mandel R, Gage FH. Nucleus basalis and thalamic control of neocortical activity in the freely moving rat. J Neurosci. 1988;8:4007–4026. doi: 10.1523/JNEUROSCI.08-11-04007.1988. [DOI] [PMC free article] [PubMed] [Google Scholar]
- 9.Buzsáki G, Bragin A, Chrobak JJ, Nádasdy Z, Sik A, Hsu M, Ylinen A. Oscillatory and intermittent synchrony in the hippocampus: relevance to memory trace formation. In: Buzsáki G, Llinás RR, Singer W, Berthoz A, Christen Y, editors. Temporal coding in the brain. Springer; Berlin: 1994. pp. 145–172. [Google Scholar]
- 10.Carlsen J. Immunocytochemical localization of glutamate decarboxylase in the rat basolateral amygdaloid nucleus, with special reference to GABAergic innervation of amygdalostriatal projection neurons. J Comp Neurol. 1988;273:513–526. doi: 10.1002/cne.902730407. [DOI] [PubMed] [Google Scholar]
- 11.Christie MJ, Summers RJ, Stephenson JA, Cook CJ, Beart PM. Excitatory amino acid projections to the nucleus accumbens septi in the rat: a retrograde transport study utilizingd[3H]aspartate and [3H]GABA. Neuroscience. 1987;22:425–439. doi: 10.1016/0306-4522(87)90345-9. [DOI] [PubMed] [Google Scholar]
- 12.Fox SE, Ranck JB. Localization and anatomical identification of theta and complex spike cells in dorsal hippocampal formation of rats. Exp Neurol. 1975;49:299–313. doi: 10.1016/0014-4886(75)90213-7. [DOI] [PubMed] [Google Scholar]
- 13.Fox SE, Ranck JB. Electrophysiological characteristics of hippocampal complex-spike cells and theta cells. Exp Brain Res. 1981;41:299–313. doi: 10.1007/BF00238898. [DOI] [PubMed] [Google Scholar]
- 14.Fuller TA, Russchen FT, Price JL. Sources of presumptive glutamatergic/aspartergic afferents to the rat ventral striatopallidal region. J Comp Neurol. 1987;258:317–338. doi: 10.1002/cne.902580302. [DOI] [PubMed] [Google Scholar]
- 15.Hall E. The amygdala of the cat: a Golgi study. Z Zellforsch Mikrosk Anat. 1972;134:439–458. doi: 10.1007/BF00307668. [DOI] [PubMed] [Google Scholar]
- 16.Jacobs BL, McGinty DJ. Amygdala unit activity during sleep and waking. Exp Neurol. 1971;33:1–15. doi: 10.1016/0014-4886(71)90097-5. [DOI] [PubMed] [Google Scholar]
- 17.Kamal AM, Tömböl T. Golgi studies on the amygdaloid nuclei of the cat. J Hirnforsch. 1975;16:175–201. [PubMed] [Google Scholar]
- 18.Krettek JE, Price JL. Projections from the amygdaloid complex to the cerebral cortex and thalamus in the rat and cat. J Comp Neurol. 1977a;172:687–722. doi: 10.1002/cne.901720408. [DOI] [PubMed] [Google Scholar]
- 19.Krettek JE, Price JL. Projections from the amygdaloid complex and adjacent olfactory structures to the entorhinal cortex and to the subiculum in the rat and cat. J Comp Neurol. 1977b;172:723–752. doi: 10.1002/cne.901720409. [DOI] [PubMed] [Google Scholar]
- 20.Le Gal La Salle G, Paxinos G, Emson P, Ben-Ari Y. Neurochemical mapping of GABAergic systems in the amygdaloid complex and bed nucleus of the stria terminalis. Brain Res. 1978;155:397–403. doi: 10.1016/0006-8993(78)91037-5. [DOI] [PubMed] [Google Scholar]
- 21.McCormick DA, Connors BW, Lightall JW, Prince DA. Comparative electrophysiology of pyramidal and sparsely spiny stellate neurons of the neocortex. J Neurophysiol. 1985;54:782–806. doi: 10.1152/jn.1985.54.4.782. [DOI] [PubMed] [Google Scholar]
- 22.McDonald AJ. Immunohistochemical identification of gamma-aminobutyric acid-containing neurons in the rat basolateral amygdala. Neurosci Lett. 1985;53:203–207. doi: 10.1016/0304-3940(85)90186-7. [DOI] [PubMed] [Google Scholar]
- 23.McDonald AJ. Cell types and intrinsic connections of the amygdala. In: Aggleton JP, editor. The amygdala: neurobiological aspects of emotion, memory, and mental dysfunction. Wiley; New York: 1992. pp. 67–96. [Google Scholar]
- 24.McDonald AJ, Pearson JC. Coexistence of GABA and peptide immunoreactivity in non-pyramidal neurons of the basolateral amygdala. Neurosci Lett. 1989;100:53–58. doi: 10.1016/0304-3940(89)90659-9. [DOI] [PubMed] [Google Scholar]
- 25.McDonald AJ, Augustine JR. Localization of GABA-like immunoreactivity in the monkey amygdala. Neuroscience. 1993;52:281–294. doi: 10.1016/0306-4522(93)90156-a. [DOI] [PubMed] [Google Scholar]
- 26.Mitchell S, Ranck JB. Generation of theta rhythm in medial entorhinal cortex of freely moving rats. Brain Res. 1980;189:49–66. doi: 10.1016/0006-8993(80)90006-2. [DOI] [PubMed] [Google Scholar]
- 27.Paré D, Smith Y. Distribution of GABA immunoreactivity in the amygdaloid complex of the cat. Neuroscience. 1993;57:1061–1076. doi: 10.1016/0306-4522(93)90049-l. [DOI] [PubMed] [Google Scholar]
- 28.Paré D, Smith Y. GABAergic projection from the intercalated cell masses of the amygdala to the basal forebrain in cats. J Comp Neurol. 1994;344:33–49. doi: 10.1002/cne.903440104. [DOI] [PubMed] [Google Scholar]
- 29.Paré D, Dong J, Gaudreau H. Amygdalo-entorhinal relations and their reflection in the hippocampal formation: generation of sharp sleep potentials. J Neurosci. 1995a;15:2482–2503. doi: 10.1523/JNEUROSCI.15-03-02482.1995. [DOI] [PMC free article] [PubMed] [Google Scholar]
- 30.Paré D, Pape HC, Dong J. Physiological properties of cat basolateral amygdaloid neurons: intracellular recordings in barbiturate-anesthetized cats. J Neurophysiol. 1995b;74:1179–1191. doi: 10.1152/jn.1995.74.3.1179. [DOI] [PubMed] [Google Scholar]
- 31.Rainnie DG, Asprodini EK, Shinnick-Gallagher P. Inhibitory transmission in the basolateral amygdala. J Neurophysiol. 1991;66:999–1009. doi: 10.1152/jn.1991.66.3.999. [DOI] [PubMed] [Google Scholar]
- 32.Rainnie DG, Asprodini EK, Shinnick-Gallagher GP. Intracellular recordings from morphologically identified neurons of the basolateral amygdala. J Neurophysiol. 1993;69:1350–1362. doi: 10.1152/jn.1993.69.4.1350. [DOI] [PubMed] [Google Scholar]
- 33.Reich H, Rupprecht U, Stumpf H, Stock G. Modulation of unit activity in the amygdala of unrestrained cats during the sleep-waking cycle. Neurosci Lett. 1983;35:209–214. doi: 10.1016/0304-3940(83)90552-9. [DOI] [PubMed] [Google Scholar]
- 34.Schwartzkroin PA, Mathers LH. Physiological and morphological identification of a nonpyramidal cell type. Brain Res. 1978;157:1–10. doi: 10.1016/0006-8993(78)90991-5. [DOI] [PubMed] [Google Scholar]
- 35.Smith Y, Paré D. Intra-amygdaloid projections of the lateral nucleus in the cat: PHA-L anterograde labeling combined with post-embedding GABA and glutamate immunocytochemistry. J Comp Neurol. 1994;342:232–248. doi: 10.1002/cne.903420207. [DOI] [PubMed] [Google Scholar]
- 36.Steriade M, Hobson JA. Neuronal activity during the sleep-waking cycle. Prog Neurobiol. 1976;6:155–376. [PubMed] [Google Scholar]
- 37.Steriade M, Nuñez A, Amzica F. Intracellular analysis of relations between the slow (<1 Hz) neocortical oscillation and other sleep rhythms of the electroencephalogram. J Neurosci. 1993;13:3266–3283. doi: 10.1523/JNEUROSCI.13-08-03266.1993. [DOI] [PMC free article] [PubMed] [Google Scholar]
- 38.Sugita S, Johnson SW, North RA. Synaptic inputs to GABAA and GABAB receptors originate from discrete afferent neurons. Neurosci Lett. 1992;134:207–211. doi: 10.1016/0304-3940(92)90518-c. [DOI] [PubMed] [Google Scholar]
- 39.Tömböl T, Szafranska-Kosmal A. A Golgi study of the amygdaloid complex in the cat. Acta Neurobiol Exp. 1972;32:835–848. [PubMed] [Google Scholar]
- 40.Villablanca J, Salinas-Zeballos ME. Sleep-wakefulness EEG and behavioral studies of chronic cats without thalamus: the “athalamic” cat. Arch Ital Biol. 1972;110:383–411. [PubMed] [Google Scholar]
- 41.Washburn MS, Moises HC. Electrophysiological and morphological properties of rat basolateral amygdaloid neurons in vitro. J Neurosci. 1992a;12:4066–4079. doi: 10.1523/JNEUROSCI.12-10-04066.1992. [DOI] [PMC free article] [PubMed] [Google Scholar]
- 42.Washburn MS, Moises HC. Inhibitory responses of rat basolateral amygdaloid neurons recorded in vitro. Neuroscience. 1992b;50:811–830. doi: 10.1016/0306-4522(92)90206-h. [DOI] [PubMed] [Google Scholar]
- 43.Womble MD, Moises HC. Hyperpolarization-activated currents in neurons of the rat basolateral amygdala. J Neurophysiol. 1993;70:2056–2065. doi: 10.1152/jn.1993.70.5.2056. [DOI] [PubMed] [Google Scholar]


