

Abstract
To examine potential neural mechanisms involved in cocaine self-administration, the activity of single neurons in the nucleus accumbens of rats was recorded during intravenous cocaine self-administration. Lever pressing was reinforced according to a fixed-ratio 1 schedule. On a time base comparable to the interinfusion interval, half the neurons exhibited phasic firing patterns time locked to the cocaine reinforced lever press. For almost all neurons, this pattern consisted of a change in firing rate postpress, typically a decrease, followed by a reversal of that change. The postpress change was closely related to the lever press. Typically, it began within the first 0.2 min postpress and culminated within the first 1.0 min postpress. For a small portion of responsive neurons, the reversal of the postpress change was punctate and occurred within 1–3 min of either the last lever press or the next lever press so that firing was stable during much of the interinfusion interval. For the majority of neurons, the reversal was progressive; it began within 2 min after the previous lever press, and it was not complete until the last 0.1–2.0 min before the next lever press. The duration of this progressive reversal, but not of the postpress change, was positively correlated with the interinfusion interval. Thus, in addition to exhibiting changes in firing related to the occurrence of self-infusion, the majority of neurons also exhibited progressive changes in firing related to the spacing of infusions. In a structure that has been shown to be necessary for cocaine self-administration, such a firing pattern is a likely neurophysiological component of the mechanism that transduces declining drug levels into increased drug-related appetitive behavior. It is, thus, a neural mechanism that may contribute to compulsive drug-maintained drug taking.
Keywords: addiction, electrophysiology, ventral striatum, psychomotor stimulant, cocaine, self-administration, dopamine, nucleus accumbens, reward, motivation
Under conditions of limited access and a fixed-ratio schedule of psychomotor stimulant reinforcement, animals exhibit a pattern of repeated drug self-infusion that continues until the session is ended by the experimenter. This pattern of repetitive drug taking may be comparable to the compelled and uncontrollable repetition of drug taking that is exhibited by humans and that constitutes a defining characteristic of psychomotor stimulant addiction (Kramer et al., 1967; Griffiths et al., 1980; Fischman and Foltin, 1992).
Within the range of doses that are readily self-administered, animals, like humans, successively self-administer a particular dose of drug at regular intervals. The interval is related inversely to metabolic rate (Dougherty and Pickens, 1974) and related directly to drug level (Seevers and Schuster, 1967; Pickens and Thompson, 1968; Schuster et al., 1968; Woods and Schuster, 1968; Yokel and Pickens, 1973, 1974;Baxter et al., 1974; Yokel and Wise, 1975; Risner and Jones, 1980;Wise, 1987; Gerber and Wise, 1989). Thus, self-infusion appears to be controlled by a temporally regular cyclic process that is, at least in part, pharmacological (for review, see Griffiths et al., 1980; Young and Herling, 1986) (see also Goldberg et al., 1969; Wilson et al., 1971; Yokel and Pickens, 1976). Data show that the interinfusion interval is not simply a function of drug-induced toxic effects, such as motor disruption (Pickens and Harris, 1968; Pickens and Thompson, 1968; Goldberg, 1973; Wise et al., 1977) or aversive stimulation (Iglaur and Woods, 1974; Johanson and Schuster, 1975; Griffiths et al., 1979; Winger and Woods, 1985). Rather, within the range of doses that are readily self-administered, the interinfusion interval, in large part, likely is related to the drug effect that engenders drug-taking (see Wilson et al., 1971; Wilson and Schuster, 1972; Yokel and Pickens, 1974; Wise, 1987). Thus, it has been suggested that the interval between infusions reflects a period of drug “satiety” (Wise, 1987). Moreover, the duration of that period appears to be determined by the metabolic time course of the self-administered drug and to equal the amount of time required for the drug to metabolize to a threshold nonsatiating level that facilitates the next cycle of drug taking (seePickens and Thompson, 1968; Wilson et al., 1971; Yokel and Pickens, 1973, 1974; Cone et al., 1978; Pickens et al., 1978).
Behavior pharmacology studies showed that the positive reinforcing effect of cocaine depends on dopamine (DA) (Wilson and Schuster, 1972,1974; Baxter et al., 1974; Davis and Smith, 1975; Yokel and Wise, 1975,1976, 1978; Risner and Jones, 1976; Davis and Smith, 1977; deWit and Wise, 1977; Gill et al., 1978; Roberts and Vicker, 1984; Woolverton et al., 1984; Koob et al., 1987; Roberts et al., 1989; Hubner and Moreton, 1991). Neuropharmacology studies corroborated and extended this finding by showing that self-administration depends both on mesoaccumbens DA and on neurons of the nucleus accumbens (NAcc). Specifically, self-administration is blocked by intra-accumbens infusion of DA antagonists (Phillips et al., 1983; Robledo et al., 1992; McGregor and Roberts, 1993). It also is disrupted by depletion of mesoaccumbens DA (Roberts et al., 1977; Lyness et al., 1979; Roberts et al., 1980;Roberts and Koob, 1982; Pettit et al., 1984) and by destruction of the neurons of the NAcc (Zito et al., 1985). The disruptions in self-administration reflected a selective interference with cocaine reinforcement (Roberts et al., 1977; Zito et al., 1985; Dworkin and Smith, 1987, 1988).
Recent efforts to elucidate the physiological mechanism(s) that underlies NAcc involvement in cocaine self-administration have included electrophysiological recordings from single NAcc neurons in rats self-administering cocaine (Peoples et al., 1989; West et al., 1992). Some of these studies showed rapid phasic changes in firing within 20–120 sec of the reinforced lever press (Chang et al., 1990; Carelli et al., 1993; Peoples et al., 1994; Chang et al., 1994; Carelli and Deadwyler, 1994) (for related findings, see Henriksen et al., 1992;Aigner et al., 1993). The remainder of the interinfusion interval was not charted systematically. As noted above, the interval likely reflects the metabolic time course of the drug effect that engenders drug taking. If a related time course characterizes firing patterns of individual NAcc neurons, those firing patterns are probable components of the mechanism that transduces declining cocaine levels into a bias to engage in drug taking. Therefore, in the present experiment, firing patterns of NAcc neurons were evaluated on a time frame comparable to the entire interinfusion interval.
MATERIALS AND METHODS
Surgery. Fourteen male (300–350 gm) Long–Evans rats (Charles River, Wilmington, MA) were anesthetized with sodium pentobarbital (50 mg/kg, i.p.) (Abbot Laboratories, North Chicago, IL). Before surgery, subjects received injections of atropine methyl nitrate (10 mg/kg, i.p.) (Sigma, St. Louis, MO) and penicillin G (75,000 U/0.25 ml, i.m.) (Wyeth Laboratories, Philadelphia, PA). Anesthesia was maintained with periodic injections of sodium pentobarbital (5–10 mg/kg, i.p.) and ketamine hydrochloride (60 mg/kg, i.p.) (Fort Dodge Laboratories, Fort Dodge, IA). A catheter was implanted in the jugular vein and exited through a j-shaped stainless steel cannula cemented to the skull. An array of quad-Teflon coated stainless steel wires was implanted in the NAcc (between 0.7 and 2.7 mm anterior from bregma; between 0.8 and 2.2 mm lateral from bregma; and between 6.8 and 7.2 mm ventral from level skull) (Paxinos and Watson, 1986). The array consisted of 12–16 microwires (diameter of each uninsulated wire tip, 50 μm) (California Fine Wire, Grover City, CA) arranged in two parallel rows, which were ∼2 mm in length and separated from one another by 0.45–0.55 mm (wire center to wire center).
Postoperative maintenance. After surgery, subjects were housed in steel-grid chambers. The catheter was connected to a fluid swivel (Brown et al., 1976). A motor-driven pump perfused the catheter with 0.2 ml of heparinized bacteriostatic saline once per hour. Occasionally, outside the experimental sessions, a brief period of anesthesia was induced with a single infusion of methohexital (10 mg/kg, i.v.) (Eli Lilly, Indianapolis, IN) to either confirm patency or facilitate attachment of the electrical harness. At least 7 d after surgery and 3 d before self-administration training, subjects were transferred to a Plexiglas chamber (34 cm × 23 cm × 29 cm; l × w × h), which henceforth was used for housing, training, and electrophysiological recording. Each Plexiglas chamber was enclosed in a sound-attenuating and ventilated isolation chamber (64 cm2) that was located in a colony room supplied with white noise. Subjects had free access to food and water except during the following: (1) the initial days of training when food was limited to 15 gm each day, and (2) the daily self-administration sessions when access to food was precluded.
Cocaine self-administration session. Before the start of each self-administration session, a nonretractable Plexiglas response lever was mounted on a side wall of the chamber. Onset of the session was signaled by illumination of a stimulus light above the response lever. Each lever press was followed immediately by a 0.2 ml i.v. infusion of cocaine solution, a 7.5 sec tone that corresponded with the duration of the syringe pump (Razel Scientific Instruments, Stamford, CT) operation, and a 40 sec time out, during which the stimulus light was turned off and lever presses had no programmed consequence. Approximately 30 sec was required for the entire 0.2 ml of cocaine solution to be infused through the catheter tip (determined with a nonimplanted catheter attached to the fluid swivel; rate of infusion was limited by the 20 gauge stainless steel tubing of the swivel). The dose of cocaine was not adjusted for body weight and, therefore, varied slightly among subjects. The average ± SE dose during recording sessions equaled 0.7 ± 0.2 mg/kg/infusion. Duration of each training session was limited to either 60–80 infusions or 6–8 hr, whichever occurred first. Self-administration sessions were conducted 6–7 d per week. For all but two rats, 2–5 weeks of self-administration training preceded the first recording session; one rat (S96) completed less than 2 weeks, another (S138) completed more than 5 weeks.
During recording sessions, if lever pressing was not initiated by the rat within the first hour of the self-administration session, 1–3 noncontingent infusions of cocaine were administered to the subject. In seven experiments, the self-administration session was followed by an extinction test wherein lever presses were followed by saline infusions. The saline infusions occurred in conjunction with the same stimulus events and time-out constraints associated with cocaine infusions.
Electrophysiological recording. Only microwires that recorded neural waveforms during preexperimental screenings were included in experimental recordings. During an experiment, electrophysiological recording began 1 hr before the start of the self-administration session and continued for 1 hr after the session. Activity from each recorded microwire first was led into a field effect transistor in the headstage of the electronic harness (NB Labs, Denison, TX). The neural signal then was led through a modified Airflyte fluid and electronic swivel (CAY-675–24, Airflyte Electronics, Bayonne, NJ) to a preamplifier (Riverpoint Electronics, Goldsboro, NC) that differentially amplified the signal on the recording wire against another microwire (i.e., a NAcc microwire that exhibited ambient noise comparable to the recording microwire but did not exhibit a neural signal). The signal then was led through a bandpass filter (450 Hz to 10 kHz) and amplifier (Riverpoint Electronics). Using software and hardware of DataWave Technologies (Longmont, CO), electrical signals were sampled (50 kHz sampling frequency for each recording wire), digitized, time stamped (0.1 msec resolution), and stored for off-line analysis. After the experiment, cluster analysis software (DataWave Technologies) was used to isolate neural waveforms and to discriminate among waveforms corresponding to different neurons recorded by the same wire. Waveforms of different neurons were separated on the basis of a number of parameters including total spike height, valley and peak amplitude, latency to peak, and voltages at particular points on the descending and ascending limbs of the waveforms. Recordings were obtained during only one session from each microwire and, hence, only once from each neuron.
Histology. Subjects were injected with a lethal dose of sodium pentobarbital. Anodal current (50 μA for 3–4 sec) was passed through each microwire that previously had yielded a neural recording. Animals were perfused with formalin–saline. The brain was removed and sunk in a solution of formalin and sucrose. Coronal sections (50 μm) through the NAcc were mounted on slides and incubated in a solution of 5% potassium ferricyanide and 10% HCl to stain the iron deposits left by the recording tip (Green, 1958). The tissue was counterstained with 0.2% solution of Neutral Red. The location of each recorded neuron was plotted on the coronal plate (Paxinos and Watson, 1986) that most closely corresponded to its anterior–posterior position. Sixty-six neurons were additionally localized to either the medial or lateral sections of the NAcc. The medial sections were defined as the medial rostral pole (<1.6 mm lateral from midline) + the shell. The lateral sections were defined as the lateral rostral pole (≥1.6 mm lateral from midline) + the core. The posterior boarder of the rostral pole was defined as 2.2 mm anterior from bregma (see Zahm and Brog, 1992). The boarder between core versus shell was approximated on the basis ofPaxinos and Watson (1986). The distributions of neuronal categories in the medial versus the lateral sections were compared using χ2 tests (Siegel, 1956) (df = 1; p = 0.05).
Perievent time histogram analysis of neural firing
Individual neurons. Each perievent time histogram was constructed such that the following were true: (1) the maximum number of available reinforced lever presses contributed to the histogram; (2) firing was displayed on a time base that approximated the interinfusion interval; and (3) there was no overlap in the firing displayed for consecutive lever presses. To these ends, the initial 5–10 irregularly spaced self-infusions of the loading phase were excluded from analysis. All other reinforced lever presses bracketed by interinfusion intervals of a minimum length (i.e., 1 min less than the mode) were included in the histogram. Offset of the reinforced lever press (0.1 msec resolution) was the histogram node. Given that subjects’ modal interinfusion interval varied, the time base of the histogram varied among rats and ranged from 8 to 24 min (i.e., ±4 to ±12 min of the lever press). For each neuron, one lever-press histogram was constructed with a bin width of 0.1 min and another was constructed with a bin width of 0.5 min.
Groups of neurons. For each of the histograms constructed with a 0.5 min bin width, firing rates were normalized by dividing Hz in each bin by the Hz in the bin showing the maximum firing rate in that histogram. The normalized firing rates then were used to construct average histograms. To construct such a histogram for a given group, normalized Hz within each respective 0.5 min bin was averaged across all the neurons in that group.
Quantitative analysis of firing time locked to the reinforced lever press. Only statistically significant increases or decreases in firing rate are reported herein as changes in firing. Significance was evaluated by using the Wilcoxin matched pairs test (p = 0.05, unidirectional) (Siegel, 1956; Schultz et al., 1992). To conduct the test, firing rates before and after the reinforced lever press were calculated for each neuron using a sliding window procedure (Schultz et al., 1992); the measure of firing rate, number of discharges, was determined as a function of 0.5 min time windows using a step time equal to 0.1 min. For each lever-press trial that was included in a Wilcoxin matched pairs test, the numbers of discharges in two time windows, or in two 0.1 min steps, were input as a matched pair into the test.
Changes in firing postpress. A postpress change was defined as a significant increase or decrease in firing rate that occurred during the first 2 min after the reinforced lever press, relative to firing in the 2 min before the reinforced lever press. In analyzing a postpress decrease statistically, discharges in the 0.5 min time window with the minimum discharges after the press were compared with discharges in the 0.5 min window with the maximum discharges before the press. The latency to onset of a decrease postpress was determined in two stages. It first was delimited with a 0.5 min resolution. This was done by identifying the first 0.5 min window postpress in which number of discharges decreased significantly from that in the 0.5 min window with the maximum firing rate prepress. To further resolve the onset latency to within 0.1 min, firing rates during the five 0.1 min steps included in that postpress window then were compared with firing rates in the 0.1 min steps of the prepress window. The first 0.1 min step postpress in which discharges decreased significantly from those in the 0.1 min step with maximum discharges prepress was defined as the onset latency. The latency to culmination of a postpress decrease (i.e., time at which the decrease attained its minimum) also was determined in two stages. First, it was delimited by determining the 0.5 min window in which firing decreased to its minimum, and then it was defined as the first 0.1 min step therein with minimum discharges. The culminant firing rate of the postpress decrease equaled the average firing rate during the entire 0.5 min window that delimited the culmination latency. Similar procedures were used to characterize increases in firing rate postpress.
Reversal. Significant changes in firing rate that occurredafter, and relative to, the first 2 min postpress were defined as reversals. For almost all neurons, the reversal followed and completely reversed a significant postpress change. In those cases, thelatency to onset of the reversal was determined as follows. Initially, it was delimited by determining the first 0.5 min window in which firing reverted significantly from the culminant firing rate of the postpress change. It then was defined as the 0.1 min step therein with the most reverted firing rate. As was the case for all other latencies, the latency to culmination of the reversal was determined in two stages. First it was approximated by determining the 0.5 min window in which the reversal attained its maximum or minimum. Then it was defined as the 0.1 min step therein with maximum or minimum discharges. The culminant firing rate of the reversalequaled the average firing rate during the entire 0.5 min window that delimited the culmination latency of the reversal.
Magnitude and duration of changes in firing rate. A percent change measure was used to characterize the magnitude of changes in firing rate. Percent change equaled: (maximum Hz − minimum Hz)/maximum Hz. The maximal pre- versus postpress change in firing ratewas defined as the difference between the culminant firing rate of the postpress change and the culminant firing rate of the reversal. Duration of various phases of the neural cycle were defined as follows: (1) duration of the postpress change equaled the interval that elapsed from the offset of the reinforced lever press to the onset of the reversal; (2) duration of the reversal equaled the period between its onset and culmination; and (3) duration of the postreversal period equaled the time that elapsed between culmination of the reversal and completion of the lever press. The combined durations of the three phases of the neural cycle necessarily equaled the interinfusion interval. For each phase of the neural cycle, a bidirectional Pearson product moment correlation was calculated between its duration and the duration of the self-administration cycle (i.e., the interinfusion interval).
Categorization of responsive neurons. Initial categorization of responsive neurons was made on the basis of the postpress change, i.e., whether there was a significant increase, a significant decrease, or no change. Additional categorization was based on the time course of the reversal, which was termed early, late, or progressive according to the following operational definitions. An early reversal began and culminated within the first 4 min after the preceding lever press. In contrast, a late reversal did not begin and culminate until some time during the last 2 min before the next lever press. A progressive reversal began within the first 4 min after the previous press but culminated only within the last 2 min before the next one.
Further analysis of neural firing: histograms with low interinfusion interval variance. Additional lever press histograms for individual neurons were constructed using selected trials. Those selected trials included all trials in which the prepressinterinfusion interval fell within a 1 min range. That range typically overlapped with the modal interinfusion interval and was chosen so as to maximize the number of lever-press nodes included in the histogram.
RESULTS
Behavior
In 14 experiments, rats completed reinforced lever presses by depressing the lever with a forepaw; in 2 experiments (S94e1 and s50e1), rats made responses with the snout. After each lever press, rats typically locomoted to a location in the chamber where they engaged in focused stereotypy. As the interinfusion interval elapsed, subjects were less likely to engage in stereotypy and more likely to engage in locomotion both around the chamber and toward the lever. At the end of the interval, an approach to the lever was followed by a lever press that marked the onset of the next behavioral cycle. Self-infusions were separated by regular intervals. Thus, the hourly rate of cocaine self-administration (i.e., reinforced lever presses/hr) was stable; examples are shown in Figure 1. Within individual sessions, and after the initial loading phase, the interinfusion interval typically did not vary more than 2 min from the median. In 11 of the 16 recording sessions, the median interinfusion interval fell within a range of 6.3–8.7 min. During behavioral extinction, the rate of nonreinforced lever pressing first increased relative to the rate of cocaine reinforced lever pressing and then decreased rapidly to zero (Fig. 1B). The patterns of behavior observed in the present study are in agreement with previous reports (Pickens and Thompson, 1968; Woods and Schuster, 1968; Wilson et al., 1971; Yokel and Pickens, 1973; Yokel and Wise, 1975; Pickens et al., 1978; Carelli et al., 1993; Chang et al., 1994; Peoples et al., 1994).
Fig. 1.
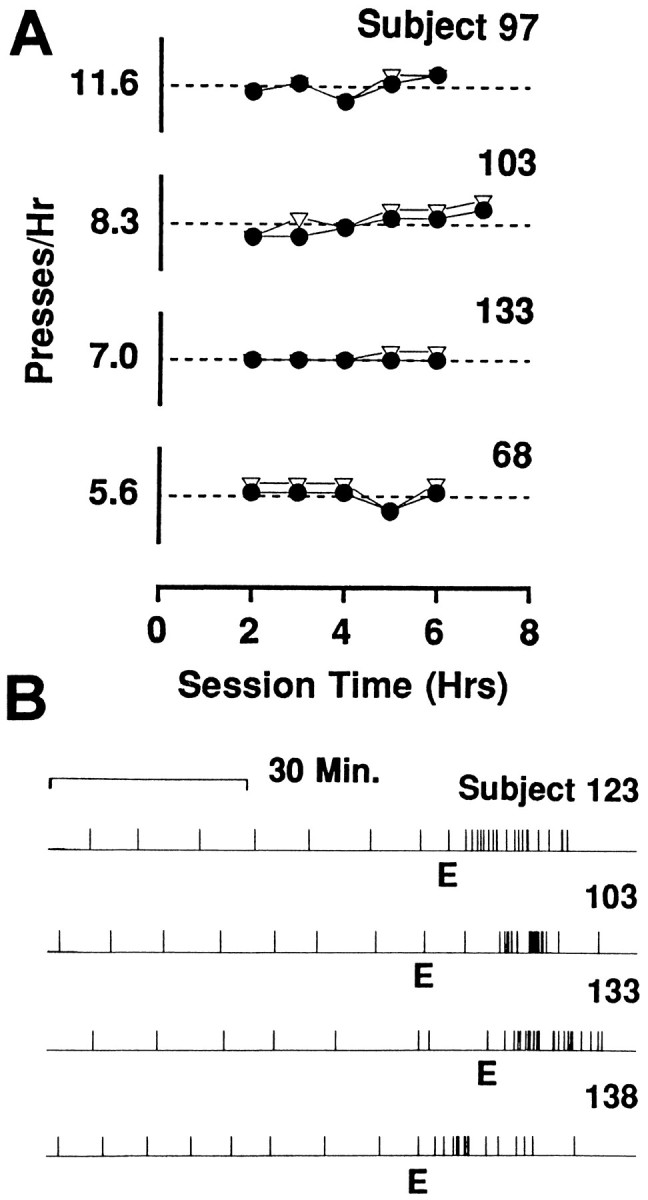
A, Stable hourly rates of cocaine self-administration exhibited by each of four rats during individual recording sessions. For each graph, the range of the ordinate equals mean reinforced lever presses per hour ±5; mean reinforced lever presses per hour is indicated by the number to theleft of the ordinate and by the dashed line.Closed circles represent reinforced lever presses per hour.Open triangles represent total number of lever presses per hour (i.e., reinforced presses summed with time-out presses). Time-out presses occurred immediately after the lever press and before the completed infusion. B, The pattern of behavioral extinction exhibited by each of four rats. Each of the four strip charts displays the nonreinforced lever presses made during the extinction phase (toright of label E) and the reinforced lever presses made during the preceding 60–70 min of cocaine self-administration (to left of label E).
Sample of neurons
In 16 sessions (14 rats), 78 NAcc neurons were recorded from 36 microwires. Of the 78 neurons, 96% exhibited a negative–positive waveform. Amplitude of the waveforms typically ranged from 100 to 300 μV; average amplitude equaled 184 ± 13 μV (noiseband = 50 μV). Except for the distinct firing rate of a group of very slow-firing neurons (see below), tonic firing rates were similar among the various categories of neurons (see below) during the 30 min beforethe start of the self-administration session; average tonic firing rate equaled 0.06 ± 0.02 Hz for the 16 slow-firing neurons and 0.27 ± 0.05 Hz for the remaining 62 neurons. A large proportion of the neurons [40/78 (51%)] responded phasically during self-administration (i.e., showed statistically significant fluctuations in firing rate time locked to the reinforced lever press). A smaller number of neurons [22/78 (28%)] were nonresponsive (i.e., showed no significant fluctuation in firing time locked to the lever press). The remaining 16 (21%) neurons could not be analyzed statistically, because the number of self-administration trials in which neural discharges occurred was too low (i.e., less than six). Half of those slow-firing neurons displayed patterns of firing that appeared time locked to the lever press (shown below). Thus, the reported percentage of phasically responsive neurons (51%) may be conservative.
Categories of firing patterns related to the cocaine-reinforced lever press
Neurons that responded during cocaine self-administration typically changed firing rate shortly after the reinforced lever press and then reversed that change later in the interinfusion interval. Responsive neurons were categorized first according to the nature of the postpress change (i.e., a significant decrease, significant increase, or no change) and then according to the time course of the significant reversal (i.e., early, late, or progressive). This categorization clustered the 40 responsive neurons into seven groups.
Three groups of neurons (n = 29) decreased firing to a minimum within 1 or 2 min after the reinforced lever press. These three groups differed with respect to the time course over which they reversed the postpress decrease. The first group reversed the decrease progressively. Firing rate began to increase early in the interval and continued to increase until it returned to the original prereinforcement rates, which were attained late in the interval, shortly before the next lever press (decrease + progressive reversal neurons, n = 20) (Fig. 2, Table 1, row A). The second group of neurons reversed the postpress decrease rapidly and early during the interinfusion interval (decrease + early reversal neurons; n = 6) (Fig. 3k, l; Table 1, row B). The third group also reversed the postpress decrease precipitously but did not do so until late in the interinfusion interval and shortly before the next lever press (decrease + late reversal neurons;n = 3) (Fig. 3o, q; Table 1, row C).
Fig. 2.

The most commonly observed pattern of firing time locked to the lever press. Each histogram displays the firing pattern exhibited by one decrease + progressive reversal neuron. This category of responsive neuron was one of two that showed a progressive reversal. Each histogram was constructed with a bin width of 0.1 min and a time base that approximated the modal interinfusion interval of the recording session from which the neural data were obtained. This time base minimized overlap and allowed illustration of average neural firing with respect to each animal’s cycle of self-administration behavior. For each histogram, the ordinate equals average counts/sec (average Hz) and the abscissa equals minutes pre- and postreinforced lever press. On the abscissa, 0 represents completion of the reinforced lever press. Arrowsunderneath the abscissa mark 2 min prepress and 2 min postpress. At thetop left corner of each histogram are shown the corresponding subject, experiment (e), microwire (m), and number of lever-press nodes (n). To theleft of each histogram is a sample of consecutively recorded waveforms; in all cases, positive voltage is up. The vertical calibration bar to the left of each waveform sample indicates 0.05 mV; each waveform trace spans 0.65 msec. Examples of early (Fig. 2e, g; see also Fig. 3o,q) and late (Fig. 2b; see also Figs.3j, 4s–u) onsets of the postpress change are shown in this and subsequent figures. Examples of early (Fig. 2c, e; see also Figs. 3l,p, 4s, u, w) and late (Fig.2d, g; see also Fig. 4t) culminations of the postpress change are similarly displayed.
Table 1.
Categorization of firing patterns related to the cocaine reinforced lever press
| Categories of responsive neurons | Figure example | No. (% neurons) | |
|---|---|---|---|
| Postpress change | Reversal | ||
| (A) Decrease | Progressive | 2a–g,5, 7a–g | 20 (50%) |
| (B) Decrease | Early | 3k–l | 6 (15%) |
| (C) Decrease | Late | 3o, q | 3 (8%) |
| (D) Increase | Progressive | 4s, t, 5, 7s, t | 6 (15%) |
| (E) Increase | Early | 4u,7u | 2 (5%) |
| (F) No change | Early | 3m | 2 (5%) |
| low pre- and postpress | |||
| (G) No change high pre- and postpress | Early | 3r,7r | 1 (2%) |
| 40 (100%) | |||
Number of responsive neurons equals 40 (of 78 total neurons).
Fig. 3.

Less frequently observed patterns of firing time locked to the lever press. The format of the figure is the same as that of Figure 2. The histogram labeled n exemplifies a slow-firing neuron. Combined, the remaining histograms provide one or more examples of four of five firing patterns that included either an early or late reversal (i.e., Table 1, rows B, C, F, and G). The fifth such firing pattern (i.e., increase + early reversal, Table 1, row E) is shown in Figure 4.
Two groups of neurons (n = 8) showed firing patterns opposite to those described above. Both increased firing to a maximum within the first 1 or 2 min postpress. One group reversed the increase progressively. Firing rate began to decrease early in the interval and continued to decrease until it returned to the original prereinforcement rates, which were attained late in the interval, shortly before the next lever press (increase + progressive reversal neurons, n = 6) (Fig. 4s,t; Table 1, row D). The other group reversed the postpress increase rapidly and early during the interval (increase + early reversal neurons, n = 2) (Fig. 4u; Table 1, row E). Neurons in the remaining two categories of responsive neurons (n = 3) did not show a postpress change in firing but did show other changes in firing (no change + early reversal neurons) (see Fig. 3m, r; Table 1, rows G, F).
Fig. 4.

Increases in firing rate postpress. The format of the figure is the same as that of Figure 2. Two categories of responsive neurons are exemplified in the figure including (1) increase + progressive reversal (Table 1, row D) and (2) increase + early reversal (Table 1, row E).
Firing during the complete interinfusion interval displayed with respect to the reinforced lever press: an overview
Recording of the seven patterns of firing occurred reliably and under a variety of conditions. For example, responsive firing patterns were recorded on individual trials, in 15 of 16 recording sessions, and in 13 of 14 animals. In addition, responsive neurons were recorded concomitantly with nonresponsive neurons in 15 of 16 experiments. Finally, various responsive categories were recorded simultaneously during individual sessions (e.g., Fig. 2a vs Fig.4s; Fig. 3i vs Fig. 4t; Fig.2e vs Fig. 4v; Fig. 2cvs Fig. 3o; Fig. 3l vs Fig. 3q). The reliability and generality of the seven patterns show that they are not merely artifacts of idiosyncratic behavior or unique experimental events; rather, they likely are phasic responses of distinct categories of neurons that differentially process events associated with the cycle of cocaine self-administration.
An overview of the seven categories of responsive neurons showed the following. First, when firing during the entire interinfusion interval was analyzed with respect to self-infusion, the most rapid changes in firing were observed during the 2 min immediately before and/or after self-infusion (see Figs. 2, 3, 4). Second, the most common change in firing postpress was a decrease. Third, responsive neurons that showed the same type of change in firing at the time of the lever press did not always share the same patterns of firing at other times in the interinfusion interval (e.g., decrease + late reversal neurons vs decrease + progressive reversal neurons). Fourth, the majority (65%) of responsive neurons exhibited a progressive reversal of the postpress change. The consistent firing pattern of these progressive reversal neurons, as well as their prevalence, suggests that they constitute a substantial subpopulation of NAcc neurons. Moreover, it is likely that the combined firing pattern of these progressive reversal neurons (e.g., Fig. 5) is a predominant component of the efferent signal transmitted by the NAcc to target structures.
Fig. 5.
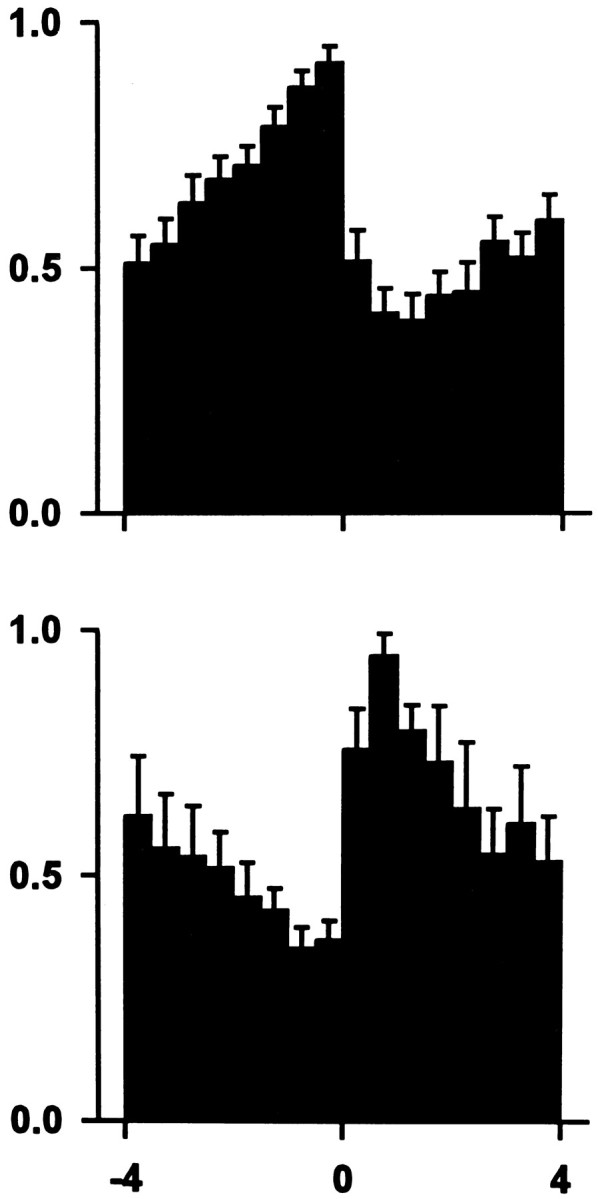
Summary of the most commonly observed firing patterns time locked to the lever press. The top graph is the average lever-press histogram of all 20 decrease + progressive reversal neurons (Table 1, row A). The bottom graph is the average lever-press histogram of the six increase + progressive reversal neurons (Table 1, row D). Ordinate shows average normalized Hz ± SE. Abscissa displays minutes pre- and postpress. Time 0 represents completion of the lever press. Each neuron that contributed to a summary histogram contributed to each of the 16 bins in that histogram.
Detailed time course analysis
Postpress change
A postpress change was exhibited by 37 of 40 responsive neurons. Although there was a range of onset latencies (0.1–1.0 min postpress) and culmination latencies (0.1–2.0 min postpress), the postpress change was typically completed rapidly after the lever press (see Figs.2, 3, 4, 5). The average latency to onset equaled 0.17 ± 0.03 min postpress, and the average latency to culmination equaled 0.8 ± 0.1 min postpress. In addition, the change in firing rate that occurred within the first 0.5 min postpress, relative to 0.5 min prepress, was significant for 32 of 37 (86%) neurons and was only 25% less than the maximal change in firing that occurred postpress, relative to prepress (maximal change = 70 ± 4%). These data show that the postpress change was closely related in time to the previous, just-completed lever press and that it occurred with a substantially shorter time course than the interinfusion interval.
Reversal
The average onset and culmination latencies of the three types of reversals are displayed in Table 2. Those latencies show that the early and late reversals, in their entireties, were closely related to one lever press, the early reversal to the just-completed lever press and the late reversal to the imminent lever press. The progressive reversal was quite different. Its onset was time locked to the previous lever press, but its culmination was time locked to the next lever press. Thus, the time course of the complete progressive reversal approximated that of the interinfusion interval (Figs.2 b–d, e, g, 4s, 5).
Table 2.
Onset and culmination latencies for each of the three types of reversals
| Reversal type | Onset | Culmination |
|---|---|---|
| Progressive | 1.6 ± 0.1 min postpress | 0.7 ± 0.1 min prepress |
| Early | 0.8 ± 0.1 min postpress | 2.8 ± 0.3 min postpress |
| Late | 0.9 to 1.7 min prepressa | 0.1 to 0.3 min prepressa |
Data are expressed as average ± SE. a N = 3. Range given instead of average.
Relationship between the progressive reversal and the complete cycle of cocaine self-administration
The 26 neurons that showed a progressive reversal were recorded from nine rats. Between-animal comparisons showed that the duration of the progressive reversal in the lever-press histograms varied positively with the interinfusion interval (e.g., see Fig.2b vs 2d, 2e vs 2c), i.e., the longer-duration progressive reversals were recorded from animals that exhibited longer interinfusion intervals. A correlational analysis conducted with all 26 of the neurons showed that the duration of the progressive reversal was positively and significantly correlated with the modal interinfusion interval (Fig. 6,bottom) (r = 0.74, p <0.05). In contrast, neither duration of the postpress change (r = 0.03, p >0.05) nor duration of the postreversal period (r = 0.23, p >0.05) was correlated with the interinfusion interval.
Fig. 6.
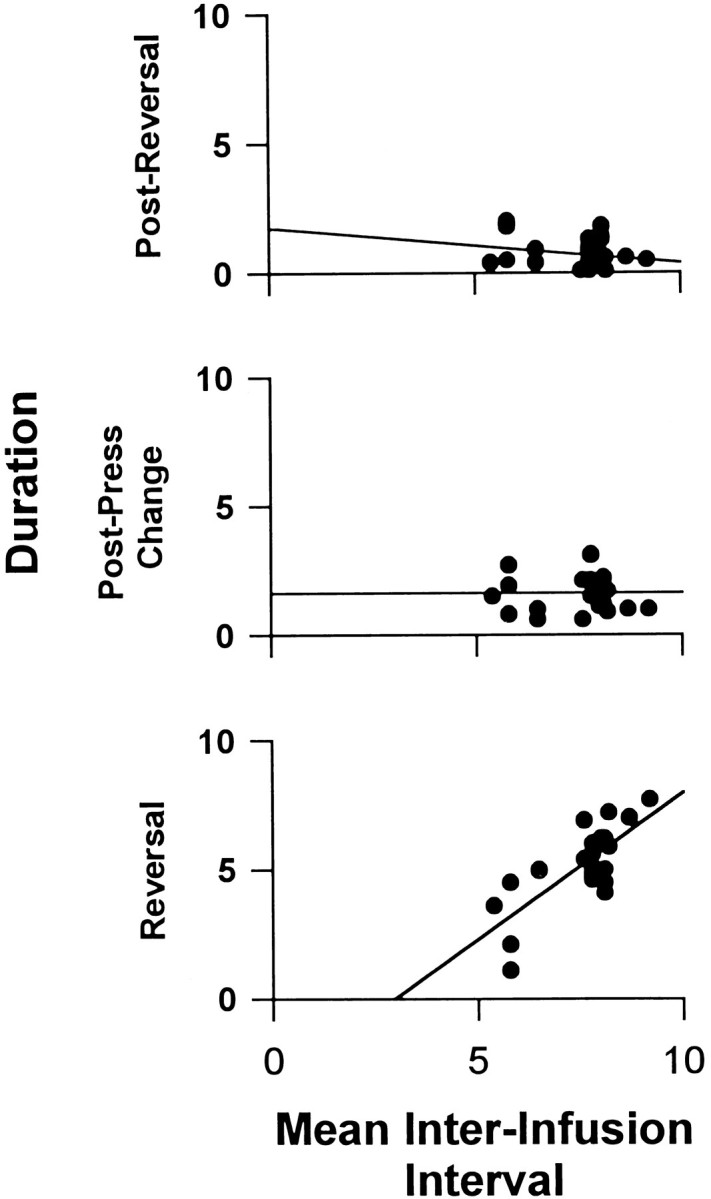
Relationship between the duration of the complete cycle of self-administration (i.e., interinfusion interval) and durations of three phases of the postpress change + progressive reversal firing pattern. The abscissa of each scattergram displays the duration (minutes) of the interinfusion interval. Fromtop scattergram to bottom scattergram, the ordinate displays duration (minutes) of the following: (1) the postreversal period that elapsed between reversal culmination and the completed lever press; (2) the postpress change; and (3) the progressive reversal.
Further analysis of the progressive reversal
Reinforced lever presses included in the original histograms were preceded by interinfusion intervals of variable length. Therefore, the progressive change in firing displayed prepress might have appeared progressive owing to an artifact of averaging firing at different times postpress (e.g., firing 2 min prepress could correspond to 5 min postpress in one trial and 7 min postpress in another). This potential confound was circumvented by constructing additional histograms using only lever presses preceded by comparable interinfusion intervals. As shown in Figure 7, progressive reversals shown by the original histograms were similarly shown by the histograms with low interinfusion interval variance (seea, c, d, g, s,t in Figs. 2, 3, 4 vs Fig. 7). Further analysis showed that progressive reversals also were observable on individual lever-press trials (Fig. 8). Thus, the progressive reversals in the original histograms were real and not simply artifacts of averaging across trials of variable length.
Fig. 7.
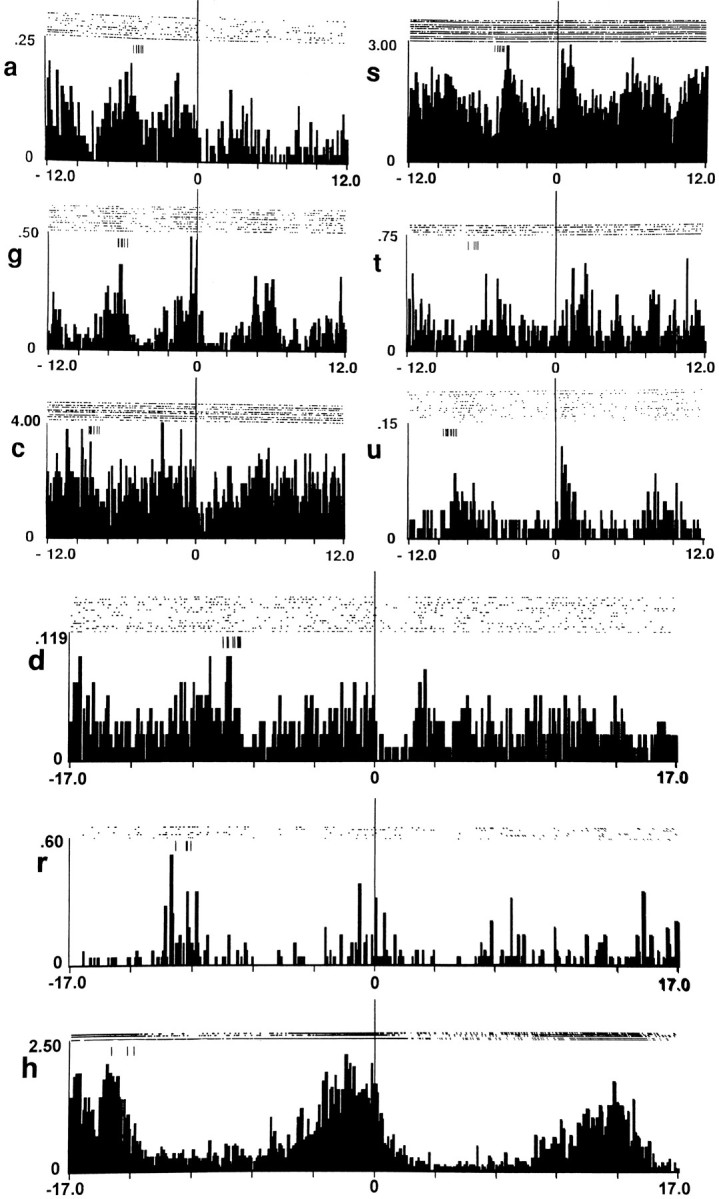
Lever-press histograms constructed with low variance in the prepress interinfusion interval. Each histogram was constructed for an individual neuron already illustrated in Figures2, 3, 4 and was constructed using only lever-press nodes with comparable interinfusion intervals prepress. Bin width in each histogram is 0.1 min. The letter at the left of each histogram indicates the corresponding histogram in Figures 2, 3, 4. In each histogram, the abscissa displays firing on a time base of either ±12 min (top six histograms) or ±17 min (bottom three histograms). From the top downward in the figure, interinfusion interval increases as a function of each successive row of histograms. Each histogram and raster display shows the change in firing time locked to the lever-press nodes (at time 0 on abscissa), plus the change in firing time locked to the immediately preceding lever presses (hatch marks at upper left of histogram). Thus, each histogram displays firing during at least one complete cycle of self-administration behavior, from one lever press to the next. Between-histogram comparisons show that the duration of the neural cycle increased as a function of increases in the interinfusion interval. Examples of low variance histograms are provided for four of seven firing patterns observed in the original histograms (e.g., respectively, histograms g, s, u, and r correspond to Table 1, rows A, D, E, and G).
Fig. 8.

Progressive reversals in firing rate exhibited by individual neurons on individual trials. Each of the four lever-press histograms was constructed for a neuron already illustrated in Figure7; the letter at the left of each histogram indicates the corresponding histogram in Figure 7. The time base of each histogram equals the pre- and postpress interinfusion interval for that trial. Bin width equals 0.5 min. The strip chart (bottom) displays repeated progressive reversals exhibited by a single neuron across successive lever presses. The corresponding lever presses are demarcated as ticks on the barat the top of the strip chart. To the right is a sample of waveforms for the neuron (not shown in other figures) depicted in the strip chart.
The low variance histograms confirmed a number of other observations. As in the original histograms, duration of the progressive reversal in the low-variance histograms increased in parallel with increases in interinfusion interval. For example, as interinfusion interval increased from 5 to 8 min among the animals that correspond to Figure7a, g, c, and d, the progressive reversal increased in duration from 4 to 7 min. These observations confirm that the duration of the progressive reversal was positively related to the duration of the cycle of self-administration (interinfusion interval). Firing in these histograms additionally confirmed the cyclic nature of the neural changes and the synchronicity of those changes with the cycle of self-administration; the onset and completion of the neural cycle consistently occurred in conjunction with the onset and completion of the self-administration cycle.
Additional observation: changes in firing prepress that were distinct from the reversal
The original lever-press histograms showed that some progressive reversal neurons exhibited a prepress change in firing rate immediately before the lever press, which was potentially distinct from the reversal. Consistent with the histograms, statistical analysis showed that seven neurons showing progressive reversals, as well as five of six late reversal neurons, changed firing significantly during the last 0.5 min before the lever press (relative to firing during 0.5–1.0 min prepress). Usually, the change in firing prepress exhibited the following characteristics: (1) it was embedded in the culminating phase of the reversal; (2) it was consistent in direction with the reversal (e.g., Figs. 2d, g, 3o, q); and (3) it was large in comparison to changes that occurred in earlier phases of the reversal. These rapid changes in firing may have reflected the introduction of additional processing specific to the imminent lever press. A final observation was that some neurons exhibited a change in firing rate within the last 0.1 or 0.5 min prepress that was opposite of the reversal and consistent with the postpress change (e.g., Figs. 2a, c,3k, l). This latter type of change prepress suggests that the event coded by the “postpress change” may, for some neurons, actually begin shortly before the lever press.
Combinations of neurons recorded by individual microwires
Certain combinations of neuron categories were recorded simultaneously by single microwires. First, single wires recorded combinations of responsive and nonresponsive neurons. Second, three of eight wires that recorded early and late reversal neurons recorded several of the five categories simultaneously. For example, the same wire recorded all of the neurons represented by Figure 3, jand r, and Figure 4w during a single session. Third, 6 of 11 wires that recorded slow-firing neurons also recorded decrease + progressive reversal neurons. Individual wires rarely recorded other combinations of neurons.
Histology
The combinations of neurons recorded on individual microwires suggest that some categories of neurons might be differentiated anatomically. The histological results, although preliminary given the size of the neuron sample, are consistent with this hypothesis (see Fig. 9). Most neurons in the five categories that showed early and late (i.e., nonprogressive) reversals (Table 1, rows B, C, E–G) were located in the medial sections (i.e., medial rostral pole + shell) of the NAcc. χ2 tests showed that the ratio of nonprogressive to progressive reversal neurons in the medial sections (11:7) was significantly greater than that in the lateral areas (3:12). Consistent with this, the increase + progressive reversal neurons tended to be located in the lateral sections (i.e., lateral rostral pole + core). χ2 tests showed that the ratio of increase + progressive reversal neurons to nonprogressive reversal neurons in the lateral sections (5:3) was significantly different from that in the medial sections (1:11). There were no other differences in the distributions of the seven categories of responsive neurons. There also were no significant differences in the distributions of the following groups of neurons: (1) responsive versus nonresponsive; (2) those grouped according to the direction of the postpress change; and (3) those grouped according to the direction of the reversal.
Fig. 9.
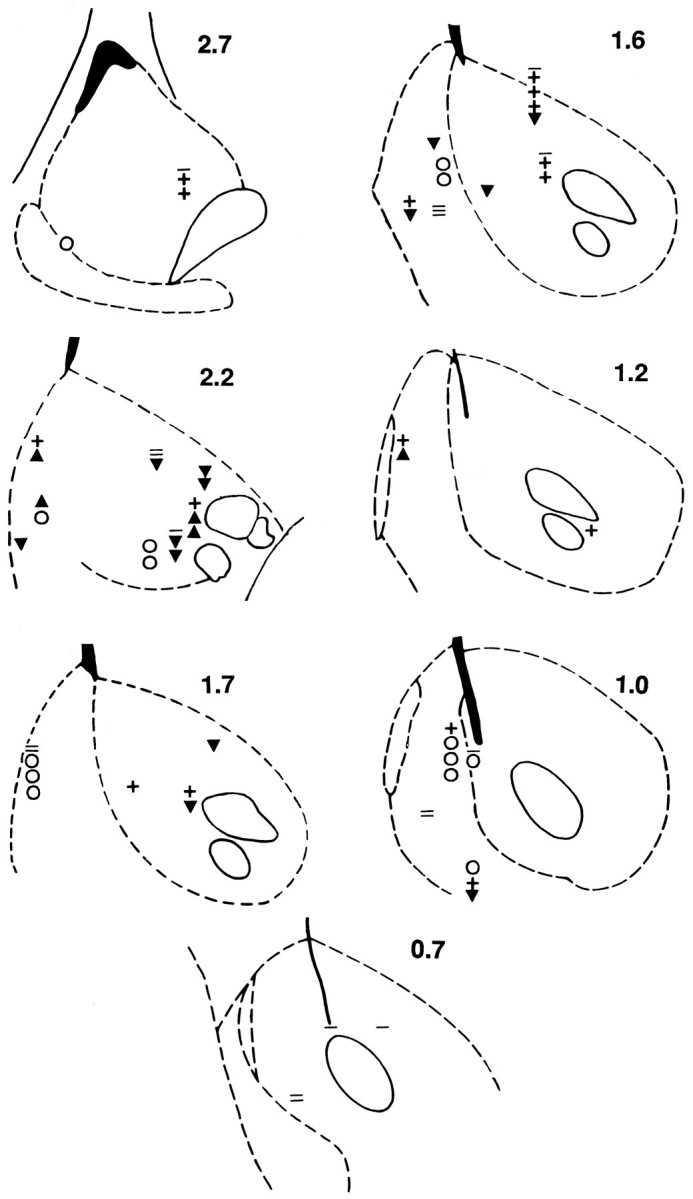
The histological localization of 66 NAcc neurons recorded during cocaine self-administration. Locations of lesions are shown in coronal sections (medial at left of each section).Downward triangles represent decrease + progressive reversal neurons (i.e., Table 1, row A); upward triangles represent increase + progressive reversal neurons (i.e., Table 1, row D);open circles represent neurons that showed either an early or late reversal (i.e., Table 1, rows B, C, E, F–G); horizontal lines represent nonresponsive neurons; and plus signsrepresent neurons with a slow firing rate. If multiple neurons were recorded from a single microwire tip, symbols representing all of the neurons recorded from that wire were stacked in a vertical column; themost ventral symbol indicates the actual location of the wire tip.
DISCUSSION
Principal findings
Under conditions of moderate behavioral training, characteristic self-administration behavior, a moderate cocaine dose, and a time frame comparable to the interinfusion interval, a large proportion of NAcc neurons exhibited cyclic changes in firing rate that were synchronous with cyclic self-infusion of cocaine. Given the necessary contribution that neurons of the NAcc make to cocaine reinforcement, it is likely that at least some of these cyclic changes in firing rate reflect activity that is necessary for cocaine self-administration.
For almost all neurons, the phasic changes in firing rate were divisible into two primary phases: a postpress change and a reversal of that change. The postpress change most often consisted of a decrease in firing. The reversal in some cases occurred rapidly, early or late in the interinfusion interval, but typically developed progressively over the course of the interval. The various types of postpress changes and reversals occurred together in seven reliable combinations. Those combinations showed that different neurons that exhibited the same pattern of firing at the time of the lever press did not always share the same patterns of firing at other times during the interinfusion interval. Thus, consideration of firing during the entire self-administration cycle is necessary to differentiate among distinct categories of responsive NAcc neurons.
The diverse firing patterns likely reflect the responses of categories of neurons that differentially process events associated with the cycle of cocaine self-administration. The minority of responsive neurons (i.e., early and late reversal neurons) exhibited only punctate changes in firing time locked to the lever press, such that firing rate was stable during most of the interinfusion interval. Those punctate changes likely are related either to the act of self-infusion or to events temporally proximal to it (e.g., approach behaviors that lead to lever pressing, the infusion, or cues paired with the infusion). The firing pattern exhibited by the majority of neurons included both a rapid postpress change, which possibly is related to the occurrence of self-infusion, and a progressive reversal of that change. The duration of the progressive reversal, but not of the postpress change, was directly correlated with the duration of the interinfusion interval. As discussed already, the interval appears to reflect the metabolic time course of the drug effect that engenders drug taking. Given that a correlated time course characterizes the progressive reversal, that change in firing may contribute to the transduction of cocaine levels into a bias to engage in drug taking. The prevalence of progressive reversal neurons suggests that they constitute a fairly large subpopulation of NAcc neurons. Moreover, it is likely that the combined firing pattern of those neurons is both a predominant component of the efferent signal transmitted by the NAcc to target structures and an integral component of the physiological mechanism by which the NAcc contributes to cocaine self-administration.
Comparison to previous studies
Previous studies showed that NAcc neurons exhibit changes in firing time locked to cocaine self-infusion (Carelli et al., 1993;Carelli and Deadwyler, 1994; Chang et al., 1994) (see also Peoples et al., 1994). Concomitant with replicating this finding, the present study made the following additional contributions: (1) systematically documented the direction and time course of changes in firing rate throughout the interinfusion interval; (2) identified various phases of firing patterns apparent on the time frame of the interinfusion interval; (3) showed that when firing is displayed with respect to self-infusion, the rapid changes in firing that occur shortly before and after self-infusion are not accompanied by similar rapid changes at other times in the interinfusion interval; and (4) demonstrated that consideration of temporal characteristics of the changes in firing rate, in addition to their directional characteristics, facilitates discrimination of categories of responsive neurons.
The three laboratories that recorded NAcc neurons in rats self-administering cocaine made a number of similar observations.Carelli and Deadwyler (1994) observed that some neurons showed an increase in firing rate that developed gradually within the last 0.5 or 1.0 min prepress; other neurons showed a prolonged increase in firing postpress that lasted as long as 40–180 sec. Those changes are similar to the pre- and postpress increases exhibited by various groups of neurons in the present study. Carelli and Deadwyler (1994) also observed that before the lever press actually was completed, some neurons changed firing toward postpress rates. A similar finding was made in the present study. Chang et al. (1994) observed the following: ∼50% of all recorded neurons exhibited a phasic change in firing time locked to the lever press; almost all of the responsive neurons exhibited a postpress change, typically a decrease; and changes in firing prepress were factorially combined with postpress changes, although the pre- and postpress changes generally were opposite each other. These findings of Chang et al. (1994) are strikingly similar to the results of the present study (see also Peoples et al., 1994).
The time frames used to statistically analyze changes in firing rate time locked to self-infusion varied among the three laboratories. For example, the time frame for a postpress change equaled 2 min postpress in the present study, 40–80 sec postpress in the study by Chang et al. (1994), and 2.5 sec postpress in the study by Carelli and Deadwyler (1994). The different time frames may be an important consideration in certain between-study comparisons, including the following. First, the proportion of responsive NAcc neurons observed in the present study was similar to that found by Chang et al. (1994) but was greater than that found by Carelli et al. (1993) and Carelli and Deadwyler (1994). Second, the former two studies found that postpress decreases were more prevalent than were postpress increases, whereas the reverse was observed in the latter two studies. Preliminary investigation in our laboratory showed that a portion of neurons categorized as responsive on the long time frame of the interinfusion interval also exhibited changes in firing during the few seconds before and after the press, which were similar to patterns described by Carelli et al. (1993) andCarelli and Deadwyler (1994). Importantly, the changes over the short time frame sometimes were distinct (e.g., opposite) from the patterns of firing on the long time base. Thus, divergent findings among the three studies may reflect, at least in part, the distinct patterns of firing exhibited by the same population(s) of neurons over the short versus long time frames. That is, the firing pattern of individual NAcc neurons may be related to a variety of events, some of which occur within seconds of the self-infusion and some of which occur during the minutes of the complete interinfusion interval.
Previously, our laboratory made a preliminary report of the progressive reversal firing pattern and of its possible relationship to the interinfusion interval (Peoples et al., 1994). Chang et al. (1994) made a similar preliminary observation. The characterization of the progressive reversal neurons made in the present study verified the above earlier findings and also provided the following additional information: (1) the duration of the progressive reversal, but not of the postpress change or of the postreversal period, is significantly positively correlated with the interinfusion interval; (2) the relationship between the duration of the reversal and the interinfusion interval holds for neurons that show a postpress increase as well as for neurons that show a postpress decrease; (3) the progressive reversal is exhibited by the majority of responsive neurons; and (4) a progressive reversal sometimes terminates with or is followed by a rapid punctate change in firing rate within the last 0.5 min before the lever press.
Pharmacological contributions to the cyclic firing patterns
We suggested above that the progressive reversal may contribute to the transduction of cocaine levels into a bias to engage in drug taking. Consistent with this suggestion, some characteristics of the progressive reversal and of the postpress change that it reverses are consistent with potential pharmacological mediation. Those characteristics include the following: (1) the postpress change culminated on average shortly after completion of the cocaine infusion; (2) the reversal was progressive and continued slowly across most of the interinfusion interval; (3) the time course of the reversal was correlated with the time course of the pharmacologically determined interinfusion interval; and (4) the change + progressive reversal pattern was prevalent. It should be noted that several findings of the present study show that it is unlikely that the entire change + progressive reversal firing pattern is mediated simply by drug actions. First, in some cases the postpress change occurred too rapidly or too early to be attributable to the drug infusion. Onset of the postpress change sometimes occurred before the infusion began; moreover, culmination of the postpress change, for some neurons, took place before the offset of the infusion. Second, the prepress changes often were accelerated in comparison to changes in firing during earlier portions of the interinfusion interval and, therefore, were inconsistent with the first-order pharmacokinetics of cocaine (seeMisra et al., 1976; Nayak et al., 1976; Welling, 1986; Nicolaysen et al., 1988; Javaid and Davis, 1993). The potential pharmacological contribution to the five early and late reversal firing patterns appears less equivocal, given that the rapidity and timing of both the postpress changes and the reversals are inconsistent with cocaine pharmacokinetics.
A potential role of DA
There are several lines of indirect evidence that are consistent with potential DA mediation of the change + progressive reversal firing pattern. In a chronoamperometric study (Gratton and Wise, 1994), phasic changes in electrochemical signal that possibly related to DA occurred in the NAcc time locked to cocaine self-infusion (for related observations, see Kiyatkin et al., 1993). In accord with the chronoamperometric investigation, a recent microdialysis study (Wise et al., 1995) observed phasic fluctuations in DA time locked to the cocaine-reinforced lever press. Those changes followed a postpress change + progressive reversal pattern and had a time course similar to that of the change + progressive reversal firing pattern observed in the present study. Additional evidence consistent with DA mediation comes from between-study comparisons of the direction of changes in DA observed during microdialysis studies and the direction of changes in firing observed during chronic single cell recording studies. During cocaine self-administration sessions, increases in DA (Hurd et al., 1989; Pettit and Justice, 1989, 1991; Gratton and Wise, 1994; Wise et al., 1995) occurred during periods in which there were most typically decreases in firing rates (Carelli and Deadwyler, 1994; Chang et al., 1994; Peoples et al., 1994; present study). This inverse relationship is consistent with the inhibitory effects of iontophoretic and intravenous administration of DA, cocaine, and other DA agonists on the firing rate of NAcc neurons in anesthetized rats (Woodruff et al., 1976; Rebec et al., 1979; Rebec and Zimmerman, 1980; Yang and Mogenson, 1984; White et al., 1987, 1992, 1993; Qiao et al., 1990).
Motivational function of NAcc firing patterns
Previous studies showed that firing rates of individual NAcc neurons fluctuate with changes in locomotion (Callaway and Henriksen, 1992; Peoples et al., 1994). However, neural data collected thus far from self-administration experiments suggest that the changes in motor behavior that occur before versus after the lever press do not adequately account for changes in firing time locked to self-infusion (Carelli et al., 1993; Carelli and Deadwyler, 1994; Chang et al., 1994;Peoples et al., 1994). This finding is consistent with other data showing that mesolimbic DA and the NAcc do not directly mediate the execution of movements; instead, they have a psychomotor or motivational function that facilitates incentive-related approach and preparatory behaviors (Iversen and Koob, 1977; LeMoal et al., 1977;Mogenson et al., 1980; Robbins and Everitt, 1982; Beninger, 1983;Kelley and Stinus, 1985; Fibiger and Phillips, 1986; Wise and Bozarth, 1987; Cador et al., 1989, 1991; Everitt et al., 1989; Phillips et al., 1991; Apicella et al., 1992; Blackburn et al., 1992; DiChiara et al., 1992; Salamone, 1992; Schultz et al., 1993; Whishaw and Kornelsen, 1993). In the present paradigm, incentive stimuli are likely to include cocaine-induced interoceptive cues (see Colpaert, 1987; Overton, 1987;Stewart and deWit, 1987) as well as exteroceptive cues that are paired with drug availability. The drug-induced cues may include those that develop gradually in conjunction with drug metabolism. Thus, it is possible that some of the changes in firing prepress, including the progressive reversal, reflect processing of incentive stimuli and that the rapid changes in firing that occur postlever press reflect a cessation of that prepress incentive processing. Evidence supportive of this hypothesis is provided by similarities between the firing patterns of the present study and firing patterns observed in relation to food reinforcement. In the latter studies, some responsive midbrain DA, ventral striatum (VS), and NAcc neurons of moderately trained monkeys were activated during prereward incentive-related events (Nishino et al., 1987; Romo and Schultz, 1990; Apicella et al., 1992; Ljungberg et al., 1992; Schultz et al., 1992) (for related findings in rats, seeCarelli and Deadwyler, 1994; Kosobud et al., 1994). Similarly, in the present experiment, firing rates of most responsive NAcc neurons were elevated during periods in which the animals were likely to be engaged in drug-related appetitive behaviors.
The suggestion that at least some NAcc firing patterns have a motivational component is consistent with the incentive motivation theories of drug addiction. These theories posit that direct pharmacological activation of motivational (see Bindra, 1974; Salamone, 1992) brain systems enhances the attractiveness of drug-related stimuli and thereby importantly mediates compulsive drug use (see Stewart et al., 1984; Stewart and deWit, 1987; Wise and Bozarth, 1987; Robinson and Berridge, 1993). Consistent with this view of drug addiction, noncontingent administration of a psychomotor stimulant activates drug-related appetitive behaviors (Pickens and Harris, 1968; Stretch and Gerber, 1973; Davis and Smith, 1975, 1977; Gerber and Stretch, 1975; Meyer and Mirin, 1979; deWit and Stewart, 1981, 1983; Jaffe et al., 1989) (for related observations and discussion, see Hodgson et al., 1979; Griffiths et al., 1980; Wise and Bozarth, 1987; Fischman, 1989; Lamb et al., 1991; Fischman and Foltin, 1992; Robinson and Berridge, 1993). This drug-induced activation of drug taking occurs with a shorter latency at lower reinforcing drug levels than it does at higher ones (Yokel and Pickens, 1974; deWit and Stewart, 1981; 1983). Thus, a parsimonious explanation of temporally regular, repeated psychomotor stimulant self-administration is that it is maintained, at least in part, by the temporally regular, repeated metabolism of drug to a level that, by activating motivational brain systems directly, increases the attractiveness of drug-related stimuli and facilitates drug-related appetitive behavior (see Yokel and Pickens, 1974; deWit and Stewart, 1981, 1983; Stewart et al., 1984). The progressive reversal exhibits characteristics that would be expected of neural changes integral to this pharmacological process. It is prevalent, temporally regular, cyclic, and gradual. Moreover, it is time locked to self-infusion and is related in duration to the time course over which drug metabolizes to levels that engender drug self-infusion. Thus, in light of the role that the NAcc plays in incentive motivation and the necessary role of the NAcc in cocaine self-administration, the progressive reversal is a likely candidate neurophysiological component of the mechanism that transduces declining drug concentration into an increase in drug-related appetitive behavior. In terms of the incentive motivational theories of drug addiction, it may be a neurophysiological component of the drug-induced motivational state that determines the salience of drug-related stimuli and, hence, the extent of related preparatory and approach behavior.
Footnotes
This research was supported by DA 04551 and DA 06886. We thank Ms. Rachel Bibi, Mr. Fred Gee, Mr. Patrick Grace, Ms. Linda King, Mr. Bruno Molino, Mr. David Shapiro, and Dr. Martin Wolske for expert technical assistance. Dr. Steven Dworkin and Dr. Steven Sawyer provided valuable information regarding the self-administration paradigm and the construction and implantation of microwire arrays, respectively. Some findings were reported previously at the 55th Annual Meeting of the Committee on Problems of Drug Dependence, Toronto, Ontario, Canada (1993). Cocaine hydrochloride was provided by the National Institute on Drug Abuse.
Correspondence should be addressed to Laura L. Peoples at the above address.
REFERENCES
- 1.Aigner TG, Bowman EM, Richmond BJ. Neurons in rhesus monkey ventral striatum carry different signals regarding juice and cocaine reinforcement. Soc Neurosci Abstr. 1993;19:1839. [Google Scholar]
- 2.Apicella P, Scarnati E, Ljungberg T, Schultz W. Neuronal activity in monkey striatum related to the expectation of predictable environmental events. J Neurophysiol. 1992;68:945–960. doi: 10.1152/jn.1992.68.3.945. [DOI] [PubMed] [Google Scholar]
- 3.Baxter BL, Gluckman MI, Stein L, Scerni RA. Self-injection of apomorphine in the rat: positive reinforcement by a dopamine receptor stimulant. Pharmacol Biochem Behav. 1974;2:387–391. doi: 10.1016/0091-3057(74)90085-9. [DOI] [PubMed] [Google Scholar]
- 4.Beninger RJ. The role of dopamine in locomotor activity and learning. Brain Res Rev. 1983;6:173–196. doi: 10.1016/0165-0173(83)90038-3. [DOI] [PubMed] [Google Scholar]
- 5.Bindra D. A motivational view of learning, performance, and behavior modification. Psychol Rev. 1974;81:199–213. doi: 10.1037/h0036330. [DOI] [PubMed] [Google Scholar]
- 6.Blackburn JR, Pfaus JG, Phillips AG. Dopamine functions in appetitive and defensive behaviors. Prog Neurobiol. 1992;39:247–279. doi: 10.1016/0301-0082(92)90018-a. [DOI] [PubMed] [Google Scholar]
- 7.Brown ZW, Amit Z, Weeks JR. Simple flow-thru swivel for infusions into unrestrained animals. Pharmacol Biochem Behav. 1976;5:363–365. doi: 10.1016/0091-3057(76)90090-3. [DOI] [PubMed] [Google Scholar]
- 8.Callaway CW, Henriksen SJ. Neuronal firing in the nucleus accumbens is associated with the level of cortical arousal. Neuroscience. 1992;51:547–553. doi: 10.1016/0306-4522(92)90294-c. [DOI] [PubMed] [Google Scholar]
- 9.Cador M, Robbins TW, Everitt BJ. Involvement of the amygdala in stimulus-reward associations: interaction with the ventral striatum. Neuroscience. 1989;30:77–86. doi: 10.1016/0306-4522(89)90354-0. [DOI] [PubMed] [Google Scholar]
- 10.Cador M, Robbins TW, Everitt BJ, Simon H, LeMoal M, Stinus L. Limbic-striatal interactions in reward-related processes: modulation by the dopaminergic system. In: Willner P, Scheel-Kruger J, editors. The mesolimbic dopamine system: from motivation to action. Wiley; New York: 1991. pp. 225–250. [Google Scholar]
- 11.Carelli RM, Deadwyler SA. A comparison of nucleus accumbens neuronal firing patterns during cocaine self-administration and water reinforcement in rats. J Neurosci. 1994;14:7735–7746. doi: 10.1523/JNEUROSCI.14-12-07735.1994. [DOI] [PMC free article] [PubMed] [Google Scholar]
- 12.Carelli RM, King VC, Hampson RE, Deadwyler SA. Firing patterns of nucleus accumbens neurons during cocaine self-administration in rats. Brain Res. 1993;626:14–22. doi: 10.1016/0006-8993(93)90557-4. [DOI] [PubMed] [Google Scholar]
- 13.Chang J-Y, Sawyer SF, Lee R-S, Woodward DJ. Electrophysiological and pharmacological evidence for the role of the nucleus accumbens in cocaine self-administration in freely moving rats. J Neurosci. 1994;14:1224–1244. doi: 10.1523/JNEUROSCI.14-03-01224.1994. [DOI] [PMC free article] [PubMed] [Google Scholar]
- 14.Chang J-Y, Sawyer SF, Lee R-S, Maddux BN, Woodward DJ. Activity of neurons in nucleus accumbens during cocaine self-administration in freely moving rats. Soc Neurosci Abstr. 1990;16:252. [Google Scholar]
- 15.Colpaert FC. Drug discrimination: methods of manipulation, measurement, and analysis. In: Bozarth MA, editor. Methods of assessing the reinforcing properties of abused drugs. Springer; New York: 1987. pp. 341–372. [Google Scholar]
- 16.Cone EJ, Risner ME, Neidert GL. Concentrations of phenethylamine in dog following single doses and during intravenous self-administration. Res Commun Chem Pathol Pharmacol. 1978;22:211–232. [PubMed] [Google Scholar]
- 17.Davis WM, Smith SG. Effect of haloperidol on (+)-amphetamine self-administration. J Pharm Pharmacol. 1975;27:540–542. doi: 10.1111/j.2042-7158.1975.tb09502.x. [DOI] [PubMed] [Google Scholar]
- 18.Davis WM, Smith SG. Catecholaminergic mechanisms of reinforcement: direct assessment by drug self-administration. Life Sci. 1977;20:483–492. doi: 10.1016/0024-3205(77)90391-5. [DOI] [PubMed] [Google Scholar]
- 19.deWit H, Stewart J. Reinstatement of cocaine-reinforced responding in the rat. Psychopharmacology. 1981;75:134–143. doi: 10.1007/BF00432175. [DOI] [PubMed] [Google Scholar]
- 20.deWit H, Stewart J. Drug reinstatement of heroin-reinforced responding in the rat. Psychopharmacology. 1983;79:29–31. doi: 10.1007/BF00433012. [DOI] [PubMed] [Google Scholar]
- 21.deWit H, Wise RA. Blockade of cocaine reinforcement in rats with the dopamine receptor blocker pimozide, but not with the noradrenergic blockers phentolamine and phenoxybenzamine. Can J Psychol. 1977;31:195–203. doi: 10.1037/h0081662. [DOI] [PubMed] [Google Scholar]
- 22.DiChiara G, Morelli M, Acquas E, Carboni E. Functions of dopamine in the extrapyramidal and limbic systems. Drug Res. 1992;42:231–237. [PubMed] [Google Scholar]
- 23.Dougherty JD, Pickens R. Effects of phenobarbital and SKR 525A on cocaine self-administration in rats. Drug Addict. 1974;3:135–143. [Google Scholar]
- 24.Dworkin SI, Smith JE. Neurobiological aspects of drug-seeking behaviors. In: Thompson T, Dews PB, Barrett JE, editors. Neurobehavioral pharmacology. Lawrence Erlbaum; Hillsdale, NJ: 1987. pp. 1–43. [Google Scholar]
- 25.Dworkin SI, Smith JE. Neurobehavioral pharmacology of cocaine. In: Clouet D, Asghar K, Brown R, editors. Mechanisms of cocaine abuse and toxicity. National Institute on Drug Abuse Research Monograph #88. US GPO; Washington, DC: 1988. pp. 185–198. [PubMed] [Google Scholar]
- 26.Everitt BJ, Cador M, Robbins TW. Interactions between the amygdala and ventral striatum in stimulus-reward associations: studies using a second-order schedule of sexual reinforcement. Neuroscience. 1989;30:63–75. doi: 10.1016/0306-4522(89)90353-9. [DOI] [PubMed] [Google Scholar]
- 27.Fibiger HC, Phillips AG (1986) Reward, motivation, cognition: psychobiology of mesotelencephalic dopamine systems. In: Handbook of physiology—the nervous system: intrinsic regulatory systems of the brain, Vol IV, Sec I (Bloom FE, ed), pp 647–675. Bethesda: American Physiological Society.
- 28.Fischman MW. Relationship between self-reported drug effects and their reinforcing effects: studies with stimulant drugs. In: Fischman M, Mello NK, editors. National Institute on Drug Abuse Research Monograph #92. US GPO; Washington, DC: 1989. pp. 212–230. [PubMed] [Google Scholar]
- 29.Fischman MW, Foltin RW. Self-administration of cocaine by humans: a laboratory perspective. In: Bock GR, Whelan J, editors. Cocaine: scientific and social dimensions. CIBA Foundation Symposium #166. Wiley; Chichester, UK: 1992. [DOI] [PubMed] [Google Scholar]
- 30.Gerber GJ, Stretch R. Drug-induced reinstatement of extinguished self-administration behavior in monkeys. Pharm Biochem Behav. 1975;3:1055–1061. doi: 10.1016/0091-3057(75)90016-7. [DOI] [PubMed] [Google Scholar]
- 31.Gerber GJ, Wise RA. Pharmacological regulation of intravenous cocaine and heroin self-administration in rats: a variable dose paradigm. Pharmacol Biochem Behav. 1989;32:527–531. doi: 10.1016/0091-3057(89)90192-5. [DOI] [PubMed] [Google Scholar]
- 32.Gill CA, Holz WC, Zirkle CL, Hill H. Pharmacological modification of cocaine and apomorphine self-administration in the squirrel monkey. In: Deniker P, Radouco-Thomas C, Villeneuve A, editors. Neuropsychopharmacology: proceedings of the tenth congress of the Collegium International Neuropsychopharmacologicum. Plenum; New York: 1978. pp. 1477–1484. [Google Scholar]
- 33.Goldberg SR. Comparable behavior maintained under fixed-ratio and second-order schedules of food presentation, cocaine injection or d -amphetamine injection in the squirrel monkey. J Pharmacol Exp Ther. 1973;186:18–30. [PubMed] [Google Scholar]
- 34.Goldberg SR, Woods JH, Schuster CR. Morphine: conditioned increases in self-administration in rhesus monkeys. Science. 1969;166:1306–1307. doi: 10.1126/science.166.3910.1306. [DOI] [PubMed] [Google Scholar]
- 35.Gratton A, Wise RA. Drug- and behavior-associated changes in dopamine-related electrochemical signals during intravenous cocaine self-administration in rats. J Neurosci. 1994;14:4130–4146. doi: 10.1523/JNEUROSCI.14-07-04130.1994. [DOI] [PMC free article] [PubMed] [Google Scholar]
- 36.Green JD. A simple microelectrode for recording from the central nervous system. Nature. 1958;182:962. doi: 10.1038/182962a0. [DOI] [PubMed] [Google Scholar]
- 37.Griffiths RR, Bigelow GE, Henningfield JE. Similarities in animal and human drug taking behavior. In: Mello NK, editor. Advances in substance abuse: behavioral and biological research, I. JAI; Greenwich, CT: 1980. pp. 1–90. [Google Scholar]
- 38.Griffiths RR, Brady JV, Bradford LD. Predicting the abuse liability of drugs with animal drug self-administration procedures: psychomotor stimulants and hallucinogens. In: Thompson T, Dews PB, editors. Advances in behavioral pharmacology, II. Academic; New York: 1979. pp. 163–208. [Google Scholar]
- 39.Henriksen SJ, Callaway CW, Negus SS, Koob GF, Miller DE, Berg GI, Friedman LR, Engberg CC. Properties of neurons recorded in the rodent nucleus accumbens, in vivo: relationship to behavioral state and heroin self-administration. Soc Neurosci Abstr. 1992;18:373. [Google Scholar]
- 40.Hodgson R, Rankin H, Stockwell T. Alcohol dependence and the priming effect. Behav Res Ther. 1979;17:379–387. doi: 10.1016/0005-7967(79)90009-3. [DOI] [PubMed] [Google Scholar]
- 41.Hubner CB, Moreton JE. Effects of selective D1 and D2 dopamine antagonists on cocaine self-administration in the rat. Psychopharmacology. 1991;105:151–156. doi: 10.1007/BF02244301. [DOI] [PubMed] [Google Scholar]
- 42.Hurd YL, Weiss F, Koob GF, Anden N-E, Ungerstedt U. Cocaine reinforcement and extracellular DA overflow in rat NAcc: an in vivo microdialysis study. Brain Res. 1989;498:199–203. doi: 10.1016/0006-8993(89)90422-8. [DOI] [PubMed] [Google Scholar]
- 43.Iglaur C, Woods JH. Concurrent performances: reinforcement by different doses of intravenous cocaine in rhesus monkeys. J Exp Anal Behav. 1974;22:179–196. doi: 10.1901/jeab.1974.22-179. [DOI] [PMC free article] [PubMed] [Google Scholar]
- 44.Iversen SD, Koob GF. Behavioral implications of dopaminergic neurons in the mesolimbic system. In: Costa E, Gessa GL, editors. Advances in biochemical psychopharmacology, Vol. 16. Raven; New York: 1977. pp. 209–214. [PubMed] [Google Scholar]
- 45.Jaffe JH, Cascella NG, Kumor KM, Sherer MA. Cocaine-induced cocaine craving. Psychopharmacology. 1989;97:59–64. doi: 10.1007/BF00443414. [DOI] [PubMed] [Google Scholar]
- 46.Javaid JL, Davis JM. Cocaine disposition in discrete regions of rat brain. Biopharm Drug Dispos. 1993;14:365–370. doi: 10.1002/bdd.2510140408. [DOI] [PubMed] [Google Scholar]
- 47.Johanson CE, Schuster CR. A choice procedure for drug reinforcers: cocaine and methylphenidate in the rhesus monkey. J Pharmacol Exp Ther. 1975;193:676–688. [PubMed] [Google Scholar]
- 48.Kelley AE, Stinus L. Disappearance of hoarding behavior after 6-hydroxydopamine lesions of the mesolimbic dopamine neurons and its reinstatement with l-dopa. Behav Neurosci. 1985;99:531–545. doi: 10.1037//0735-7044.99.3.531. [DOI] [PubMed] [Google Scholar]
- 49.Kiyatkin EA, Wise RA, Gratton A. Drug- and behavior-associated changes in dopamine-related electrochemical signals during intravenous self-administration in rats. Synapse. 1993;14:60–72. doi: 10.1002/syn.890140109. [DOI] [PubMed] [Google Scholar]
- 50.Koob GF, Le HT HT, Creese I. The D1 receptor antagonist SCH 23390 increases cocaine self-administration in the rat. Neurosci Lett. 1987;79:315–320. doi: 10.1016/0304-3940(87)90451-4. [DOI] [PubMed] [Google Scholar]
- 51.Kosobud AEK, Harris GC, Chapin JK. Behavioral associations of neuronal activity in the ventral tegmental area of the rat. J Neurosci. 1994;14:7117–7129. doi: 10.1523/JNEUROSCI.14-11-07117.1994. [DOI] [PMC free article] [PubMed] [Google Scholar]
- 52.Kramer JC, Fischman VS, Littlefield DC. Amphetamine abuse: patterns and effects of high doses taken intravenously. JAMA. 1967;201:89–93. doi: 10.1001/jama.201.5.305. [DOI] [PubMed] [Google Scholar]
- 53.Lamb RJ, Preston KL, Schindler CW, Meisch RA, Davis F, Katz L, Henningfield E, Goldberg SR. The reinforcing and subjective effects of morphine in post-addicts: a dose-response study. J Pharmacol Exp Ther. 1991;259:1165–1173. [PubMed] [Google Scholar]
- 54.Le Moal M, Stinus L, Simon H, Tassin JP, Thierry AM, Blanc G, Glowinski J, Cardo B. Behavioral effects of a lesion in the ventral mesencephalic tegmentum: evidence for involvement of A10 dopaminergic neurons. In: Costa E, Gessa GL, editors. Advances in biochemical psychopharmacology, Vol. 16. Raven; New York: 1977. pp. 237–245. [PubMed] [Google Scholar]
- 55.Ljungberg T, Apicella P, Schultz W. Responses of monkey, dopamine neurons during learning of behavioral reactions. J Neurophysiol. 1992;67:145–163. doi: 10.1152/jn.1992.67.1.145. [DOI] [PubMed] [Google Scholar]
- 56.Lyness WH, Friedle NM, Moore KE. Destruction of dopaminergic nerve terminals in nucleus accumbens: effect on d -amphetamine self-administration. Pharmacol Biochem Behav. 1979;11:553–556. doi: 10.1016/0091-3057(79)90040-6. [DOI] [PubMed] [Google Scholar]
- 57.McGregor A, Roberts DCS. Dopaminergic antagonism within the nucleus accumbens or the amygdala produces differential effects on intravenous cocaine self-administration under fixed and progressive ratio schedules of reinforcement. Brain Res. 1993;624:245–252. doi: 10.1016/0006-8993(93)90084-z. [DOI] [PubMed] [Google Scholar]
- 58.Meyer RE, Mirin SM. The heroin stimulus: implications for a theory of addiction, Plenum; New York: 1979. Operant analysis. pp. 61–91. [Google Scholar]
- 59.Misra AL, Pontani RB, Mulé SJ. [3H]-norcocaine and [3H]-pseudococaine: effect of n-demethylation and C2-epimerization of cocaine on its pharmacokinetics in the rat. Experientia. 1976;15:895–897. doi: 10.1007/BF02003753. [DOI] [PubMed] [Google Scholar]
- 60.Mogenson GJ, Jones DL, Yim CY. From motivation to action: functional interface between the limbic system and the motor system. Prog Neurobiol. 1980;14:69–97. doi: 10.1016/0301-0082(80)90018-0. [DOI] [PubMed] [Google Scholar]
- 61.Nayak PK, Misra AL, Mulé SJ. Physiological disposition and biotransformation of [3H]cocaine in acutely and chronically treated rats. J Pharmacol Exp Ther. 1976;196:556–569. [PubMed] [Google Scholar]
- 62.Nicolaysen LC, Pan H-T, Justice JB., Jr Extracellular cocaine and dopamine concentrations are linearly related in rat striatum. Brain Res. 1988;456:317–323. doi: 10.1016/0006-8993(88)90234-x. [DOI] [PubMed] [Google Scholar]
- 63.Nishino H, Ono T, Muramoto K, Fukuda M, Saski K. Neuronal activity in the ventral tegmental area (VTA) during motivated bar press feeding in the monkey. Brain Res. 1987;413:302–313. doi: 10.1016/0006-8993(87)91021-3. [DOI] [PubMed] [Google Scholar]
- 64.Overton DA. Applications and limitations of the drug discrimination method for the study of drug abuse. In: Bozarth MA, editor. Methods of assessing the reinforcing properties of abused drugs. Springer; New York: 1987. pp. 291–340. [Google Scholar]
- 65.Paxinos G, Watson C. Academic; New York: 1986. The rat brain in stereotaxic coordinates. . [DOI] [PubMed] [Google Scholar]
- 66.Peoples LL, Wolske M, Dworkin SI, Smith JE, Deadwyler SA, West MO. A method for recording single unit activity during i.v. self-administration of drugs in the freely moving rat. Soc Neurosci Abstr. 1989;15:1097. [Google Scholar]
- 67.Peoples LL, Bibi R, West MO (1994) Effects of intravenous self-administered cocaine on single cell activity in the nucleus accumbens of the rat. In: Problems of drug dependence, 1993: proceedings of the 55th annual scientific meeting. The College on Problems of Drug Dependence Inc., Vol II, National Institute on Drug Abuse Research monograph #141 (Harris L, ed), pp 326. Washington, DC: US GPO.
- 68.Pettit HO, Justice JB., Jr DA in the NAcc during cocaine self-administration as studied by in vivo microdialysis. Pharmacol Biochem Behav. 1989;34:899–904. doi: 10.1016/0091-3057(89)90291-8. [DOI] [PubMed] [Google Scholar]
- 69.Pettit HO, Justice JB., Jr Effect of dose on cocaine self-administration behavior and DA levels in the NAcc. Brain Res. 1991;539:94–102. doi: 10.1016/0006-8993(91)90690-w. [DOI] [PubMed] [Google Scholar]
- 70.Pettit HO, Ettenberg A, Bloom FE, Koob GF. Destruction of dopamine in the nucleus accumbens selectively attenuates cocaine but not heroin self-administration in rats. Psychopharmacology. 1984;84:167–173. doi: 10.1007/BF00427441. [DOI] [PubMed] [Google Scholar]
- 71.Phillips AG, Broekkamp CLE, Fibiger HC. Strategies for studying the neurochemical substrates of drug reinforcement in rodents. Prog Neuropsychopharmacol Biol Psychiatry. 1983;7:585–590. doi: 10.1016/0278-5846(83)90029-5. [DOI] [PubMed] [Google Scholar]
- 72.Phillips AG, Pfaus JG, Blaha CD. Dopamine and motivated behavior: insights provided by in vivo analyses. In: Willner P, Scheel-Kruger J, editors. The mesolimbic dopamine system: from motivation to action. Wiley; New York: 1991. pp. 199–224. [Google Scholar]
- 73.Pickens R, Harris WC. Self-administration of d -amphetamine by rats. Psychopharmacology. 1968;12:158–163. doi: 10.1007/BF00401545. [DOI] [PubMed] [Google Scholar]
- 74.Pickens R, Thompson T. Cocaine-reinforced behavior in rats: effects of reinforcement magnitude and fixed-ratio size. J Pharmacol Exp Ther. 1968;161:122–129. [PubMed] [Google Scholar]
- 75.Pickens R, Meisch A, Thompson T. Drug self-administration: an analysis of the reinforcing effects of drugs. In: Iversen LL, Iversen SD, Snyder SH, editors. Handbook of psychopharmacology, Vol. 12. Plenum; New York: 1978. pp. 1–37. [Google Scholar]
- 76.Qiao J-T, Dougherty PM, Wiggins RC, Dafny N. Effects of microiontophoretic application of cocaine, alone and with receptor antagonists, upon the neurons of the medial prefrontal cortex, nucleus accumbens and caudate nucleus of rats. Neuropharmacology. 1990;29:379–385. doi: 10.1016/0028-3908(90)90098-c. [DOI] [PubMed] [Google Scholar]
- 77.Rebec GV, Zimmerman KS. Opposite effects of d -amphetamine on spontaneous neuronal activity in the neostriatum and nucleus accumbens. Brain Res. 1980;201:485–491. doi: 10.1016/0006-8993(80)91058-6. [DOI] [PubMed] [Google Scholar]
- 78.Rebec GV, Bashore TR, Zimmerman KS, Alloway KD. “Classical” and “atypical” antipsychotic drugs: differential antagonism of amphetamine- and apomorphine-induced alterations of spontaneous neuronal activity in the neostriatum and nucleus accumbens. Pharmacol Biochem Behav. 1979;11:529–538. doi: 10.1016/0091-3057(79)90036-4. [DOI] [PubMed] [Google Scholar]
- 79.Risner ME, Jones BE. Role of noradrenergic and dopaminergic processes in amphetamine self-administration. Pharmacol Biochem Behav. 1976;5:477–482. doi: 10.1016/0091-3057(76)90113-1. [DOI] [PubMed] [Google Scholar]
- 80.Risner ME, Jones BE. Intravenous self-administration of cocaine and norcocaine by dogs. Psychopharmacology. 1980;71:83–89. doi: 10.1007/BF00433258. [DOI] [PubMed] [Google Scholar]
- 81.Robbins TW, Everitt BJ. Functional studies of the central catecholamines. In: Smythies JR, Bradley RJ, editors. International review of neurobiology, Vol. 23. Academic; New York: 1982. pp. 303–365. [DOI] [PubMed] [Google Scholar]
- 82.Roberts DCS, Koob GF. Disruption of cocaine self-administration following 6-hydroxydopamine lesions of the ventral tegmental area in rats. Pharmacol Biochem Behav. 1982;17:901–904. doi: 10.1016/0091-3057(82)90469-5. [DOI] [PubMed] [Google Scholar]
- 83.Roberts DCS, Vickers G. Atypical neuroleptics increase self-administration of cocaine: an evaluation of a behavioral screen for antipsychotic activity. Psychopharmacology. 1984;82:135–139. doi: 10.1007/BF00426397. [DOI] [PubMed] [Google Scholar]
- 84.Roberts DCS, Corcoran ME, Fibiger HC. On the role of ascending catecholaminergic systems in intravenous self-administration of cocaine. Pharmacol Biochem Behav. 1977;6:615–620. doi: 10.1016/0091-3057(77)90084-3. [DOI] [PubMed] [Google Scholar]
- 85.Roberts DCS, Koob GF, Klonoff P, Fibiger HC. Extinction and recovery of cocaine self-administration following 6-hydroxydopamine lesions of the nucleus accumbens. Pharmacol Biochem Behav. 1980;12:781–787. doi: 10.1016/0091-3057(80)90166-5. [DOI] [PubMed] [Google Scholar]
- 86.Roberts DCS, Loh EA, Vickers G. Self-administration of cocaine on a progressive ratio schedule in rats: dose-response relationship and effect of haloperidol pretreatment. Psychopharmacology. 1989;97:535–538. doi: 10.1007/BF00439560. [DOI] [PubMed] [Google Scholar]
- 87.Robinson TE, Berridge KC. The neural basis of drug craving: an incentive-sensitization theory of addiction. Brain Res Rev. 1993;18:247–291. doi: 10.1016/0165-0173(93)90013-p. [DOI] [PubMed] [Google Scholar]
- 88.Robledo P, Maldonado-Lopez R, Koob GF. Role of dopamine receptors in the nucleus accumbens in the rewarding properties of cocaine. Ann NY Acad Sci. 1992;654:509–512. doi: 10.1111/j.1749-6632.1992.tb26015.x. [DOI] [PubMed] [Google Scholar]
- 89.Romo R, Schultz W. Dopamine neurons of the monkey midbrain: contingencies of responses to active touch during self-initiated arm movements. J Neurophysiol. 1990;63:592–606. doi: 10.1152/jn.1990.63.3.592. [DOI] [PubMed] [Google Scholar]
- 90.Salamone JD. Complex motor and sensorimotor functions of striatal and accumbens dopamine: involvement in instrumental behavior processes. Psychopharmacology. 1992;107:160–174. doi: 10.1007/BF02245133. [DOI] [PubMed] [Google Scholar]
- 91.Schultz W. Responses of midbrain dopamine neurons to behavioral trigger stimuli in the monkey. J Neurophysiol. 1986;56:1439–1461. doi: 10.1152/jn.1986.56.5.1439. [DOI] [PubMed] [Google Scholar]
- 92.Schultz W, Apicella P, Scarnati E, Ljungberg T. Neuronal activity in monkey ventral striatum related to the expectation of reward. J Neurosci. 1992;12:4595–4610. doi: 10.1523/JNEUROSCI.12-12-04595.1992. [DOI] [PMC free article] [PubMed] [Google Scholar]
- 93.Schultz W, Apicella P, Ljungberg T, Romo R, Scarnati E. Reward-related activity in the monkey striatum and substantia nigra. In: Arbuthnott GW, Emson PC, editors. Progress in brain research, Vol. 99. Elsevier; New York: 1993. pp. 227–235. [DOI] [PubMed] [Google Scholar]
- 94.Schuster CR, Woods JH, Seevers MH. Self-administration of central stimulants by the monkey. In: Sjöqvist F, Tottie M, editors. Abuse of central stimulants. Raven; New York: 1968. pp. 339–347. [Google Scholar]
- 95.Seevers MH, Schuster CR. Self-administration of psychoactive drugs by the monkey: a measure of psychological dependence. Science. 1967;158:535. doi: 10.1126/science.158.3800.535. [DOI] [PubMed] [Google Scholar]
- 96.Siegel S. McGraw-Hill; New York: 1956. Nonparametric statistics for the behavioral sciences. . [Google Scholar]
- 97.Stewart J, deWit H. Reinstatement of drug-taking behavior as a method of assessing incentive motivational properties of drugs. In: Bozarth MA, editor. Methods of assessing the reinforcing properties of abused drugs. Springer; New York: 1987. pp. 211–228. [Google Scholar]
- 98.Stewart J, deWit H, Eikelbloom R. Role of unconditioned and conditioned drug effects in the self-administration of opiates and stimulants. Psychol Rev. 1984;91:251–268. [PubMed] [Google Scholar]
- 99.Stretch R, Gerber GJ. Drug-induced reinstatement of amphetamine self-administration behavior in monkeys. Can J Psychol. 1973;27:168–177. doi: 10.1037/h0082466. [DOI] [PubMed] [Google Scholar]
- 100.Welling PG. American Chemical Society; Washington, DC: 1986. Pharmacokinetics processes and mathematics. ACS monograph 185. . [Google Scholar]
- 101.West MO, Peoples LL, Wolske M, Dworkin SI. Psychomotor stimulant effects on single neurons in awake, behaving rats. In: Brown R, Frascella J, editors. Neurobiological approaches to brain-behavior interaction. National Institute on Drug Abuse Research monograph series #124. US GPO; Washington, DC: 1992. pp. 57–71. [PubMed] [Google Scholar]
- 102.Whishaw IQ, Kornelsen RA. Two types of motivation revealed by ibotenic acid nucleus accumbens lesions: dissociation of food carrying and hoarding and the role of primary and incentive motivation. Behav Brain Res. 1993;55:283–295. doi: 10.1016/0166-4328(93)90123-8. [DOI] [PubMed] [Google Scholar]
- 103.White FJ, Wachtel SR, Johansen PA, Einhorn LC. Electrophysiological studies of the rat mesoaccumbens dopamine system: focus on dopamine receptor subtypes, interactions, and the effects of cocaine. In: Chiodo LA, Presman AS, editors. Neurophysiology of dopaminergic systems—current status and clinical perspectives. Lakeshore; Grosse Pointe, MI: 1987. pp. 317–365. [Google Scholar]
- 104.White FJ, Henry DJ, Hu X-T, Jeziorski M, Ackerman JM. Electrophysiological effects of cocaine in the mesoaccumbens dopamine system. In: Lakoski JM, Galloway MP, White FJ, editors. Cocaine pharmacology, physiology, and clinical strategies. CRC; Boca Raton, FL: 1992. pp. 261–293. [Google Scholar]
- 105.White FJ, Hu X-T, Henry DJ. Electrophysiological effects of cocaine in the rat nucleus accumbens: microiontophoretic studies. J Pharmacol Exp Ther. 1993;266:1075–1083. [PubMed] [Google Scholar]
- 106.Wilson MC, Schuster CR. The effects of chlorpromazine on psychomotor stimulant self-administration in the rhesus monkey. Psychopharmacology (Berl) 1972;26:115–126. doi: 10.1007/BF00422098. [DOI] [PubMed] [Google Scholar]
- 107.Wilson MC, Schuster CR. Aminergic influences on intravenous cocaine self-administration by rhesus monkeys. Pharmacol Biochem Behav. 1974;2:563–571. doi: 10.1016/0091-3057(74)90021-5. [DOI] [PubMed] [Google Scholar]
- 108.Wilson MC, Hitomi M, Schuster CR. Psychomotor stimulant self-administration as a function of dosage per injection in the rhesus monkey. Psychopharmacology (Berl) 1971;22:271–281. doi: 10.1007/BF00401789. [DOI] [PubMed] [Google Scholar]
- 109.Winger G, Woods JH. Comparison of fixed-ratio and progressive-ratio schedules of maintenance of stimulant drug-reinforced responding. Drug Alcohol Depend. 1985;15:123–130. doi: 10.1016/0376-8716(85)90036-5. [DOI] [PubMed] [Google Scholar]
- 110.Wise RA. Intravenous drug self-administration: a special case of positive reinforcement. In: Bozarth MA, editor. Methods of assessing the reinforcing properties of abused drugs. Springer; New York: 1987. pp. 117–141. [Google Scholar]
- 111.Wise RA, Bozarth MA. A psychomotor stimulant theory of addiction. Psychol Rev. 1987;94:469–492. [PubMed] [Google Scholar]
- 112.Wise RA, Yokel RA, Hansson PA, Gerber GJ. Concurrent intracranial self-stimulation and amphetamine self-administration in rats. Pharmacol Biochem Behav. 1977;7:459–461. doi: 10.1016/0091-3057(77)90214-3. [DOI] [PubMed] [Google Scholar]
- 113.Wise RA, Newton P, Leeb K, Burnette B, Pocock D, Justice JB., Jr Fluctuations in nucleus accumbens dopamine concentration during intravenous cocaine self-administration in rats. Psychopharmacology. 1995;120:10–20. doi: 10.1007/BF02246140. [DOI] [PubMed] [Google Scholar]
- 114.Woodruff GN, McCarthy PS, Walker RJ. Studies on the pharmacology of neurons in the nucleus accumbens of the rat. Brain Res. 1976;115:233–242. doi: 10.1016/0006-8993(76)90509-6. [DOI] [PubMed] [Google Scholar]
- 115.Woods JH, Schuster CR. Reinforcement properties of morphine, cocaine and SPA as a function of unit dose. Int J Addict. 1968;3:231–237. [Google Scholar]
- 116.Woolverton WL, Goldberg LI, Ginos JZ. Intravenous self-administration of dopamine receptor agonists by rhesus monkeys. J Pharmacol Exp Ther. 1984;230:678–683. [PubMed] [Google Scholar]
- 117.Yang CR, Mogenson GJ. Electrophysiological responses of neurones in the nucleus accumbens to hippocampal stimulation and the attenuation of the excitatory responses by the mesolimbic dopaminergic system. Brain Res. 1984;324:69–84. doi: 10.1016/0006-8993(84)90623-1. [DOI] [PubMed] [Google Scholar]
- 118.Yokel RA, Pickens R. Self-administration of optical isomers of amphetamine and methylamphetamine by rats. J Pharmacol Exp Ther. 1973;187:27–33. [PubMed] [Google Scholar]
- 119.Yokel RA, Pickens R. Drug level ofd- and l-amphetamine during intravenous self-administration. Psychopharmacology (Berl) 1974;34:255–264. doi: 10.1007/BF00421966. [DOI] [PubMed] [Google Scholar]
- 120.Yokel RA, Pickens R. Extinction responding following amphetamine self-administration: determination of reinforcement magnitude. Physiol Psychol. 1976;4:39–42. [Google Scholar]
- 121.Yokel RA, Wise RA. Increased lever-pressing for amphetamine after pimozide in rats: implications for a dopamine theory of reward. Science. 1975;187:547–549. doi: 10.1126/science.1114313. [DOI] [PubMed] [Google Scholar]
- 122.Yokel RA, Wise RA. Attenuation of intravenous amphetamine reinforcement by central dopamine blockade in rats. Psychopharmacology. 1976;48:311–318. doi: 10.1007/BF00496868. [DOI] [PubMed] [Google Scholar]
- 123.Yokel RA, Wise RA. Amphetamine-type reinforcement by dopaminergic agonists in the rat. Psychopharmacology. 1978;58:289–296. doi: 10.1007/BF00427393. [DOI] [PubMed] [Google Scholar]
- 124.Young AM, Herling S. Drugs as reinforcers: studies in laboratory animals. In: Goldberg SR, Stolerman IP, editors. Behavioral analysis of drug dependence. Academic; New York: 1986. pp. 9–67. [Google Scholar]
- 125.Zahm DS, Brog JS. On the significance of subterritories in the “accumbens” part of the rat ventral striatum. Neuroscience. 1992;50:751–767. doi: 10.1016/0306-4522(92)90202-d. [DOI] [PubMed] [Google Scholar]
- 126.Zito KA, Vickers G, Roberts DCS (1985) Disruption of cocaine and heroin self-administration following kainic acid lesions of the nucleus accumbens. Pharmacol Biochem Behav 23:1029–1036. [DOI] [PubMed]