

Abstract
Dendritic microtubules (MTs) are nonuniform with respect to polarity orientation, with roughly equal proportions having a plus-end-distal or minus-end-distal orientation. In the present studies, we have microinjected biotin-labeled tubulin (Bt–tub) into cultured sympathetic neurons extending dendrites to explore the contribution of MT assembly to the elaboration and maintenance of the dendritic MT array. Within minutes of injecting Bt–tub, an enormous number of MTs were seen emanating from a point source in the cell body. Over time, this pattern changed such that by 120 min after injection, biotinylated MTs no longer emanated from a discrete site, but were distributed over a broad region that extended from the cell body into the dendrites. The observation that biotinylated MTs emanate from a point source in the soma at relatively short times after injection, but not at longer times, suggests that they undergo a redistribution subsequent to their initial nucleation rather than a simple radial expansion from the somal nucleation site. Bt–tub assembly also occurred in dendrites but, unlike in the cell body, assembly was dispersed throughout the dendrite rather than emanating from a discrete site. Immunoelectron microscopic analyses revealed that assembly in dendrites reflected the addition of Bt–tub onto the ends of both plus-end-distal and minus-end-distal MTs that existed in the cell at the time of injection. The time course of Bt–tub appearance in dendritic MTs suggested an average half-life of ∼76 min for these MTs. We discuss these observations in the context of a model for generating the MT array of dendrites that combines both MT transport and MT assembly.
Keywords: cultured sympathetic neurons, microtubules, microtubule turnover, dendrites, microinjection, biotin–tubulin
The mechanisms for generating the microtubule (MT) array in axons have been studied intensively. Although controversy remains regarding these mechanisms, one model for which considerable support exists invokes a combination of MT transport and MT assembly (for review, see Black, 1994; Baas and Yu, 1996). In this model, MTs are generated in the cell body, specifically by the centrosome, after which they are released and then transported into the axon. The MT transport mechanisms convey MTs specifically with their plus ends leading, thereby establishing the plus-end-distal polarity orientation of axonal MTs. The detailed arrangement of MTs in the axon is then modulated locally by MT assembly mechanisms, which influence the number and length of MTs available for transport. In this manner, MT assembly and transport cooperate to shape the MT array of the axon.
Comparatively less is known about the mechanisms that generate the MT array in dendrites. The MT array of dendrites differs in several respects from that of axons. Most notably, in axons, MTs have a uniform plus-end-distal polarity orientation, whereas in dendrites, MTs are mixed in polarity orientation, with approximately equal numbers having a plus-end-distal or minus-end-distal orientation (Baas et al., 1988;Burton, 1988). Thus, transport of MTs with just their plus ends or minus ends leading is not sufficient to establish the dendritic MT array. Nonetheless, recent studies suggest that MT transport is important in this process. Specifically, Sharp et al. (1995) examined dendritic differentiation by cultured hippocampal neurons treated with vinblastine to block MT assembly. Vinblastine was added to stage 3 neurons, which have an axon and several minor processes that are dendritic precursors (Dotti et al., 1988). MTs in the minor processes are uniformly plus-end-distal in orientation, and under normal conditions minus-end-distal MTs appear in these processes coordinately with their differentiation into dendrites (Baas et al., 1989). Sharp et al. (1995) found that in the apparent absence of MT assembly, minor processes differentiated into dendrites containing both plus-end-distal and minus-end-distal MTs. The appearance of minus-end-distal MTs in the nascent dendrites presumably reflects their transport from the cell body.
Although this latter study emphasizes MT transport in the generation of the MT array of dendrites, it does not address the issue of MT assembly. Indirect evidence that dendritic MTs are nucleated in the cell body derives from the observation that γ-tubulin has been detected in the cell body of neurons, but not in their axons or dendrites (Baas and Joshi, 1992). In many cell types, including neurons, γ-tubulin is a component of the centrosome and is essential for nucleating new MTs from tubulin subunits (for review, see Oakley, 1994). Thus, the localization of γ-tubulin in neurons suggests that all MTs, including those in axons and dendrites, are nucleated in the cell body, at the centrosome (Baas and Joshi, 1992). Subsequent studies have confirmed the importance of the centrosome for nucleating axonal MTs (Ahmad et al., 1994). However, its importance for nucleating dendritic MTs has not been studied and thus remains inferential. Furthermore, the extent to which new MTs can be generated in the dendrite itself by nucleated or spontaneous assembly has not been determined. Direct analyses of the role of MT assembly in the elaboration of the dendritic MT array are required to address these issues, and that is our goal in the present studies. We used biotin-labeled tubulin (Bt–tub) as a probe to visualize MT assembly in the somatodendritic compartment of neurons actively extending dendrites.
MATERIALS AND METHODS
Materials. Culture media were obtained from Life Technologies (Grand Island, NY). Supplements for culture media were obtained from either Life Technologies or Sigma (St. Louis, MO), except for nerve growth factor, which was purified from mouse salivary glands according to Mobley et al. (1976). Other reagents were obtained from Sigma unless otherwise indicated.
Cell culture. Rat sympathetic neurons were grown on glass coverslips coated with poly-l-lysine and laminin (obtained from Collaborative Biomedical Products, Bedford, MA) as described previously (Brown et al., 1992), except with the following modifications designed to promote dendritic growth. Cells were plated out in serum-free medium containing the N2 supplements as described. Beginning on the day after treatment, serum was added to the medium to 1%. Also, cytosine arabinoside was added to a 4 μmconcentration to eliminate non-neuronal cells; this treatment was continued as long as necessary, usually 1 week. Beginning on the third day after plating, the cells were fed with the N2-based medium supplemented with 10% serum. This medium was used for all subsequent feedings, which occurred 3 times per week. In addition, beginning on the third day after plating and at weekly intervals thereafter, the medium was also supplemented with a 1:600 dilution of the stock matrigel obtained from Collaborative Biomedical Products. This had a slight enhancing effect on dendritic differentiation (Higgins et al., 1991) and also enhanced the tolerance of the cells to the mechanical manipulations associated with the extraction, fixation, and immunostaining procedures described below.
The rate of growth of dendrites was relatively slow; after 2–3 weeks in culture, most dendrites ranged from 100 to 250 μm in length. By comparison, axons were several millimeters in length by this time (Peng et al., 1986). Although we did not attempt to measure the growth rate of dendrites over this time period, dendrites typically appeared between 5 and 7 d in culture, and their length clearly increased over the next week in culture. It was difficult to evaluate whether length continued to increase beyond this time because of the overall complexity of the cultures. However, the overall girth of the dendrites continued to increase between 2 and 3 weeks in culture.
Microinjection of biotinylated tubulin. Tubulin was purified from calf brain as described by Mitchison and Kirschner (1984) and then biotinylated using biotin-N-hydroxysuccinimide ester (Molecular Probes, Eugene, OR) following the protocol of Hyman et al. (1991). After the final assembly step, the Bt–tub-containing MTs were depolymerized in injection buffer (50 mm potassium glutamate, 0.5 mm glutamic acid, 0.5 mmMgCl2, pH 6.5), clarified by centrifugation, and then stored in aliquots ranging in concentration from 19 to 32 mg/ml [protein was determined using the BCA assay (Pierce, Rockford, IL) using bovine serum albumin as a standard]. For storage, the Bt–tub was frozen in liquid N2 and then stored at −80°C. Immediately before use, the tubulin was thawed rapidly, diluted to the desired concentration with injection buffer (4.4 mg/ml unless otherwise indicated), and then clarified by centrifugation at 200,000 × g for 10 min in a Beckman TL-100 ultracentrifuge (Beckman Instruments, Palo Alto, CA) to remove protein aggregates. The clarified Bt–tub was then pressure-injected into cultured neurons using an Eppendorf injector (Hamburg, Germany) and micropipettes with a tip diameter ≤ 0.5 μm [pipettes were prepared immediately before use with a Sutter Instruments (Novato, CA) P-97 pipette puller].
In all of the studies presented here, neurons were used between 12 and 19 d after plating. Only neurons with well developed dendrites were selected for microinjection experiments. Typically, 100% of the neurons survived microinjection.
Cell extraction and fixation. To examine the incorporation of Bt–tub into cell body and dendritic MTs, cells microinjected with Bt–tub were processed at times ranging from ∼30 sec to 120 min after injection. Cells were extracted under conditions that remove unassembled tubulin and stabilize existing MTs (Black et al., 1994). Specifically, neurons were rinsed once with PBS and once with PHEM (60 mm PIPES, 25 mm HEPES, 10 mm EGTA, 2 mm MgCl2, pH 6.9; Schliwa and van Blerkom, 1981) and then extracted for 2 min with PHEM containing 10 μm Taxol (a gift from the National Cancer Institute), protease inhibitors (0.08 trypsin inhibitory units/ml aprotinin, and 10 μg/ml each of leupeptin, chymostatin, and antipain), 0.2% Triton X-100, and then for an additional 3 min with PHEM containing 10 μm Taxol, protease inhibitors, 0.2% Triton X-100, and 0.1 m NaCl. The inclusion of NaCl in the extraction buffer reduced the background staining caused by nonspecific sticking of first and second antibodies (Abs).
After extraction, the cells were fixed with PHEM containing 2% paraformaldehyde + 0.05% glutaraldehyde at room temperature for 10 min, rinsed with PBS, treated with three 5 min changes of sodium borohydride (10 mg/ml in a 1:1 mixture of PBS and methanol), rinsed with PBS again, and then double-stained for tubulin and Bt–tub as described below.
Immunofluorescence procedures. Fixed cells were incubated with blocking solution [PBS containing 0.3 m NaCl, 0.1% Triton X-100, and 10% (v/v) normal donkey serum] for 15 min just before incubation with primary Abs and again before incubation with secondary Abs. In addition, all Abs were diluted in blocking solution and then clarified before use by centrifugation at 200,000 × g for 10 min in a Beckman TL-100 ultracentrifuge. All secondary Abs were purchased from Jackson ImmunoResearch (West Grove, PA; AffiniPure grade, preadsorbed for minimum cross-reactivity).
To reveal biotinylated MTs and total MTs, neurons were incubated simultaneously with a mouse monoclonal Ab against β-tubulin (Amersham, Arlington Heights, IL) (Blose et al., 1984), diluted 1:100, and a rabbit polyclonal Ab against biotin (Enzo Biochemicals, New York, NY), diluted 1:100 for 45 min at 37°C. After extensive rinsing with PBS containing 0.3 m NaCl and 0.1% Triton X-100 and then reblocking, the cells were incubated with Lissamine-labeled donkey anti-rabbit Ab, diluted 1:200, and fluorescein-labeled donkey anti-mouse Ab, diluted 1:100 for 45 min at 37°C, rinsed extensively with PBS containing 0.3 m NaCl and 0.1% Triton X-100, rinsed once with PBS, and then mounted in 50% glycerol in PBS containing 10 mg/ml N-propylgalate.
Image acquisition and analysis. For analyses of the incorporation of Bt–tub into somatodendritic MTs, neurons were observed by epifluorescence microscopy using a Zeiss Axiovert 135 inverted microscope (Carl Zeiss, Thornwood, NY), and images were obtained with a CH250 cooled CCD camera (Photometrics, Tucson, AZ) equipped with a Thompson 7883 CCD chip. The details of the imaging system have been described previously (Brown et al., 1992; Black et al., 1994; Li and Black, 1996). Images were acquired using the full usable area of the CCD chip, which measured 382 × 576 pixels, and stored in full 12-bit format on magneto-optical disks using Pinnacle optical disk drives (Pinnacle Micro, Irvine, CA). Before capturing a series of images, an instantaneous readout of the bias voltage offset on the chip was saved and subsequently subtracted from each exposed image. Dark current [0.133 arbitrary analog-to-digital units (ADU)/sec] was not significant for the exposure times used in these studies. The magnification of the CCD images was calibrated using a stage micrometer. For maximum precision, all measurements of fluorescence intensity (see below) were performed on the 12-bit images. For presentation, images were scaled to 8 bits.
To evaluate the overall distribution of tubulin and Bt–tub, neurons were imaged using a 25×/0.8 numerical aperture (N.A.) or 40×/1.3 N.A. plan neofluar oil-immersion objectives to capture the entire length of the dendrites in single images. To examine microtubule staining for tubulin and Bt–tub at higher resolution, cells were imaged with a 100×/1.3 N.A. plan neofluar oil-immersion objective. We used the segmented mask procedure to quantify the intensity of tubulin and Bt–tub staining along the length of individual dendrites (Brown et al., 1992). Briefly, the β-tubulin image was used to generate a mask of the cell that extended from the cell body to the tip of the dendrite. The mask was divided into consecutive ∼3-μm-long segments beginning at one edge of the cell body (specifically the edge opposite the dendrite to be analyzed) and continuing into the dendrite to its tip. The segmented mask was then overlaid on the original fluorescent images depicting the distribution of Bt–tub and β-tubulin. This allowed us to define segments in the fluorescent images that corresponded to the segments in the mask. To correct for background fluorescence in each image, an average background pixel intensity was calculated for each segment and then subtracted from each pixel within that segment. Then the total fluorescence intensity for the segments in each image was calculated by summing the corrected intensities of the pixels comprising each segment. The fluorescence intensity of each segment, measured as arbitrary analog-to-digital units (ADU), was then plotted against distance along the axon (see Fig. 6). These procedures have been incorporated into a single interactive application program written in the Oncor Imaging programming language. A synopsis of these procedures is presented in Brown et al. (1992), and a more detailed description will be provided on request.
Fig. 6.
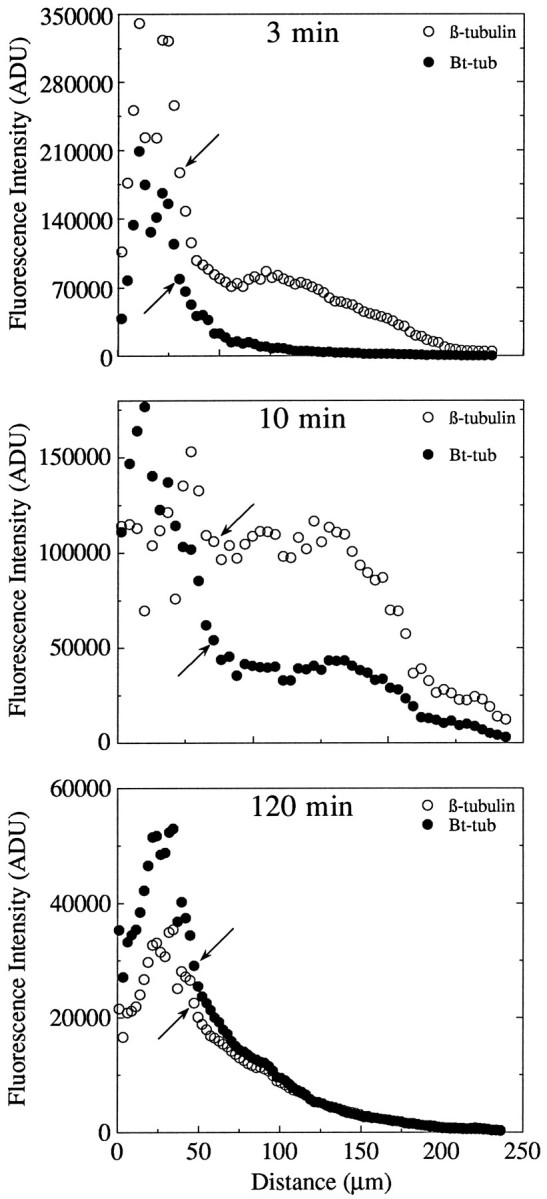
Analyses of the distribution of total MT polymer and Bt–tub-containing polymer in cells processed at 3, 10, and 120 min after injection. The data were obtained using the segmented mask procedure, and they depict the total fluorescence intensity attributable to β-tubulin in MTs (○) and Bt–tub in MTs (•) in consecutive ∼3-μm-long segments of the cell beginning at one edge of the cell body and continuing through the cell body to the tip of one of the dendrites. As a result, the proximal 50–75 μm of the intensity profiles depicts the fluorescence intensity through the cell body, whereas the remainder depicts the fluorescence intensity along the dendrite. The arrows identify the transition region between the cell body and dendrite.
In some cases, the intensity of MT staining for β-tubulin and Bt–tub was displayed with color using National Institutes of Health Image software. Images obtained as described above were scaled to 8 bits, saved in a TIFF format, and then imported into National Institutes of Health Image version 1.59. Fluorescence intensity in these images was then displayed with color using the Fire-1 look-up table. With this look-up table, white indicates the highest intensity, black indicates background, and shades of red, orange, and yellow indicate intermediate intensities with progressively higher values.
Immunoelectron microscopy. Cells were grown as described above and then injected with Bt–tub at a concentration of 19 mg/ml. At 10 or 120 min after injection, the cells were extracted for 5 min with PHEM containing 10 μm Taxol, 0.2% Triton X-100, and protease inhibitors (as described above), and then fixed by the addition of an equal volume of extraction buffer containing 1.0% glutaraldehyde. The cells were fixed for 10 min and then processed exactly as described in Baas and Black (1990), except that the primary Ab was a mouse monoclonal against biotin (Jackson ImmunoResearch) used at a dilution of 1:10, and the secondary Ab was a goat anti-mouse-conjugated to 5 nm gold particles (Amersham).
RESULTS
Our goal in the present studies was to evaluate the role of MT assembly in generating the MT array of the dendrite. Toward this end, we have microinjected Bt–tub into cultured sympathetic neurons actively extending dendrites as a probe to visualize sites of MT assembly in the cell body and dendrites of these cells. A major advantage of Bt–tub for these studies is that it can be used for both light and electron microscopic analyses. We used light microscopic analyses to obtain global views of Bt–tub assembly throughout the cell body and dendrites. Electron microscopic analyses were used to evaluate assembly at the level of individual MTs, in particular, to address whether assembly in dendrites occurs preferentially on the plus-end-distal or minus-end-distal MTs.
As a general caveat to this approach, we note that the injection of Bt–tub acutely alters the normal balance of assembled and unassembled tubulin within the neuron as well as the normal balance between tubulin and microtubule-associated proteins. To minimize the potential effects that these changes have on the parameters of MT assembly examined in the present studies, we attempted to microinject tracer amounts of Bt–tub into the neurons. We used relatively low concentrations of Bt–tub for microinjection, and the microinjection procedure itself produced minimal swelling of the cell. These are the same conditions that were used in previous experiments in which the amount of Bt–tub injected into the neurons represented a minority (≤10%) relative to the endogenous tubulin (Li and Black, 1996). Thus, we infer that the size of the tubulin pool was only modestly effected by injection of Bt–tub and, therefore, that the assembly of MTs in injected cells should reasonably approximate that in uninjected cells. This view is reinforced by the observations that qualitatively similar results were obtained in experiments injecting Bt–tub at concentrations ranging from 2 to 19 mg/ml.
Biotin–tubulin incorporation into MTs of the somatodendritic compartment
Figures 1, 2, 3, 4 show images of cells injected with Bt–tub and then processed at ∼30 sec, 2 min, 10 min, or 120 min, respectively, after injection. At relatively short times (≤3 min) after injection, Bt–tub was seen in short MT segments in the cell body and in the proximal 50–100 μm of the dendrites (Figs.1A, 2). By 10 min after injection, the amount of polymer-containing Bt–tub was substantially increased, and MTs containing Bt–tub were present throughout the cell body and the entire dendrite (Fig. 3). In cells processed at 10 min after injection, MTs containing Bt–tub overlapped extensively with each other, making it difficult to trace individual biotinylated MTs for any appreciable distance. Nonetheless, the MT segments containing Bt–tub at 10 min after injection clearly are longer than at 3 min (compare Figs.2D, 3D). We have estimated the growth rate of MTs based on the lengths of Bt–tub-containing MT segments in cells processed at ∼30 sec after injection (Fig. 1). This time period represents a minimal estimate of the interval between injection and the beginning of processing as described in Materials and Methods (actual processing time is between 30 and 60 sec) and, thus, these analyses provide a maximal estimate of MT growth rates. These analyses show similar growth rates of MTs in the cell body and the proximal part of dendrites. The average lengths of Bt–tub-containing polymer segments in the cell body and dendrites were 2.7 ± 1.3 and 3.7 ± 1.6 μm, respectively, corresponding to average growth rates of 5.4 and 7.4 μm/min. These rates are within the range reported for growing axons (Baas and Ahmad, 1992) and cultured non-neuronal cells (Schulze and Kirschner, 1986).
Fig. 1.
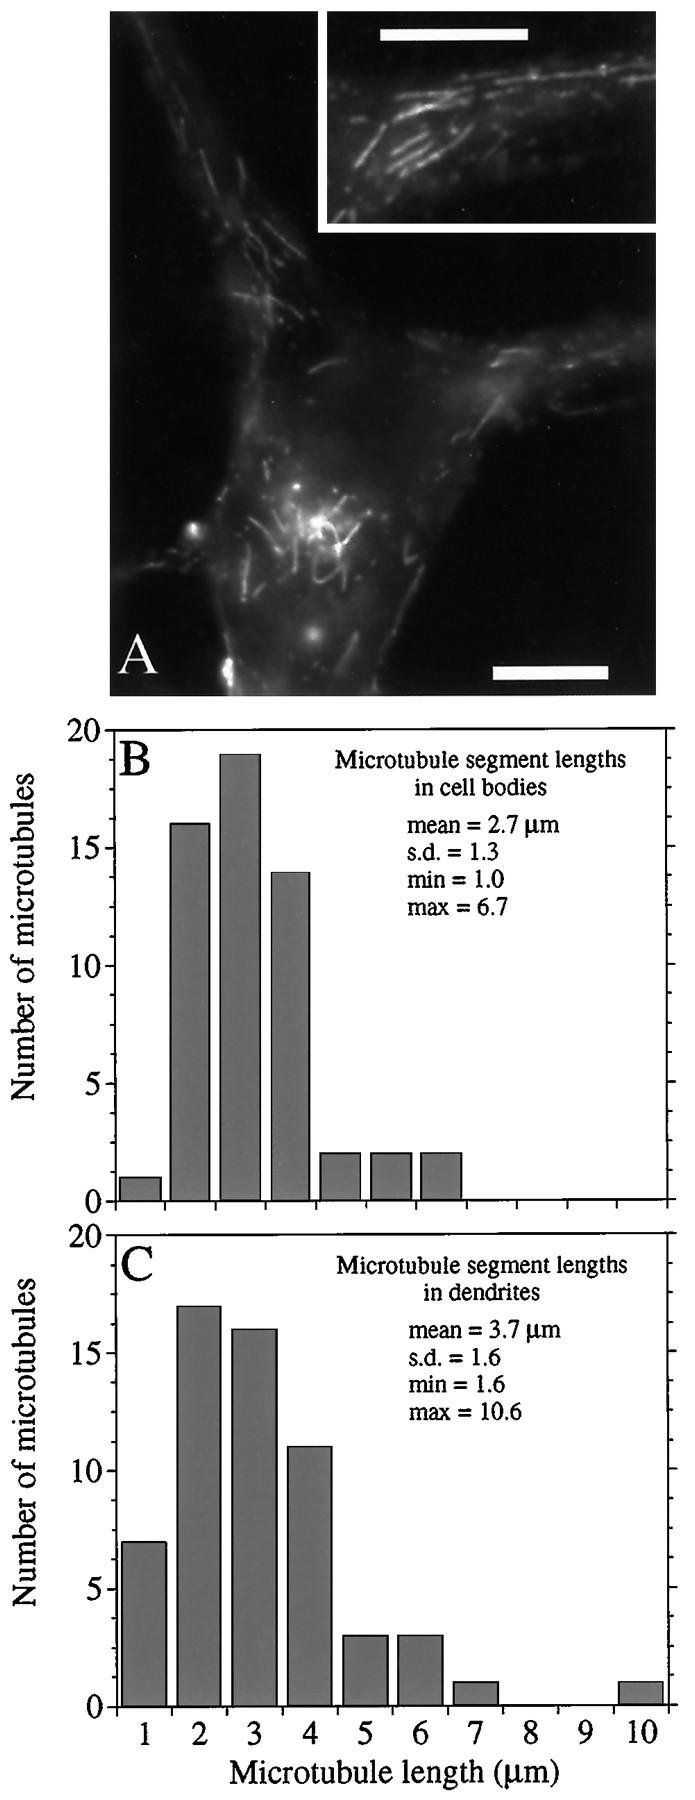
Bt–tub assembly into MTs ∼30 sec after injection. A, High-magnification view of the cell body of a neuron processed at ∼30 sec after injection of Bt–tub. Note the focus of assembly in the cell body and the Bt–tub-containing MT segments dispersed in the dendrites. The inset shows a blow-up of the proximal region of the dendrite extending to the right of the cell body. Scale bars, 13 μm. B,C, Histograms of the lengths of Bt–tub-containing MT segments in the cell body (B) or dendrite (C).
Fig. 2.

Low- and high-magnification views of a cell processed 3 min after injection. The staining patterns of total MTs, as revealed by β-tubulin staining, and biotinylated MTs, as revealed by biotin staining, are depicted in A and B, respectively; scale bar, 32 μm. C, D, High-magnification views of biotinylated MT staining in the cell body and one of the dendrites of this cell, respectively; scale bar, 13 μm. Note that an enormous number of relatively short biotinylated MT segments extend from a discrete site in the cell body. Many relatively short biotinylated MT segments are also in the dendrite, mostly in its proximal half, where they are dispersed throughout the cytoplasm.
Fig. 3.

Low- and high-magnification views of a cell processed 10 min after injection. The staining patterns of total MTs, as revealed by β-tubulin staining, and biotinylated MTs, as revealed by biotin staining, are depicted in A andB, respectively; scale bar, 32 μm. C,D, High-magnification views of biotinylated MT staining in the cell body and one of the dendrites of this cell, respectively; scale bar, 13 μm. A concentrated focus of biotinylated MTs is apparent in this cell, although overall Bt–tub staining of MTs in the cell body is much more extensive than in cells processed at ≤3 min after injection. Similarly, dendritic staining for Bt–tub in MTs is more extensive than at ≤3 min after injection, with staining extending to the dendrite tip. Also, the lengths of the Bt–tub-staining polymer in the dendrites of these cells are much greater than those observed in cells processed at ≤3 min after injection.
Fig. 4.

Low- and high-magnification views of a cell processed 120 min after injection. The staining patterns of total MTs, as revealed by β-tubulin staining, and biotinylated MTs, as revealed by biotin staining, are depicted in A andB, respectively; scale bar, 48 μm. C,D, High-magnification views of biotinylated MT staining in the cell body and one of the dendrites of this cell, respectively; scale bar, 13 μm. Staining for biotinylated MTs is extensive throughout the cell body and dendrites, with the overall pattern closely resembling that for total MTs.
We note that some axons in each field also stained for Bt–tub, although it is not apparent in the images shown. The amount of axonal staining was much less than that observed in dendrites. We presume that this difference in staining intensity reflects, at least in part, the fact that the axons are much thinner than the dendrites and, thus, the total amount of Bt–tub in the axons is much less than in dendrites. Because the exposure times used to obtain the images shown here were optimized for cell bodies and dendrites, and not for axons, the axonal staining is not revealed in these images.
Bt–tub incorporation into MTs in the cell body
Considerable cell-to-cell variation existed in the detailed patterns of Bt–tub staining of MTs in the soma of cells processed at times between 30 sec and 15 min after injection. Nonetheless, in most cells (40/45 cells), the incorporation of Bt–tub into MTs did not occur uniformly throughout the cytoplasm of the cell body. Rather, staining for MTs containing Bt–tub revealed a concentrated focus of assembly superimposed on a background of dispersed assembly (Figs.1, 2, 3). This was especially dramatic in cells processed between 30 sec and 3 min after injection, in which a relatively discrete region near the nucleus stained extremely brightly for Bt–tub and accounted for most of the Bt–tub-containing polymer in the cell body (Figs. 1, 2,5B,D). At high magnification (Figs.1A, 2C), this brightly stained region consisted of many short Bt–tub-containing MT segments that appeared to emanate from a discrete site. The density of MTs nucleated at this site was too great to permit counting using the immunofluorescence procedures used in the present studies. We suspect that this site corresponds to the centrosome. In addition to this concentrated focus of assembly, variable amounts of Bt–tub-containing MT segments were observed dispersed throughout the cytoplasm of the cell body. These polymer segments could reflect MTs nucleated at the centrosome and then released (Yu et al., 1993) or MT assembly occurring from dispersed sites in the cell body. Given the relatively short time course of these experiments, we suspect that much of this dispersed Bt–tub-containing polymer reflects local assembly attributable to the addition of Bt–tub onto the ends of preexisting MTs.
Fig. 5.
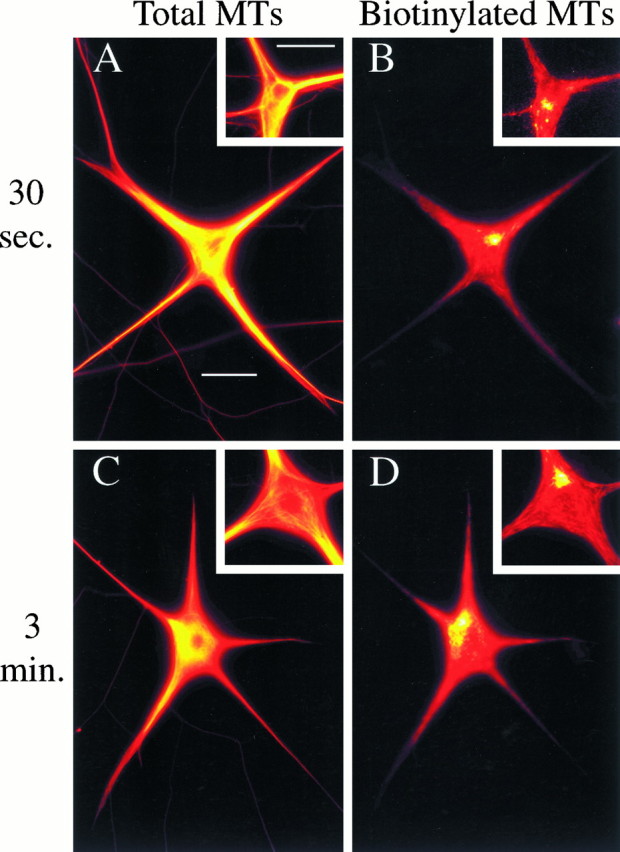
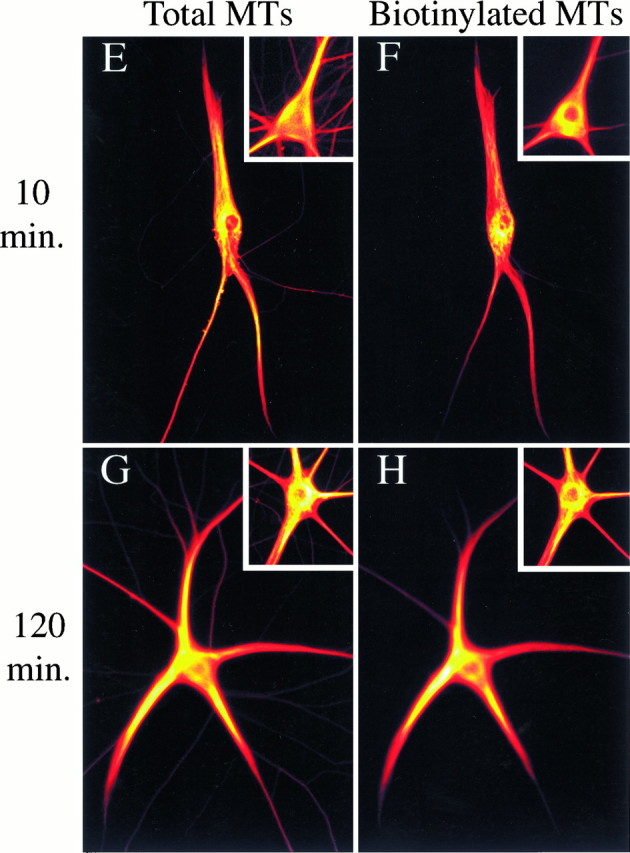
Comparison of the distribution of total MT polymer and Bt–tub-containing polymer in cells processed at varying times after injection. A look-up table was applied to images of the cells to represent intensity with color such that white indicates the highest intensity, black indicates the least, and shades of red, orange, andyellow indicate intermediate intensities with progressively higher values (see Materials and Methods).A and B show total polymer and Bt–tub-containing polymer of a cell processed at 30 sec after injection; the insets show the cell body and proximal dendrites of the same cell shown in Figure 1A.C and D show total polymer and Bt–tub-containing polymer of a cell processed at 3 min after injection; the insets show the cell body and proximal dendrites of the same cell shown in Figure 2. E and Fshow total polymer and Bt–tub-containing polymer of a cell processed at 10 min after injection; the insets show the cell body and proximal dendrites of the same cell shown in Figure 3.G and H show total polymer and Bt–tub-containing polymer of a cell processed at 120 min after injection; the insets show the cell body and proximal dendrites of the same cell shown in Figure 4. Scale bars:A–D, 32 μm;E–H, 52 μm; insets, 32 μm.
Of the 21 cells processed between 30 sec and 3 min after injection, 14 exhibited staining patterns as described above. Six of the remaining seven cells exhibited variations on this theme in which a concentrated focus of assembly was observed, but it did not stand out as dramatically from the background of dispersed assembly. One cell did not exhibit a preferential site of assembly; in this cell, assembly was dispersed throughout the cell body. The basis for this variation is unknown.
In ∼90% of the 24 cells processed at 10–15 min after injection, a concentrated focus of Bt–tub in MTs was also apparent, but it was less distinct than in cells processed at earlier times (Figs. 3,5F). We attribute this to the fact that the number and length of Bt–tub-containing MTs are much greater than at shorter times, resulting in bright staining throughout broader regions of the cell body. This, in turn, tended to partially mask preferential sites of assembly. By 120 min after injection (Fig. 4), staining for biotinylated MTs did not appear to emanate from a discrete site in the cell body. Instead, staining was bright throughout broad areas of the cell body, and in many cells the bright staining extended into one or more of the dendrites (see especially Fig.5H).
We compared the distribution of MTs containing Bt–tub with that of total MT polymer at different times after injection to obtain information regarding the time course by which the injected tubulin equilibrates with the endogenous tubulin pools. These analyses were facilitated by applying color look-up tables to the images to represent fluorescence intensity with color (see Materials and Methods). As shown in Figure 5, the distribution of total MT polymer in the cell body was not uniform in most cells. Instead, some regions contained relatively high levels of polymer, whereas others contained lower amounts of polymer; these latter regions were either interspersed with or adjacent to the former regions. The regions with relatively high levels of polymer occupied broad regions of the cell body, and these regions frequently appeared to extend toward and into one or more of the cell’s dendrites (see also Sharp et al., 1995). This pattern was observed in injected cells as well as control cells in the same dishes that were not injected with Bt–tub.
In injected cells processed between 30 sec and 3 min after injection, the concentrated focus of Bt–tub incorporation occupied a relatively discrete site within the cell body that stained much more intensely than the surrounding regions. This focus of strong MT staining for Bt–tub did not overlap with the region of greatest MT staining for tubulin, but typically was adjacent to it, occupying a region that contained relatively low levels of total polymer (see Fig.5A–D). Similar results were also seen in cells processed between 10 and 15 min after injection, although the focus of Bt–tub staining was broader than at shorter times and extended from regions of relatively low total MT staining into regions of strong staining (Fig. 5E,F). However, by 120 min after injection, the regions that stained most intensely for biotinylated MTs occupied broad regions that largely coincided with those staining most intensely for total MTs (Fig.5G,H). These observations are significant for two reasons. First, they suggest that Bt–tub has largely equilibrated with the endogenous tubulin pools in the cell body and dendrites by 120 min after injection. Estimates of MT half-life in dendrites are also consistent with this interpretation (see below). Second, the fact that biotinylated MTs appear to emanate from a point source in the cell body at relatively short times after injection but not at longer times suggests that there is a time-dependent change in the distribution of biotinylated MTs that reflects a redistribution subsequent to their initial nucleation rather than a simple radial expansion from the somal nucleation site (this interpretation is considered in greater detail in Discussion).
Bt–tub incorporation into MTs in the dendrites
In dendrites of cells processed at ≤3 min after injection, Bt–tub appeared in short MT segments that were located principally in the proximal half of the dendrite, although occasional biotinylated MT segments were observed more distally (Figs. 1A, 2). With increasing time after injection, Bt–tub-containing MT segments increased in length, and they were found at progressively more distal sites in the dendrites (see above). Unlike the situation in the cell body, MT segments containing Bt–tub did not appear clustered at discrete sites within dendrites. Instead, MTs with Bt–tub occurred individually and were scattered throughout the dendritic cytoplasm. This conclusion is based on visual inspection of the distribution MT segments containing Bt–tub at short times after injection (Figs. 1, 2, 3) and on inspection of images after applying a color look-up table to represent fluorescence intensity with color (Fig. 5). In no case did we observe a concentrated focus of Bt–tub assembly in the dendrites that resembled that in the cell body. This result is consistent with the absence of dendritic staining for markers of traditional MT nucleating structures such as γ-tubulin (Baas and Joshi, 1992) and pericentrin (J. Wang and M. M. Black, unpublished data).
We also examined Bt–tub assembly in dendrites using the segmented mask procedure. This method provides a quantitative measure of the relative amount of Bt–tub in MTs and total MTs along the length of the dendrite. To optimize the spatial resolution of these analyses, the cells were divided into consecutive ∼3-μm-long segments beginning at the cell body and extending to the dendrite tip. The fluorescence intensity in each segment was integrated and then graphed as a function of distance from the cell body (Fig. 6). For most cells (24/34 cells analyzed), the fluorescence intensity attributable to total MT polymer was highest in the cell body and declined progressively along the length of the dendrite to reach the lowest values at the dendrite tip. In the remaining cells, the relative amount of MT polymer declined from the cell body but not in a progressive manner. In most of these cells, the staining intensity for biotinylated MTs was relatively uniform in the proximal one-third to one-half of the dendrite, after which it declined progressively to the dendrite tip.
The staining intensity attributable to Bt–tub in MTs also was highest in the cell body and declined along the length of the dendrite. At the shortest times examined (∼30 sec after injection), staining for Bt–tub declined rapidly to reach background within the proximal half of the dendrite (data not shown). However, at all other times, MT staining for Bt–tub was detected all along the length of the dendrite. In cells processed 2–3 min after injection, the Bt–tub intensity profile declined steadily and relatively smoothly from the beginning of the dendrite to its tip. At 10 or 120 min after injection, the staining for Bt–tub in MTs either declined progressively along the dendrite or exhibited a plateau in the proximal dendrite, after which staining intensity declined steadily to the end of the dendrite. In no case did we observe a spike in the Bt–tub intensity profile within the dendrite that could be indicative of a discrete site especially active in MT assembly.
Bt–tub assembly in dendrites involves elongation from both plus-end-distal and minus-end-distal MTs
We wanted to determine whether Bt–tub assembly in dendrites involved elongation from preexisting MTs and whether this involved both plus-end-distal and minus-end-distal MTs. Because the immunofluorescence procedures used in the above experiments did not permit us to adequately visualize individual MTs, we used immunoelectron microscopic procedures to address these issues. These analyses also allowed us to obtain a measure of the half-life of MTs in these dendrites.
Figure 7 shows representative images of MT labeling for Bt–tub in dendrites processed at either 10 or 120 min after injection. In considering these data, it is important to note that dendritic MTs are relatively long and that each thin section examined contains only a relatively small portion of any individual MT. We refer to the part of each MT contained within a section as an MT profile. At each time point examined, most MT profiles were either labeled for Bt–tub along their entire length or completely unlabeled, with labeled and unlabeled profiles commonly occurring next to each other. Inspection of Figure 7reveals that the proportion of MT polymer with Bt–tub increases substantially between 10 and 120 min after injection. We have quantified this increase by measuring the total length of MTs in each section and then determining the proportion of this polymer that stained for Bt–tub (Fig. 8). Approximately 20% of the MT polymer in dendrites contains Bt–tub by 10 min after injection, whereas by 120 min after injection, ∼70% contains Bt–tub. These data suggest a half-life for the bulk polymer of the dendrite of ∼76 min. The limited nature of these data only permit a rough approximation of the turnover of dendritic MTs. However, if we use the relatively simple model of a single exponentially declining function to describe the turnover behavior of dendritic MTs, then ∼90% of the MT polymer within the dendrite will turnover once every 4 hr. We note, however, that the validity of this model is questionable because dendrites contain two types of polymer that differ in their relative content of tyrosinated α-tubulin and on their sensitivity to depolymerization induced by nocodazole (Baas et al., 1991). Because MTs that differ in these parameters typically differ in their dynamic properties (Schulze et al., 1987; Li and Black, 1996), the overall turnover behavior of the MT array of dendrites is likely to be more complex than that inferred based on a single exponentially declining population.
Fig. 7.
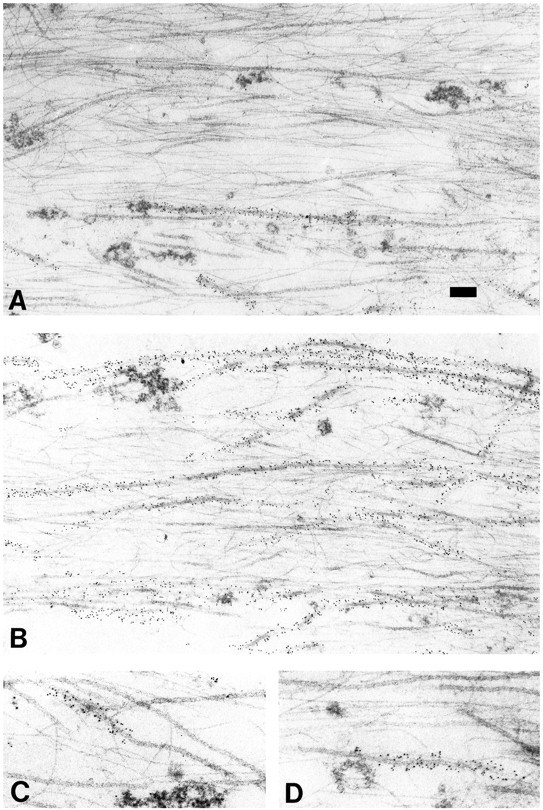
Immunoelectron microscopic analyses of Bt–tub assembly into dendritic MTs. Shown are representative images of longitudinal sections through dendrites of cells processed at 10 min (A) or 120 min (B) after injection. In all images, the cell body is oriented toward the rightand the dendrite tip is oriented toward the left. Notice that a minority of the MT profiles stain for Bt–tub at 10 min after injection, whereas a majority stain at 120 min. C,D, Higher-magnification views of MTs that stain for Bt–tub along only part of their length. The Bt–tub-containing region is on the dendrite tip side of the MT profile shown inC, whereas it is on the cell body side of the MT profile shown in D. Scale bar: A,B, 0.15 μm; C, D, 0.1 μm.
Fig. 8.

Quantitative analyses of MT turnover in dendrites. Immunoelectron microscopic analyses were performed on cells processed at 10 and 120 min after injection, and images were obtained like those depicted in Figure 7, A and B. For each dendrite analyzed (2 at 10 min, 3 at 120 min), we measured the total length of all MT profiles apparent in the images. We then measured the lengths of these profiles that also stained for Bt–tub. From these two values, the proportion of MT polymer that contained Bt–tub was calculated. The graph shows the proportion of total polymer with or without Bt–tub as a function of time after injection. These analyses indicate that the bulk polymer in the dendrite turns over with at1/2 of ∼76 min.
Whereas most MT profiles were either labeled all along their length or completely unlabeled, some MT profiles were unlabeled over only part of their length, with a relatively abrupt transition to a region of relatively strong staining for Bt–tub that continued to the end of the MT profile (Fig. 7C,D). These mixed profiles always contained a single unlabeled region and a single labeled region; we never observed MT profiles containing two Bt–tub-containing regions separated by a region without Bt–tub or a Bt–tub-containing region separating two unlabeled regions. These mixed profiles are indicative of the assembly of Bt–tub onto the ends of preexisting MTs (i.e., MTs that existed in the cell before the injection of Bt–tub). Thus, at least a portion of the biotinylated MT polymer observed in dendrites reflects elongation of existing MTs.
We focused on these partially labeled profiles to determine the directionality of Bt–tub assembly onto dendritic MTs. In preparing the samples for electron microscopy, we kept track of the orientation of the cell during sectioning and imaging. This allowed us to determine whether the addition of Bt–tub onto the ends of preexisting MTs occurred toward the cell body or the dendrite tip. The results indicate that assembly occurs in both directions with approximately equal proportions of dendritic MTs growing toward the dendrite tip or toward the cell body. Specifically, we identified 107 MT profiles that were labeled over only part of their length. Of these, 61 (57%) grew toward the dendrite tip, whereas 46 (43%) grew toward the cell body. In axons, tubulin addition onto MTs occurs preferentially at their plus ends (Okabe and Hirokawa, 1988; Baas and Ahmad, 1992; Li and Black, 1996). Assuming that this is also true for dendritic MTs, then the MTs growing toward the dendrite tip correspond to plus-end-distal MTs, whereas the MTs growing toward the cell body correspond to minus-end-distal MTs. If this is correct, then the proportions of growing MTs that are plus-end-distal or minus-end-distal in orientation correspond very closely with the proportions of total polymer with these polarity orientations (56% plus-end-distal, 44% minus-end-distal) (Baas et al., 1991). The similarity in these proportions indicates that plus-end-distal and minus-end-distal MTs each have similar probabilities of incorporating Bt–tub over the time course of these experiments.
DISCUSSION
The MT array of dendrites is nonuniform with respect to polarity orientation, with roughly equal proportions of MTs having a plus-end-distal or minus-end-distal orientation (Baas et al., 1988;Burton, 1988). Recent studies have emphasized the importance of MT transport in generating the MT array of dendrites (Sharp et al., 1995). In the present studies, we have examined MT assembly and turnover in growing dendrites to provide a more complete picture of the generation of the dendritic MT array. Three scenarios can be envisioned for establishing the MT array of dendrites, which differ as to where dendritic MTs are nucleated and the relative contribution of MT assembly and transport. One possibility is that all MTs for the dendrite are nucleated in the cell body. Another is that all dendritic MTs are generated within the dendrite itself. The third invokes a combination of the other two, such that some dendritic MTs are generated in the cell body whereas others are generated in the dendrites. In all of these possibilities, MT transport and/or MT assembly mechanisms act on the newly nucleated MTs to construct the definitive MT array of the dendrite.
Several lines of evidence favor the first of these possibilities. As indicated in the introductory remarks, one of the early indications was the localization of γ-tubulin specifically to the cell body of neurons, but not to their axons or dendrites (Baas and Joshi, 1992). Because γ-tubulin is apparently essential for the nucleation of new MTs from tubulin subunits (for review, see Oakley, 1994), the localization of γ-tubulin in neurons suggests that the new MTs required to elaborate both the axon and the dendrite are initially nucleated in the cell body.
Our data on Bt–tub assembly in the somatodendritic compartment also focus attention on the cell body as a major site for nucleating new MTs for the dendrite. The most striking observation in this respect is the demonstration of a discrete site in the cell body that is extremely active in generating MTs. Within minutes of injecting Bt–tub, the number of MTs generated at this site was too great to count with the immunofluorescence procedures used in our studies. The images of Bt–tub assembly bear a striking resemblance to the images of MT regrowth in neurons during recovery after treatment with MT depolymerizing drugs (Yu et al., 1993), which revealed hundreds of MTs growing from a point source in the cell body within a few minutes after initiating recovery. Both of these experimental approaches identify a potent MT nucleating activity in the cell body capable of generating large numbers of new MTs for the neuron. In the drug-recovery experiments, ultrastructural analyses established that MTs were nucleated by the centrosome and, on this basis, we assume that the centrosome represents the structural basis for the high level of assembly observed in our experiments.
MT assembly also occurred in dendrites. However, in no case did we observe large numbers of MTs growing from a discrete site within the dendrite. Instead, assembly was dispersed all along the length of the dendrite, indicating that dendrites lack a discrete nucleating focus like that in the cell body. Immunoelectron microscopic analyses revealed that Bt–tub assembly in dendrites reflects, at least in part, addition of Bt–tub onto the ends of MTs that existed in the cell at the time of injection, and that this assembly appears to occur on both plus-end-distal and minus-end-distal MTs. Furthermore, MT assembly in dendrites is not biased in the direction of dendritic growth. Rather, assembly appeared to occur with equal probability on the plus-end-distal and minus-end-distal MTs of the dendrite.
It remains a matter of speculation whether all MT assembly in dendrites occurs by elongation of existing MTs or whether new MTs can be generated within the dendrite itself by nucleated or spontaneous assembly. No evidence has emerged for the existence of structures that can nucleate MTs de novo within dendrites. Attempts to identify molecular markers of MT nucleating structures in dendrites such as γ-tubulin (Baas and Joshi, 1992) and pericentrin (J. Wang and M. M. Black, unpublished data) have been uniformly negative. Also, serial reconstruction of the MT array in dendrites has revealed that MTs start and stop all along the length of the dendrite and that these MTs are not associated with obvious structural specializations at either end that could reflect nucleating elements (Stevens et al., 1988; Baas and Joshi, 1992).
The question of spontaneous assembly of MTs in dendrites is difficult to address experimentally. Dendrites contain tubulin and a variety of accessory proteins that promote tubulin assembly in vitro(for review, see Black and Smith, 1988). If the concentration of unassembled tubulin exceeds the critical concentration for assembly, then spontaneous assembly can occur. However, given that MT ends are available all along the dendrite and that assembly onto MT ends is energetically more favorable than spontaneous assembly (for review, seeKirschner and Mitchison, 1986), it is reasonable to infer that the principal mode of MT assembly in dendrites involves elongation from existing MTs. This interpretation is also consistent with studies on other cell types which indicate that spontaneous assembly occurs to a limited extent, if at all (for review, see Brinkley, 1985;Kirschner and Mitchison, 1986).
Based on the above considerations, we suggest that new MTs are not generated locally in dendrites by either spontaneous or nucleated assembly. If this is correct, then new MTs for the dendrite must be generated in the cell body, and then via transport and/or assembly the newly formed MTs are incorporated into the dendrite. The distribution of biotinylated MTs undergoes a time-dependent change that is consistent with both MT transport and elongation (see Fig. 5). Initially, biotinylated MTs are concentrated at a point source, from which they radiate away for relatively short distances. Over time, this pattern changes such that by 120 min after injection, the biotinylated MTs are present over a broad region of the cell body that extends into the dendrites. The assembly/disassembly dynamics that mediate the elongation and turnover of MTs locally in the cell body and dendrite will contribute to this change in distribution of biotinylated MTs. However, by 120 min after injection, the biotinylated MTs do not emanate from a point source, although we assume that many were initially nucleated at such a site. This in turn suggests that the distribution of biotinylated MTs at 120 min after injection does not result simply from the outward elongation from the somal nucleation site but reflects in part a redistribution subsequent to their initial nucleation. We suggest that this redistribution is mediated by MT transport mechanisms that convey the MTs away from the site of nucleation.
The issue of MT transport in neurons has been controversial for many years because of the largely negative results obtained from studies attempting to visualize polymer movements in living neurons (for review, see Black, 1994). However, several recent observations leave little doubt that MT transport occurs in axons (Baas and Ahmad, 1993;Terasaki et al., 1995; Yu et al., 1996) and dendrites (Sharp et al., 1995), and that the failure of some studies to detect transport reflects limitations of the methods used (Yu et al., 1996). Collectively, these and other studies indicate that MTs are nucleated at the centrosome in the cell body and then subsequently are released and transported to more peripheral sites in the cell body and ultimately into the axon and dendrites (for review, see Baas and Yu, 1996). MT transport in axons conveys MTs specifically with their plus ends leading, thereby establishing the uniform plus-end-distal polarity orientation characteristic of axonal MTs. MT transport may also establish the mixed polarity orientation of dendritic MTs by transporting some MTs from the cell body into the dendrite with their plus ends leading and others with their minus ends leading (Sharp et al., 1995). In this respect, Sf9 cells induced to express a plus-end-directed MT motor (CHO1) extend cytoplasmic processes that contain a nonuniform array of MTs (Sharp et al., 1996), whereas cells induced to express a minus-end-directed motor extend processes with a uniform MT array (Sharp et al., unpublished data). These results indicate that MT motors can profoundly effect MT organization in cells (see also Hyman and Karsenti, 1996) and also raise the possibility that the differences in MT polarity orientation in axons and dendrites reflect differences in the motors that transport MTs in these processes.
MT assembly and disassembly are also very active in dendrites; dendritic MTs undergo substantial changes in length over a time period of minutes such that, on average, dendritic MTs turnover with a half-life of ∼76 min. Thus, MT dynamics operating locally within the dendrite will influence MT length and, if MTs depolymerize entirely, MT number as well. We envision a scenario in which MT transport and local assembly/disassembly dynamics combine to establish and maintain the MT array in growing dendrites just as they do in axons. MT transport provides a steady supply of new MTs for the dendrite and also establishes MT polarity orientation by virtue of the interaction between the transport motor(s) and the MTs. MT assembly/disassembly dynamics allow for shaping the MT array locally within the dendrite itself by modulating the length and, possibly, number of transported MTs.
Footnotes
This work was supported by grants from National Institutes of Health (NIH) to M.M.B. and grants from NIH and the National Science Foundation to P.W.B., who is also the recipient of a Research Career Development Award from NIH.
Correspondence should be addressed to Dr. Mark M. Black, Department of Anatomy and Cell Biology, Temple University School of Medicine, 3400 North Broad Street, Philadelphia, PA 19140.
REFERENCES
- 1.Ahmad FJ, Joshi HC, Centonze VE, Baas PW. Inhibition of microtubule nucleatoin at the neuronal centrosome compromises axon growth. Neuron. 1994;12:271–280. doi: 10.1016/0896-6273(94)90270-4. [DOI] [PubMed] [Google Scholar]
- 2.Baas PW, Ahmad FJ. The plus ends of stable microtubules are the exclusive nucleating structures for microtubules in the axon. J Cell Biol. 1992;116:1231–1241. doi: 10.1083/jcb.116.5.1231. [DOI] [PMC free article] [PubMed] [Google Scholar]
- 3.Baas PW, Ahmad FJ. The transport properties of axonal microtubules establish their polarity orientation. J Cell Biol. 1993;120:1427–1437. doi: 10.1083/jcb.120.6.1427. [DOI] [PMC free article] [PubMed] [Google Scholar]
- 4.Baas PW, Black MM. Individual microtubules in the axon consist of domains that differ in both composition and stability. J Cell Biol. 1990;111:495–509. doi: 10.1083/jcb.111.2.495. [DOI] [PMC free article] [PubMed] [Google Scholar]
- 5.Baas PW, Joshi HC. γ-Tubulin distribution in the neuron: implications for the origins of neuritic microtubules. J Cell Biol. 1992;119:171–178. doi: 10.1083/jcb.119.1.171. [DOI] [PMC free article] [PubMed] [Google Scholar]
- 6.Baas PW, Yu W. A composite model for establishing the microtubule arrays of the neuron. Mol Neurobiol. 1996;12:145–161. doi: 10.1007/BF02740651. [DOI] [PubMed] [Google Scholar]
- 7.Baas PW, Deitch JS, Black MM, Banker GA. Polarity orientation of microtubules in hippocampal neurons: uniformity in the axon and nonuniformity in the dendrite. Proc Natl Acad Sci USA. 1988;85:8335–8339. doi: 10.1073/pnas.85.21.8335. [DOI] [PMC free article] [PubMed] [Google Scholar]
- 8.Baas PW, Black MM, Banker GA. Changes in microtubule polarity orientation during the development of hippocampal neurons in culture. J Cell Biol. 1989;109:3085–3094. doi: 10.1083/jcb.109.6.3085. [DOI] [PMC free article] [PubMed] [Google Scholar]
- 9.Baas PW, Slaughter T, Brown A, Black MM. Microtubule dynamics in axons and dendrites. J Neurosci Res. 1991;30:134–153. doi: 10.1002/jnr.490300115. [DOI] [PubMed] [Google Scholar]
- 10.Black MM. Microtubule assembly and transport cooperate to generate the microtubule array of the axon. Prog Brain Res. 1994;102:61–77. doi: 10.1016/S0079-6123(08)60532-4. [DOI] [PubMed] [Google Scholar]
- 11.Black MM, Smith W. Regional differentiation of the neuronal cytoskeleton, with an appendix: diffusion of proteins in the neuron cell body: mathematical approximations and computer simulations. In: Lasek RJ, Black MM, editors. Intrinsic determinants of neuronal form and function. Liss; New York: 1988. pp. 463–486. [Google Scholar]
- 12.Black MM, Slaughter T, Fischer I. Microtubule-associated protein 1b (MAP1b) is concentrated in the distal region of growing axons. J Neurosci. 1994;14:857–870. doi: 10.1523/JNEUROSCI.14-02-00857.1994. [DOI] [PMC free article] [PubMed] [Google Scholar]
- 13.Blose SH, Meltzer DI, Feramisco JR. 10 nm filaments are induced to collapse in living cells microinjected with monoclonal and polyclonal antibodies against tubulin. J Cell Biol. 1984;98:847–858. doi: 10.1083/jcb.98.3.847. [DOI] [PMC free article] [PubMed] [Google Scholar]
- 14.Brinkley BR. Microtubule organizing centers. Annu Rev Cell Biol. 1985;1:145–172. doi: 10.1146/annurev.cb.01.110185.001045. [DOI] [PubMed] [Google Scholar]
- 15.Brown A, Slaughter T, Black MM. Newly assembled microtubules are concentrated in the proximal and distal regions of growing axons. J Cell Biol. 1992;119:867–882. doi: 10.1083/jcb.119.4.867. [DOI] [PMC free article] [PubMed] [Google Scholar]
- 16.Burton PR. Dendrites of mitral cell neurons contain microtubules of opposite polarity. Brain Res. 1988;473:107–115. doi: 10.1016/0006-8993(88)90321-6. [DOI] [PubMed] [Google Scholar]
- 17.Dotti CG, Sullivan CA, Banker GA. The establishment of polarity by hippocampal neurons in culture. J Neurosci. 1988;8:1454–1468. doi: 10.1523/JNEUROSCI.08-04-01454.1988. [DOI] [PMC free article] [PubMed] [Google Scholar]
- 18.Higgins D, Lein PJ, Osterhout DJ, Johnson MI. Tissue culture of mammalian autonomic neurons. In: Banker G, Goslin K, editors. Culturing nerve cells. MIT; Cambridge: 1991. pp. 177–205. [Google Scholar]
- 19.Hyman AA, Karsenti E. Morphogenetic properties of microtubules and mitotic spindle assembly. Cell. 1996;84:401–410. doi: 10.1016/s0092-8674(00)81285-4. [DOI] [PubMed] [Google Scholar]
- 20.Hyman AA, Drechsel D, Kellogg D, Salser S, Sawin K, Steffen P, Wordeman L, Mitchison T. Preparations of modified tubulins. Methods Enzymol. 1991;196:478–485. doi: 10.1016/0076-6879(91)96041-o. [DOI] [PubMed] [Google Scholar]
- 21.Kirschner M, Mitchison T. Beyond self assembly: from microtubules to morphogenesis. Cell. 1986;45:329–342. doi: 10.1016/0092-8674(86)90318-1. [DOI] [PubMed] [Google Scholar]
- 22.Li Y, Black MM. Microtubule assembly and turnover in growing axons. J Neurosci. 1996;16:531–544. doi: 10.1523/JNEUROSCI.16-02-00531.1996. [DOI] [PMC free article] [PubMed] [Google Scholar]
- 23.Mitchison T, Kirschner MW. Microtubule assembly nucleated by isolated centrosomes. Nature. 1984;312:232–237. doi: 10.1038/312232a0. [DOI] [PubMed] [Google Scholar]
- 24.Mobley WC, Shenker A, Shooter EM. Characterization and isolation of proteolytically modified nerve growth factor. Biochemistry. 1976;15:5543–5551. doi: 10.1021/bi00670a019. [DOI] [PubMed] [Google Scholar]
- 25. Oakley BR. γ-Tubulin. Hyaams JS, Loyd CW. Microtubules 1994. 33 45 Wiley; New York-Liss. [Google Scholar]
- 26.Okabe S, Hirokawa N. Microtubule dynamics in nerve cells: analysis using microinjection of biotinylated tubulin into PC12 cells. J Cell Biol. 1988;107:651–664. doi: 10.1083/jcb.107.2.651. [DOI] [PMC free article] [PubMed] [Google Scholar]
- 27.Peng I, Binder LI, Black MM. Biochemical and immunochemical analyses of cytoskeletal domains of neurons. J Cell Biol. 1986;102:252–262. doi: 10.1083/jcb.102.1.252. [DOI] [PMC free article] [PubMed] [Google Scholar]
- 28.Schliwa M, van Blerkom JJ. Structural interactions of cytoskeletal components. J Cell Biol. 1981;90:222–235. doi: 10.1083/jcb.90.1.222. [DOI] [PMC free article] [PubMed] [Google Scholar]
- 29.Schulze E, Kirschner MW. Microtubule dynamics in interphase cells. J Cell Biol. 1986;102:1020–1031. doi: 10.1083/jcb.102.3.1020. [DOI] [PMC free article] [PubMed] [Google Scholar]
- 30.Schulze E, Asai DJ, Bulinski JC, Kirschner M. Post-translational modification and microtubule stability. J Cell Biol. 1987;105:2167–2177. doi: 10.1083/jcb.105.5.2167. [DOI] [PMC free article] [PubMed] [Google Scholar]
- 31.Sharp DJ, Yu W, Baas PW. Transport of dendritic microtubules establishes their nonuniform polarity orientation. J Cell Biol. 1995;130:93–103. doi: 10.1083/jcb.130.1.93. [DOI] [PMC free article] [PubMed] [Google Scholar]
- 32.Sharp DJ, Kuriyama R, Baas PW. Expression of a kinesin-related motor protein induces Sf9 cells to form dendrite-like processes with nonuniform microtubule polarity orientation. J Neurosci. 1996;16:4370–4375. doi: 10.1523/JNEUROSCI.16-14-04370.1996. [DOI] [PMC free article] [PubMed] [Google Scholar]
- 33.Stevens JK, Trogadis J, Jacobs JR. Development and control of axial neurite form: a serial electron microscopic analysis. In: Lasek RJ, Black MM, editors. Intrinsic determinants of neuronal form and function. Liss; New York: 1988. pp. 115–146. [Google Scholar]
- 34.Terasaki M, Schmidek A, Galbraith JA, Gallant PE, Reese TS. Transport of cytoskeletal elements in the squid giant axon. Proc Natl Acad Sci USA. 1995;92:11500–11503. doi: 10.1073/pnas.92.25.11500. [DOI] [PMC free article] [PubMed] [Google Scholar]
- 35.Yu W, Centonze VE, Ahmad FJ, Baas PW. Microtubule nucleation and release from the neuronal centrosome. J Cell Biol. 1993;122:349–359. doi: 10.1083/jcb.122.2.349. [DOI] [PMC free article] [PubMed] [Google Scholar]
- 36.Yu W, Schwei MJ, Baas PW. Microtubule transport and assembly during axon growth. J Cell Biol. 1996;133:151–157. doi: 10.1083/jcb.133.1.151. [DOI] [PMC free article] [PubMed] [Google Scholar]