

Abstract
The main olfactory bulb (MOB) receives a dense projection from the pontine nucleus locus coeruleus (LC), the largest collection of norepinephrine (NE)-containing cells in the brain. LC is the sole source of NE innervation of MOB. Previous studies of the actions of exogenously applied NE on mitral cells, the principal output neurons of MOB, are contradictory. The effect of synaptically released NE on mitral cell activity is not known, nor is the influence of NE on responses of mitral cells to olfactory nerve inputs. The goal of the present study was to assess the influence of LC activation on spontaneous and olfactory nerve-evoked activity of mitral cells.
In methoxyflurane-anesthetized rats, intracoerulear microinfusions of acetylcholine (ACh) (200 mm; 90–120 nl) evoked a four- to fivefold increase in LC neuronal discharge, and a transient EEG desynchronization and decrease in mitral cell discharge. LC activation increased excitatory responses of mitral cells evoked by weak (i.e., perithreshold) nasal epithelium shocks (1.0 Hz) in 17/18 cells (mean increase = 67%). The discharge rate of mitral cells at the time that epithelium-evoked responses were increased did not differ significantly from pre-LC activation baseline values. Thus, changes in mitral baseline activity do not account for the increased response to epithelium stimulation. These findings suggest that increased activity in LC–NE projections to MOB may enhance detection of relatively weak odors.
Keywords: sensory synapse, olfaction, odor, olfactory bulb, nasal epithelium, locus coeruleus, norepinephrine, monoamine
Projections from the locus coeruleus (LC) have a broader distribution than any other structure in the CNS. LC is the major source of norepinephrine (NE) innervation of the forebrain (Foote et al., 1983) and the sole source of NE input to the main olfactory bulb (MOB). Projections from LC to MOB are robust. At least 40% of LC neurons are labeled retrogradely from the rat MOB (Shipley et al., 1985).
NE terminals have a higher degree of laminar specificity in MOB than in any other cortical structure (McLean et al., 1989). Most LC–NE fibers terminate deep to the mitral cell body layer (i.e., inframitral layers), in the internal plexiform layer (IPL) and the granule cell layer (GCL). A few fibers enter the external plexiform layer (EPL), whereas the superficial glomerular layer in which axons of olfactory receptor neurons (ORNs) synapse with mitral cell apical dendrites is completely devoid of NE fibers. On the basis of the laminar distribution of LC–NE axons and the intrinsic anatomy of MOB, we hypothesized (McLean et al., 1989) that the major synaptic targets of LC–NE inputs to the MOB are elements in GCL–IPL because neither the mitral nor the tufted cells nor any other supramitral layer neurons extend dendrites below the mitral cell layer (Shipley et al., 1995). As the predominant neuron in the inframitral layers, the granule cell is a prime candidate target of NE synapses. Granule cells are GABAergic interneurons that synaptically contact and inhibit mitral and tufted cells (Shipley et al., 1995).
Previous investigations of NE actions in MOB are contradictory. On the one hand, iontophoretically applied NE was reported to inhibit mitral cell discharge in rabbits and cats (Salmoiraghi et al., 1964; McLennan, 1971); this action was blocked by bicuculline. Thus, it was concluded that NE “excites” granule cells, causing them to release GABA and thereby inhibiting mitral cells. On the other hand, bath application of NE in an isolated turtle bulb preparation increased mitral cell discharge, an effect reversed by coapplication of GABA (Jahr and Nicoll, 1982). These findings were interpreted to mean that NE “inhibits” granule cells, reducing GABA release and thereby increasing mitral cell excitability. In dissociated MOB cultures, NE inhibited mitral to granule cell excitation presynaptically; this effect was mediated by α2 receptors (Trombley and Shepherd, 1992;Trombley, 1992).
It is conceivable that species differences underlie these discrepant findings, but they also may be attributable to different preparations (i.e., in vivo, isolated bulb, cell culture) or methodological differences. Iontophoretically applied NEdecreased mitral cell activity in cats and rabbits, whereas bath application increased mitral cell activity in a turtle. The mode of NE application—iontophoresis versus bath application—may be important because of differences in concentration, duration, and/or sites of action. Neither bath application nor iontophoresis mimicsin vivo release of NE at discrete synaptic sites at physiological concentrations. The effect of endogenously released NE on mitral cells is not known. The major goal of this study, therefore, was to investigate the effects of LC activation on mitral cells in vivo. We focused on the influence of LC activation on mitral cell responses to stimulation of olfactory nerve inputs to provide an indication of the impact of LC inputs to odor processing.
MATERIALS AND METHODS
General surgical techniques. Male Sprague Dawley (Zivic-Miller, Allison Park, PA) rats weighing 275–350 gm were intubated with a descending tracheal cannula under methoxyflurane (Metofane) anesthesia (0.3–1.0% in moist air). A second ascending cannula was inserted into the distal (nasal) part of the trachea and attached to a small animal respirator so that moist airflow with a defined inspiration/expiration period (∼1 cycle/sec) could be passed through the nasal cavity. Animals were secured in a stereotaxic instrument with the incisor bar lowered to angle the skull 12° from the flat skull position. Core body temperature was maintained at 36–37°C with a heating pad.
EEG. A transcortical EEG electrode was made from a pair of 250 μm stainless steel wires, insulated except for the bluntly cut tips. The tips were separated ventrally by 500–1000 μm. The electrode was implanted in the cortex ∼2 mm caudal to bregma and 1 mm lateral to the midline, with the superficial tip ∼200 μm deep to the brain surface (Fig. 1). The electrode was secured to adjacent screws with dental acrylic. EEG activity was monitored continuously to regulate the plane of anesthesia. Surgery was performed under deep anesthesia by adjusting the concentration of methoxyflurane to synchronize the EEG. After surgery, animals were stabilized at an anesthetic plane at which a pinch of the hindlimb elicited a brief desynchronization of the cortical EEG without causing a withdrawal reflex.
Fig. 1.

Schematic diagram of a parasagittal section illustrating the experimental preparation. A composite recording/microinjection electrode was lowered into LCto record extracellularly from single LC neurons during simultaneous microinjection of ACh. A second recording pipette was advanced into the MOB to monitor the activity of mitral cells. Bipolar stimulation electrodes were placed on the surface of LOT and theOlfactory Epithelium to antidromically and orthodromically activate mitral cells, respectively.
MOB recordings. The lateral surface of the brain, including MOB and the lateral olfactory tract (LOT), were exposed through the orbit. Isolated extracellular recordings were obtained from single mitral cells with glass micropipettes (2–4 μm tip diameter, 8–15 MΩ impedance) filled with 2% pontamine sky blue in 0.5 msodium acetate. The micropipette was advanced into MOB while the epithelium-evoked or LOT-evoked field potential profiles were monitored simultaneously. The mitral cell layer was identified by the characteristic inversion of the field potential, as described previously (Nickell and Shipley, 1988). Single-unit recordings were made from cells that exhibited stable levels of spontaneous activity and a short-latency excitatory response to olfactory epithelium (OE) stimulation.
LOT stimulation. A bipolar stimulation electrode was made from a pair of silver wires (1 mm diameter), insulated except for polished tips, and glued with a tip separation of 1 mm. This electrode was placed on the surface of LOT with the tips oriented dorsoventrally to antidromically activate MOB output neurons. The criteria for antidromic activation were (1) constant latency (0.8–3.0 msec) action potentials at the threshold for activation (stimulus parameters: 300–1000 μA, 20–500 μsec duration) and (2) ability to follow twin pulse stimulation consistently at frequencies of ≥200 Hz.
Epithelium stimulation. A bipolar stimulation electrode, made from a pair of 250-μm-diameter stainless steel wires insulated except for the tips, was placed on the dorsolateral surface of the nasal epithelium to activate ORN axons orthodromically. Anatomical experiments indicate that olfactory neurons in the lateral and dorsolateral parts of the OE project preferentially to mitral cells in the lateral half of MOB (Schoenfeld et al., 1994). Single-unit recordings were made from mitral cells in lateral MOB; peristimulus time histograms (PSTHs) were generated from 100 consecutive OE stimuli delivered at 1.0 Hz. Stimuli were isolated constant-current square-wave pulses, 50–800 μA in intensity and 300 μsec in duration. Logic pulses synchronized with the stimuli were sent to a computer for on-line PSTH generation.
LC activation. A hole was drilled in the skull at coordinates for LC (4.0 mm posterior to lambda, 1.2 mm lateral to midline) through which an electrode assembly was inserted. A composite recording/microinjection electrode was used to record extracellular action potentials from single LC neurons during microinjection of ACh into LC. The electrode consisted of a conventional glass recording pipette (4–6 μm diameter tip, 5–10 MΩ impedance) filled with 2% pontamine sky blue in 0.5 m sodium acetate and glued to a calibrated injection pipette (60–80 μm diameter tip). Direct visual inspection of meniscus movement relative to grid lines applied to the calibrated injection pipette assured that known drug volumes were injected. The tip of the recording pipette extended 100–200 μm beyond the tip of the injection pipette. Electrode signals were amplified and displayed continuously using conventional electrophysiological methods, as described previously (Ennis and Shipley, 1992).
The electrode assembly was positioned so that the tip of the injection pipette was in the center of LC (5.6–6.2 mm ventral to the skull surface). This was accomplished by monitoring LC activity at several locations and selection of a rostrocaudal location at which LC neurons could be recorded throughout a 500 μm traverse in the dorsal–ventral axis. At its mid-rostrocaudal level, the LC nucleus spans a dorsoventral distance of 500–700 μm (Paxinos and Watson, 1986). LC cells were identified by the following criteria: a characteristic broad, notched action potential; low and regular spontaneous discharge (<5 Hz); and a biphasic, excitatory/inhibitory response evoked by a moderate pinch of the contralateral hindpaw or tail (Ennis and Aston-Jones, 1988).
To produce a sustained increase in LC discharge, one or two 60–120 nl injections of 200 mm ACh (in distilled water) were made. ACh was used because it produces a robust increase in LC discharge for 3–5 min (Adams and Foote, 1988). Also, ACh and muscarinic agonists do not induce depolarization block in LC neurons (Adams and Foote, 1988;El-Etri et al., 1993), a potential problem with excitatory amino acids. The electrode assembly was inserted with the injection pipette lateral to the recording pipette to avoid spread of ACh into the fourth ventricle. Our previous experiments demonstrated that a single 90–120 nl bolus of cholinergic agents produced a uniform activation of neurons throughout the LC nucleus that lasted 3–5 min (Ennis and Shipley, 1992; El-Etri et al., 1993). Additional studies in our laboratory and in others indicate that 60–120 nl volumes do not spread appreciably outside of LC proper (Shiekhattar et al., 1991; Ennis and Shipley, 1992).
Experimental protocol. After intubation, the animal was positioned in the stereotaxic, and the EEG electrode was implanted. Next, the OE, LOT, and MOB were exposed, and the stimulation electrodes were positioned. The LC electrode was positioned above LC by first finding the center of LC and then retracting the electrode 1–2 mm into the overlying cerebellum. This maneuver eliminated diffusion of ACh from the electrode into LC while a mitral cell was isolated and characterized. After localization of LC, the plane of anesthesia was adjusted carefully as described above.
Next, a recording electrode was inserted into the MOB, and a mitral cell was isolated and characterized. After three baseline perithreshold PSTHs were collected, the LC electrode was repositioned into the center of LC, and a single LC cell was isolated. LC was activated for 4–10 min by microinjection of one or two boluses of ACh approximately 2–3 min apart into LC. After LC activation, PSTHs were generated every few minutes for as long as the cell could be held.
Histology. At the end of each recording session, iontophoretic ejection of pontamine sky blue with current pulses (−10 μA, 7 sec on/3 sec off duty cycle for 10 min) marked the positions of the recording electrode in MOB and the recording/injection electrode assembly in LC. Animals were then anesthetized deeply and perfused transcardially with 10% formalin. Brains were removed and stored in a similar solution containing 20% sucrose. Brains were cut into 50-μm-thick frozen sections, mounted on subbed slides, and stained with neutral red. All recording sites were localized histologically from such sections (Fig. 2).
Fig. 2.
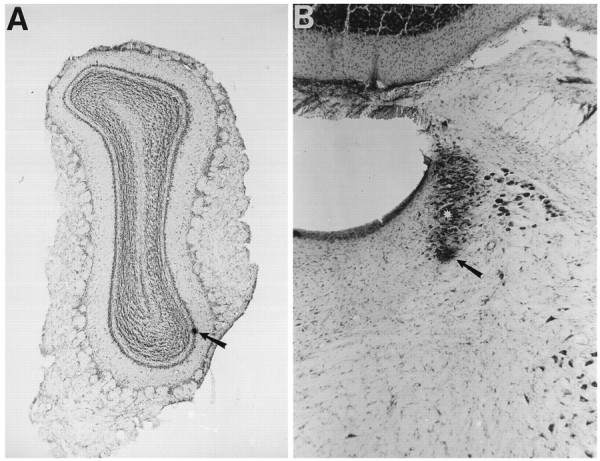
Histological localization of recording sites.A, Photomicrograph of a 50-μm-thick coronal section through the MOB (neutral red stain) showing the recording site in the mitral cell layer. The dye spot (arrow) was created by ejection of dye at the location of an antidromically activated mitral cell. B, Photomicrograph of a 50-μm-thick coronal section (neutral red stain) showing the location of a recording site in LC. Dye spot (arrow) marks the location of an LC recorded during simultaneous infusion of ACh (ACh was injected 180 μm dorsal to the recording site, shown at the asterisk). Length of arrows in A andB = 320 and 131 μm, respectively.
Data analysis. LC-induced changes in spontaneous activity and the epithelium-evoked responses of mitral cells were analyzed by computer (modified CED Spike2 software). To analyze spontaneous activity, a ratemeter record of spikes/1 sec bin was accumulated before, during, and after activation of LC. A change in spontaneous activity was defined as a period of at least 10 bins during which the mean rate was higher or lower than the previous 10 bins by at least 20%.
To quantitate epithelium-evoked excitatory responses, individual PSTHs were analyzed by computer (modified CED Spike2 software) to determine excitatory and inhibitory epochs. A baseline period was defined as the 200 msec epoch preceding stimulation; the mean and SD of the number of spikes/1 msec bin in the baseline period were determined. Excitation was defined as an epoch of at least five consecutive bins whose mean value was ≥1 SD than the baseline mean for perithreshold responses and >2 SD for suprathreshold responses (see below). The magnitude of an excitatory response was defined as the total counts in the excitatory epoch minus the estimated counts from spontaneous activity (mean counts/bin in the baseline epoch times the number of bins in excitatory epoch) and was expressed as the number of spikes/100 sweeps. The average response magnitude calculated from three consecutive PSTHs collected before activation of LC was compared with the response magnitude calculated from PSTHs collected after LC activation, and expressed as a percentage increase or decrease.
An inhibitory response usually followed the excitatory response. This inhibitory response was defined as an epoch of at least 30 bins whose mean value was <70% of the number of spikes/bin in the baseline period of that PSTH. The duration of this inhibitory response was calculated.
RESULTS
Identification of mitral cells
Mitral cells were identified by depth from the brain surface, orthodromic and antidromic activation, and histological localization of pontamine sky-blue dye marks deposited from the electrode at the end of the recording session. Only cells that were localized histologically to the mitral cell layer were included in this study (Fig.2A). Twelve of 18 cells recorded in the mitral cell layer in this study were antidromically activated by electrical stimulation of the LOT. The results described below are based on recordings of 18 mitral cells from 17 animals.
Effects of anesthesia on mitral cell activity
In preliminary experiments, animals were anesthetized with injection anesthetics such as urethane (1.5 gm/kg, i.p.) and chloral hydrate (400 mg/kg, i.p.). In these experiments, the majority of mitral cells exhibited profound, tonic fluctuations in spontaneous discharge rate, as shown in Figure 3A. Similar fluctuations in mitral spontaneous activity have been observed previously in urethane-anesthetized rats (Yu et al., 1993). Variations in spontaneous activity were analyzed by measuring the spontaneous discharge rate for a 30 sec epoch during the maximal and minimal periods of activity; the ratio of the maximal and minimal firing rates was calculated. The rate at which spontaneous activity fluctuated was calculated as the number of distinct increases (30 sec minimum duration) or decreases in activity; this is referred to as the cycling rate. For 14 mitral cells recorded in urethane-anesthetized rats, the mean ratio of the maximal to minimal firing rate was 28.1 ± 10.5; the cycle rate of such fluctuations was 3.3 ± 0.6 cycles/10 min. The overall mean spontaneous activity rate of mitral cells in urethane-anesthetized rats was 30.5 ± 4.6 spikes/sec.
Fig. 3.

The depth of anesthesia potently influences mitral cell spontaneous activity. A, Ratemeter record showing the spontaneous activity of a mitral cell recorded in a urethane-anesthetized rat. Note pronounced oscillation in spontaneous discharge. B, Spontaneous activity of a mitral cell recorded in a rat deeply anesthetized with methoxyflurane; the concentration of methoxyflurane was adjusted to synchronize the EEG. With deeper levels of methoxyflurane anesthesia, ∼80% of mitral cells exhibit frequent and pronounced oscillation in spontaneous discharge similar to that illustrated. C, Ratemeter record showing the spontaneous activity of the same mitral cell as inB, but 15 min after the methoxyflurane concentration was decreased until a tail pinch elicited a brief desynchronization of the EEG (see Materials and Methods). Note that the spontaneous activity is relatively stable and exhibits little fluctuation. Only mitral cells that exhibited stable spontaneous activity under “light” methoxyflurane anesthesia were included in the data analysis.
In addition to fluctuations of spontaneous activity, the magnitude of excitatory responses evoked by OE stimulation varied markedly with changes in spontaneous activity. When the spontaneous discharge rate increased, the magnitude of the response evoked by OE stimulation was larger. Conversely, the magnitude of the evoked response was smaller during decreases in spontaneous activity (n = 13;p < 0.03). Similar fluctuations in mitral spontaneous and OE-evoked activity occurred in chloral hydrate-anesthetized animals (L. Zimmer, unpublished observations). Because of these profound fluctuations, it was impossible to obtain consistent repeat measures of responses to OE stimulation or to assess changes in mitral cell responsivity during activation of LC.
Additional studies using an inhaled anesthetic, methoxyflurane, indicated that the depth of anesthesia dramatically influences mitral cell activity. As shown in Figure 3B, mitral cells in animals anesthetized deeply with methoxyflurane exhibited oscillations in spontaneous activity comparable to those observed under urethane or chloral hydrate anesthesia. If the plane of anesthesia was decreased in the same animals, however, mitral cell activity was altered dramatically. As shown in Figure 3C, decreasing the depth of anesthesia reduced oscillations in mitral cell baseline activity. When the depth of methoxyflurane anesthesia was decreased, the ratio of maximal and minimal firing rate decreased from 38.1 ± 17.4 to 2.3 ± 0.5 (n = 12; p < 0.007). In addition, the cycling rate of oscillations decreased from 2.9 + 0.5 to 1.0 ± 0.4 cycles/10 min (p < 0.005). The mean firing rates of mitral cells in lightly (29.4 ± 5.9) and deeply (34.2 + 4.9 spikes/sec) anesthetized animals were not significantly different (p > 0.4).
These findings indicate that the depth of anesthesia significantly influences the pattern of mitral cell spontaneous activity; however, it is important to note that the mean discharge rate of mitral cells was not significantly different in light versus deep methoxyflurane anesthesia conditions or in methoxyflurane- versus urethane-anesthetized animals. Because excitatory responses to OE stimulation varied with changes in spontaneous activity, and the present study required long-term recording and consistent measures of mitral responses to OE stimulation, a relatively light level of methoxyflurane anesthesia was used in all of the experiments reported here. The ratio of the maximal and minimal baseline discharge rates for the mitral cells recorded in the LC activation experiments below was 1.8 ± 0.2 (n = 17); the mean spontaneous discharge rate of these cells was 18.4 ± 8.8 spikes/sec. The PSTHs of mitral responses to OE stimulation to be described below were collected without regard to any fluctuations in spontaneous activity.
Mitral cell responses to OE stimulation
Figures 5 and 6 shows synaptic activation of a mitral cell by single-pulse electrical stimulation (1.0 Hz) of the ipsilateral OE (arrows). At low stimulus intensities, a biphasic response consisting of a brief period of excitation followed by inhibition was sometimes detectable above the baseline. Driven spikes were elicited in only 10–20% of the trials. These stimulation-response conditions are referred to as “infrathreshold.”
Fig. 5.

LC activation increases perithreshold mitral cell responses to olfactory epithelium (OE) stimulation. PSTHs showing responses of a mitral cell to perithreshold OE stimulation (atsolid bar indicated by arrow) before and during activation of LC by two intracoerulear microinjections of ACh (arrows at right). Three PSTHs were recorded before and during LC activation. LC activation substantially increased the epithelium-evoked excitation of this mitral cell. The mean excitatory response magnitude increased from 90 ± 5.8 to 202.3 ± 9.8 spikes/100 sweeps. This is an increase of 124%. All PSTHs were generated for 100 consecutive epithelium shocks delivered at 1 Hz.
Fig. 6.

LC activation increases mitral responses to perithreshold, but not suprathreshold, epithelium stimulation.A, B, PSTHs showing responses of a mitral cell to perithreshold (200 μA) epithelium stimulation before (A) and 6 min after (B) LC activation. LC activation increased the excitatory response magnitude to perithreshold epithelium stimulation from 27 to 39 spikes/100 sweeps; this is an increase of 44%. C, D, PSTHs showing responses of the same mitral cell to suprathreshold epithelium stimulation (600 μA) before (C) and 9 min after (D) LC activation. LC activation decreased the response magnitude from 50 to 36 spikes/100 sweeps; this is a decrease of 27%. Epithelium stimulation is shown at arrows. All PSTHs were generated for 100 consecutive epithelium shocks delivered at 1 Hz.
At the highest intensities (Fig. 6C), the excitatory response increases and postexcitatory inhibition is more pronounced. The postexcitatory inhibition blocks all subsequent activity for ∼100 msec. At these high intensities, single-pulse stimulation evoked driven spikes in >50% of the trials, and typically in 90–100% of the trials. These stimulation–response conditions are referred to as “suprathreshold.”
At intermediate intensities (Figs. 5, 6A), single-pulse stimulation evoked driven spikes in 20–50% of the trials. The stimulus intensity was adjusted within this range so that the excitatory response could be visualized in PSTHs generated on-line; the intensity usually had to be increased slightly for cells with higher spontaneous activity. These stimulation–response conditions are referred to as “perithreshold.” Some neurons also exhibited a second excitatory response after the inhibitory epoch (Fig.6A,B). This response was not analyzed in the present study.
The response patterns of all 18 mitral cells in this study were similar to that just described. There was some variation in the durations of the excitatory and inhibitory epochs and in the magnitudes of the excitatory responses (see Table 1). For each cell, the stimulation intensity was adjusted systematically to evoke a suprathreshold response and then reduced to an intensity that evoked a perithreshold response. The mean magnitude of the excitatory response to perithreshold stimulation was 62.9 ± 14.3 spikes/100 sweeps. The mean onset latency for perithreshold excitation was 15.0 ± 1.5 msec (range, 8–32 msec) and the mean duration was 17.8 ± 3.0 msec (range, 7–59 msec). The mean duration of the subsequent inhibitory epoch was 80.1 ± 14.4 msec (range, 10–209 msec). Suprathreshold responses were examined in 6 of the 18 mitral cells (also see below). The mean magnitude of the excitatory responses to suprathreshold stimulation was 122.8 ± 18.5 spikes/100 sweeps; the mean onset latency was 10.7 ± 2.0 msec, and the duration was 13.4 ± 6.2 msec. The mean duration of the subsequent inhibitory epoch was 124.3 ± 63.9 msec.
Table 1.
Summary of mitral cell responses evoked by perithreshold epithelium stimulation before and after LC activation
| Cell no. | Before LC activation | After LC activation | Magnitude increase (%) | ||||||
|---|---|---|---|---|---|---|---|---|---|
| Baseline (mean spikes/sec) | Onset latency (msec) | Response duration (msec) | Magnitude (spikes/100 sweeps) | Baseline (mean spikes/sec) | Onset latency (msec) | Response duration (msec) | Magnitude (spikes/100 sweeps) | ||
| 2301 | 12 | 11 | 12 | 50 | 21 | 11 | 11 | 83 | 66 |
| 3112 | 1 | 8 | 12 | 39 | 5 | 8 | 9 | 76 | 95 |
| 3202 | 33 | 12 | 9 | 35 | 20 | 12 | 11 | 59 | 69 |
| 4901 | 32 | 11 | 59 | 282 | 33 | 10 | 56 | 333 | 16 |
| 5002 | 12 | 13 | 17 | 48 | 20 | 12 | 19 | 103 | 115 |
| 5101 | 20 | 13 | 23 | 90 | 15 | 12 | 26 | 202 | 124 |
| 6005 | 22 | 8 | 10 | 44 | 12 | 8 | 11 | 52 | 18 |
| 6305 | 9 | 19 | 21 | 53 | 18 | 17 | 28 | 131 | 147 |
| 6401 | 23 | 32 | 13 | 72 | 28 | 29 | 16 | 129 | 79 |
| 6602 | 16 | 15 | 16 | 58 | 26 | 15 | 20 | 100 | 72 |
| 7003 | 21 | 16 | 39 | 127 | 18 | 16 | 43 | 161 | 27 |
| 7201 | 22 | 10 | 8 | 26 | 14 | 9 | 9 | 33 | 27 |
| 7206 | 31 | 26 | 11 | 24 | 32 | 24 | 15 | 40 | 67 |
| 7801 | 23 | 10 | 7 | 21 | 19 | 10 | 8 | 28 | 33 |
| 7901 | 18 | 19 | 15 | 44 | 15 | 15 | 19 | 87 | 98 |
| 8601 | 19 | 13 | 10 | 27 | 13 | 15 | 9 | 39 | 44 |
| 8906 | 19 | 16 | 24 | 64 | 14 | 20 | 20 | 64 | 0 |
| 9001 | 20 | 18 | 14 | 29 | 21 | 16 | 21 | 74 | 155 |
| Mean ± SEM | 19.6 ± 1.9 | 15.0 ± 1.5 | 17.8 ± 3.0 | 62.9 ± 14.3 | 19.1 ± 1.7 | 14.4 ± 1.3 | 19.5 ± 2.9* | 99.7 ± 17.6** | 69.6 ± 10.8 |
Baseline is the calculated discharge rate in the 200 msec epoch preceding epithelium shocks, averaged for 100 sweeps. Excitatory response magnitudes were calculated as described in Materials and Methods. Activation of LC had no significant effect on baseline activity (i.e., prestimulation epoch of PSTHs) or on the onset latency of excitatory responses to epithelium stimulation. LC activation produced a small but significant increase in the response duration (p < 0.03) and a substantial increase (p < 0.001) in the magnitude of epithelium-evoked activation of mitral cells (n = 18).
* Significantly greater than pre-LC activation mean; p < 0.03, paired t test.
** Significantly greater than pre-LC activation mean;p < 0.001, paired t test.
LC activation
The mean spontaneous activity of LC neurons was 3.0 ± 0.3 spikes/sec. This is slightly higher than the mean LC discharge rate (2.2–2.4 spikes/sec) in previous studies that used the inhaled anesthetic halothane (Foote et al., 1983; Ennis and Aston-Jones, 1988). The increased baseline discharge rate of LC cells is probably attributable to some leakage of ACh from the injection pipette. Figure4B shows a typical example of increased LC discharge produced by two intracoerulear injections of ACh. Overall, the mean LC discharge rate after the first ACh injection was 13.5 ± 1.8 spikes/sec, corresponding to a 513% increase (n = 10; p < 0.0001); the mean duration of activation was 267.3 ± 83.9 sec. The mean LC discharge rate after the second ACh injection was 14.1 ± 2.1 spikes/sec, corresponding to a 418% increase (n = 11; p < 0.0002); the mean duration of activation was 270.4 ± 112.0 sec. There were no differences between the mean discharge rate or mean duration of LC activation produced by the first and second ACh injections (p > 0.3). In five experiments the LC cell that was recorded was lost during the injection, and another cell could not be isolated. Although vehicle injections were not performed, our previous studies showed that vehicle microinjections sometimes produce a small increase (∼0.5 Hz) in LC discharge lasting 10–60 sec (Ennis and Shipley, 1992; El-Etri et al., 1993). Injections of ACh or vehicle did not seem to damage LC neurons, as determined by lack of change in spike waveform and return to baseline spontaneous discharge rate after injection.
Fig. 4.

Intracoerulear microinjection of ACh potently activates LC neurons and transiently desynchronizes the cortical EEG.A, Record of the cortical EEG ipsilateral to the LC injection site before, during, and after two injections of ACh into LC (shown at top arrows). Note that LC activation produced by the first ACh injection caused EEG desynchronization. The onset of EEG desynchronization coincided with increased LC activity. Note also that the duration of the desynchronization is shorter than the duration of LC activation. B, Ratemeter recordings showing the spontaneous activity of LC neurons before and after two microinjections of ACh (90 nl each of a 200 mm solution, atarrows). The cell shown at far left(Cell 1) was recorded before ACh microinjection; the spontaneous discharge rate of the cell was 2.2 spikes/sec. During the first injection (top left arrow), the cell was lost and another LC neuron (Cell 2) was isolated immediately; the spontaneous discharge of this neuron was ∼20 spikes/sec, and the duration of activation was 2 min, after which spontaneous rate declined slowly. A second ACh injection (top right arrow) produced a sustained 15 spikes/sec firing rate of another LC neuron (Cell 3).
Effects of LC activation on EEG
The first ACh injection into LC caused a pronounced change in the EEG in 17 of the 18 experiments. This shift seemed to be similar to the suppression of low-frequency, high-amplitude activity evoked by LC activation reported by others (Berridge and Foote, 1991). In the example shown in Figure 4A, the shift in EEG activity began ∼5 sec after the first injection and lasted ∼120 sec. The second ACh injection, ∼2 min after the first, caused a second shift in EEG activity in only two experiments, even though the change in EEG amplitude caused by the first injection had recovered partially. Because LC-induced changes in the EEG have been described extensively elsewhere (Berridge and Foote, 1991), they were not analyzed in the present study.
Effects of LC activation on mitral cell spontaneous activity
In eight experiments, mitral cell spontaneous activity was monitored for 1–5 min after LC activation, before OE stimulation was applied. In these cells, the mitral spontaneous discharge rate was decreased transiently by 49.6 ± 3.2% after LC activation (range, 38–60%). The mean onset latency for the decrease in discharge rate was 25 ± 9.5 sec after injection of ACh in LC. The mean duration of the decrease in activity was 87.5 ± 26.2 sec (range, 30–100 sec). The time course of the decrease in spontaneous activity corresponded to the period of EEG desynchronization. Both occur soon after LC activation and recover before LC activity returns to baseline values.
Effects of LC activation on mitral cell response to perithreshold epithelium stimulation
Figure 5 shows responses of a typical mitral cell to perithreshold OE stimulation before and after activation of LC by two intracoerulear microinjections of ACh. Three PSTHs were generated before LC activation. Next, three PSTHs were generated during activation of LC. LC activation consistently and robustly increased the magnitude of excitatory responses of mitral cells to perithreshold OE stimulation. When the three responses before and during LC activation were averaged, the mean magnitude increased from 90.0 ± 5.8 to 202.3 ± 9.8 spikes/100 sweeps. This is an increase of 124%. The response of this mitral cell was still 63% greater than its response before LC activation 6.5 min after LC discharge rate returned to baseline.
Table 1 shows the results of this same analysis for 18 mitral cells. The major finding is that LC activation increased the magnitude of the excitatory response to perithreshold OE stimulation in 17/18 cells. The increase in epithelium-evoked excitation ranged from 16 to 147%; the mean increase in response magnitude was 69.6 ± 10.8% (n = 18; p < 0.001). LC activation did not significantly alter the latency of the mitral cell excitatory response, but there was a small increase in the duration of excitation. LC activation did not alter the duration of the inhibition that followed the initial excitation.
Ten cells were recorded for ∼45 min after LC activity returned to baseline. The increase in epithelium-evoked activation of seven mitral cells began to recover 1.8–24.6 min after LC discharge rates returned to baseline. For these cells, the mean time for the onset of recovery was 11.5 ± 3.5 min after LC activity returned to baseline; the excitatory response had decreased to within 16% of the pre-LC activation baseline value. For three cells, the evoked excitation did not decline by the time the cell was lost (34–45 min). Seven other cells were lost before recovery could be assessed, and in the remaining cell, LC activation did not change the magnitude of the evoked response.
As noted above, there was a transient decrease in spontaneous activity after LC activation. Thus, it was important to determine whether there was a maintained change in spontaneous activity at the time when the perithreshold response was enhanced. To examine tonic changes in spontaneous activity, the mean prestimulus baseline (200 msec) from PSTHs collected before ACh injection (control PSTHs) was compared with that obtained 5–10 min after ACh microinjection. This comparison revealed that there was no significant difference in spontaneous activity before LC activation and the period when post-LC activation PSTHs were collected (19.6 ± 1.9 vs 19.1 ± 1.7 spikes/sec; see Table 1). Furthermore, there was no significant correlation between the baseline spontaneous discharge rate and the percentage change in the perithreshold response magnitude elicited by LC activation (r = −0.42; p > 0.08). Thus, changes in spontaneous activity do not seem to have produced the changes in evoked responses.
Effects of LC activation on mitral cell response to suprathreshold epithelium stimulation
Although LC activation dramatically increased the responses of mitral cells to perithreshold stimulation of afferent inputs, LC activation had little effect on the mitral cell response to suprathreshold epithelium stimulation. For the cell illustrated in Figure 6, the perithreshold response increased 44% during LC activation. The magnitude of the response to suprathreshold stimulation, however, decreased by 27%. For the six cells in which both peri- and suprathreshold stimuli were tested before and after LC activation, the mean response magnitude for perithreshold stimulation increased by 71.5 ± 21.1%, whereas the response to suprathreshold stimulation decreased by 17.2 ± 5.4% (Table2). The decrease in the response to suprathreshold stimulation was not statistically significant.
Table 2.
Comparison of mitral cell responses to peri- and suprathreshold epithelium stimulation before and after LC activation
| Cell no. | Perithreshold stimulation | Suprathreshold stimulation | ||||
|---|---|---|---|---|---|---|
| Magnitude Pre-LC activation | Magnitude Post-LC activation | Magnitude change (%) | Magnitude Pre-LC activation | Magnitude Post-LC activation | Magnitude change (%) | |
| 2301 | 50 | 83 | 66 | 137 | 124 | −10 |
| 3112 | 39 | 76 | 95 | 100 | 96 | −4 |
| 3302 | 35 | 59 | 69 | 123 | 113 | −8 |
| 8601 | 27 | 39 | 44 | 50 | 36 | −27 |
| 8906 | 64 | 64 | 0 | 142 | 121 | −15 |
| 9001 | 29 | 74 | 155 | 185 | 112 | −39 |
| Mean ± SEM | 40.7 ± 5.7 | 65.8 ± 6.4* | 71.5 ± 21.2 | 122.8 ± 18.5 | 100.3 ± 13.5 | −17.2 ± 5.4 |
Summary of response magnitudes of epithelium-evoked excitation of mitral cells evoked by peri- and suprathreshold intensity shocks before and after LC activation. LC activation of LC substantially increased (p < 0.01) the response to perithreshold-evoked excitation and produced a small but nonsignificant decrease (p > 0.08) in the response to suprathreshold intensity shocks.
* Significantly greater than pre-LC activation value;p < 0.01, paired t test.
Changes in epithelium-evoked excitation with respect to LC infusion site
Table 1 summarizes the results of experiments in which the histological analysis confirmed that the ACh injection pipette had been in LC. In 13 experiments, the injections were made in the center of LC (Fig. 2B). In five experiments (3202, 6005, 6305, 7003, 8601), however, the injection site was in the rostral pole of LC, where noradrenergic cells are less dense. The mean increase in the epithelium-evoked response for these five cells by LC activation (61%) was somewhat less than that of the other 13 cells (77%). In seven other experiments, the ACh injection site was in either the rostral or the caudal pole of, or was superficial to, LC; these injections had no measurable effect on the mitral cell responses. Because these ACh injections may have activated only a few LC neurons, the data from these seven experiments are not included in Table 1.
DISCUSSION
Confirmed activation of LC neurons substantially increases mitral cells responses to weak OE stimulation. This suggests that LC neuronal activity could increase the sensitivity of mitral cells to improve the detection of weak odorants. LC enhancement of weak signals at the primary olfactory synaptic relay supports the hypothesis that LC functions to improve vigilance by increasing the ability of neural networks to detect weak signals (Foote et al., 1983). Furthermore, these results suggest that endogenously released NE, as indicated by increased LC neuronal activity, enhances responses of central neurons to sensory stimuli.
Technical limitations
Anesthesia
The present findings and those of others (Yu et al., 1993) demonstrate that mitral cell discharge undergoes periodic fluctuations in anesthetized rats. We found that mitral cell excitatory responses to OE stimulation fluctuated in parallel with variations in spontaneous activity; however, both the spontaneous and evoked discharge were stable when a relatively light level of methoxyflurane anesthesia was maintained. An important consideration is how closely mitral discharge under these conditions compares with that in unanesthetized animals. The mean mitral firing rate in 10- to 12-d-old unanesthetized rats is ∼1.5 spikes/sec (Wilson and Sullivan, 1992). This value is lower than the mean discharge rate in our study (∼18 spikes/sec), but the discharge rate of mitral cells in adult, unanesthetized rats is not known. Mitral cell discharge rates in our study, however, are comparable to those in unanesthetized rabbits (range, 6–30 spikes/sec; mean = ∼12 spikes/sec) (Chaput and Holley, 1979; Chaput, 1983). Notwithstanding, it is possible that anesthesia may have masked the effects of LC activation on mitral cell spontaneous discharge or on excitatory responses to suprathreshold-intensity epithelium shocks.
Electrical versus odor stimulation
Mitral cell responses to odors change with repeated exposure (Chaput and Holley, 1980; Mair, 1982; Harrison and Scott, 1986; Wellis et al., 1989). In addition, mitral cells often respond to a single odor with excitation at one concentration and with inhibition at another concentration (Harrison and Scott, 1986; Meredith, 1986; Wellis et al., 1989). Therefore, the present experiments used electrical stimulation of ORN axons to activate mitral cells. As reported previously, this provided excellent control of the intensity and duration of stimulation, thus facilitating comparison of the influence of LC activation on responses to weak versus strong olfactory nerve input (Schneider and Scott, 1983). We recognize, however, that it is difficult to compare the effects of electrical versus odorant stimulation. Thus, the significance of the present findings for the processing of odorant stimulation can only be suggestive until similar experiments are performed with odorants.
Monosynaptic versus polysynaptic effects of LC activation
LC projects to the horizontal limb of the nucleus of the diagonal band (NDB) and to piriform cortex (PC) (Mason and Fibiger, 1979;Loughlin et al., 1982; Vertes, 1988), both of which innervate MOB (De Olmos et al., 1978; Shipley and Adamek, 1984). PC stimulation inhibits mitral cells (Nakashima et al., 1978; Kunze et al., 1991); thus, it is unlikely that an LC→PC→MOB pathway increased mitral cell responsivity. NDB stimulation has been reported to both excite and inhibit mitral activity (Nickell and Shipley, 1988; Kunze et al., 1991,1992). Additional studies are necessary to determine whether an indirect LC→NDB→MOB circuit increases mitral responsivity to OE stimulation.
LC activation and NE release
NE levels in the MOB were not measured in this study; thus, it is not known whether LC activation resulted in NE release. Recent in vivo microdialysis experiments in our laboratory (Shipley et al., 1994), however, demonstrate that ACh microinjection into LC, as in this study, causes a 247% increase of NE in MOB. NE increases rapidly after LC activation and returns to baseline soon after (10–20 min) LC firing has returned to baseline. Thus, it is reasonable to assume that at least part of the physiological effects of LC activation observed in the present study are attributable to NE release in MOB. Future experiments using selective adrenergic agonists and antagonists can shed light on this. It should be noted that several neuroactive peptides (e.g., galanin, neuropeptide Y) colocalize with NE in LC neurons (Aston-Jones et al., 1995). It is possible that peptides released by LC activation contributed to the effects observed here.
The increased responsivity of some mitral cells to OE stimulation persisted for as long as 34–45 min after LC discharge returned to baseline. Several factors could account for this. (1) The four- to fivefold increase in LC activity sustained over 5–10 min may have exceeded the capacity of synapses to remove NE from the cleft. (2) The duration of LC activation, on the basis of recordings at the injection site, may underestimate the time for return to baseline for cells further away from the injection site. (3) The relatively long duration of the increased OE-evoked excitation may be attributable to increased activity in second messenger systems linked to noradrenergic receptors.
Physiological actions of NE
A consistent finding across a number of systems is that exogenous NE or activation of LC enhances the “signal-to-noise (S/N) ratio” of evoked responses, typically by decreasing spontaneous activity (i.e., noise) proportionately more than afferent-evoked activity (i.e., signal). NE enhancement of S/N ratios has been reported to be mediated by both α and β receptors (for reviews, see Woodward et al., 1979;Foote et al., 1983). Recent studies suggest that NE can enhance afferent-evoked activity in the absence of any changes in basal spontaneous activity. These studies have shown further that NE or LC activation can convert weak or subthreshold stimuli into a threshold response (Waterhouse et al., 1988, 1990; Mouradin et al., 1991). This “gating effect” on subthreshold stimuli is similar to the influence of LC on mitral responses to weak OE inputs observed in the present study.
Possible mechanisms of NE action in the MOB
NE fibers densely target the inframitral cell layers, to a lesser degree the EPL, and avoid the glomerular layer (McLean et al., 1989). Because the only major neuron type whose cell body and dendrites are distributed in these same layers is the granule cell, NE terminals may influence granule cells preferentially (McLean et al., 1989). In agreement with this, previous studies suggest that NE may increase mitral excitability by inhibition of granule to mitral synaptic transmission (i.e., disinhibition). In a turtle, exogenous NE increased spontaneous mitral discharge, an effect blocked by GABA (Jahr and Nicoll, 1982). Studies in cultured neurons suggest that NE inhibits mitral to granule transmission via activation of presynaptic α2 receptors on mitral cell dendrites (Trombley and Shepherd, 1992); this seems to be mediated by the inhibition of a high-threshold calcium current (Trombley, 1992). NE also reduces GABA-mediated inhibition of mitral cells, possibly by α2 receptor-mediated presynaptic inhibition of granule cells (Trombley and Shepherd, 1992). On the basis of these studies, the net influence of NE could be to uncouple mitral↔granule synapses and disinhibit mitral cells; however, inferences drawn from the action of NE in dissociated MOB cells should be extrapolated with caution to the action of NE on network properties.
The present finding that LC activation increased mitral cell responses to weak OE stimulation is consistent with the disinhibition hypothesis. If this is correct, however, then spontaneous activity should have increased, and the inhibitory response after OE stimulation should have decreased. This was not observed. Spontaneous activity was decreased transiently, and the duration of inhibition was not altered by LC activation. A simple disinhibition model may be inconsistent with the finding that responses to strong OE stimulation were not enhanced.
An additional mechanism by which NE could enhance mitral excitability is blockade of spike accommodation. In hippocampus and piriform cortex, NE inhibits a calcium-dependent potassium conductance that mediates spike accommodation (Madison and Nicoll, 1982; Constanti and Sim, 1987). Blockade of this conductance increases the number of spikes in response to excitatory inputs or intracellular depolarization but does not increase baseline spontaneous activity. Blockade of spike accommodation is consistent with the enhanced perithreshold-evoked excitation of mitral cells and with the lack of any persistent changes in mitral spontaneous activity during the period when evoked responses were increased. It is difficult, however, to reconcile this mechanism with the failure of LC activation to increase responses to suprathreshold level stimulation. It is possible that increased feedforward inhibition caused by higher intensity shocks may override increased excitability attributable to blockade of spike accommodation. Alternatively, the suprathreshold stimuli that was used may have produced maximal excitation of the cell (i.e., “ceiling effect”).
Regardless of the mechanism of the action of NE in the MOB, activation of LC significantly enhances mitral cell excitatory responses to weak OE stimulation. Differences between the results observed here and in previous studies may be attributable to differences in the actions of endogenously released versus exogenously applied NE, the species, or the preparation. Additional studies are needed to determine whether endogenously released NE modifies mitral↔granule synapses, mitral membrane conductances, or other inframitral cell types.
Functional significance of LC–NE actions on the MOB
NE has a significant impact on olfactory function. (1) NE increases rapidly in the MOB when male rats are exposed to sexually receptive females (Rosser and Keverne, 1985; Brennan et al., 1990). (2) Impregnated female mice exposed to the odor of a strange male, but not the impregnating male, abort. β receptor blockers or destruction of NE inputs to the MOB cause the female to abort when she is presented with the odor of the impregnating male (Keverne and de la Riva, 1982;Rosser and Keverne, 1985; Kaba and Keverne, 1988; Kaba et al., 1989;Brennan et al., 1990). (3) Bulb levels increase in post- but not prepartum ewes exposed to lamb odors (Kendrick et al., 1992). There was a parallel postpartum increase in mitral responses to the odor of lambs. (4) Young rats learn to discriminate between one of two odors paired with anogenital tactile stimulation (Sullivan et al., 1989). Noradrenergic receptor blockers or 6-OHDA lesions prevent this learning (Coopersmith and Leon, 1984; Wilson et al., 1985; Wilson and Leon, 1988; Sullivan et al., 1989). Taken together, these studies indicate that NE plays a critical role in modulating olfactory functions, including formation and/or recall of specific olfactory memories.
Footnotes
This work was supported by U.S. Department of the Army Grant DAMD17-91-C-1071, National Institute on Deafness and Other Communication Disorders Grant DC02588, and National Institute of Neurological Disorders and Stroke Grant NS24698.
Correspondence should be addressed to Michael T. Shipley, Department of Anatomy, University of Maryland School of Medicine, 685 West Baltimore Street, Baltimore, MD 21201.
REFERENCES
- 1.Adams LM, Foote SL. Effects of locally infused pharmacological agents on spontaneous and sensory-evoked activity of locus coeruleus neurons. Brain Res Bull. 1988;21:395–400. doi: 10.1016/0361-9230(88)90151-7. [DOI] [PubMed] [Google Scholar]
- 2.Aston-Jones G, Shipley MT, Grzanna R (1995) The locus coeruleus. In: The rat nervous system, 2nd Edition (Paxinos G, ed), pp 183–213. New York: Academic.
- 3.Berridge CW, Foote SL. Effects of locus coeruleus activation on electroencephalographic activity in neocortex and hippocampus. J Neurosci. 1991;11:3135–3145. doi: 10.1523/JNEUROSCI.11-10-03135.1991. [DOI] [PMC free article] [PubMed] [Google Scholar]
- 4.Brennan P, Kaba H, Keverne EB. Olfactory recognition: a simple memory system. Science. 1990;250:1223–1226. doi: 10.1126/science.2147078. [DOI] [PubMed] [Google Scholar]
- 5.Chaput M. Effects of olfactory peduncle sectioning on the single unit responses of olfactory bulb neurons to odor presentation in awake rabbits. Chem Senses. 1983;8:161–177. [Google Scholar]
- 6.Chaput M, Holley A. Spontaneous activity of olfactory bulb neurons in awake rabbits, with some observations on the effects of pentobarbital anaesthesia. J Physiol (Paris) 1979;75:939–948. [PubMed] [Google Scholar]
- 7.Chaput M, Holley A. Single unit responses of olfactory bulb neurones to odor presentation in awake rabbits. J Physiol (Paris) 1980;76:551–558. [PubMed] [Google Scholar]
- 8.Constanti A, Sim JA. Calcium-dependent potassium conductance in guinea-pig olfactory cortex neurones in vitro . J Physiol (Lond) 1987;387:173–194. doi: 10.1113/jphysiol.1987.sp016569. [DOI] [PMC free article] [PubMed] [Google Scholar]
- 9.Coopersmith R, Leon M. Enhanced neural response to familiar olfactory cues. Science. 1984;225:849–851. doi: 10.1126/science.6474157. [DOI] [PubMed] [Google Scholar]
- 10.De Olmos J, Hardy H, Heimer L. The afferent connections of the main and accessory olfactory bulb formations in the rat: an experimental HRP-study. J Comp Neurol. 1978;181:213–244. doi: 10.1002/cne.901810202. [DOI] [PubMed] [Google Scholar]
- 11.El-Etri MM, Ennis M, Jiang M, Shipley MT. Pilocarpine-induced convulsions in rats: evidence for muscarinic receptor mediated activation of locus coeruleus and norepinephrine release in cholinolytic seizure development. Exp Neurol. 1993;121:24–39. doi: 10.1006/exnr.1993.1068. [DOI] [PubMed] [Google Scholar]
- 12.Ennis M, Aston-Jones G. Activation of locus coeruleus from nucleus paragigantocellularis: a new excitatory amino acid pathway in brain. J Neurosci. 1988;8:3644–3657. doi: 10.1523/JNEUROSCI.08-10-03644.1988. [DOI] [PMC free article] [PubMed] [Google Scholar]
- 13.Ennis M, Shipley MT. Tonic activation of locus coeruleus neurons by focal intracoerulear microinjection of an irreversible acetylcholinesterase inhibitor in vivo. Exp Neurol. 1992;118:153–163. doi: 10.1016/0014-4886(92)90033-m. [DOI] [PubMed] [Google Scholar]
- 14.Foote SL, Bloom FE, Aston-Jones G. Nucleus locus coeruleus: new evidence of anatomical and physiological specificity. Physiol Rev. 1983;63:844–914. doi: 10.1152/physrev.1983.63.3.844. [DOI] [PubMed] [Google Scholar]
- 15.Harrison TA, Scott JW. Olfactory bulb responses to odor stimulation: analysis of response pattern and intensity relationships. J Neurophysiol. 1986;56:1571–1589. doi: 10.1152/jn.1986.56.6.1571. [DOI] [PubMed] [Google Scholar]
- 16.Jahr CE, Nicoll RA. Noradrenergic modulation of dendrodendritic inhibition in the olfactory bulb. Nature. 1982;297:227–229. doi: 10.1038/297227a0. [DOI] [PubMed] [Google Scholar]
- 17.Kaba H, Keverne EB. The effect of microinfusions of drugs into the accessory olfactory bulb on the olfactory block to pregnancy. Neuroscience. 1988;25:1007–1011. doi: 10.1016/0306-4522(88)90053-x. [DOI] [PubMed] [Google Scholar]
- 18.Kaba H, Rosser A, Keverne B. Neural basis of olfactory memory in the context of pregnancy block. Neuroscience. 1989;32:657–662. doi: 10.1016/0306-4522(89)90287-x. [DOI] [PubMed] [Google Scholar]
- 19.Kendrick KM, Levy F, Keverne EB. Changes in the sensory processing of olfactory signals induced by birth in sheep. Science. 1992;256:833–836. doi: 10.1126/science.1589766. [DOI] [PubMed] [Google Scholar]
- 20.Keverne EB, de la Riva C. Pheromones in mice: reciprocal interaction between the nose and brain. Nature. 1982;296:148–150. doi: 10.1038/296148a0. [DOI] [PubMed] [Google Scholar]
- 21.Kunze WAA, Shafton AD, Kemm RE, McKenzie JS. Effects of stimulating the nucleus of the horizontal limb of the diagonal band on single unit activity in the olfactory bulb. Neuroscience. 1991;40:21–27. doi: 10.1016/0306-4522(91)90171-j. [DOI] [PubMed] [Google Scholar]
- 22.Kunze WAA, Shafton AD, Kemm RE, McKenzie JS. Olfactory bulb output neurons excited from a basal forebrain magnocellular nucleus. Brain Res. 1992;588:327–331. doi: 10.1016/s0006-8993(10)80044-7. [DOI] [PubMed] [Google Scholar]
- 23.Loughlin SE, Foote SL, Fallon JH. Locus coeruleus projections to cortex: topography, morphology and collateralization. Brain Res Bull. 1982;9:287–294. doi: 10.1016/0361-9230(82)90142-3. [DOI] [PubMed] [Google Scholar]
- 24.Madison DV, Nicoll RA. Noradrenaline blocks accommodation of pyramidal cell discharge in the hippocampus. Nature. 1982;299:636–638. doi: 10.1038/299636a0. [DOI] [PubMed] [Google Scholar]
- 25.Mair RG. Adaptation of rat olfactory bulb neurons. J Physiol (Lond) 1982;326:361–369. doi: 10.1113/jphysiol.1982.sp014198. [DOI] [PMC free article] [PubMed] [Google Scholar]
- 26.Mason ST, Fibiger HC. Regional topography within noradrenergic locus coeruleus as revealed by retrograde transport of horseradish peroxidase. J Comp Neurol. 1979;187:703–724. doi: 10.1002/cne.901870405. [DOI] [PubMed] [Google Scholar]
- 27.McLean JH, Shipley MT, Nickell WT, Aston-Jones G, Reyher CKH. Chemoanatomical organization of the noradrenergic input from locus coeruleus to the olfactory bulb of the adult rat. J Comp Neurol. 1989;285:339–349. doi: 10.1002/cne.902850305. [DOI] [PubMed] [Google Scholar]
- 28.McLennan H. The pharmacology of inhibition of mitral cells in the olfactory bulb. Brain Res. 1971;29:177–184. doi: 10.1016/0006-8993(71)90026-6. [DOI] [PubMed] [Google Scholar]
- 29.Meredith M. Patterned response to odor in mammalian olfactory bulb: the influence of intensity. J Neurophysiol. 1986;56:572–597. doi: 10.1152/jn.1986.56.3.572. [DOI] [PubMed] [Google Scholar]
- 30.Mouradian RD, Sessler FM, Waterhouse BD. Noradrenergic potentiation of excitatory transmitter action in cerebrocortical slices: evidence for mediation by an α1 receptor-linked second messenger pathway. Brain Res. 1991;546:83–95. doi: 10.1016/0006-8993(91)91162-t. [DOI] [PubMed] [Google Scholar]
- 31.Nakashima M, Mori K, Takagi S. Centrifugal influence of olfactory bulb activity in the rabbit. Brain Res. 1978;154:301–316. doi: 10.1016/0006-8993(78)90702-3. [DOI] [PubMed] [Google Scholar]
- 32.Nickell WT, Shipley MT. Neurophysiology of magnocellular forebrain inputs to the olfactory bulb in the rat: frequency potentiation of field potentials and inhibition of output neurons. J Neurosci. 1988;8:4492–4502. doi: 10.1523/JNEUROSCI.08-12-04492.1988. [DOI] [PMC free article] [PubMed] [Google Scholar]
- 33.Paxinos G, Watson C. Academic; New York: 1986. The rat brain in stereotaxic coordinates. . [DOI] [PubMed] [Google Scholar]
- 34.Rosser AE, Keverne EB. The importance of central noradrenergic neurones in the formation of an olfactory memory in the prevention of pregnancy block. Neuroscience. 1985;15:1141–1147. doi: 10.1016/0306-4522(85)90258-1. [DOI] [PubMed] [Google Scholar]
- 35.Salmoiraghi GC, Bloom FE, Costa E. Adrenergic mechanisms in rabbit olfactory bulb. Am J Physiol. 1964;207:1417–1424. doi: 10.1152/ajplegacy.1964.207.6.1417. [DOI] [PubMed] [Google Scholar]
- 36.Schneider SP, Scott JW. Orthodromic response properties of rat olfactory bulb mitral and tufted cells correlate with their projection patterns. J Neurophysiol. 1983;50:358–378. doi: 10.1152/jn.1983.50.2.358. [DOI] [PubMed] [Google Scholar]
- 37.Schoenfeld TA, Clancy AN, Forbes WB, Macrides F. The spatial organization of the peripheral olfactory system of the hamster. Part I: receptor neuron projections to the main olfactory bulb. Brain Res Bull. 1994;34:183–210. doi: 10.1016/0361-9230(94)90059-0. [DOI] [PubMed] [Google Scholar]
- 38.Shiekhattar R, Aston-Jones G, Chiang C. Local infusion of calcium-free solutions in vivo activates locus coeruleus neurons. Brain Res Bull. 1991;27:5–12. doi: 10.1016/0361-9230(91)90273-m. [DOI] [PubMed] [Google Scholar]
- 39.Shipley MT, Adamek GD. The connections of the mouse olfactory bulb: a study using orthograde and retrograde transport of wheat germ agglutinin conjugated to horseradish peroxidase. Brain Res Bull. 1984;12:669–688. doi: 10.1016/0361-9230(84)90148-5. [DOI] [PubMed] [Google Scholar]
- 40.Shipley MT, Halloran FJ, de la Torre J. Surprisingly rich projection from locus coeruleus to the olfactory bulb in the rat. Brain Res. 1985;329:294–299. doi: 10.1016/0006-8993(85)90537-2. [DOI] [PubMed] [Google Scholar]
- 41.Shipley MT, Ennis M, El-Etri M, Zimmer L, Jiang M (1994) Mechanisms and treatment of OP-induced seizures and neuropathology. USAMRMC Contract DAMD-17-91-C-1071: Final Report, June 1994, DITC ADA291296.
- 42.Shipley MT, McLean JH, Ennis M (1995) Olfactory system. In: The rat nervous system, 2nd Edition (Paxinos G, ed), pp 899–926. New York: Academic.
- 43.Sullivan RM, Wilson DA, Leon M (1989) Norepinephrine and learning-induced plasticity in infant rat olfactory system. J Neurosci 9: 3998–4006. [DOI] [PMC free article] [PubMed]
- 44.Trombley PQ. Norepinephrine inhibits calcium currents and EPSPs via a G-protein-coupled mechanism in olfactory bulb neurons. J Neurosci. 1992;12:3992–3998. doi: 10.1523/JNEUROSCI.12-10-03992.1992. [DOI] [PMC free article] [PubMed] [Google Scholar]
- 45.Trombley PQ, Shepherd GM. Noradrenergic inhibition of synaptic transmission between mitral and granule cells in mammalian olfactory bulb cultures. J Neurosci. 1992;12:3985–3991. doi: 10.1523/JNEUROSCI.12-10-03985.1992. [DOI] [PMC free article] [PubMed] [Google Scholar]
- 46.Vertes RP. Brainstem afferents to the basal forebrain in the rat. Neuroscience. 1988;24:907–935. doi: 10.1016/0306-4522(88)90077-2. [DOI] [PubMed] [Google Scholar]
- 47.Waterhouse BD, Sessler FM, Cheng J-T, Woodward DJ, Azizi SA, Moises HC. New evidence of a gating action of norepinephrine in central neurons circuits of mammalian brain. Brain Res Bull. 1988;21:425–432. doi: 10.1016/0361-9230(88)90154-2. [DOI] [PubMed] [Google Scholar]
- 48.Waterhouse BD, Azizi SA, Burne RA, Woodward DJ. Modulation of rat cortical area 17 neuronal responses to moving visual stimuli during norepinephrine and serotonin microiontophoresis. Brain Res. 1990;514:276–292. doi: 10.1016/0006-8993(90)91422-d. [DOI] [PubMed] [Google Scholar]
- 49.Wellis DP, Scott JW, Harrison TA. Discrimination among odorants by single neurons of the rat olfactory bulb. J Neurophysiol. 1989;61:1161–1177. doi: 10.1152/jn.1989.61.6.1161. [DOI] [PubMed] [Google Scholar]
- 50.Wilson DA, Leon M. Noradrenergic modulation of olfactory bulb excitability in the postnatal rat. Dev Brain Res. 1988;42:69–75. doi: 10.1016/0165-3806(88)90202-7. [DOI] [PubMed] [Google Scholar]
- 51.Wilson DA, Sullivan RM. Blockade of mitral/tufted cell habituation to odors by association with reward: a preliminary note. Brain Res. 1992;594:143–145. doi: 10.1016/0006-8993(92)91039-h. [DOI] [PubMed] [Google Scholar]
- 52.Wilson DA, Sullivan RM, Leon M. Odor familiarity alters mitral cell response in the olfactory bulb of neonatal rats. Dev Brain Res. 1985;22:314–317. doi: 10.1016/0165-3806(85)90186-5. [DOI] [PubMed] [Google Scholar]
- 53.Woodward DJ, Moises HC, Waterhouse BD, Hoffer BJ, Freedman R. Modulatory actions of norepinephrine in the central nervous system. Fed Proc. 1979;38:2109–2116. [PubMed] [Google Scholar]
- 54.Yu G-Z, Kaba H, Saito H, Seto K. Heterogeneous characteristics of mitral cells in the rat olfactory bulb. Brain Res Bull. 1993;31:701–706. doi: 10.1016/0361-9230(93)90144-z. [DOI] [PubMed] [Google Scholar]