

Abstract
Despite the wealth of information about endocytic pathways in non-neuronal cells, little is known about these crucial sorting, recycling, and degradative pathways in neurons. In this report, we analyzed in detail the dynamic steady-state organization of endocytically derived organelles as they progress through the endosomal–lysosomal pathway in axons of live cultured sympathetic neurons. By ratiometric imaging of neurons endocytically labeled with the pH indicator 8-hydroxypyrene-1,3,6-trisulfonic acid (HPTS), we demonstrate a trimodal frequency distribution of endocytic organelle pH in axon shafts, indicating two rapid acidification steps in the progression from endocytosis to the lysosome. Axonal branch points display a unimodal organelle pH distribution (mean 6.4), implicating them as meeting places for endocytic organelles and Golgi-derived vesicles or as sorting sites. By following endocytic organelle traffic retrogradely from growth cone to soma, we identified significant transition points in the pathway. Growth cones exhibit a unimodal pH distribution comprised mainly of acidified recycling/sorting endosomes (mean 6.3). However, organelles in the axon shaft immediately adjacent to the growth cone display the distinct trimodal pH distribution of the axon, suggesting that important sorting events occur between these domains. An abrupt increase in organelle acidification occurs in the distal axon 50–150 μm from the growth cone, demonstrating a discontinuous spatial gradient of acidification along axons. Immunofluorescence microscopy reveals that the lysosomal glycoprotein LEP100 is present in axons and is concentrated in two important regions: the proximal axon where the endocytic organelle population is largely acidified, and the same region of the distal axon where substantial acidification occurs.
Keywords: axon, neuron, endocytosis, organelle acidification, ratiometric imaging, pyranine, lysosome, growth cone
Despite the reliance of neurons on the endosomal–lysosomal system for a variety of signaling, sorting, and metabolic functions, its organization and dynamics and the relationship between different endocytic pathways in neurons remain poorly understood. From numerous studies in non-neuronal cells, we know the following. (1) Regulated membrane trafficking directs endocytosed materials to sorting and recycling compartments and into and through the degradative endosomal–lysosomal pathway. (2) Progression through these compartments is accompanied by a variety of molecular changes, particularly characteristic changes in organelle pH. (3) Coordination of traffic through these pathways depends in part on spatial arrangement, with earlier stages positioned near the cell periphery and later stages more centrally located (Mellman et al., 1986; Kornfeld and Melman, 1989). However, the distance over which this system spreads in axons presents numerous possibilities for its spatial organization which, in turn, have important implications for the steps involved in the entrance into and movement through the endosomal–lysosomal pathway.
Nearly all axonal endocytosis occurs at growth cones or presynaptic sites (LaVail and LaVail, 1974; Bunge, 1977; Sinclair et al., 1988;Parton et al., 1992), and endocytic organelles that exit these regions are transported unidirectionally back toward the soma (LaVail and LaVail, 1974; Bunge, 1977; Chang, 1985; Parton et al., 1992). However, the specific events of this retrograde journey remain unclear. Despite current opinion that late-endocytic and lysosomal organelles are restricted to the somato-dendritic domain (Parton et al., 1992;Augenbraun et al., 1993; Parton and Dotti, 1993; Craig and Banker, 1994), there is substantial evidence that this is not the case. First, biochemical analyses have demonstrated low-pH-dependent protease activity in axons (Nixon, 1980, 1982). Second, electron microscopic studies have documented lysosomes within axons using enzymatic markers and morphological criteria (Holtzman and Novikoff, 1965; Berthold and Mellström, 1986; Gatzinsky et al., 1988; Gatzinsky and Berthold, 1990). Furthermore, changes in the lysosomal population in axons during development (Gatzinsky et al., 1991) and after injury (Holtzman and Novikoff, 1965) or hyperosmotic stress (Broadwell and Brightman, 1979;Broadwell et al., 1980) suggest that there are regulatory mechanisms within this pathway that are important for cellular homeostasis. To further our understanding of the dynamics and organization of the endosomal–lysosomal pathway in neurons, we recently developed a sensitive, quantitative light microscopic technique for determining the pH of endocytically derived organelles in live cells and demonstrated the presence and nonuniform distribution of highly acidified, thus late endocytic and lysosomal, organelles within axons (Overly et al., 1995).
The data reported here provide new insight into the organization of endocytic pathways in axons and the nature of the progression into and through this dynamic, multifunctional family of organelles. We provide evidence not only that organelles representing all stages of the endosomal–lysosomal system reside in axons, but also that they display a nonuniform distribution that suggests sites for specific steps in the endosomal–lysosomal pathway. First, we show that progress from endocytosis to the lysosome involves two rapid acidification steps and that at least one of these may occur at branch points. Second, our data demonstrate that a majority of endocytic compartments within growth cones have internal pH values characteristic of recycling and sorting compartments, and that retrograde transport of endocytic organelles from the growth cone into the axon shaft must involve one or more specific sorting events. Finally, we show that the proximo-distal gradient of organelle acidification observed previously is generated in part by acidification of a significant proportion of organelles within a limited region of the distal axon, and that this pattern is consistent with the distribution of the lysosomal membrane glycoprotein LEP100.
MATERIALS AND METHODS
Materials. Unless otherwise specified, all reagents were obtained from Sigma (St. Louis, MO). HPTS and nigericin were purchased from Molecular Probes (Eugene, OR). The monoclonal antibody LEP100 (Lippincott-Schwartz and Fambrough, 1986) was obtained from the Developmental Studies Hybridoma Bank (Baltimore, MD), and the FITC-conjugated secondary antibody was from Vector Laboratories (Burlingame, CA).
Cell culture and endocytic labeling. Chicken epidermal fibroblasts and sympathetic neurons were obtained by dissection of 10 d chicken embryos, dissociated, and grown as described previously (Hollenbeck, 1989; Overly et al., 1995). For all experiments, neurons were grown for 24–48 hr before observation or fixation. To achieve steady-state labeling of endocytic pathways, cultured sympathetic neurons were incubated in culture medium supplemented with 2–4 mm HPTS for 6.5 hr overnight. Labeled cells were washed thoroughly with HBSS and returned to fresh culture medium immediately before observation.
Microscopy. For all experiments, cells were observed using a Zeiss IM-35 inverted microscope equipped with a long-working-distance condenser, a 63× planapochromatic objective, and a 100 W mercury lamp for epifluorescence illumination. Live cells were maintained at 37°C using an air curtain stage heater. Video images were obtained using an intensified Hamamatsu CCD video camera mounted on a video port containing a relay lens to obtain a field width of 47 μm. For ratiometric pH determination, the offset, gain, and intensifier sensitivity settings were kept constant. MetaMorph imaging software (Universal Imaging Corporation, West Chester, PA) was used for all digital image collection and image processing.
pH determination. Intraorganelle pH measurements were made as described previously (Overly et al., 1995), with modifications of the illumination source, image collection paradigm, and image processing software. Briefly, cultured sympathetic neurons were endocytically labeled with HPTS to steady state, washed thoroughly, and transferred to the microscope for immediate observation. A Metaltek shuttered filter wheel mounted in the light path was used to provide alternating 405 and 450 nm excitation light for ratio imaging. A heat filter and a 1.5 neutral density filter were positioned in the excitation light path to protect the cells and to eliminate bleaching, respectively, and a standard fluorescein filter set was used for emission filtration. Background image pairs were collected as numerical gray-scale averages of 32 video frames. Fluorescent image pairs were collected as numerical gray-scale averages of 16 video frames and saved for later analysis after digital subtraction of background images. Quantitative measurement of fluorescence intensities for each organelle at each excitation wavelength and their conversion first to anF450/405 ratio and then to an absolute pH value using calibration curves generated in situ using intact cells was done as detailed in Overly et al. (1995).
In situ calibration curves (F450/405vs pH) were generated at the time of each experiment as described previously (Overly et al., 1995). Briefly, fibroblasts were endocytically labeled with 2 mm HPTS for 2–4 hr and then pH-clamped for image collection by incubation in high-potassium buffers (15 mm MES, 15 mm HEPES, 130 mmKCl) of known pH supplemented with 10 μg/ml nigericin, a H+/K+ antiporter (Thomas et al., 1979). For each pH point on the standard curve, ratios were calculated from fluorescence intensity measurements from 10–117 pH-clamped organelles from at least two different fibroblasts.
Fixation, immunofluorescence, and quantification of LEP100 distribution. For LEP100 immunofluorescence detection, neurons were fixed in PBS containing 1.85% formaldehyde and 0.12 msucrose for 10–15 min, washed three times in PBS, then transferred to blocking solution (10% BSA in PBS) for 10 min. Cells were then permeabilized for 10 min in 0.02% saponin in blocking solution. Both primary (LEP100) and secondary (FITC-conjugated horse anti-mouse) antibodies were diluted 1:1000 in 1% BSA in PBS and applied for 1 hr followed by two 10 min washes in 1% BSA in PBS. After an additional wash in PBS and a brief wash in ddH2O, coverslips were mounted on glass slides using 1 mg/ml p-phelylenediamine in 90% glycerol and 10% 10× PBS (Johnson and Araujo, 1981).
Epifluorescence was visualized using a standard fluorescein filter set. For the quantification of the LEP100 distribution, epifluorescent images were collected as digital gray-scale averages of 16 video frames using shuttered mercury illumination to minimize bleaching. Images of entire axons were gathered as a series of adjacent segments. The lengths of all axon segments, which were summed for each axon to determine a total length, and the positions of all fluorescent puncta were measured manually from the display monitor.
RESULTS
There is a trimodal frequency distribution of endocytic organelle pH in axon shafts but not axonal branch points
We previously discerned a bimodal frequency distribution of endocytic organelle pH in axons of cultured embryonic chick sympathetic neurons at steady state (Overly et al., 1995). Using a more sensitive imaging system with the same ratiometric pH probe and procedure for the experiments in this study, we demonstrated that there is actually a trimodal frequency distribution of endocytic organelle pH (Fig.1A), suggesting that there are at least two rapid acidification steps involved in the progression of endocytic organelles through the endosomal–lysosomal pathway. The three peaks in this distribution correspond to pH values characteristic of different stages in this degradative pathway. Because the most basic peak is in the neutral range, as is the culture medium, it is likely to comprise endosomes that have been internalized but have not yet acidified. The middle peak spans pH values attributed to early and late endosomes (pH 5.0–6.0), and the most acidic peak is most likely to represent lysosomes (pH < 5.0) (Mellman et al., 1986).
Fig. 1.
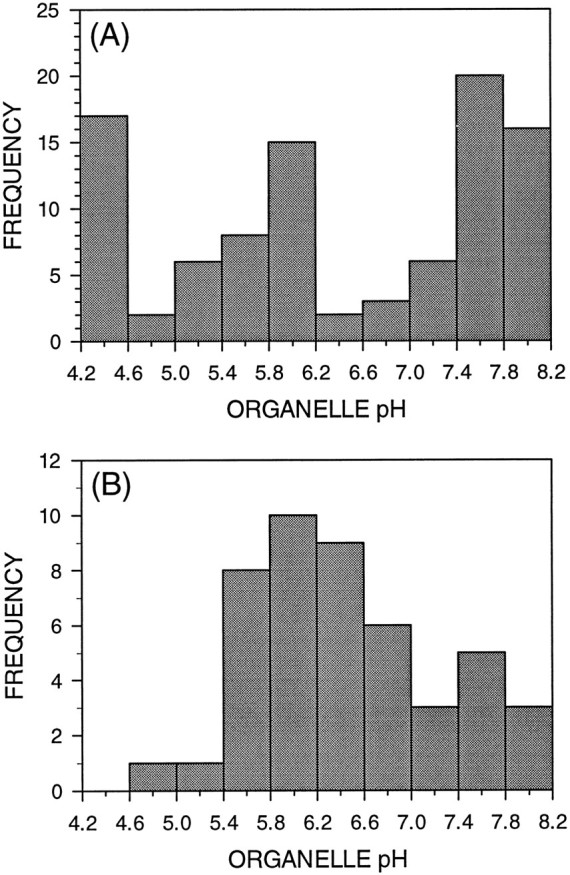
Endocytically derived organelles in axon shafts and branch points exhibit trimodal and unimodal frequency distributions of pH, respectively. The histograms show the frequency distributions of organelle pH for endocytically derived organelles located in axon shafts (A) and branch points (B).A, Ratiometric pH determination of 95 endocytically labeled organelles located throughout the axon shafts revealed one neutral and two acidified organelle populations. B, Organelles located in axonal branch points exhibited a broad unimodal distribution with a mean pH of 6.39 ± 0.67. Several neutral, but few highly acidified, organelles were observed at branch points.
There is growing evidence that axonal branch points are specialized domains. In contrast to the tight bundling of MTs in the axons shafts, MTs at branch points tend to be splayed (Yu et al., 1994), leaving regions rich in F-actin but devoid of MTs. Also, branch points often contain accumulations of intracellular organelles (Bartlett and Banker, 1984) and mRNAs (Olink-Coux and Hollenbeck, 1996). To see whether they might contain a distinct endocytic organelle population, we measured the pH of numerous HPTS-labeled organelles positioned at branch points and compared this organelle population with that observed in axon shafts. Analysis of the frequency distribution of organelle pH revealed that branch points do indeed contain a distinct endocytic organelle population (Fig. 1B). In contrast to the trimodal distribution of axonal organelle pH, endocytic organelles in branch points exhibit a broad but unimodal frequency distribution of pH, with a mean of 6.4. Furthermore, a significant proportion of branch point organelles have pH values that lie between the neutral and acidic peaks seen in axon shafts as a whole: 28% of branch point organelles exhibit pH values of 6.2–6.8, whereas only 4% of axonal organelles fall in this range. Thus branch points are a specialized endocytic domain, perhaps functioning as a meeting place for retrogradely transported endocytic organelles and anterogradely moving Golgi-derived vesicles delivering lysosomal components. Such interactions could be augmented by the tendency of organelles to show longer dwell times in branch points than in the axon shaft. However, these data are also consistent with a role for branch points as sorting stations in endocytic membrane trafficking.
Axonal growth cones contain predominantly recycling and sorting endosomes
As a step toward an understanding of the dynamics and events occurring early in axonal endocytic pathways, we looked specifically at the growth cone where the vast majority of axonal endocytosis occurs in more mature but still growing axons (Bunge, 1977; Sinclair et al., 1988). Because of its dynamic nature, its specialized roles as a site of growth and a sensory apparatus, and its dense array of internal membranes (Landis, 1983), many of which are thought to be involved in membrane recycling (Bunge, 1977; Cheng and Reese, 1985; Cheng and Reese, 1987; Dailey and Bridgman, 1993), we hypothesized that the growth cone may be a specialized endocytic compartment with a distinctive population of endocytic organelles. Steady-state labeling of the growth cone with HPTS reveals numerous endocytic organelles (Fig. 2), with some labeling of organelles in a few filopodia. Measurement of the pH of numerous individual organelles in many growth cones revealed striking differences with all other neuronal compartments (Fig.1A,B) (Overly et al., 1995), as well as with non-neuronal cells (data not shown). In growth cones, the endocytic organelle population exhibited a unique narrow unimodal distribution with only a few neutral or highly acidified organelles (Fig. 2B). The majority of organelles in growth cones exhibited pH values characteristic of early sorting (pH 6.2) and recycling endosomes (pH 6.5) (Gruenberg and Maxfield, 1995). Furthermore, the least common pH values for endocytic organelles in axon shafts as a whole are the most common for those in growth cones: only 4% of axonal organelles exhibit pH values of 6.2–6.8 (Fig.1A), whereas 44% of growth cone organelles have pH values in this range.
Fig. 2.

Growth cones contain endocytic organelles with a unique frequency distribution of pH. This histogram shows the frequency distribution of pH of 136 endocytic organelles from 24 growth cones. Growth cone organelles exhibit a narrow unimodal distribution with a mean pH of 6.29 ± 0.58.
Although a majority of endocytically labeled organelles were contained within the palm region of the growth cone, a few organelles were observed in a subset of filopodia, consistent with earlier observations (Bunge, 1977). The observed pH frequency distribution of filopodial organelles was bimodal: it showed an acidic peak reflecting the composition of the rest of the growth cone, but also contained a significant neutral peak comprising 40% of the observed filopodial organelles (Fig. 3A). Measurement of the position of each organelle along its filopodium revealed a nonuniform spatial distribution of endocytic organelles along filopodia: virtually all of the acidified organelles were restricted to the proximal 5 μm of filopodial length, whereas the neutral organelles were all located >5 μm from the lamella of the growth cone (Fig. 3B). The one acidic organelle positioned more distally (lower rightquadrant, Fig. 3B) was observed in an exceptionally long filopodium.
Fig. 3.
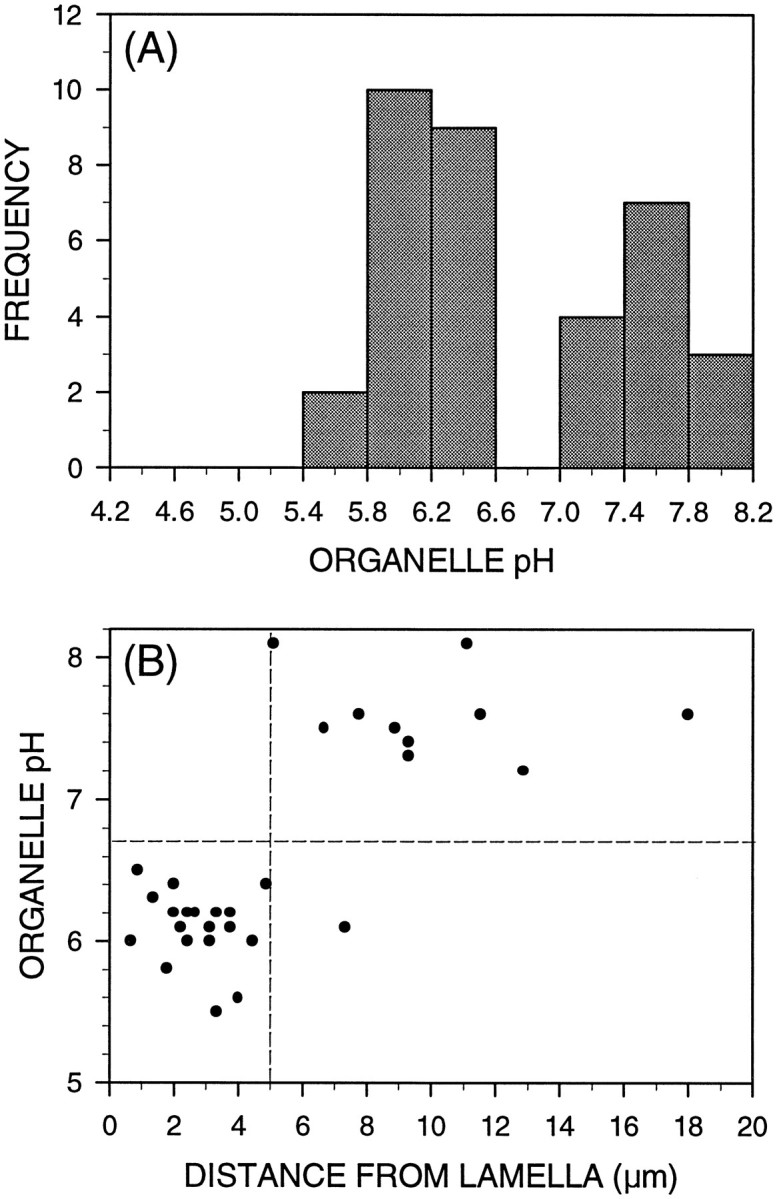
Some growth cone filopodia contain endocytic organelles. A, Determination of pH of 35 endocytic organelles in filopodia revealed a bimodal frequency distribution of pH. A majority of the organelles (60%) were slightly acidic, whereas a substantial portion (40%) remained neutral. B, The positions of all 30 organelles observed in filopodia longer than 5 μm were measured as a distance from the growth cone lamella and plotted against organelle pH. There was virtually no overlap between the neutral and acidified populations: all neutral organelles were located >5 μm from the lamella, whereas nearly all of the acidified organelles were confined to the proximal 5 μm of filopodia.
Distal-most axon segments contain predominantly neutral endocytic organelles
The difference that we observed between the pH distributions of endocytic organelle populations in the axon shaft and those in the growth cone, where the majority of the organelles in the axon must have originated, raised several important questions. How are organelles destined for retrograde pathways selected and removed from the growth cone? Are the endocytic organelles in the distal region of the axon characteristic of the growth cone population or the overall axonal population? Is there evidence for important sorting events in the growth cone? To address these questions and to begin to understand the retrograde traffic of organelles out of the growth cone, we examined endocytic organelles in the distal 50 μm of axon length, immediately adjacent to the growth cone (Fig. 4). As in earlier studies (Bunge, 1977), we observed fewer endocytic organelles in the distal axon than in the growth cone. In addition, determination of pH values for numerous endocytic organelles in this axonal region revealed a trimodal frequency distribution of pH (Fig. 4A) reminiscent of that found in the axon shaft as a whole (Fig.1A). Thus, the organelle population in the axon immediately adjacent to the growth cone already exhibits axonal rather than growth cone characteristics, implicating the junction between the two domains as an important sorting region. Despite the fact that nearly all growth cone organelles are somewhat acidic, only 24% of endocytic organelles in the distal 50 μm of the axon shaft exhibit pH values of <6.7. Furthermore, a majority (83%) of these acidic organelles are confined to the 20 μm of axon immediately adjacent to the growth cone (Fig. 4B). This overwhelming predominance of neutral organelles in the distal axon, particularly 20–50 μm from the growth cone, is further evidence for important sorting events at the growth cone–axon junction.
Fig. 4.
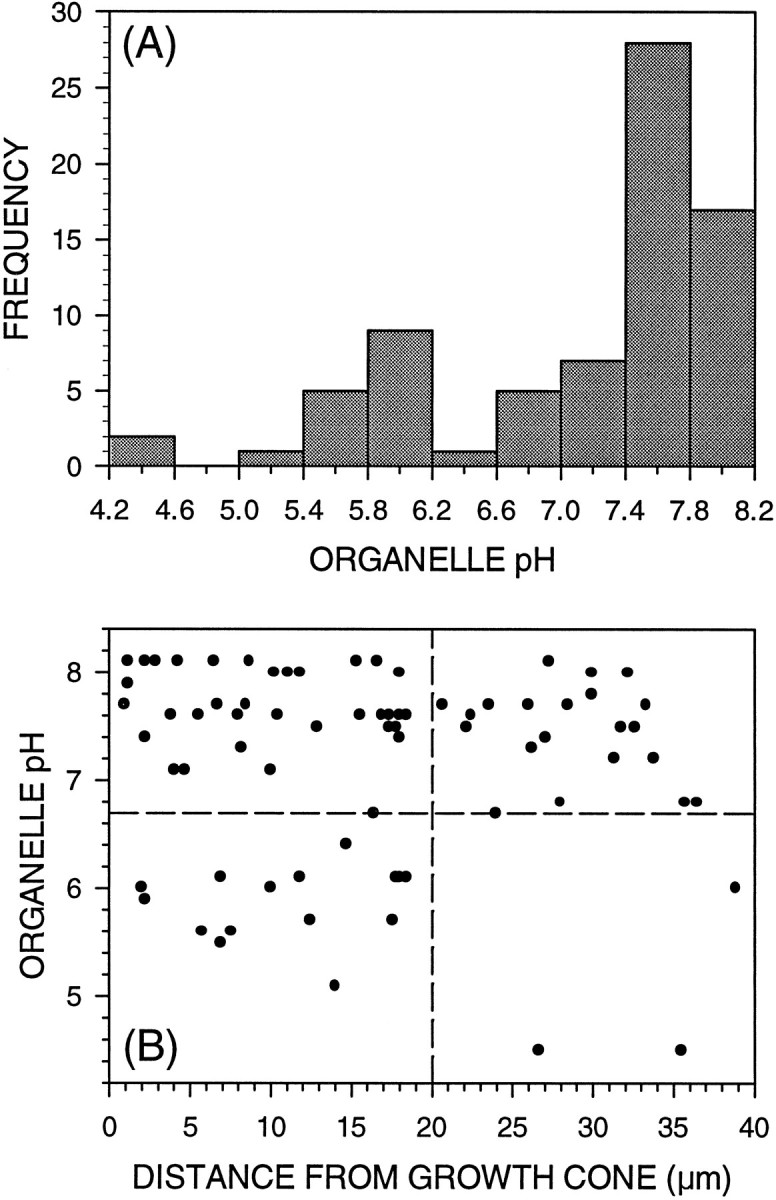
A majority of endocytically derived organelles in the distal axon are neutral in pH. A, This histogram shows the frequency distribution of pH of 75 endocytically derived organelles in the distal-most 50 μm of 25 axon shafts. This organelle population reflects the trimodal pH distribution of the entire axon, but contains predominantly neutral organelles: only 24% of endocytic organelles in this region exhibit pH values of <6.7. B, The position of each endocytic organelle in this distal region was measured as a distance from the growth cone and plotted against its pH on this scatter plot. A majority of acidified organelles are confined to the distal-most 20 μm of axon, immediately adjacent to the growth cone.
The distal axon greater than 50 μm from the growth cone represents a significant transition point in the endosomal–lysosomal pathway
Previously, we demonstrated that there is a gradient of endocytic organelle acidification along the length of axons: the proportion of acidified organelles increases with proximity to the cell body (Overly et al., 1995). These data, together with earlier observations that there is a similar proximo-distal gradient of low-pH-dependent degradative activity along axons (Nixon, 1980), strongly suggest that endocytic organelles progress through the degradative endosomal–lysosomal pathway as they are transported retrogradely from the distal tip of the axon to the cell body. To determine how this gradient is established, we analyzed endocytic organelle acidification in different axonal regions (Fig. 5) and the distribution of the avian lysosomal membrane glycoprotein LEP100 along the length of axons (Figs. 6, 7).
Fig. 5.
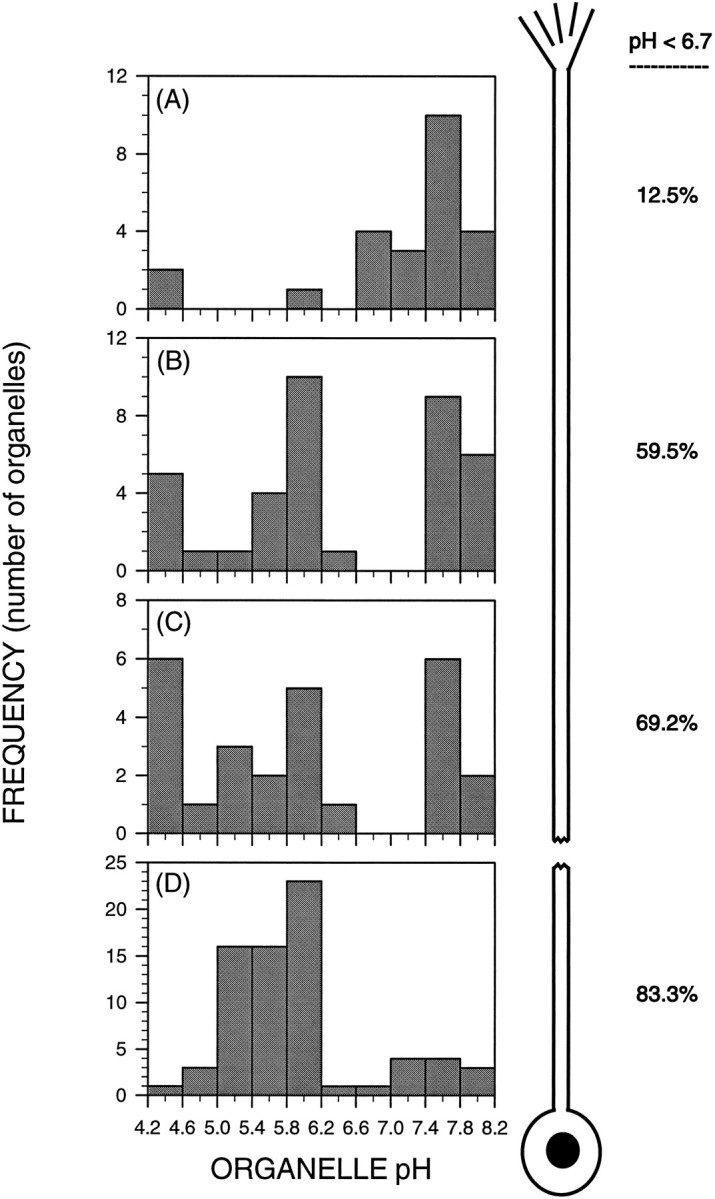
Axons exhibit a discontinuous gradient of endocytic organelle acidification along their length. This series of histograms shows the frequency distributions of pH of endocytically derived organelles located in progressively more proximal regions of the axon shaft: 20–50 μm (A), 100–150 μm (B), and 200–250 μm (C) from the growth cone and the proximal-most 50 μm of axon (D). The numbers to the right of each histogram indicate the percent of acidified endocytic organelles (pH < 6.7). There is a proximo-distal gradient of organelle acidification, with few acidified organelles in the distal axon (A), a majority of acidified organelles in the proximal axon (D), and intermediate proportions in between (C, D). There is a fivefold increase in the proportion of acidified organelles between 50 and 150 μm from the growth cone (A vs B), and much smaller increases more proximally (B–D).
Fig. 6.

The lysosomal membrane glycoprotein LEP100 is present in axons. A lysosomal membrane glycoprotein was visualized in cultured sympathetic neurons by immunofluorescence detection using the monoclonal antibody LEP100. Phase-contrast (A) and epifluorescent (B) images reveal a characteristic lysosomal staining pattern in the soma and an irregular punctate pattern in the axon. Fluorescent puncta were observed throughout the axon shaft as well as at branch points (arrow). Scale bar, 10 μm.
Fig. 7.
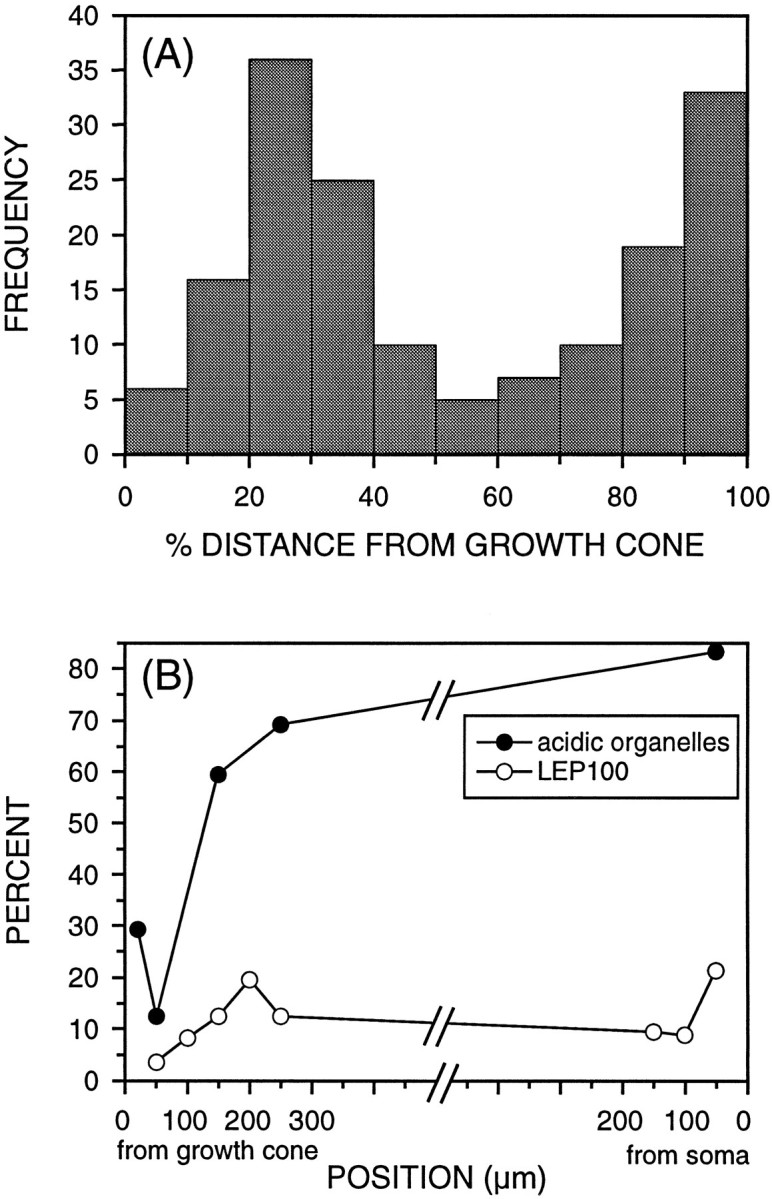
LEP100 is nonuniformly distributed along axons. After immunofluorescence detection of LEP100, the positions of all 168 fluorescent puncta detected in 6 axons were measured to characterize their distribution. A, This histogram shows the frequency of fluorescent puncta at different points along the axon. To normalize for axons of different lengths, distance from the soma was expressed as a percent of the total axon length. LEP100 exhibits an uneven spatial distribution along the axon, with high densities of fluorescent puncta adjacent to the soma and in the distal axon some distance from the growth cone. B, The proportion of endocytic organelles that are acidified (pH < 6.7; closed circles) and the proportion of axonal LEP100 (open circles) at different points along the axon were plotted to illustrate the spatial relationship between endocytic organelle acidification and LEP100 distribution. There is a dramatic increase in the number of acidified organelles just distal to one LEP100-rich region. The second LEP100-rich region is the proximal axon, where nearly all endocytically derived organelles are acidified.
Is the proximo-distal gradient of organelle acidification smooth, with organelles acidifying throughout the axon, or are there abrupt increases in organelle acidification in specific axonal regions? Using neurons whose endocytic pathways were loaded to steady state with the pH probe, we addressed this question by examining the retrograde path of the organelles to determine the frequency distribution of endocytic organelle pH in four regions: 20–30 μm from the growth cone, 100–150 μm from the growth cone, 200–250 μm from the growth cone, and in the 50 μm of axon immediately adjacent to the cell body (Fig.5). These data demonstrate that although there is a proximo-distal gradient of organelle acidification, this gradient is sharply discontinuous. In the segment of the distal axon between 50 and 150 μm from the growth cone, a nearly fivefold increase in the proportion of acidified organelles occurs: from 12.5 to 59%. This clearly implicates this region as a significant transition point in the axonal endosomal–lysosomal pathway. There is also acidification beyond this point, but its spatial gradient is more gradual, reaching 83% by the proximal-most 50 μm of axon. In addition, the size of the most acidic peak exhibited both regional and experimental variation (data not shown), consistent with previous observations of differential regulation of the lysosomal population in different axonal regions and in different cells (Gatzinsky et al., 1988; Gatzinsky et al., 1991).
Although organelle acidification is an essential component of progress through the endosomal–lysosomal pathway, acquisition by organelles of macromolecular components is another important element of this progression (Mellman et al., 1986; Kornfeld and Melman, 1989). Evidence for the anterograde axonal transport of organelles carrying materials such as acid hydrolases for the endosomal–lysosomal pathway (Broadwell et al., 1980) is consistent with the delivery of these materials to endocytic organelles within the axonal compartment. To assess the delivery and acquisition of late endocytic and lysosomal molecules, we characterized the distribution of the avian lysosomal membrane glycoprotein LEP100 in neurons by immunofluorescence (Figs. 6, 7). Whereas other immunofluorescence studies have detected late endocytic or lysosomal markers only in the somatodendritic domain (Parton et al., 1992; Augenbraun et al., 1993), by using conditions chosen to maximize the fluorescence signal without introducing any background we were able to demonstrate characteristic lysosomal staining in cell bodies and an irregular punctate pattern of LEP100 immunofluorescence, characteristic of organelle staining, in axons (Fig. 6). Fluorescent puncta were observed throughout the axon shaft and at branch points. LEP100 was virtually absent from growth cones: only one punctum was observed in the nine growth cones examined. Measurement of the positions of all fluorescent puncta revealed an uneven spatial distribution of LEP100 along axons, with relatively high concentrations of this molecule in two axonal regions: the proximal axon adjacent to the soma and the distal axon some distance from the growth cone (Fig.7A). The observed LEP100 distribution is consistent with the observed pattern of acidified organelles (Fig.7B): LEP100 is concentrated in the proximal axon where a majority of endocytic organelles are acidified and in the distal axon just proximal to the region where a significant proportion of endocytic organelles become acidified. Together, these data strongly implicate this defined region of the distal axon as a major transition point in the progress of retrogradely transported endocytic organelles through the degradative endosomal–lysosomal pathway.
DISCUSSION
Although the basic repertoire of sorting, signaling, recycling, and degradative functions carried out by the endosomal–lysosomal system seems likely to be very similar in neurons and non-neuronal cells, the extraordinary distances spanned by single neurons place unique demands on these metabolic and signaling pathways. This undoubtedly requires that the positioning, regulation, and trafficking of endocytic organelles show neuron-specific features (Holtzman et al., 1993). All organelles within the endosomal–lysosomal system share the same origin, beginning with invagination and budding of the plasma membrane. However, with the exception of synaptic vesicle recycling (Sudhof, 1995), what happens beyond this point in neurons remains largely unexplored and the extent of overlap and divergence of endocytic pathways is poorly understood. Although some trafficking information may be encoded in the endocytic machinery itself, there must be critical sorting events further downstream leading to the proper retention and recycling of endocytosed materials locally, or to their shipment to more distant parts of the cell for signaling or degradation. One particularly important sorting decision is that which controls entrance into and progression through the degradative pathway. Degradative metabolism is essential to the maintenance of cellular homeostasis, yet the misdirection of signaling ligands or other important materials into degradative pathways would be detrimental to the cell. In an effort to understand the dynamics, interrelationship, and regulation of neuronal endocytic pathways, we have examined their steady-state organization in axons of live cells and have identified three specific regions where critical regulatory events in endocytic processing are likely to take place: the growth cone, distal axon, and axonal branch points. Together with the knowledge that the majority of axonal endocytosis occurs at the growth cone or axon terminal (LaVail and LaVail, 1974; Bunge, 1977; Sinclair et al., 1988; Parton et al., 1992) and that endocytic organelles are transported unidirectionally back toward the soma (LaVail and LaVail, 1974; Bunge, 1977; Chang, 1985; Parton et al., 1992), our data provide important insights into the dynamic regulation of endocytic organelle trafficking. These data suggest a model of endocytic organelle traffic in axons that involves three important transition points (Fig. 8).
Fig. 8.

Model of endocytic organelle traffic in axons. Material enters the growth cone, where it most likely acidifies slightly and encounters sorting and recycling machinery. From here, an important sorting event takes place (1). Perhaps by budding from a sorting compartment (a) or by direct transport from the plasma membrane (b), a subset of the endocytosed material is sent retrogradely out of the growth cone into the distal part of the axon shaft. After these neutral organelles have been transported some distance from the growth cone, they encounter another important transition point where many of them acidify (2). The high concentration of LEP100 in this region suggests that the incoming endocytic organelles are encountering anterogradely moving vesicles delivering macromolecular components involved in progression through the degradative endosomal–lysosomal pathway. From here they continue their retrograde journey and often encounter branch points (3), another region where significant organelle acidification might occur and encounters with anterogradely moving delivery vesicles might take place. By the time they reach the cell body, most of the endocytic organelles are acidified and are well into the degradative endosomal–lysosomal pathway. However, a small fraction of organelles do remain neutral at this point and likely represent those that are necessarily excluded from the degradative pathway.
Entry at the growth cone
The dynamic nature of the growth cone makes it likely to be a distinctive endocytic domain. It performs a number of different but interrelated membrane trafficking tasks: internalization of trophic signals and other environmental information, local recycling of proteins and plasma membrane components, addition and proper localization of new materials arriving from the biosynthetic pathway, and direction of some materials into degradative pathways (Landis, 1983). Although their primary function is quite different, mature presynaptic terminals must meet similar membrane trafficking demands (Parton and Dotti, 1993). Consistent with the spatial convergence of this complex array of trafficking routes, electron microscopic studies have revealed that not only are growth cones densely packed with internal tubular and vesicular membranes (Landis, 1983), but these membranes are also highly ordered (Cheng and Reese, 1985; Cheng and Reese, 1987). Morphological observations in conjunction with labeling studies using endocytic tracers led to the widely accepted hypothesis that many of these membranes, in particular the observed stacks of tubular structures, were specialized for recycling (Chang, 1985; Cheng and Reese, 1985, 1987). Our direct quantitative light microscopic measurement of acidity of endocytic organelles in growth cones of living neurons provides the first physiological data that are consistent with this hypothesis: a majority of organelles exhibit pH values characteristic of recycling and sorting endosomes. These data complement previous video microscopic observations of growth cone vacuole dynamics (Dailey and Bridgman, 1993).
Although we detected relatively few endocytic organelles in filopodia, their spatial and pH frequency distributions suggest that there is active endocytosis in at least some filopodia. The neutral pH values of organelles found >5 μm from the lamella suggest that they are newly formed endocytic organelles. The restriction of acidified organelles to the proximal 5 μm of filopodial length suggests that they are organelles from the palm of the growth cone, trapped by the local lamellar collapse into a filopodium. Alternatively, the acidification machinery may be restricted to this portion of filopodia, permitting organelles to acidify only after transport into this region.
Exit from the growth cone: a critical sorting step
Although a majority of endocytic organelles in the growth cone appear to be involved in local recycling and sorting of materials, a subset of endocytosed material is transported out of the growth cone, into the axon, and retrogradely toward the soma (Chang, 1985; Parton and Dotti, 1993). How this population is selected and removed from the rest of the growth cone’s internal membrane system is poorly understood, although there is some evidence for the differential distribution of ferritin and horseradish peroxidase within growth cones (Bunge, 1977). To address this question, we examined endocytic organelles in the distal axon, immediately adjacent to the growth cone. Our observations that there are fewer endocytic organelles in this region of the axon than in the growth cone and that they exhibit a strikingly different pH frequency distribution argue for important sorting events at the junction between the two domains. The observed restriction of nearly all of the acidified organelles to the most distal 20 μm of axon suggests that the sorting domain may extend into this region. Although these organelles might be actively transported out of the growth cone, it seems more likely that they are left behind as the growth cone advances, leaving newly formed axon in its path. The striking predominance of neutral organelles throughout the distal 50 μm of axon, particularly 20–50 μm from the growth cone, suggests two possible sorting routes out of the growth cone (Fig.8). First, endocytosed materials destined for retrograde transport might bypass the complex sorting and recycling system in the growth cone and enter the axon without any previous acidification. Alternatively, these neutral organelles might bud from the slightly acidified sorting endosomes and lose the capacity to maintain a lower internal pH after exiting this compartment. These two sorting paths are not mutually exclusive, and perhaps both exist and fulfill slightly different functions: the heterogeneity of retrograde traffic (Bunge, 1977; Hollenbeck, 1993; Parton and Dotti, 1993; Hollenbeck and Weld, 1994) suggests that there may be multiple endocytic pathways operating in parallel.
The degradative endosomal–lysosomal pathway
The degradative endosomal–lysosomal pathway is the most thoroughly studied endocytic pathway in non-neuronal cells, and its particular importance in neurons is indicated by the host of neurological disorders linked to defects in this pathway (Nixon and Cataldo, 1995). In all cells, progress through this degradative pathway involves fusion with Golgi-derived vesicles and is marked by three main changes: organelle acidification, acquisition and loss of molecular components, and centripetal transport (Mellman et al., 1986; Kornfeld and Melman, 1989). In this report, we have addressed all three components. First, we demonstrate that there is not just a bimodal frequency distribution of endocytic organelle pH as previously described, but that there is a trimodal pH frequency distribution. Our data suggest that progress from the endocytosis to the lysosome involves two rapid acidification steps: one from neutral pH to early/late endosomal pH as described previously (Overly et al., 1995), and a subsequent acidification step to the characteristic lysosomal pH. There is regional and cell-to-cell variation in the proportion of organelles in the most acidic peak, indicating that endosomal fusion with lysosomes or acquisition of lysosomal properties is a regulated event.
Where might these acidification steps occur? Our previous observation that there is a spatial gradient of organelle acidification along the axon shaft, with the proportion of acidified organelles increasing with greater proximity to the soma (Overly et al., 1995), suggested that the acidification might take place all along the axon. However, the results of this more detailed analysis reveal that a large proportion of endocytic organelles are acidified in specific axonal regions. First, it is clear that many endocytic organelles acidify within the axon shaft itself and that the majority of this acidification occurs in a restricted region of the distal axon, 50–150 μm from the growth cone. Our observation that there is a significant concentration of the avian lysosomal membrane glycoprotein LEP100 in this same region is consistent with the interpretation that a large proportion of endocytically derived organelles are progressing through the endosomal–lysosomal pathway there: not only are the organelles acidifying, but they are also encountering and presumably acquiring the molecular components of late endocytic and lysosomal organelles (Kornfeld and Melman, 1989). Axonal branch points are a second likely site of organelle acidification. Axonal microtubule arrays splay at branch points (Yu et al., 1994), yielding microtubule-free regions where transported organelles (Bartlett and Banker, 1984) and mRNA (Olink-Coux and Hollenbeck, 1996) often reside for extended periods. Thus, incoming endocytic organelles and anterogradely transported Golgi-derived vesicles may be more likely to meet in these regions. Our observations that branch points contain LEP100 and a significant proportion of endocytic organelles with pH values between the neutral and acidic axonal peaks is consistent with this being a site where these two pathways meet, making observation of acidification events more likely there. An alternative explanation of our data, however, is that these intermediate pH organelles are not in the process of acidification but, instead, maintain their pH and represent specifically positioned sorting compartments.
Other retrograde pathways
Although a majority of endocytically derived organelles are acidified by the time they reach the proximal-most axon segment, a small proportion remain neutral. Although this neutral organelle population could represent merely predegradative endocytic organelles and autophagic vacuoles (Hollenbeck, 1993) that have not yet acquired acidification machinery, it is likely that the composition of this population is more complex and that it may represent, instead, organelles the contents of which are necessarily protected from acidification and degradation. For example, there has been growing interest recently in the role of endocytic pathways in retrograde transport of trophic signals (Bothwell, 1995). If trophic factors must remain bound to their receptors or protected from degradation, it seems likely that they are carried in endocytic vesicles that are not acidified. Further investigation of specific endocytic pathways should clarify the relationships among them and lead to a better understanding of differential trafficking mechanisms.
Footnotes
This work was supported by a grant from the March of Dimes Birth Defects Foundation (P.J.H.) and Grant NS27073 from National Institutes of Health (P.J.H.), and by a Harvard University Ryan Fellowship (C.C.O.). The monoclonal antibody (LEP100) was obtained from the Developmental Studies Hybridoma Bank maintained by the Department of Pharmacology and Molecular Sciences, The Johns Hopkins University School of Medicine and the Department of Biological Sciences, University of Iowa under contract N01-HD-6-2915 from the National Institute of Child Health and Human Development. We thank Myrta Otero for technical assistance, and Marguerite Olink, Heather Rieff, Kyung-Dall Lee, and Joel Swanson for helpful discussions and critical reading of this manuscript.
Correspondence should be addressed to Dr. Peter J. Hollenbeck, Department of Neurobiology, Harvard Medical School, 220 Longwood Avenue, Boston, MA 02115.
REFERENCES
- 1.Augenbraun E, Maxfield FR, St Jules R, Setlik W, Holtzman E. Properties of acidified compartments in hippocampal neurons. Eur J Cell Biol. 1993;61:34–43. [PubMed] [Google Scholar]
- 2.Bartlett WP, Banker GA. An electron microscopic study of the development of axons and dendrites by hippocampal neurons in culture. I. Cells which develop without intercellular contacts. J Neurosci. 1984;4:1944–1953. doi: 10.1523/JNEUROSCI.04-08-01944.1984. [DOI] [PMC free article] [PubMed] [Google Scholar]
- 3.Berthold C-H, Mellström A. Peroxidase activity at consecutive nodes of Ranvier in the nerve to the medial gastrocnemius muscle after intramuscular administration of horseradish peroxidase. Neuroscience. 1986;19:1349–1362. doi: 10.1016/0306-4522(86)90148-x. [DOI] [PubMed] [Google Scholar]
- 4.Bothwell M. Functional interactions of neurotrophins and neurotrophin receptors. Annu Rev Neurosci. 1995;18:223–253. doi: 10.1146/annurev.ne.18.030195.001255. [DOI] [PubMed] [Google Scholar]
- 5.Broadwell RD, Brightman MW. Cytochemistry of undamaged neurons transporting exogenous protein in vivo. J Comp Neurol. 1979;185:31–74. doi: 10.1002/cne.901850104. [DOI] [PubMed] [Google Scholar]
- 6.Broadwell RD, Oliver C, Brightman MW. Neuronal transport of acid hydrolases and peroxide within the lysosomal system of organelles: involvement of agranular reticulum-like cisterns. J Comp Neurol. 1980;190:519–532. doi: 10.1002/cne.901900308. [DOI] [PubMed] [Google Scholar]
- 7.Bunge MB. Initial endocytosis of peroxidase or ferritin by growth cones of cultured nerve cells. J Neurocytol. 1977;6:407–439. doi: 10.1007/BF01178226. [DOI] [PubMed] [Google Scholar]
- 8.Chang PL. Retrograde axonal transport of horseradish peroxidase by the rat sympathetic neurons. Life Sci. 1985;9:30–36. [PubMed] [Google Scholar]
- 9.Cheng TPO, Reese TS. Polarized compartmentalization of organelles in growth cones from developing optic tectum. J Cell Biol. 1985;101:1473–1480. doi: 10.1083/jcb.101.4.1473. [DOI] [PMC free article] [PubMed] [Google Scholar]
- 10.Cheng TPO, Reese TS. Recycling of plasmalemma in chick tectal growth cones. J Neurosci. 1987;7:1752–1759. doi: 10.1523/JNEUROSCI.07-06-01752.1987. [DOI] [PMC free article] [PubMed] [Google Scholar]
- 11.Craig AM, Banker G. Neuronal polarity. Annu Rev Neurosci. 1994;17:267–310. doi: 10.1146/annurev.ne.17.030194.001411. [DOI] [PubMed] [Google Scholar]
- 12.Dailey ME, Bridgman PC. Vacuole dynamics in growth cones: correlated EM and video observations. J Neurosci. 1993;13:3375–3393. doi: 10.1523/JNEUROSCI.13-08-03375.1993. [DOI] [PMC free article] [PubMed] [Google Scholar]
- 13.Gatzinsky KP, Berthold C-H. Lysosomal activity at nodes of Ranvier during retrograde axonal transport of horseradish peroxidase in alpha-motor neurons of the cat. J Neurocytol. 1990;19:989–1002. doi: 10.1007/BF01186826. [DOI] [PubMed] [Google Scholar]
- 14.Gatzinsky KP, Berthold C-H, Corneliuson O. Acid phosphatase activity at nodes of Ranvier in alpha-motor and dorsal root ganglion neurons of the cat. J Neurocytol. 1988;17:531–544. doi: 10.1007/BF01189808. [DOI] [PubMed] [Google Scholar]
- 15.Gatzinsky KP, Berthold C-H, Fabricius C. Lysosomal activity in developing cat alpha-motor axons under normal conditions and during retrograde axonal transport of horseradish peroxidase. J Comp Neurol. 1991;312:599–609. doi: 10.1002/cne.903120410. [DOI] [PubMed] [Google Scholar]
- 16.Gruenberg J, Maxfield FR. Membrane transport in the endocytic pathway. Curr Opin Cell Biol. 1995;7:552–563. doi: 10.1016/0955-0674(95)80013-1. [DOI] [PubMed] [Google Scholar]
- 17.Hollenbeck PJ. The distribution, abundance, and subcellular localization of kinesin. J Cell Biol. 1989;108:2335–2342. doi: 10.1083/jcb.108.6.2335. [DOI] [PMC free article] [PubMed] [Google Scholar]
- 18.Hollenbeck PJ. Products of endocytosis and autophagy are retrieved from axons by regulated retrograde organelle transport. J Cell Biol. 1993;121:305–315. doi: 10.1083/jcb.121.2.305. [DOI] [PMC free article] [PubMed] [Google Scholar]
- 19. Hollenbeck PJ, Weld RS. Axonal homeostasis and the nature of regulated retrograde organelle transport. Hirokawa N. Neuronal cytoskeleton 1994. 85 101 Japan Scientific; Tokyo: Societies. [Google Scholar]
- 20.Holtzman E, Novikoff AB. Lysosomes in the rat sciatic nerve following crush. J Cell Biol. 1965;27:651–669. doi: 10.1083/jcb.27.3.651. [DOI] [PMC free article] [PubMed] [Google Scholar]
- 21.Holtzman E, Augenbraun E, StJules R, Santa-Hernandez M. Endosomes, lysosomes, and trans -Golgi-related systems in conventional neurons and the frog retina: shards and suppositions. Adv Cell Mol Biol Membr. 1993;1:225–267. [Google Scholar]
- 22.Johnson GD, Araujo GMdN. A simple method for reducing the fading of immunofluorescence during microscopy. J Immunol Methods. 1981;43:349–350. doi: 10.1016/0022-1759(81)90183-6. [DOI] [PubMed] [Google Scholar]
- 23.Kornfeld S, Melman I. The biogenesis of lysosomes. Annu Rev Cell Biol. 1989;5:483–526. doi: 10.1146/annurev.cb.05.110189.002411. [DOI] [PubMed] [Google Scholar]
- 24.Landis S. Neuronal growth cones. Annu Rev Physiol. 1983;45:567–580. doi: 10.1146/annurev.ph.45.030183.003031. [DOI] [PubMed] [Google Scholar]
- 25.LaVail JH, LaVail MM. The retrograde intraaxonal transport of horseradish peroxidase in the chick visual system: a light and electron microscopic study. J Comp Neurol. 1974;157:303–358. doi: 10.1002/cne.901570304. [DOI] [PubMed] [Google Scholar]
- 26.Lippincott-Schwartz J, Fambrough DM. Lysosomal membrane dynamics: structure and interorganellar movement of a major lysosomal membrane glycoprotein. J Cell Biol. 1986;102:1593–1605. doi: 10.1083/jcb.102.5.1593. [DOI] [PMC free article] [PubMed] [Google Scholar]
- 27.Mellman I, Fuchs R, Helenius A. Acidification of the endocytic and exocytic pathways. Annu Rev Biochem. 1986;55:663–700. doi: 10.1146/annurev.bi.55.070186.003311. [DOI] [PubMed] [Google Scholar]
- 28.Nixon RA. Protein degradation in the mouse visual system. I. Degradation of axonally transported and retinal proteins. Brain Res. 1980;200:69–83. doi: 10.1016/0006-8993(80)91095-1. [DOI] [PubMed] [Google Scholar]
- 29.Nixon RA. Increased axonal proteolysis in myelin-deficient mice. Science. 1982;215:999–1001. doi: 10.1126/science.7156980. [DOI] [PubMed] [Google Scholar]
- 30.Nixon RA, Cataldo AM. The endosomal-lysosomal system of neurons: new roles. Trends Neurosci. 1995;18:489–496. doi: 10.1016/0166-2236(95)92772-i. [DOI] [PubMed] [Google Scholar]
- 31.Olink-Coux M, Hollenbeck PJ. Localization and active transport of mRNA in axons of sympathetic neurons in culture. J Neurosci. 1996;16:1346–1358. doi: 10.1523/JNEUROSCI.16-04-01346.1996. [DOI] [PMC free article] [PubMed] [Google Scholar]
- 32.Overly CC, Lee K-D, Berthiaume E, Hollenbeck PJ. Quantitative measurement of intraorganelle pH in the endosomal-lysosomal pathway in neurons by using ratiometric imaging with pyranine. Proc Natl Acad Sci USA. 1995;92:3156–3160. doi: 10.1073/pnas.92.8.3156. [DOI] [PMC free article] [PubMed] [Google Scholar]
- 33.Parton RG, Dotti CG. Cell biology of neuronal endocytosis. J Neurosci Res. 1993;36:1–9. doi: 10.1002/jnr.490360102. [DOI] [PubMed] [Google Scholar]
- 34.Parton RG, Simons K, Dotti CG. Axonal and dendritic endocytic pathways in cultured neurons. J Cell Biol. 1992;119:123–137. doi: 10.1083/jcb.119.1.123. [DOI] [PMC free article] [PubMed] [Google Scholar]
- 35.Sinclair GI, Baas PW, Heidemann SR. Role of microtubules in the cytoplasmic compartmentation of neurons. II. Endocytosis in the growth cone and neurite shaft. Brain Res. 1988;450:60–68. doi: 10.1016/0006-8993(88)91544-2. [DOI] [PubMed] [Google Scholar]
- 36.Sudhof TC. The synaptic vesicle cycle: a cascade of protein-protein interactions. Nature. 1995;375:645–653. doi: 10.1038/375645a0. [DOI] [PubMed] [Google Scholar]
- 37.Thomas JA, Buschbaum RN, Zimniak A, Racker E. Intracellular pH measurements in Ehrlich ascites tumor cells utilizing spectroscopic probes generated in situ . Biochemistry. 1979;18:2210–2218. doi: 10.1021/bi00578a012. [DOI] [PubMed] [Google Scholar]
- 38.Yu WQ, Ahmad FJ, Baas PW. Microtubule fragmentation and partitioning in the axon during collateral branch formation. J Neurosci. 1994;14:5872–5884. doi: 10.1523/JNEUROSCI.14-10-05872.1994. [DOI] [PMC free article] [PubMed] [Google Scholar]