Abstract
The strength of many synapses is modified by various use and time-dependent processes, including facilitation and depression. A general description of synaptic transfer characteristics must account for the history-dependence of synaptic efficacy and should be able to predict the postsynaptic response to any temporal pattern of presynaptic activity. To generate such a description, we use an approach similar to the decoding method used to reconstruct a sensory input from a neuronal firing pattern. Specifically, a mathematical fit of the postsynaptic response to an isolated action potential is multiplied by an amplitude factor that depends on a time-dependent function summed over all previous presynaptic spikes. The amplitude factor is, in general, a nonlinear function of this sum. Approximate forms of the time-dependent function and the nonlinearity are extracted from the data, and then both functions are constructed more precisely by a learning algorithm. This approach, which should be applicable to a wide variety of synapses, is applied here to several crustacean neuromuscular junctions. After training on data from random spike sequences, the method predicts the postsynaptic response to an arbitrary train of presynaptic action potentials. Using a model synapse, we relate the functions used in the fit to underlying biophysical processes. Fitting different neuromuscular junctions allows us to compare their responses to sequences of action potentials and to contrast the time course and degree of facilitation or depression that they exhibit.
Keywords: synapse, facilitation, synapse model, spike decoding, neuromuscular junction, stomatogastric nervous system
The behavior of neural circuits depends critically on the properties of the synaptic connections within them. Modifications of synaptic transfer characteristics can have a significant impact on circuit dynamics. Various processes such as facilitation and depression alter effective synaptic strength over time scales similar to those of normal activity. To determine whether particular changes in the temporal pattern and rate of activity are sufficient to modify synaptic strength and alter network dynamics, we need to understand how postsynaptic potentials (PSPs) and postsynaptic currents (PSCs) are affected by presynaptic activity. To this end, we have developed a general procedure for predicting postsynaptic responses to arbitrary presynaptic spike trains.
Prediction of the PSCs or PSPs evoked by a presynaptic spike train is closely related to the reconstruction of a stimulus from the spike train of a sensory neuron, a process known as spike decoding (Bialek et al., 1991; Warland et al., 1991). In both cases, a map must be constructed from a discrete set of spike times to a continuous function of time that describes either the stimulus or, in our case, the PSC or PSP; however, our application of this approach is essentially inverted. Rather than reconstructing the stimulus that evoked a particular spike train as has been done previously, we use the spike train to predict the postsynaptic response that it evokes. Because of the similarity in the two approaches, we refer to the construction of an accurate description of postsynaptic responses as synaptic decoding. In developing the methodology, we have tried to satisfy the following conditions. (1) The method should be applicable to any spike train; (2) the method should be as simple as possible both to apply and to describe; and (3) it should be possible to relate parameters extracted from fitting the data to the underlying biophysical processes governing the behavior of the synapse.
A standard method for describing synaptic transmission is to measure responses to various spike trains and then build a model that accounts for the results (Mallart and Martin, 1967; Magleby and Zengel, 1975;Zengel and Magleby, 1982; for related models, see Zucker, 1989; Yamada and Zucker, 1992; Delaney and Tank, 1994). An alternative, model-independent approach is based on a Volterra expansion of the PSP time course (Krausz and Friesen, 1977). This method is extremely attractive because it provides a well defined program for building the description that is of general applicability; however, it has some limitations. Specifically, the statistics of the stimulus spike trains are restricted, and the method uses multivariable functions that are difficult to plot and describe and involves parameters that are not easily related to the relevant underlying biophysical processes.
Here we describe an approach that combines the desirable features of modeling techniques (Magleby and Zengel, 1975; Zengel and Magleby, 1982) with the generality and programmatic nature of the Volterra method (Krausz and Friesen, 1977). Our method can be applied to arbitrary spike trains, and it uses only functions of a single variable. One function describes the postsynaptic response to single, isolated presynaptic action potentials. In the examples shown here, a set of two functions accounts for the effects of the previous history of spiking. These functions are constructed by a learning algorithm that steadily improves the quality of the prediction (Abbott, 1994). After training on data from random spike sequences, postsynaptic responses to arbitrary trains of presynaptic action potentials can be predicted.
MATERIALS AND METHODS
Experimental procedures
All experiments were performed on male rock crabs (Cancer borealis) purchased from local fishermen in Boston, MA, and the crabs were held in aerated salt water aquaria at 12°C until used. Isolated neuromuscular preparations were dissected, placed in a 5 ml chamber, and superfused continuously with physiological saline at 10–15 ml/min with use of a gravity-fed system. Bath volume was ∼3 ml. The saline temperature was held between 10 and 12°C by means of a Peltier cooling system and was monitored continuously with a thermoelectric probe in the bath. Physiological saline had the following composition (in mm/l): 440 NaCl, 11.3 KCl, 13.3 CaCl2, 26.3 MgCl2, 11 Trizma Base, and 5.2 maleic acid, pH 7.4–7.5.
Crustacean stomatogastric muscles are innervated by excitatory motor neurons (Maynard and Dando, 1974; Hooper et al., 1986; Weimann et al., 1991). The motor nerve innervating the isolated muscle was stimulated with a suction electrode. Intracellular recordings from single muscle fibers were obtained with conventional microelectrodes with resistances of 8–12 mΩ filled with 2.5 m KCl. Synaptic currents were obtained with two microelectrode voltage clamps (Axoclamp 2A). The input impedance and the time constant of muscle fibers were measured under current-clamp conditions. One microelectrode was used to inject a family of hyperpolarizing currents, and the other electrode was used to measure the passive properties of the muscle fiber membrane. The distance between the electrodes was less than the length constant of the membrane.
A digital stimulus isolator (A–M Systems, Everett, WA) was used to stimulate the motor nerve with various spike trains generated by a modified version of the program IsoStim (A–M Systems). Stimulation consisted of Poisson spike trains with different average firing rates (1–10 Hz), but with the minimum interval between spikes restricted to 100–250 msec. Uniform trains at different frequencies (1–10 Hz) with different train durations (1–4 sec) were also used.
Elicited PSPs or PSCs were digitized, displayed, and stored in real time on a Macintosh IIfx using the ITC-16 interface board and the software Acquire (Instrutech). The sampling rate was 2 kHz. Additional copies of intracellular recordings were taped (Vetter digital model 3000A) and recorded on chart paper (Gould Instruments, Glen Burnie, MD). The data files from Acquire were processed using Igor Pro (WaveMetrics) to eliminate the stimulus artifacts from recordings and to format the data for further analysis. Final data consisted of a sequence of spike times and the corresponding time sequence of recorded electrode currents or voltages, called collectivelyRexp(t) in the following equations. Analysis of the data consisted of constructing an estimateRest(t) of this time sequence on the basis of knowledge of the spike times.
Analysis
Our description of the general method used to analyze postsynaptic responses is divided into several parts. First, we discuss the general mathematical equations we use to predict responses to arbitrary spike trains. These equations involve three unknown functions, called K1, K2, and F, that must be extracted from experimental data. Determining K1 is easy; it is just a fit of the postsynaptic response to a single, isolated action potential. Extracting the other two functions is more complicated and involves a two-step procedure. First, we derive a rough estimate of the shape and form of these functions using methods described below. These estimates allow us to construct functions dependent on a relatively small number of parameters that match these rough initial fits. Then, a training procedure is used to determine the parameter values that best fit the data. This two-step approach is first applied to the functionK2 and then to F, and finally both functions are fit together.
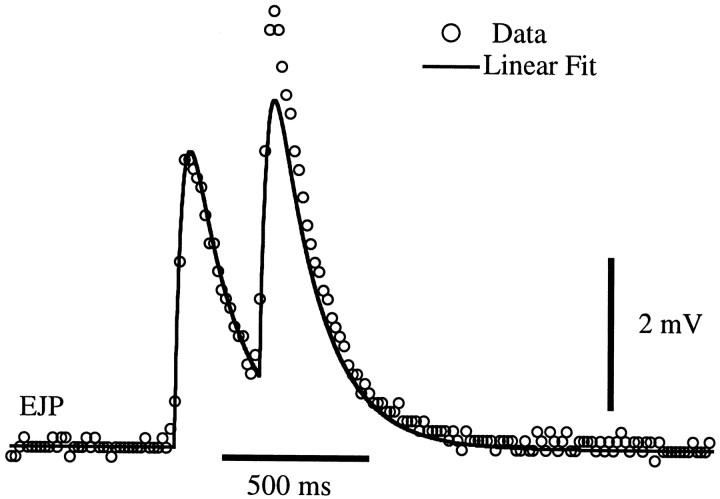
General formalism. We begin our analysis by describing the postsynaptic response to a single isolated presynaptic spike. If an isolated presynaptic spike arrives at time ti, a fit of the postsynaptic response (either a PSC or a PSP, depending on which is being described) at any later time t can be written as a function of the time difference, t − ti, K1(t − ti). The function K1is obtained by fitting average responses to isolated spikes. In all cases studied, a linear rise followed by an exponential decay provided an adequate fit of these responses. One such fit is shown in Figure1 (first response). Figure 1 also shows, for comparison purposes, the result of a crude and inaccurate attempt to describe the response to a second spike simply by summing the isolated-spike responses K1(t − ti) over the two spike timest1 and t2. As seen in Figure 1, such a prediction accounts for temporal summation of postsynaptic responses but fails to account for the facilitation seen in the figure.
Fig. 1.
Fit of EJPs by a sum of single-spike responsesK1. Open circles show recorded EJPs evoked by a pair of spikes. The solid lineis a prediction using a linear sum of two single-spike responsesK1. K1 was chosen to fit single isolated spikes, and it fits the first EJP accurately. Although temporal summation is seen, the prediction based on a sum of single-spike responses fails to account for the facilitation displayed by the data. Data are from a gm8 muscle with a baseline membrane potential of −59 mV.
To account for the dependence of individual PSCs or PSPs on the previous history of spiking, we introduce an amplitude factor that multiplies K1 to adjust the magnitude of the response (Magleby and Zengel, 1975; Krausz and Friesen, 1977):
| Equation 1 |
The factor 1 + A(ti) scales the isolated-spike response evoked at time ti by an amount that depends on the timing of this spike relative to others in the train. The factor A(ti) depends on the history of spiking before the timeti. To monitor this history, we introduce another time-dependent function K2 and calculate a sum over spikes occurring before the time ti:
| Equation 2 |
One simple approach to describing history-dependent processes would be to use this sum directly as the amplitude factor:A(ti) = S(ti). This produces a much better description of the postsynaptic response than the summation ofK1 alone; however, it does not provide an adequate description of the response to high-frequency spike trains. To improve accuracy, Krausz and Friesen (1977) add functions of two or more temporal differences to Equation 2. Although this strategy improves the fit, it can introduce artificial multiple time constants (see Results) and requires multivariable functions. In the cases we studied, a simpler procedure that does not suffer from these problems provided excellent fits.
Rather than introducing more complexity into the sum given by Equation 2, we reexpress the amplitude factor A in a more general form that allows for a nonlinear dependence on the sum over previous spikes:
| Equation 3 |
with F an arbitrary function of the sum Sgiven by Equation 2. This approach has the potential for solving the multiple time constant problem, and it eliminates the need for additional multivariable functions. The higher-order functions that would be introduced in other approaches may serve, in some cases, merely to reproduce a power series expansion of the functionF; however, these advantages come with a price. We must extract from the data both K2 and the functionF.
The general procedure we use to determine K2 andF is gradient descent reduction of the discrepancy between the predicted response Rest and the true response Rexp at every time step. Specifically, the algorithms we use minimize the squared difference between the measured response Rexp(t) and its predicted value Rest(t) given by Equation 1. As with all gradient descent procedures (Press et al., 1992), this is carried out by making small changes in the functions that maximize the decrease in the error as estimated by linear extrapolation. The procedure requires that we parameterizeK2 and F and then use gradient descent to determine the parameter values that provide the best fit to the data.
To deal with the problem of extracting both K2and F from the data, we start by ignoring F and determining K2 alone. Thus, we initially ignore any nonlinear dependence of the response amplitude on the sum over spikes and set the amplitude factor A equal to the sum (Eq. 2), which is equivalent to assuming F = S. We then find the function K2 that provides the best possible fit to the experimental data under this constraint. Because initially we have no idea what shape K2might have, we start with a very general parameterization. The large number of parameters involved at this stage makes it impractical to generate the final fit this way, but it allows us to extract an estimate of the general form of K2. From this estimate, we construct more compact parameterizations ofK2 and a better fit to the data. We next estimate the general shape of F, find a parameterization that fits this estimate, and finally extract the optimal values of the parameters describing both K2 and Fby gradient descent. All of these steps are described in more detail below.
Estimating K2. As an initial description of K2, we use a very general parameterization that describes virtually any smooth function. We divide time into discrete intervals t = nΔt for integer n and defineK2 in terms of its values at these timesK2(nΔt). For other times, the value of K2 can be obtained from these values by interpolation (we use a simple nearest point approximation). We then consider each of these discrete functional values K2(nΔt) as an independent, free parameter describing the full functionK2. As with any gradient descent method, we change the parametersK2(nΔt) at a rate proportional to the negative of the derivative of the error:
| Equation 4 |
where ε is a small number that determines the learning rate. The derivative on the right side of this equation can be computed to yield the learning rule:
| Equation 5 |
where Dn(ti − tj) is 1 if ti − tj lies between (n − 1/2)Δt and (n + 1/2)Δt and is zero otherwise. A disadvantage of this approach, especially if Δt is small, is that it is quite noisy, i.e., the pointsK2(nΔt) tend to be fairly scattered. We sometimes apply a smoothing procedure to reduce this noise.
A plot of the discrete valuesK2(nΔt) provides an estimate of the function K2, which can be fit by a smooth curve. Typically, this curve is described by a function that depends on a small number of parameters. In most of the cases that we studied, K2 could be described by a single exponential, K2(t) = Aexp(−Bt), although in one case the sum of two exponentials was required. Once we have such a parameterization, the gradient descent procedure can be repeated to extract the best fitting values ofA and B. The relevant equations for this, determined by computing the derivatives of the error with respect toA and B, are:
| Equation 6 |
with S given by Equation 2 and:
| Equation 7 |
Of course, this procedure is not restricted to exponential functions. If α is any parameter that controls the shape of the function K2, then its best fitting value can be determined by the equation:
| Equation 8 |
Estimating F. Once an estimate ofK2 has been constructed by the method described above, we can generate an estimate of the general shape of the functionF. To do this, we compare the amplitude factors predicted by the method for each presynaptic spike with the experimentally determined response amplitudes. Response amplitudesAexp (see Eq. 1) can be extracted from the data by measuring the peak height of each postsynaptic response, dividing this by the height of the isolated spike response (the peak of the function K1), and subtracting 1. A plot of these numbers against the sums S(ti) determined using the function K2 extracted above provides a direct estimate of F. Each spike produces one point on this plot [the point S(ti),Aexp(ti)], and collectively they trace out an estimate of the shape of F, because in our formalism A(ti) = F(S(ti)). In the cases that we studied, F could be fit accurately by a quadratic polynomial, F = S + bS2 with free parameter b.
Determining K2 and F. Once compact parameterizations of K2 and Fhave been obtained, we determine the best fit parameters for both of these functions by simultaneous gradient descent. ForK2(t) = Aexp(−Bt) and F = S + bS2, the free parameters A,B, and b are determined by iterating the gradient descent equations:
| Equation 9 |
| Equation 10 |
and
| Equation 11 |
until an acceptable fit is obtained. This typically requires a number of passes through the data set.
The above equations apply when K2 is described by a single exponential function and F by a quadratic polynomial; however, it is possible to use more complex fits involving a number of free parameters such as sums of exponentials or other functions. In this case, the optimal set of parameter values is again determined from the data by a gradient descent procedure. If α is any parameter affecting the form of K2, then the learning rule used to set its value is:
Similarly, if β is any parameter controlling the shape of the function F:
| Equation 13 |
Both of these equations are iterated while predictions and data are compared until an acceptable fit is obtained.
During the training procedure that determines the best fit parameters, the learning rate ε should be adjusted carefully to provide the best fit in the shortest possible time. This requires some care, because ε must be kept small enough to keep the algorithm stable but large enough to allow a reasonable rate of change in the parameter values. During the learning procedure, we periodically check that parameter changes are within an acceptable range and that the error is actually decreasing. If not, we adjust the value of ε. For the simultaneous fit of K2 and F, we sometimes use two different ε values to achieve faster convergence.
We used data from three 30-sec-long random spike trains to determine the fitting parameters. We then used the description constructed in this way to predict the postsynaptic responses to random spike trains that were not part of the training set used to extract the fitting parameters. We also compared predictions with data from uniform trains of different frequencies and durations. Finally, we quantified the discrepancies between the predictions and the data using a percentage root–mean–squared error. This consists of subtracting the prediction from the measured response at the peak of each response, squaring the result, averaging over all presynaptic spikes, taking the square root of the result, and finally expressing the error as a percentage of the average response amplitude. To avoid jitter associated with the peak point in the response, we typically averaged over a few points around the peak.
Computational model synapse and muscle
Part of our analysis uses computational models of a synapse and of a postsynaptic muscle fiber. For the model synapse, each presynaptic spike introduces a pulse of one unit of Ca2+ into the presynaptic terminal. The Ca2+ concentration decays exponentially, with a time constant of 1 sec. The model produces PSCs of a fixed shape with an amplitude proportional to the square of the calcium concentration in response to each input spike.
The muscle model was a simple RC-cell with resistance 0.3 mΩ and membrane time constant of 130 msec, as determined by measurements of typical passive properties of the recorded muscles. To model the PSP, the synaptic current predicted for a given spike train was injected into the RC-cell, and the voltage was determined by integration. In some cases, synaptic noise was included in the model by the addition of a small random number to the synaptic current to simulate variability seen in the data.
RESULTS
The synaptic decoding method was applied both to a computational model of a synapse and to various real synapses. In the case of the computational model, all of the “mechanisms” affecting synaptic transmission are known, and we can determine whether the extracted functions characterize them correctly. The real synapses we studied are crustacean neuromuscular junctions: specifically, synapses between stomatogastric ganglion motor neurons and muscles of the crabCancer borealis (Maynard and Dando, 1974; Hooper et al., 1986; Weimann et al., 1991). Unlike vertebrate neuromuscular junctions, in which each presynaptic action potential evokes a muscle fiber action potential, each presynaptic action potential at a crustacean neuromuscular junction evokes a graded postjunctional (postsynaptic) potential. Crustacean neuromuscular synapses display many of the features of central synapses in vertebrates, such as facilitation and depression, along with spatial and temporal summation, and they provide the reproducible long-term recordings needed to verify the method.
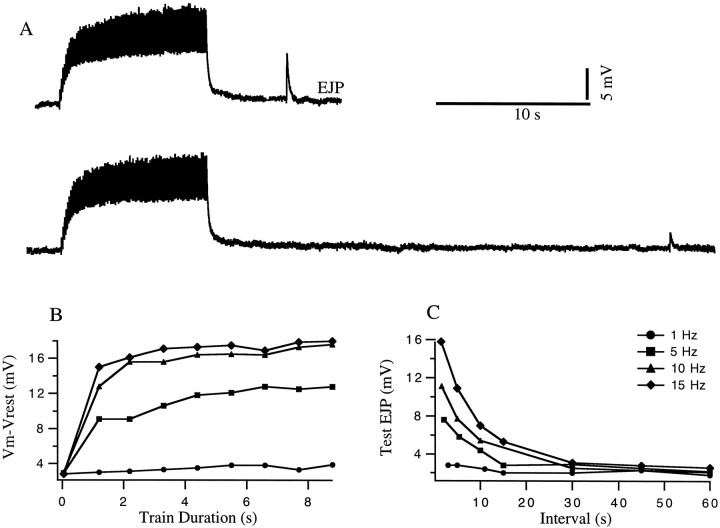
Before the synaptic decoding approach is applied, it is useful to illustrate the properties of one of the neuromuscular junctions that we studied by using a more conventional approach. This consists of applying spike trains of different durations and frequencies that are followed at a variable time intervals by a test pulse. The results of such a procedure applied to the gm8 muscle (Maynard and Dando, 1974) are shown in Figure 2. During the fixed frequency train, facilitation builds up during the first 1–2 sec, resulting in a five- to sixfold increase in the excitatory junctional potential (EJP) amplitude at the highest frequencies. The response to an isolated test spike shows that the degree of facilitation that develops during the train diminishes within ∼10-20 sec. Although curves like those of Figure 2 capture the basic phenomenon, they are not in a form that is useful for predicting responses to novel spike trains not included in the test set, which violates condition 1 cited in the introductory remarks. In addition, this format is not compact enough for convenient incorporation into network models (condition 2), nor is it well-suited for extracting underlying biophysical properties (condition 3).
Fig. 2.
Conventional analysis of facilitation.A, EJPs in response to a 10 sec conditioning burst at 10 Hz followed by a test impulse 5 sec and 30 sec after the burst.B, Buildup of facilitation as a function of time for different impulse frequencies during the train. This was obtained by measuring the change in the membrane potential from rest during the 10 sec burst. Symbols are defined in C. C, Decay of facilitation as a function of time for different impulse frequencies during the train. Results were obtained by measuring the amplitude of the test EJP at various intervals after the burst. Data are from a gm8 muscle with a baseline membrane potential of −65 mV.
Description of PSCs in a computational model of a synapse
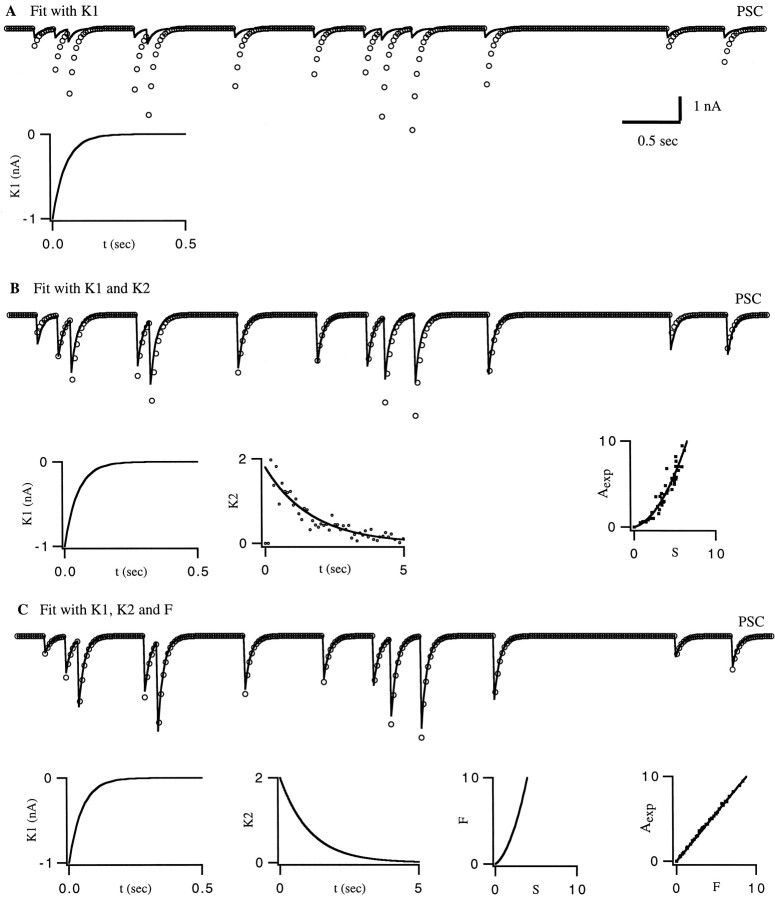
As a first example, we fit the PSCs produced by a computational model of a synapse. Although this is an artificial situation, it illustrates the use of the method on an example that allows direct connections between the fitting functions and the underlying synaptic dynamics. This example should not be viewed as a test of the method, because to a certain extent the method was constructed to fit such a model. The model synapse (described in Materials and Methods) displays facilitation attributable to Ca2+ buildup in the presynaptic terminal. The response to a single action potential was fit, in this case, by a single exponential with a time constant of 50 msec. Figure 3A shows clearly that a linear sum of single spike responses (A = F = 0) does not adequately describe the PSCs of the model synapse. Therefore, we introduce an amplitude factor, as in Equation 1, and construct the functions K2 and F that describe its dependence on the previous history of spiking.
Fig. 3.
Fitting the response of a computational model synapse. The responses of the model are shown as open circles, and the fit is indicated by solid curves. A, The fit usingK1 alone. This fails to capture the facilitation seen in the model. B, Fits with bothK1 and K2 but no nonlinearity; we have taken F = S. In this case, the fit is much better but is not perfect. The functions used are shown below the PSC plot. The middle figure is a scatter plot of the discrete point parameterization of K2 and an exponential fit of these points. The figure at the bottom right of this panel, plotting Aexp against S, shows that the assumption F = S is not correct and suggests the form of the function F that is needed. C, Fit with K1 andK2 and nonlinearity F. These functions are plotted below the PSC plot. The graph at the bottom right corner of this panel compares the amplitude Aexp extracted from the data, with its prediction F.
As outlined in Materials and Methods, we first ignored any possible nonlinear dependence of the response amplitude on the sum over spikes and set the amplitude factor A equal to the sum (Eq. 2) so that A = F = S. We then applied Equation 5 to get an idea of the shape of the functionK2. The resulting values ofK2(nΔt) are plotted in a scatter plot in Figure 3B. The smooth curve fit to these points in the figure is an exponential function,K2(t) = Aexp(−Bt). Because the exponential fits quite well, we next found the parameters A and B that gave the best possible fit to the experimental data by using Equations 6 and 7. The fit and function that K2 obtained in this way are shown in Figure 3B. Even without a nonlinearF function, the fit is much better than in Figure3A, but the limitations of the linear assumption for the function F can be seen in the form ofK2. This was fit by a single exponential with a time constant of 0.7 sec; however, the time constant for calcium removal in the computational model was 1 sec. Thus, the linear algorithm has extracted a time constant that does not agree with the dynamics of the underlying model.
Both the quality of the fit and the value of the extracted facilitation time constant can be improved by including a nonlinear Ffunction. We can see that nonlinearities are present by using the procedure discussed in Materials and Methods for extracting an estimate of F. Experimentally determined (or in this case model-generated) response amplitude factors are plotted against the sumS computed from Equation 2 in the right bottom plot of Figure 3B. Each spike generates an individual point on this scatter plot. If the assumption A = F = S used in the fit of Figure 3B were correct, the dots would fall along a diagonal line at 45° in this plot. The fact that they do not indicates that nonlinearities are present, and the pattern of dots provides an idea of what the function Fshould be. In this case, a polynomial is suggested, and the smooth curve fit to the data points in the right bottom plot of Figure3B is a quadratic function.
Our final fit uses Equation 1 with Equation 3 for the amplitude factor. The fitting parameters were determined by the gradient descent procedure on the basis of Equations 9, 10, 11. The result, shown in Figure3C, is an essentially perfect match to the model-generated PSCs. The function F plotted in the lower part of Figure3C matches the expectation for F extracted from the scatter plot in Figure 3B. We repeated the self-consistency check that we performed for the fit of Figure3B, this time plotting the amplitudeAexp extracted from the “data” with the prediction A = F. In this case, the dots on the scatter plot lie accurately on a diagonal straight line, indicating that the nonlinear function F has been extracted correctly. Furthermore, the time constant for K2 is now 1 sec, in exact agreement with the time constant of calcium removal in the computational model.
In this analysis of a model synapse, the failure of the initial fit of Figure 3B to account for the nonlinear nature of the facilitation amplitude F caused the time constant extracted from K2 to differ from the calcium uptake time constant of the underlying model. A simple example illustrates why this problem arose. Suppose that each spike elevates an exponentially decaying intracellular Ca2+ concentration by an amount ΔC. Consider a train of two spikes, one at timet = −Δt and the other at timet = 0. The subsequent Ca2+ concentration at time t is then [Ca2+] = ΔCexp(−t/τC)[1 + exp(−Δt/τC)], where τC is the decay constant for intracellular Ca2+. This expression decreases exponentially as both a function of t and of Δt, with a single time constant τC; however, if the postsynaptic response amplitude depends on [Ca2+] through a nonlinear polynomial function (as experimental data indicate), its dependence on both t and Δt will involve a sum of exponential terms with a number of different time constants ≤ τC. As a result, the number and the values of time constants extracted directly from the time or interspike interval dependence of the response amplitude without taking into account the nonlinearity have little relation to the underlying dynamics. In addition to incorrect characterization of the relevant time scales, this may create the false impression that more independent processes are involved in the synaptic biophysics than are actually present. Our method for introducing the nonlinear function Fis designed to alleviate this problem, although of course there is no guarantee that any mathematical fit will produce parameters that correspond directly to biophysical processes.
Application to the crustacean neuromuscular junction
We next developed a description of both PSCs and PSPs [or in this case, excitatory junctional currents (EJCs) and EJPs] in muscles responding to spike trains. The muscles we considered are the gm8, gm6, cpv4, and cpv7 muscles from the crab stomatogastric musculature (Maynard and Dando, 1974).
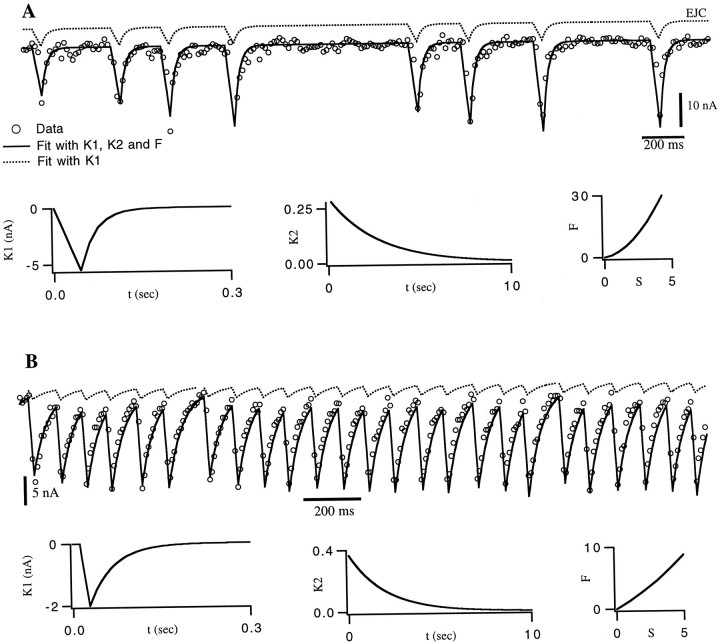
Figure 4 shows two fits of the model to EJCs from the gm8 muscle. To generate these fits, we followed exactly the same procedure that we used in fitting the model PSCs. We extractedK1 from EJCs in response to single, isolated spikes. This function is described by a linear rise during the first 45 msec, followed by an exponential decay with a time constant of 26 msec for the synapse in Figure 4A.K1 for the synapse of Figure4B had a similar shape, with these two parameters taking the values 28 mS and 40 mS, respectively. We then made the approximation F(S) = S and estimated the shape of K2, which fit an exponential. Then we determined an initial estimate of the value of the parameters of this exponential using the gradient descent learning rules (Eqs. 6 and 7) to minimize the difference between the predicted EJCs and those recorded in response to a random spike train. We next estimated the nonlinear function F(S) by comparing EJC amplitudes extracted from the data with the predicted values of the sumS. F was well fit by a quadratic function. Finally, we performed a simultaneous fit of K2 andF using Equations 9, 10, 11. The best fitting functionK2 was an exponential, with a time constant of 2.7 sec for Figure 4A and 2.0 sec for 4B.
Fig. 4.
Fit of EJCs from the gm8 muscle. In bothA and B, the upper dotted line is the result of a linear sum of single-spike responsesK1, with no amplitude factor included. Theopen circles are data points, and the solid curve is the prediction using the functionsK1, K2, andF plotted in the bottom row of graphs. These fits were the end result of a gradient-descent training session based on data that included the sequence shown. A, Over the entire data set, the r.m.s. error in the prediction of the peak EJC amplitude was 1.9 nA, corresponding to a 9% relative error.B, Stimulation of another synapse at higher frequency. In this case, the r.m.s. error in the prediction of the peak EJC amplitude was 1.2 nA, corresponding to an 8% relative error.
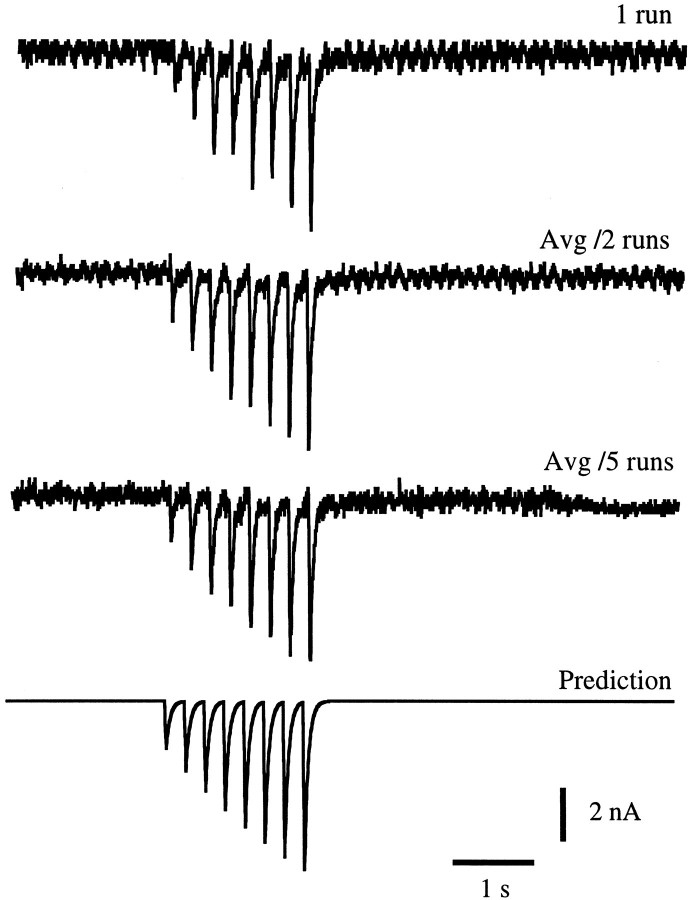
The predictions from the fit of Figure 4A were next compared with data not in the training set used to extractK2 and F. Figure 5shows the prediction for such a sequence compared with experimental data for the synapse and fit shown in Figure 4A. When we compare the prediction with data from a single run we find that the average error in the prediction is 10%; however, if we compare the prediction with data averaged over two runs with identical stimulation patterns the error drops to 7%. A comparison with data averaged over five runs reduces the error further to 5%. From this we conclude that the larger discrepancies between the predictions and data for single runs are primarily attributable to variability in the synaptic response itself and that on average the match is extremely good.
Fig. 5.
Predicting the response to a test train. This figure uses the synapse and fit shown in Figure4A, but involves EJCs evoked by a spike train not included in the training set used in that figure. The top trace shows the actual response during one trial. Thesecond trace shows the average of EJCs evoked by two identical spike trains, and the third trace shows an average of five trials. The bottom trace is the predicted response. The prediction errors for the data shown in these cases were 0.48 nA or 10% for the top trace, 0.34 nA or 7% for the second trace, and 0.24 nA or 5% for thethird trace.
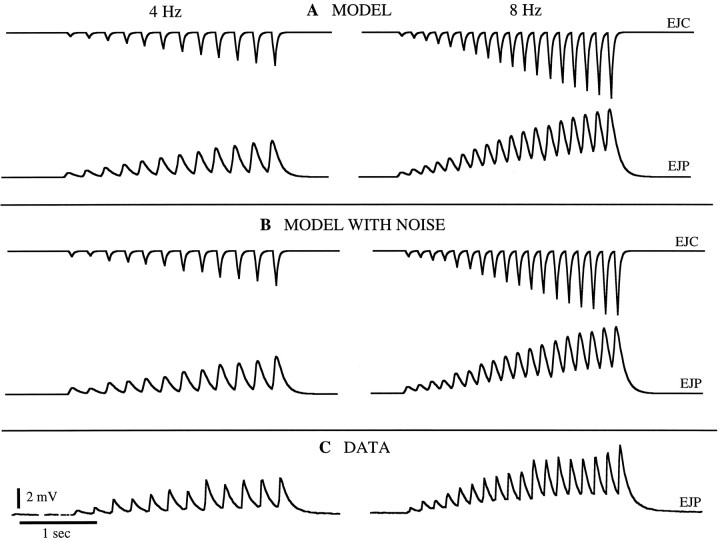
Once a precise description of PSCs has been constructed, it can be combined with a model of the postsynaptic cell to predict the PSP response. We show the results of such a combination in Figure6. Here we have taken the EJCs predicted by the description in Figures 4A and 5 and have used them to generate a prediction of the postjunctional potential (EJP) in the gm8 muscle. The simple RC model of the muscle described in Materials and Methods was sufficient for this purpose. As seen in Figure 6, the predicted EJPs match the measured responses quite well, and the match improves if a noise term is included in the model.
Fig. 6.
Model EJPs compared with data. A, The EJCs in response to 4 Hz and 8 Hz spike trains as predicted byK1, K2, and the nonlinearity of Figure 4A were fed into a simple RC model of the gm8 muscle based on measured passive properties of the muscle fiber. The resulting predicted EJPs are plotted.B, EJPs produced by the same model as inA but with added noise. C, Measured EJPs from the gm8 muscle in response to 4 Hz and 8 Hz trains.
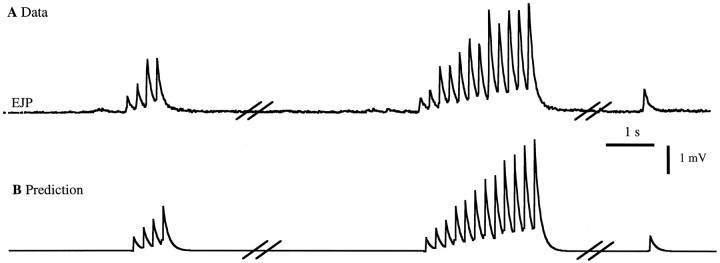
An alternative approach to predicting EJPs (or PSPs for a postsynaptic neuron), rather than combining EJC predictions with a postsynaptic cell model, is to describe them directly. To do this, we use the same formalism that we used for PSCs and EJCs, but in this case we compared the predictions of Equation 1 with measured EJPs. The resulting fits to the training data are shown in Figure 7. Figure8 shows the match of the prediction to data not in the training set. Note that for EJPs, K1 andK2 and F reflect both the time course of the synaptic current and the active conductances of the postsynaptic cell. K1 has a linear rise followed by an exponential decay with a time constant of 130 msec. This is longer than the time constant of K1 for EJCs because it includes the effects of the membrane time constant of the muscle. For this fit, K2 was the same as that for the synaptic current fit in Figure 4A, but the nonlinearity was modified. This modification is attributable to the extra complications introduced by the conversion of synaptic current into membrane potential within the muscle. Figure 8 shows the response to relatively brief spike trains. We have determined that for longer trains the fit matches the steady-state level of the EJP amplitudes at various rates (not shown).
Fig. 7.
A direct fit of EJPs for the gm8 muscle. The procedure and results are exactly like those in Figure 4 except that EJPs rather than EJCs were fit. Over the entire data set, the r.m.s. error in the prediction of the peak EJP amplitude was 0.4 mV, corresponding to a 13% relative error.
Fig. 8.
Predictions for a spike sequence not in the training set of Figure 7. The breaks in the traces represent time intervals of 20 sec and then 10 sec. A, Measured EJP response. B, The predicted response usingK1, K2, and the nonlinear function of Figure 7. Over the entire data set, the r.m.s. error in the prediction of the peak EJP amplitude was 0.3 mV (12% relative error).
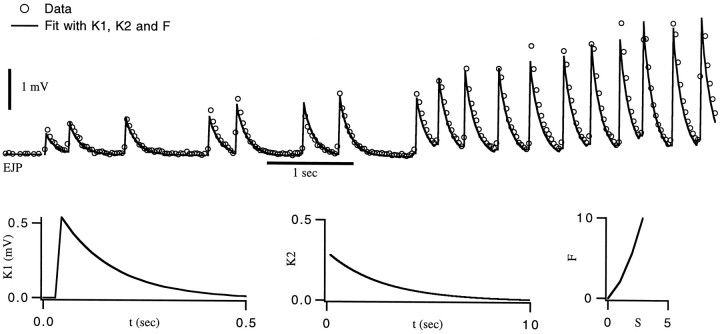
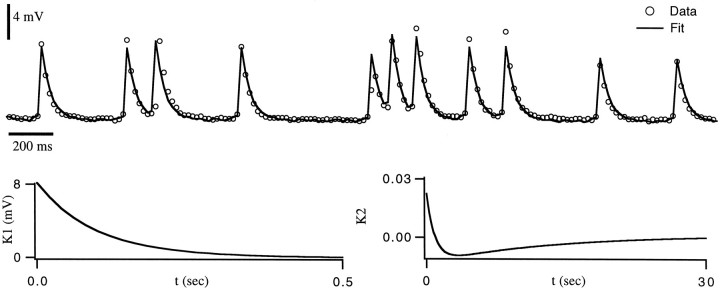
All of the examples given thus far show facilitation. The cpv7 muscle of the stomatogastric system, however, exhibits both rapidly acting facilitation and more slowly developing depression. Figure9 shows a fit of this muscle. The presence of both facilitation and depression is revealed by the fact thatK2 is initially positive but then becomes negative. K1 here was fit by a single exponential with a decay constant of 95 msec, whereasK2 was fit by the sum of two exponentials: a positive contribution with a decay time constant of 0.8 sec and a negative term with a time constant of 14.3 sec.
Fig. 9.
A synapse displaying both facilitation and depression. The top trace shows the fit to the EJPs evoked by a random spike train. The functions extracted by the fitting procedure are plotted underneath the EJP trace. The nonlinear functionF is similar to that in other figures and is not plotted. Data are taken from a cpv7 muscle with a baseline potential of −63 mV. Over the entire data set, the r.m.s. error in the prediction of the peak EJP amplitude was 1.3 mV (17% relative error).
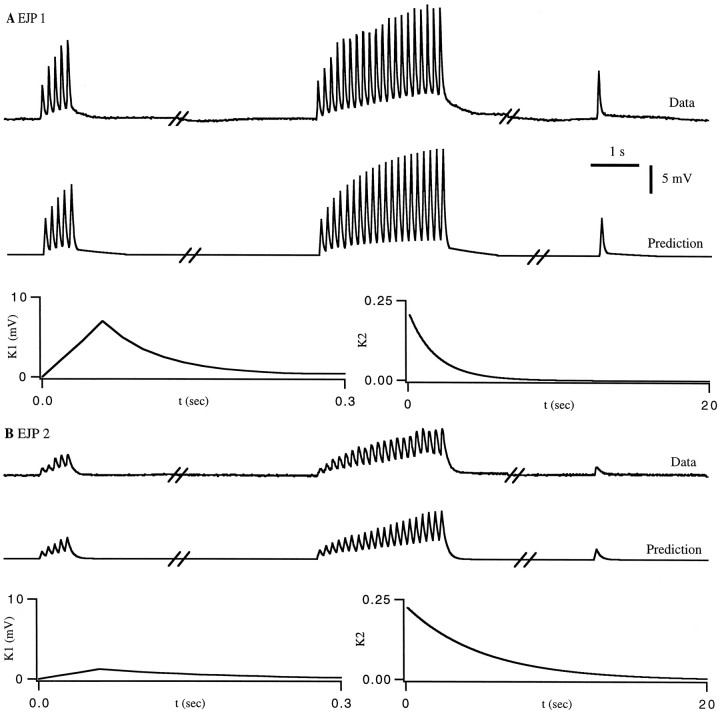
The description of synaptic transfer characteristics we have developed is useful both for studying a single synapse under different conditions and for comparing the properties of different synapses. Figure10 shows such a comparison for the gm6 and cpv4 muscles. As can be seen from K1 andK2, cpv4 is characterized by a larger single spike response and shorter-acting facilitation, whereas gm6 has a small response to isolated spikes but facilitation that is affected by a longer time period of previous spiking. Interestingly, the larger facilitation seen in the gm6 response is not the consequence of a larger amplitude K2, which would reflect the fact that each spike produces more facilitation. Rather, it is the result of a more slowly decaying K2, so that facilitation is affected by more of the previous spiking history. The function K2 describing facilitation for the cpv4 muscle has a time constant of 1.8 sec, whereas the corresponding time constant for the gm6 muscle is 5 sec.
Fig. 10.
Comparison of two synapses. The breaks in the traces represent time intervals of 20 sec and then 10 sec. In both cases, the functions used for the prediction are shownunderneath the two EJP traces. Nonlinear functionsF similar to those shown in previous figures were used here but are not plotted. A, Comparison of the measured and predicted responses of a cpv4 muscle to a test spike train. The baseline membrane potential was −56 mV. Over the entire data set, the r.m.s. error in the prediction of the peak EJP amplitude was 0.7 mV (5% relative error). B, Comparison of the measured and predicted responses of a gm6 muscle to a test spike train. The baseline membrane potential was −54mV. Over the entire data set, the r.m.s. error in the prediction of the peak EJP amplitude was 0.4 mV (8% relative error).
DISCUSSION
Changes in the synaptic or modulatory inputs to a neuron can modify its pattern of activity in ways that are easily measured; however, interpreting the functional significance of such changes is more difficult. This requires knowing whether the modified spiking patterns produce appreciably different responses in the postsynaptic targets of the observed neuron. For example, in the stomatogastric nervous system, a large number of neuromodulatory substances alter the firing patterns of stomatogastric ganglion motor neurons (Marder and Hooper, 1985; Harris-Warrick and Marder, 1991; Elson and Selverston, 1992; Harris-Warrick et al., 1992; Marder and Weimann, 1992; Dickinson, 1995). In the past it has been difficult to predict whether a change in motor neuron output produces a significant change in movement, because of the complex dynamics of facilitation, depression, and nonlinear muscle depolarization. We have now established a method that determines directly how changes in spiking patterns translate into changes in a postsynaptic membrane potential without requiring new experimental measurements for each novel case that arises. In addition, a precise description of synaptic transmission is an essential element for modeling neural circuits. Predicted PSCs associated with an arbitrary spike train can be combined with single-neuron models to construct realistic descriptions of synaptically coupled neural circuits.
Detailed models of synaptic facilitation, augmentation, potentiation, and depression have been developed from analyses of the responses of postsynaptic cells to families of spike trains (Mallart and Martin, 1967; Magleby and Zengel, 1975; Zengel and Magleby, 1982; Zucker, 1989;Yamada and Zucker, 1992; Delaney and Tank, 1994). Like the synaptic decoding method, these models can be used to predict the responses to novel spike trains. The description that resulted from the decoding approach is similar to that of some synaptic models (Magleby and Zengel, 1975; Zengel and Magleby, 1982). This is more reassuring than surprising, because both are describing similar phenomena; however, the procedure for constructing the description is quite different in the two cases. The synaptic decoding approach follows a well defined procedure involving gradient descent learning and in this respect is more similar to the Volterra series method (Krausz and Friesen, 1977). By including nonlinearities, however, the method avoids some of the complications and limitations of the Volterra series.
We set out three conditions that should be met by a successful scheme for describing synaptic transmission. First, we required that the method apply to any presynaptic spike train. Because the method is based on a general sum over spikes and is developed from a learning procedure that does not require any particular spike train statistics, this condition has been met; however, the stimulus spike train nevertheless must be chosen with some care. The stimulus set used to determine the parameters of the required functions must represent the full range of presynaptic activity patterns over which postsynaptic responses are to be predicted. Specifically, the intervals in the random stimulus that are used must span the interspike and interburst intervals of the stimuli whose responses are to be predicted. The second condition was simplicity, and indeed the neuromuscular junctions we studied were described accurately by relatively simple expressions. In most cases, facilitation was described with a single time constant. Although we do not expect this always to be the case, the method can be extended easily by including multiple exponential terms. Because the approach allows for an arbitrary nonlinear dependence of facilitation and depression on the sum over previous spikes, it will generate the minimum number of time constants needed to describe these processes. In addition to simplification of the description, this will help in the identification of potential underlying biophysical mechanisms. Thus, the third condition is met as well.
We have applied the synaptic decoding approach to both PSCs and PSPs. In many applications, we expect that the method will deal successfully with either of these, but in some cases it may be limited to PSC prediction. Such a limitation will arise if the PSP is strongly affected by the nonlinear characteristics of the membrane potential of the postsynaptic cell. If such nonlinearities play an important role, it is better to use the decoding method to describe PSCs and then to build a conventional, conductance-based model of the postsynaptic cell. When combined, these two models should provide an accurate description of PSPs in cases in which the synaptic decoding method by itself cannot account for both the transfer characteristics of the synapse and the membrane-response properties of the postsynaptic cell.
In developing the mathematical framework used here, we have been guided by basic features of the biophysical mechanisms underlying synaptic facilitation. When fitting the model synapse, K2acts as an integrator of the intracellular Ca2+concentration, and the nonlinear function F mimics the dependence of transmitter release on the Ca2+concentration. We cannot be sure that such a correspondence applies to fits of real data, but we should stress that the method can work whether or not these intuitive relations accurately reflect the synaptic biophysics. Nevertheless, such biophysical intuition can serve as an extremely useful guide for constructing the functional forms to be used for the description. For example, if transmitter depletion seems to be a dominant effect at a given synapse, the functionsK2 and F should be chosen to model the amount of available transmitter and its effect on synaptic strength. In some cases, a multiplicative description, rather than the additive procedure (Eq. 2) used here, may provide a better description of synaptic depression (Magleby and Zengel, 1975).
The crustacean neuromuscular junctions that we studied have an intermediate quantum yield, so they display some stochastic variability but do not often exhibit outright transmission failures. This had the advantage of allowing us to see the effects of synaptic variability, and yet it admitted a deterministic description like the one we have developed. Nevertheless, the errors in the predicted responses were dominated by stochastic variability in the actual postsynaptic responses, and they decreased significantly when predictions were compared with trial-averaged data. At vertebrate CNS synapses with low quantum yields, this variability will be even higher, and failures are likely to occur quite frequently (Smetters and Nelson, 1993; Stevens and Wang, 1995). If the method used here is applied, the outputRest(t) of the model will predict the average response. A variant of the approach, however, can be used to provide a stochastic prediction that will agree with the data on average and match its statistics. This variant consists of comparing the data during the training procedure used to extractK2 and F with either the prediction of the model or the prediction of the model assuming a transmission failure (no response to a given spike), whichever fits the data better. This procedure will assure that the model will provide the best fit to the actual responses rather than to their average, and by collecting the statistics on whether the prediction or failure matched better, the probability of failure can also be extracted. We anticipate that the decoding approach, either in this form or in the original averaging formulation, will be useful for CNS synapses (S. B. Nelson, J. A. Varela, K. Sen, and L. F. Abbott, unpublished observations).
Footnotes
This work was supported by National Science Foundation Grant IBN-9421388, a Ford Foundation Dissertation Fellowship (J.C.J.-R.), and the W. M. Keck Foundation. We thank C. F. Stevens and W. O. Friesen for constructive comments early in the development of this work, and the anonymous reviewers for helpful suggestions.
Correspondence should be addressed to Larry Abbott, Volen Center, Brandeis University, Waltham, MA 02254.
REFERENCES
- 1.Abbott LF. Decoding neuronal firing and modeling neural networks. Q Rev Biophys. 1994;27:291–331. doi: 10.1017/s0033583500003024. [DOI] [PubMed] [Google Scholar]
- 2.Bialek W, Rieke F, de Ruyter van Steveninck RR, Warland D (1991) Reading a neural code. Science 252:1854–1857. [DOI] [PubMed]
- 3.Delaney KR, Tank DW. A quantitative measurement of the dependence of short-term synaptic enhancement on presynaptic calcium. J Neurosci. 1994;14:5885–5902. doi: 10.1523/JNEUROSCI.14-10-05885.1994. [DOI] [PMC free article] [PubMed] [Google Scholar]
- 4.Dickinson PS. Interactions among neural networks for behavior. Curr Opin Neurobiol. 1995;5:792–798. doi: 10.1016/0959-4388(95)80108-1. [DOI] [PubMed] [Google Scholar]
- 5.Elson RC, Selverston AI. Mechanisms of gastric rhythm generation in the isolated stomatogastric ganglion of spiny lobsters: bursting pacemaker potentials, synaptic interactions and muscarinic modulation. J Neurophysiol. 1992;68:890–907. doi: 10.1152/jn.1992.68.3.890. [DOI] [PubMed] [Google Scholar]
- 6.Harris-Warrick RM, Marder E. Modulation of neural networks for behavior. Annu Rev Neurosci. 1991;14:39–57. doi: 10.1146/annurev.ne.14.030191.000351. [DOI] [PubMed] [Google Scholar]
- 7.Harris-Warrick RM, Nagy F, Nusbaum MP. Neuromodulation of stomatogastric networks by identified neurons and transmitters. In: Harris-Warrick RM, Marder E, Selverston AI, Moulins M, editors. Dynamic biological networks: the stomatogastric nervous system. MIT; Cambridge: 1992. pp. 87–138. [Google Scholar]
- 8.Hooper SL, O’Neil MB, Wagner R, Ewer J, Golowasch J, Marder E. The innervation of the pyloric region of the crab, Cancer borealis : homologous muscles in decapod species are differently innervated. J Comp Physiol [A] 1986;159:227–240. doi: 10.1007/BF00612305. [DOI] [PubMed] [Google Scholar]
- 9.Krausz HI, Friesen WO. The analysis of nonlinear synaptic transmission. J Gen Physiol. 1977;70:243–265. doi: 10.1085/jgp.70.2.243. [DOI] [PMC free article] [PubMed] [Google Scholar]
- 10.Magleby KL, Zengel JE. A quantitative description of stimulation-induced changes in transmitter release at the frog neuromuscular junction. J Gen Physiol. 1975;80:613–638. doi: 10.1085/jgp.80.4.613. [DOI] [PMC free article] [PubMed] [Google Scholar]
- 11.Mallart A, Martin AR. An analysis of facilitation of transmitter release at the neuromuscular junction of the frog. J Physiol (Lond) 1967;193:677–694. doi: 10.1113/jphysiol.1967.sp008388. [DOI] [PMC free article] [PubMed] [Google Scholar]
- 12.Marder E, Hooper S. Neurotransmitter modulation of the stomatogastric ganglion of decapod crustaceans. In: Selverston AI, editor. Model neural networks and behavior. Plenum; New York: 1985. pp. 319–337. [Google Scholar]
- 13.Marder E, Weimann J. Pergammon; New York: 1992. Modulatory control of multiple task processing in the stomatogastric nervous system In: Neurobiology of motor programme selection (Kein J, McCrohan CR, Winlow W, eds), pp 3–19. . [Google Scholar]
- 14.Maynard DM, Dando MR. The structure of the stomatogastric neuromuscular system in Callinectes sapidus, Homarus americanus and Panulirus argus (Decapoda crustacea). Philos Trans R Soc Lond [Biol] 1974;268:161–220. doi: 10.1098/rstb.1974.0024. [DOI] [PubMed] [Google Scholar]
- 15.Press WH, Teukolsky SA, Vetterling WT, Flannery BP. Cambridge UP; Cambridge: 1992. Numerical recipes in C. . [Google Scholar]
- 16.Smetters DK, Nelson SB. Estimates of functional synaptic convergence in rat and cat visual cortical neurons. Soc Neurosci Abstr. 1993;16:263. [Google Scholar]
- 17.Stevens CF, Wang Y. Facilitation and depression at single central synapses. Neuron. 1995;14:795–802. doi: 10.1016/0896-6273(95)90223-6. [DOI] [PubMed] [Google Scholar]
- 18.Warland D, Landolfa M, Miller JP, Bialek W (1991) Reading between the spikes in the cercal filiform hair receptors of the cricket. In: Analysis and modeling of neural systems (Eeckman F, Bower J, eds), pp 158–163. Norwell, MA: Kluwer.
- 19.Weimann JM, Meyrand P, Marder E. Neurons that form multiple pattern generators: identification and multiple activity patterns of gastric/pyloric neurons in the crab stomatogastric system. J Neurophysiol. 1991;65:111–122. doi: 10.1152/jn.1991.65.1.111. [DOI] [PubMed] [Google Scholar]
- 20.Yamada WM, Zucker RS. Time course of transmitter release calculated from simulations of a calcium diffusion model. Biophys J. 1992;61:671–682. doi: 10.1016/S0006-3495(92)81872-6. [DOI] [PMC free article] [PubMed] [Google Scholar]
- 21.Zengel JE, Magleby KL. Augmentation and facilitation of transmitter release. J Gen Physiol. 1982;80:583–611. doi: 10.1085/jgp.80.4.583. [DOI] [PMC free article] [PubMed] [Google Scholar]
- 22.Zucker RS. Short-term synaptic plasticity. Annu Rev Neurosci. 1989;12:13–31. doi: 10.1146/annurev.ne.12.030189.000305. [DOI] [PubMed] [Google Scholar]


