

Abstract
Excitotoxic neuronal death, associated with neurodegenerative disorders and hypoxic insults, results from excessive exposure to excitatory neurotransmitters. Glutamate neurotoxicity is triggered primarily by massive Ca2+ influx arising from overstimulation of the NMDA subtype of glutamate receptors. The underlying mechanisms, however, remain elusive. We have tested the hypothesis that mitochondria are primary targets in excitotoxicity by confocal imaging of intracellular Ca2+([Ca2+]i) and mitochondrial membrane potential (ΔΨ) on cultured rat hippocampal neurons. Sustained activation of NMDA receptors (20 min) elicits reversible elevation of [Ca2+]i. Longer activation (50 min) renders elevation of [Ca2+]i irreversible (Ca2+ overload). Susceptibility to NMDA-induced Ca2+ overload is increased when the 20 min stimuli are applied to neurons pretreated with electron transport chain inhibitors, thereby implicating mitochondria in [Ca2+]ihomeostasis during excitotoxic challenges. Remarkably, ΔΨ exhibits prominent and persistent depolarization in response to NMDA, which closely parallels the incidence of neuronal death. Blockade of the mitochondrial permeability transition pore by cyclosporin A allows complete recovery of ΔΨ and prevents cell death. These results suggest that early mitochondrial damage plays a key role in induction of glutamate neurotoxicity.
Keywords: calcium, cyclosporin, excitotoxicity, imaging, mitochondria, NMDA receptor, neuronal death
Excitotoxicity, the process by which overactivation of excitatory neurotransmitter receptors leads to neuronal cell death, must be understood in terms of the intervening cascade of events (Choi, 1987, 1988, 1995). Compelling evidence supports a key role for massive Ca2+ influx through the NMDA receptor (NMDAR) channel as a trigger of glutamate neurotoxicity: (1) selective blockade of NMDARs markedly reduces the extent of excitotoxic damage (Choi et al., 1988; Michaels and Rothman, 1990); (2) neurons survive when challenged in absence of extracellular Ca2+ or presence of intracellular Ca2+([Ca2+]i) chelators (Choi, 1987; Tymianski et al., 1993a,b); and (3) glutamate receptor overstimulation induces elevations of [Ca2+]i that precede cell death (de Erausquin et al., 1990; Michaels and Rothman, 1990; Randall and Thayer, 1992; Tymianski et al., 1993a,b; Witt et al., 1994). Oxidative stress is thought to be a contributing factor in glutamate neurotoxicity through generation of oxygen radicals that disrupt cell functions (Dykens et al., 1987; Dawson et al., 1991; Coyle and Puttfarcken, 1993; Lafon-Cazal et al., 1993; Lipton et al., 1993). However, the link between elevation of [Ca2+]i, free radicals, and neuronal death remains unclear (Choi, 1995).
Mitochondria are unique among cell organelles in their involvement in the concerted consumption of oxygen, production of oxygen radicals, and mobilization of [Ca2+]i(Gunter and Pfeiffer, 1990; Thayer and Miller, 1990; Miller, 1991;Beal, 1992; Coyle and Puttfarcken, 1993; Rizzuto et al., 1993;Jouaville et al., 1995; White and Reynolds, 1995). Given that excessive Ca2+ accumulation in mitochondria uncouples electron transfer from ATP synthesis (Beatrice et al., 1980; Gunter and Pfeiffer, 1990; Bernardi et al., 1994), and considering that impairment of energy metabolism (Wang et al., 1994) increases generation of free radicals (Halliwell and Gutteridge, 1989; Coyle and Puttfarcken, 1993), mitochondria emerge as a plausible link between elevation of [Ca2+]i and glutamate neurotoxicity. The pivotal role of mitochondria in excitotoxicity has been highlighted recently by the deterministic influence of mitochondrial function in the decision between apoptotic or necrotic cell death (Ankarcrona et al., 1995; Bonfoco et al., 1995) and by the protective action of transforming growth factors presumably conferred by enhancing mitochondrial energetics (Mattson et al., 1993; Prehn et al., 1994).
Here, we focus on the following question: is the mitochondrion the sensor that converts elevation of [Ca2+]ifrom a physiological modulator into a trigger for cell death? We show that mitochondria are involved in Ca2+ sequestration during an excitotoxic insult (Schinder et al., 1995) and that this Ca2+ current induces sustained mitochondrial depolarization, which closely parallels the incidence of neuronal death. Our findings suggest that neuronal injury follows from excessive influx of Ca2+ via the NMDAR that, in turn, attenuates the mitochondrial membrane potential (ΔΨ) leading to the opening of the permeability transition pore (PTP), further collapsing ΔΨ. Blockade of the PTP with cyclosporin A (CsA) leads to the recovery of ΔΨ and promotes cell survival. The results outline a novel way of thinking about excitotoxic cell death, shifting the focus of attention from a global event staged by intracellular Ca2+ toward a more compartmentalized question centered on mitochondrial homeostasis.
MATERIALS AND METHODS
Hippocampal cultures. Mixed hippocampal neuronal/glial cultures were established as described (Schinder and Montal, 1993). Briefly, hippocampi from E17–E19 rat embryos were incubated in basic saline solution (BSS) containing (in mm): 137 NaCl, 3.5 KCl, 0.4 KH2PO4, 0.33 Na2HPO4 · 7 H2O, 5 trimethylaminoethanesulfonic acid, pH 7.4, and 10 glucose with 0.25% trypsin for 15 min at 37°C. Tissue was washed and dissociated by trituration with a Pasteur pipette. Cells were centrifuged for 5 min at 200 × g, and the pellet was resuspended in BSS. Cells were plated (105 cells/cm2) and maintained as described.
Cell death assays. In vitro excitotoxicity is commonly investigated using agonist exposures that range from 5 min to 24 hr (Choi, 1987; Weiss et al., 1994). In our conditions, mild and severe types of neuronal death were selectively achieved with exposures of 20 and 50 min, respectively. Culture medium was removed, neurons were rinsed with 10 ml of BSS + 1.1 mm CaCl2 + 10 μm glycine, and treated with 200 μm NMDA (dissolved in the same solution) for either 20 (de Erausquin et al., 1990; Michaels and Rothman, 1990; Lafon-Cazal et al., 1993; Witt et al., 1994) or 50 min (Tymianski et al., 1993a,b) at 23 ± 1°C. Treatments were terminated by addition of culture medium (Schinder and Montal, 1993) supplemented with 20 μm dizolcipine [MK-801] (Research Biochemicals, Natick, MA) to prevent activation of NMDAR attributable to residual NMDA or glutamate released from synapses (Hartley and Choi, 1989). Cultures were returned to the incubator and cell death was assessed 18–24 hr later by trypan blue staining (0.4%). When indicated, CsA (Sandoz, Basel, Switzerland) was dissolved in ethanol or dimethyl sulfoxide (DMSO; 42 mm) and added to solutions held at 37°C under vigorous stirring to a final concentration of 1.6 μm. To mimic those conditions used in imaging experiments, CsA was added 40 min before the NMDA challenge and removed after 2 hr. A minimum of 500 cells were counted blind on each culture dish. For each experiment, two identical culture dishes were treated for control and 20 and 50 min exposure to NMDA, or, in the CsA experiments, control and 20 min NMDA in absence and presence of CsA.
Calcium imaging. Neurons were Fluo-3-loaded for 75 min at a bath concentration of 5.5 μm Fluo-3 AM (Molecular Probes, Eugene, OR) dissolved in DMSO (Kao et al., 1989). Imaging was performed with an argon laser confocal system (Bio-Rad MRC600) equipped with 488 nm excitation/515 nm emission filters on a Zeiss microscope (Thornwood, NY) with a 20× water immersion objective (numerical aperture 0.4). Neurons were constantly superfused at a rate of 3 ml/min with BSS + 1.1 mm CaCl2 + 2 mm MgCl2 + 10 μm glycine (control solution). NMDA was applied in Mg2+-free solution. Images were sampled and collected at 8–15 sec intervals for 2 hr (up to 4 hr for 50 min NMDA experiments) and recorded on videotape. Slower sampling rates (1 image/2 min) and lower laser intensity (1/6 of standard power) yielded identical results, suggesting that phototoxic effects are minimal. Signals obtained during Ca2+ overload were not attributable to saturation of dye, as fluorescence increased further after addition of 5 μm ionomycin (Calbiochem, La Jolla, CA) in the presence of 20 mm CaCl2, pH 8.0. Digital images were acquired either on-line or off-line with a Macintosh computer equipped with a frame grabber (Data Translation) using Image 1.47 software (W. Rasband, National Institutes of Health). A total of 20–25 neurons was studied in each experiment; somatic regions of ∼170 pixels were chosen for quantitation of fluorescence intensity. Regions without neurons or processes were used for background subtraction. For calibration experiments (Kao et al., 1989; Vergara and DiFranco, 1992), [Ca2+]i was calculated as [Ca2+] = Kd(F − Fmin)/(Fmax − F), where Kd was assumed to be 400 nm, Fmax was measured at the end of the experiment by treating neurons with 5 μm ionomycin,Fmin was derived fromFmax, and background fluorescence was obtained after addition of 0.02% saponin.
Imaging of ΔΨ. Neurons were incubated for 30 min in the presence of 0.1 μm tetramethylrhodamine ethylester (TMRE; Molecular Probes). TMRE was added to all solutions used during these experiments, which typically lasted 2 hr. When indicated, 1.6 μm CsA was present in all solutions throughout the experiment, with a preincubation time of 40 min before the NMDA challenge. Three to seven neurons were studied in each experiment. Imaging (Farkas et al., 1989) was as described above, except that samples were collected at 1 image/90 sec and a 514/550 nm filter and a 40× water immersion objective (numerical aperture 0.9) were used. The confocal pinhole was closed to 1/5 to 1/3, and signals were amplified 1.5× with a digital zoom. Fluorescence intensity was quantified in a perinuclear ring (∼1000 pixels) in which mitochondrial clusters are located (see Fig. 4B). Baseline fluorescence (F0) was measured as average normalized fluorescence emitted during the initial 5 min of the experiment. Control experiments showed that selective depolarization of the plasma membrane (35 mm KCl, 0 Ca2+) evoked minor changes in mitochondrial fluorescence. Results indicate that decrements of mitochondrial fluorescence primarily reflect mitochondrial depolarization and not reequilibration of dye in response to NMDA-induced plasma membrane depolarization. This assertion was confirmed by the finding that 100 μm carbonyl cyanidem-chlorophenylhydrazone, uncoupler of oxidative phosphorylation, decreases TMRE fluorescence (Farkas et al., 1989) to an extent comparable to that produced by the NMDA treatments.
Fig. 4.

NMDAR overstimulation collapses ΔΨ.A, Digital images of neurons exposed to TMRE before removal of NMDA (top frame indicated by 0:00:00 time), during 20 min stimulation with 200 μm NMDA, and after removal of NMDA (wash). Collapse of ΔΨ is shown as a decrease in fluorescence intensity during exposure to NMDA. Partial repolarization occurs after the stimulus is removed. Pseudocolor scale represents arbitrary fluorescence intensity values ranging from 0 to 255. Scale bar, 20 μm. B, Time course of ΔΨ measured in arbitrary fluorescence units for neurons stimulated with NMDA for 0 (control), 0.5, 20, and 50 min and recorded during 2 hr. Each trace represents mitochondrial fluorescence from an individual neuron normalized to its initial baseline value (F0), and each set of recordings belongs to a single representative experiment.Inset, Perinuclear ring of mitochondrial fluorescence used for quantitation. C, Mitochondrial fluorescence signals, as shown in B, are quantified as Peak Depolarization = Fmin/F0, an indicator of transient mitochondrial depolarization, and Recovery Ratio = Fend/F0, an indicator of mitochondrial repolarization after cessation of the NMDA stimulus. Bars plotted for 0, 0.5, 20, and 50 min NMDA represent mean ± SEM for n = 28, 28, 74, and 84, respectively. For both bar charts, ANOVA analysis revealed that populations are different with p < 0.00001. **, Statistically significant differences (p < 0.0001) compared with all other treatments using the post hoc test. D, Effect of [Ca2+]ext on depolarization of ΔΨ elicited by 20 min NMDA. Bar chart for Peak Depolarization and Recovery Ratio was calculated and plotted as in C. *, Statistically significant difference with p < 0.002. Inset, Comparison of the time courses of ΔΨ in the presence of [Ca2+]ext = 1.1 or 5.5 mm. Traces are averages from all recordings (5.5,n = 33; 1.1,n = 74).
All experiments reported were performed at 23 ± 1°C on neurons cultured for 14–17 d.
Statistics. Pooled data are presented as mean ± SEM. For comparisons between two groups, a two-tailed Student’st test was used. When three or more groups were compared (Figs. 1

[Ca2+]i (4) followed by a slow decrease to a lower level lasting several minutes (5), which gradually increases to achieve a higher plateau [Fplateau, (6)]. [Ca2+]i returns to baseline levels shortly after the NMDA stimulus is removed (7). Record obtained from the neuron marked with an arrowhead. Scale bar, 40 μm. B, Same as A, but neurons were stimulated for 50 min with NMDA. A similar time course was recorded, but heightened [Ca2+]i(6) failed to return to baseline levels [Ca2+ overload, (7)]. Calibration of [Ca2+]i yielded the following values: (1) [Ca2+]baseline = 29 ± 2 nm; (2) [Ca2+]K+ = 0.91 ± 0.10 μm; (4) [Ca2+]peak = 1.5 ± 0.2 μm; (5) [Ca2+]valley = 0.29 ± 0.03 μm; (6) [Ca2+]plateau = 2.1 ± 0.2 μm; n (number of cells) > 47. C, Extent of Ca2+ overload versus duration of the NMDA challenge. Ca2+ overload was calculated as the ratio of the fluorescence value at the end of the experiment [Fend, (7)] to the highest value achieved during the challenge [Fplateau, (6)]. Data are mean ± SEM. ANOVA analysis revealed that populations are different with p < 0.00001. *, Statistically significant difference (p < 0.005) obtained using the post hoc test compared with all other treatments; **p < 0.0001. Numbersin parentheses denote population sizes. {/ANNT;64064n;;66880n;72864n}
C, 4C), a single-factor ANOVA, followed by a post hoc Bonferroni t test with correction for multiple comparisons, was used.
Fig. 1.
NMDAR overstimulation evokes persistent elevation of [Ca2+]i in hippocampal neurons. A, Time course of changes in [Ca2+]i of a neuron in response to K+-induced membrane depolarization (35 mm KCl, 30 sec, K+), followed by 20 min exposure to 200 μm NMDA. Values are plotted as relative pixel fluorescence intensity (F) normalized to baseline fluorescence values (F0); upward deflection denotes an increase in [Ca2+]i. Horizontal bars(gray background) indicate duration of treatment.Numbers indicate critical points in the Ca2+signal and code panels 1 to 7 that are pseudocolor digital images of Fluo-3 fluorescence (Kao et al., 1989).Pseudocolor scale represents arbitrary fluorescence intensity values ranging from 0 to 255. The KCl control stimulus elicits a rapid and reversible increase of [Ca2+]i (2). NMDA evokes a fast elevation of
RESULTS
NMDAR overstimulation induces neuronal cell death
To assess the effects of NMDAR overstimulation on mitochondrial Ca2+ sequestration and cell death, experimental paradigms that elicit either moderate or severe extents of neuronal death were developed. Neurons were exposed to 200 μm NMDA for variable time intervals, and cell death was determined 18–24 hr later using the trypan blue exclusion assay. Neuronal death in hippocampal cultures increased with the duration of the NMDA challenge: 39 and 67% cell death were elicited by NMDA pulses of 20 and 50 min (Table1), respectively. This finding is consistent with the notion that cellular damage increases with the duration of Ca2+ influx through the NMDAR (Tymianski et al., 1993a).
Table 1.
Neuronal damage assessed by cell death, Ca2+overload, and mitochondrial depolarization
| 20 min NMDA | 50 min NMDA | |
|---|---|---|
| Fraction of dead cells | 0.39 ± 0.04 (23,601) | 0.67 ± 0.06 (11,375) |
| Ca2+overload | 0.13 ± 0.06 (107) | 0.71 ± 0.06 (200) |
| Mitochondrial depolarization | 0.37 ± 0.04 (74) | 0.76 ± 0.02 (84) |
The fraction of dead cells was calculated from counts of cultures stained with trypan blue 24 hr after treatments. Cell death in cultures treated with vehicle (0.07 ± 0.01; n = 18,846) was subtracted. Ca2+ overload was determined as in Figure1. Mitochondrial depolarization was derived as 1-Recovery Ratio (Fig.4). Values denote mean ± SEM; numbers in parentheses indicate the population of cells examined.
NMDA produces transient or sustained increases in [Ca2+]i depending on pulse duration
To evaluate the time course of change in [Ca2+]i evoked by NMDAR overstimulation, time-lapse fluorescent imaging was performed on hippocampal neurons loaded with the Ca2+ indicator Fluo-3 AM. As shown in Figure 1A, 20 min application of NMDA evokes a fast rise in [Ca2+]i to a peak that decays slowly to an intermediate level before rising to a higher plateau. Calcium returns to baseline levels after withdrawal of the stimulus (recovery). However, a 50 min pulse of NMDA induces Ca2+ overload (Fig.1B), as indicated by the persistence of Ca2+ elevation. The extent of Ca2+ overload increases with duration of the NMDA challenge (Fig. 1C). Comparison of the incidence of cell death with that of Ca2+overload produced by these treatments, especially at 20 min (see Table1), reveals an apparent disparity: the incidence of cell death is significantly higher than that of Ca2+ overload. This indicates that recovery of [Ca2+]i to baseline levels is not necessarily indicative of cell survival and suggests that additional steps intervene between elevation of [Ca2+]i and cell death.
The susceptibility to NMDA-induced Ca2+ overload is augmented by mitochondrial function inhibitors
To test whether mitochondria lie on the main pathway to excitotoxicity, we studied the effects of specific inhibitors of mitochondrial function on cell death induced by 20 min stimulation with NMDA. Antimycin A and rotenone, specific inhibitors of complex III and complex I of the electron transport chain, were used to block electron transfer and proton extrusion mechanisms, thereby decreasing ΔΨ (see Fig. 3) and ATP synthesis. Antimycin A (10 nm) increased the susceptibility of hippocampal neurons to NMDA-induced cell death, confirming results obtained with cyanide, the specific inhibitor of complex IV (Dubinsky and Rothman, 1991). We next examined its effects on elevation of [Ca2+]i in response to 20 min pulses of NMDA. Antimycin A at 1 nmabolishes the early decrease in [Ca2+]i, hereafter defined as Ca2+ sequestration, yet recovery to baseline is achieved after the stimulus is removed (Fig.2A). At 100 nm, Ca2+ sequestration is abolished and, moreover, [Ca2+]i remains tonically elevated. Antimycin A inhibits Ca2+ sequestration (•) and recovery (Δ) in a dose-dependent manner, with IC50 = 470 ± 130 pm and IC50 = 15.9 ± 4.5 nm, respectively (Fig. 2B). IC50 values are 30-fold apart, suggesting that Ca2+ sequestration and recovery are distinct mechanisms, both associated with mitochondria. The primary involvement of mitochondria was confirmed using rotenone (Fig. 2C,D); pretreatment produces a similar biphasic profile, abolishing Ca2+ sequestration at even lower concentrations (IC50 = 48 ± 19 pm) and blocking recovery at somewhat higher doses (IC50 = 1.5 ± 0.7 μm). These results suggest that although mitochondrial Ca2+ uptake is responsible for Ca2+ sequestration, ATP-dependent plasma membrane transporters may account for recovery by Ca2+ extrusion (Thayer and Miller, 1990; Miller, 1991; White and Reynolds, 1995; Budd and Nicholls, 1996). This conjecture was addressed using oligomycin, which specifically inhibits mitochondrial ATP synthase without altering the redox-generated ΔΨ. In accordance with this prediction, neurons treated with oligomycin before stimulation fail to recover from NMDAR overactivation but show only minor changes in Ca2+sequestration (Fig. 2E,F). By contrast, thapsigargin (100 nm ≤ thapsigargin ≤ 500 nm), a specific blocker of endoplasmic reticulum (ER) Ca2+ ATPases (Thastrup et al., 1990), does not affect Ca2+ sequestration or recovery, indicating that ER mechanisms are not major determinants of this process.
Fig. 3.
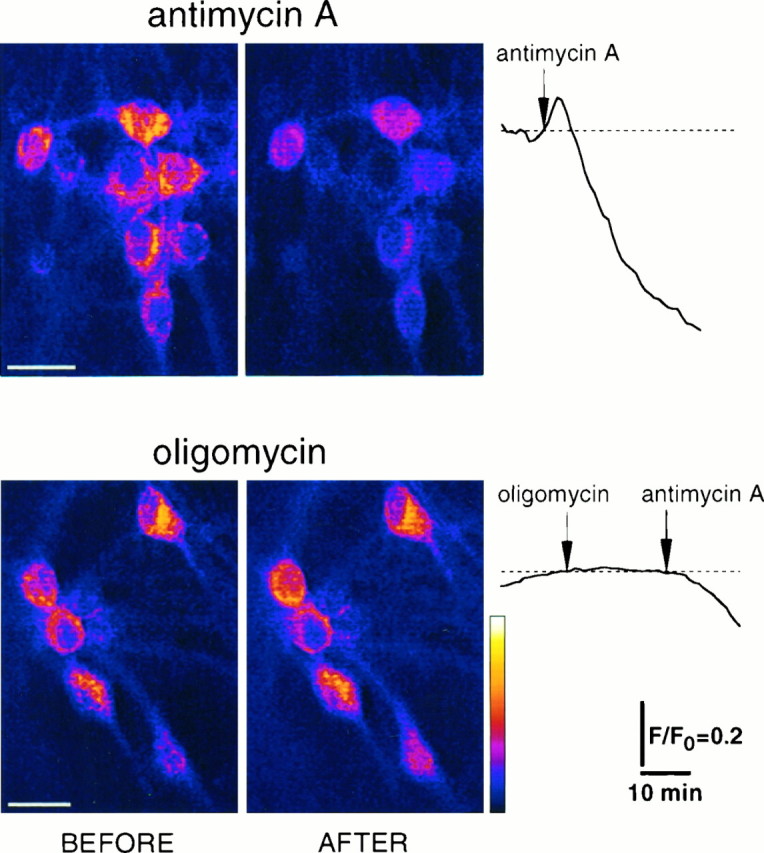
Effects of mitochondrial function inhibitors on ΔΨ. Pictures show digital images of neurons exposed to TMRE (Farkas et al., 1989) before and after treatment with 10 μmantimycin A or oligomycin. Collapse of ΔΨ is shown as a decrease in fluorescence intensity after exposure to antimycin A. Pseudocolor scale represents arbitrary fluorescence intensity values ranging from 0 to 255. Scale bar, 20 μm. Traces (right column) indicate time course of changes in ΔΨ measured in arbitrary fluorescence units for neurons treated with antimycin A or oligomycin. Arrows indicate initiation of treatments. Each trace represents mitochondrial fluorescence from an individual neuron normalized to its initial baseline value (F0).
Fig. 2.

Inhibitors of mitochondrial function modulate homeostasis of [Ca2+]i elicited by a 20 min NMDA stimulus. A, Time course of change in [Ca2+]i for neurons pretreated with antimycin A (anti) for 15 min immediately preceding stimulation with 200 μm NMDA. At 1 nm, antimycin selectively inhibits Ca2+ sequestration; at 100 nm, it abrogates both Ca2+ sequestration and recovery. Calibration of [Ca2+]i on neurons pretreated with 1 μm antimycin A yielded the following values: [Ca2+]baseline = 23 ± 2 nm; [Ca2+]peak = 1.33 ± 0.12 μm; [Ca2+]plateau = 2.7 ± 0.2 μm; n (number of cells) > 36. This indicates that lack of Ca2+ sequestration is not because of saturation of the dye. B, Dose–response for Ca2+ sequestration (•) and recovery (▵). Ca2+ sequestration is quantified as the area above the Ca2+ signal (hatched area inA, top panel) normalized to the rectangular area delimited by the baseline and the peak of the waveform during 20 min NMDA application. Recovery is defined as the fraction of cells that exhibitFend/Fplateau ≤ 0.3. C, Neurons pretreated for 15 min with rotenone (rote). Similar to antimycin, 10 nm rotenone selectively reduces Ca2+ sequestration, whereas 10 μm abolishes both sequestration and recovery.D, Dose–response for Ca2+ sequestration (•) and recovery (▵). E, Neurons pretreated for 15 min with oligomycin (oligo). At ≥10 nm, oligomycin inhibits recovery but has a minor effect on Ca2+sequestration. F, Dose–response for Ca2+sequestration (•; IC50 ≫ 10 μm) and recovery (▵; IC50 = 11.1 ± 2.8 nm). Curves represent best fits to the function y = A0 + A1 · (IC50/([drug] + IC50))h.
Effects of mitochondrial function inhibitors on ΔΨ
To examine the effects of mitochondrial function inhibitors on ΔΨ, the fluorescent potentiometric dye TMRE, known to partition specifically into polarized mitochondria, was used for imaging (Farkas et al., 1989). Neurons treated with antimycin A (Fig. 3,top panel) display a prominent decrease in fluorescence, reflecting mitochondrial depolarization (Farkas et al., 1989; Loew et al., 1994). As shown in the trace, a transient increase in relative fluorescence precedes the decay (see also Figs.4B, 5B); this may arise from unquenching of the dye before its loss from mitochondria (Budd and Nicholls, 1996). The extent of depolarization (D) was quantified as the ratio of the mitochondrial fluorescence 20 min after antimycin A application to fluorescence before the treatment (D = 0.632 ± 0.043; n = 23 neurons). Oligomycin does not alter ΔΨ (D = 1.008 ± 0.028; n = 19 neurons; bottom panel), however, subsequent application of antimycin A does elicit depolarization of ΔΨ. These results strongly suggest that differences between the effects of blockers of the electron transport chain (antimycin A and rotenone) and the ATP synthase (oligomycin) on Ca2+ sequestration (Fig. 2) are attributable to their distinct actions on ΔΨ.
Fig. 5.
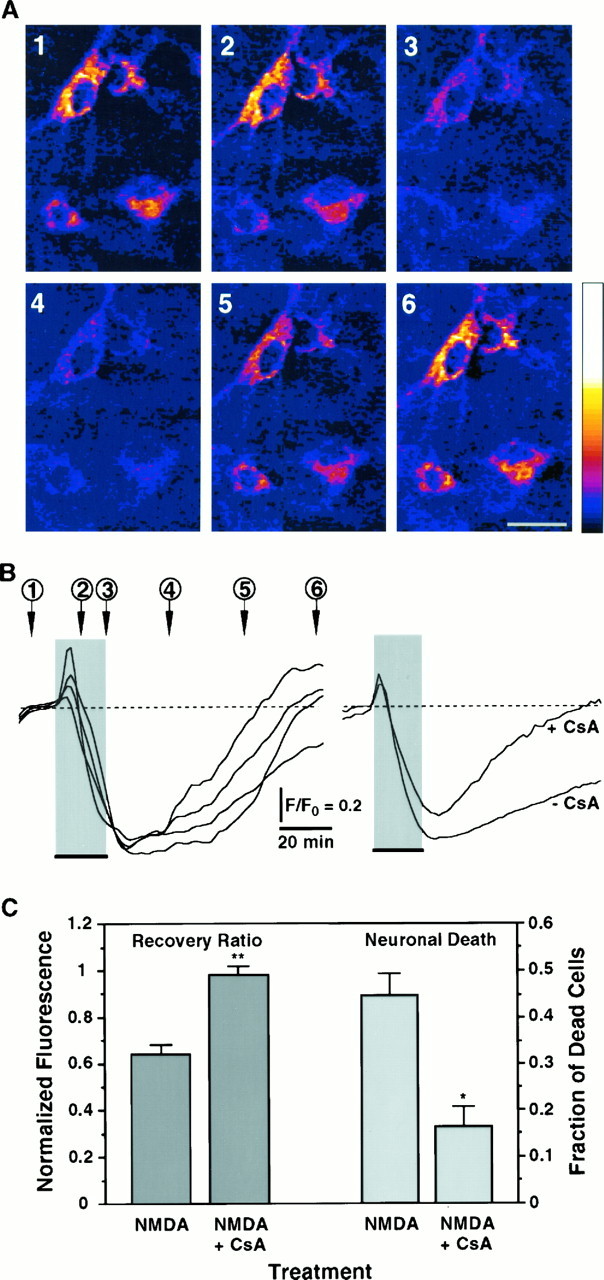
Blockade of the PTP enhances recovery of the NMDA-induced collapse of ΔΨ and decreases neuronal death.A, Digital images of TMRE fluorescence of neurons exposed for 20 min to 200 μm NMDA in the presence of 1.6 μm CsA. Numbers indicate critical time points in the ΔΨ signal shown in B and code panels1 to 6 that are pseudocolored images of TMRE fluorescence. Neurons show a marked depolarization of ΔΨ evoked by the NMDA pulse; repolarization occurs after removal of the stimulus. Scale bar, 20 μm. All other conditions are as in Figure 4.B, Left panel, Time course of ΔΨ from neurons shown in A, measured in arbitrary fluorescence units. Each trace corresponds to one of the neurons in the digital images. Right panel, Comparison of the time courses of ΔΨ in response to 20 min NMDA in the presence or absence of CsA. Traces are averages from all recordings (+CsA:n = 26; −CsA: n = 74). C, Recovery of ΔΨ (Recovery Ratio) was calculated for recordings obtained in the presence of CsA (n = 26 neurons) and compared with those presented in Figure 4C for 20 min NMDA. Peak depolarization is not affected by CsA (Peak Depolarization = 0.351 ± 0.048; p = 0.1). Cell death induced by NMDA was simultaneously assessed in the presence (n = 7126 neurons) and absence (n = 7985 neurons) of CsA for six independent experiments. Fraction of dead cells in cultures treated with vehicle was subtracted (0.054 ± 0.003; n = 6547 neurons). Bars represent mean ± SEM. *, Statistically significant difference between treatments (p < 0.002); **p < 0.0001.
NMDA collapses ΔΨ
The link between NMDAR overstimulation, Ca2+sequestration, and impairment of mitochondrial function was substantiated by measurements of ΔΨ during the excitotoxic challenge (Fig. 4). Neurons challenged for 20 min with NMDA display a prominent depolarization (Fig. 4A) that exhibits a time scale coincident with the development of Ca2+ overload (Fig. 1A). Only partial recovery is observed, suggesting an irreversible process in contrast to the reversibility of [Ca2+]i signals (Fig.1A). Increasingly longer NMDA stimuli induce more conspicuous depolarizations of ΔΨ, with decreasing extents of recovery (Fig. 4B,C). A 30 sec stimulus yields a shallow and reversible depolarization of ΔΨ (Fig. 4C). However, a prominent depolarization is induced by both 20 and 50 min NMDA stimuli, establishing a linkage between NMDAR overactivation and mitochondrial impairment. Moreover, recovery of ΔΨ is only partial for 20 min stimuli, and negligible for 50 min stimuli, suggesting that permanent mitochondrial damage occurred. Heightened extracellular [Ca2+] ([Ca2+]ext) sharply decreases the extent of recovery induced by 20 min NMDA (Fig.4D), strengthening the connection between NMDA-induced Ca2+ influx and collapse of ΔΨ.
Blockade of the mitochondrial PTP with cyclosporin A promotes recovery of the NMDA-induced collapse of ΔΨ and prevents neuronal death
Depolarization of mitochondrial inner membrane, together with an increase in matrix [Ca2+] may induce opening of the PTP, a mitochondrial channel that allows ionic diffusion and thereby collapses ΔΨ (Petronilli et al., 1993). The immunosuppressant drug CsA is a potent blocker of the PTP (Bernardi et al., 1994; Nicolli et al., 1996) and presumably may prevent the NMDA-induced collapse of ΔΨ. Figure 5 shows that in the presence of 1.6 μm CsA, depolarization of ΔΨ in response to 20 min NMDA is only transient. The rate of decay of ΔΨ appears to be slower in the presence of CsA than in its absence (Fig. 5B,right panel), suggesting that opening of the PTP may accelerate mitochondrial depolarization. Remarkably, the recovery is practically complete (compare with Fig. 4B,C), suggesting that persistent opening of the PTP may be the cause for tonic mitochondrial depolarization. To examine the involvement of the PTP in excitotoxic cell death, the survival of neurons challenged in the presence of CsA or its absence was determined. CsA protects neurons from NMDA-induced death by 64.8 ± 6.3% (Fig. 5C). These findings implicate the PTP in the persistent mitochondrial depolarization in response to NMDAR overstimulation (Fig. 4) and establish a connection between mitochondrial dysfunction and excitotoxic neuronal death.
DISCUSSION
The results presented here show that (1) overstimulation of NMDARs deregulates homeostasis of [Ca2+]i and induces neuronal death depending on pulse duration; (2) control of [Ca2+]i during an excitotoxic treatment relies primarily on mitochondrial function; (3) NMDA-induced Ca2+ influx is sufficient to induce early and persistent mitochondrial depolarization; and (4) blockade of the mitochondrial PTP promotes recovery of ΔΨ and decreases the incidence of cell death. The complex interplay between elevation of [Ca2+]i and mitochondrial function provides a basis to formulate a model of excitotoxic neuronal death. In essence, this model proposes that cell survival relies on a delicate balance between mitochondrial function and [Ca2+]ihomeostasis. Massive Ca2+ influx induces an imbalance in mitochondrial homeostasis, leading to mitochondrial dysfunction, which in turn triggers neuronal cell death (Fig. 6). We turn now to discuss the experimental foundation of the model.
Fig. 6.

Schematic representation of potential pathways by which mitochondrial dysfunction could act as an effector of excitotoxic neuronal death. NMDAR overstimulation induces excessive Ca2+ influx and abnormal elevations of [Ca2+]i. Mitochondrial Ca2+uptake, driven by ΔΨ, attenuates ΔΨ. This, in turn, causes a decrease in ATP synthesis and the opening of the PTP, which collapses ΔΨ. Mitochondrial dysfunction elicits a further reduction in intracellular ATP pools, increases free radical generation, and most likely activates other processes that ultimately contribute to neuronal cell death.
Time-lapse video imaging of ΔΨ shows that depolarization is a consequence of NMDAR overstimulation (Fig. 4); whereas mitochondrial depolarization evoked by 20 min NMDA does not revert to baseline levels (Fig. 4B), elevation of [Ca2+]i does (Fig. 1, Table 1). These results have three major implications: (1) sustained mitochondrial depolarization is not attributable to tonically elevated [Ca2+]i; (2) mitochondrial homeostasis is not linked to [Ca2+]i after removal of the excitotoxic stimulus; and (3) persistent mitochondrial depolarization is an expression of mitochondrial dysfunction.
Findings on cell death, [Ca2+]i homeostasis, and ΔΨ are summarized in Table 1. Results from 20 min NMDA treatments reveal an apparent mismatch between the extent of Ca2+ overload and the percentage of dead neurons. This suggests that although existing ATP pools may be sufficient to drive Ca2+ extrusion systems and recover [Ca2+]i homeostasis (Fig.1A,C), early neuronal damage occurs as revealed by the collapse of ΔΨ (Fig. 4) and the induction of cell death. In contrast, the extent of Ca2+ overload observed for 50 min treatments (Fig. 1B) parallels the incidence of neuronal death, suggesting exhausted ATP pools. Ca2+overload therefore may be secondary to mitochondrial dysfunction, and not a causal event for cell death (Fig. 6). This conjecture is supported by the results presented in Figure 2, in which inhibition of mitochondrial function leads to Ca2+ overload; for instance, [Ca2+]i responses to 50 min NMDA are mimicked by 20 min NMDA in neurons pretreated with oligomycin. Moreover, in agreement with previous findings (Tymianski et al., 1993a), Ca2+ overload occurs much earlier than loss of plasma membrane integrity, as indicated by the ability of neurons to retain the Ca2+ indicator Fluo-3 in the cytoplasm for more than 4 hr. Thus, Ca2+ overload may be an indicator of cell death, but recovery is not an indicator of cell survival. This notion resolves discrepancies in correlations of [Ca2+]i postinsult and neuronal death (de Erausquin et al., 1990; Michaels and Rothman, 1990; Randall and Thayer, 1992; Witt et al., 1994).
Mitochondria are major buffering compartments for elevations of [Ca2+]i in response to brief exposures to glutamate in cortical neurons (White and Reynolds, 1995). Inhibition of mitochondrial function by picomolar concentrations of antimycin A or rotenone abolishes Ca2+ sequestration in response to prolonged NMDA treatments (Fig. 2), indicating that mitochondria act as a primary buffer of [Ca2+]i also under excessive insults. A unique function of mitochondria (as a main source of ATP) is highlighted by the finding that oligomycin or higher concentrations of antimycin A or rotenone eliminate the recovery phase, presumably by compromising ATP-dependent Ca2+ extrusion systems (Fig. 6). Thus, mitochondria, as intracellular Ca2+buffers, set a point of vulnerability whereby if the boundary between mitochondrial function and dysfunction is crossed, cell death ensues. As discussed below, this crossroad is probably determined by the PTP (Fig. 5).
Our population study suggests a correlation between mitochondrial dysfunction and cell death, but does not establish a causal link (Table1). If mitochondrial impairment were a primary event in the induction of excitotoxic cell death, then neuronal death might be prevented by treatments that protect mitochondrial homeostasis. As shown in Figure5, the NMDA-induced collapse of ΔΨ recovers completely in the presence of CsA. Accordingly, neuronal death is reduced by 65% under these conditions compared with neurons challenged in the absence of CsA (Fig. 5C). NMDARs are not a target of CsA, because voltage-clamp recordings show that currents elicited by NMDA remain unchanged in the presence of CsA (data not shown). The fact that complete recovery of ΔΨ is accompanied by a substantial, yet partial, reduction of cell death might indicate that pathways that are parallel and/or downstream to mitochondria are also activated by NMDAR overstimulation (Fig. 6). Immunosuppressant drugs, such as CsA, display numerous intracellular binding sites (Kunz and Hall, 1993) and have been shown to reduce excitotoxic neuronal death in cortical neurons, presumably by inhibition of a pathway that activates nitric oxide synthase (NOS) (Dawson et al., 1993). However, because CsA is a potent blocker of the PTP (Petronilli et al., 1993; Bernardi et al., 1994;Nicolli et al., 1996) and because our results show a direct effect of CsA on mitochondrial ΔΨ (Fig. 5A,B), it appears unlikely that preservation of mitochondrial function and promotion of cell survival are attributable to inhibition of NOS, yet this cannot be ruled out. Our findings suggest that persistent mitochondrial depolarization results from opening of the PTP [presumably as a consequence of combined mitochondrial depolarization and elevation of intramitochondrial Ca2+ (Bernardi et al., 1994)] and that maintenance of mitochondrial homeostasis can protect hippocampal neurons from excitotoxic cell death (Fig. 6).
In view of these findings, glutamate excitotoxicity can be visualized as a cascade of events that starts with overstimulation of NMDARs, which elicit massive Ca2+ influx and abnormally high [Ca2+]i (Fig. 6). Ca2+ is sequestered into the mitochondrial matrix, driven by the proton electrochemical gradient generated by the electron transport chain, depolarizing ΔΨ (Akerman, 1978; Gunter and Pfeiffer, 1990; Loew et al., 1994). This reduction in the electrochemical gradient decreases ATP synthesis at a time of great demand by the plasma membrane Ca2+ pump and, indirectly, by the Na+/Ca2+ exchanger (White and Reynolds, 1995). Concurrent buildup of intramitochondrial [Ca2+] and attenuation of ΔΨ induce opening of the mitochondrial inner membrane PTP, thereby allowing ionic diffusion and collapsing ΔΨ (Beatrice et al., 1980; Gunter and Pfeiffer, 1990; Bernardi et al., 1994; Hoek et al., 1995). The drop of cellular ATP levels, in concert with the generation of free O radicals consequent to high ATP consumption (Halliwell and Gutteridge, 1989; Coyle and Puttfarcken, 1993; Reynolds and Hastings, 1995), is a primary cause of cell death (Siesjö, 1992). The boundary between cell survival and cell death relies on a subtle balance of mitochondrial function/dysfunction, centered on ΔΨ. This model predicts that neuronal lifespan may be prolonged by specific inhibition of mitochondrial Ca2+uptake and that susceptibility to excitotoxic death may be influenced by the energetic state of neurons before and during the insult.
Our findings establish a direct coupling between excitotoxicity and shifts of redox potentials and membrane potentials of mitochondria inside living neurons. This evidence strengthens the involvement of mitochondria in the neurotoxicity associated with mitochondrial complex I inhibitor 1-methyl-4-phenylpyridinium (Saporito et al., 1992), amyotrophic lateral sclerosis (Brown, 1995; Wong et al., 1995), apoptosis (Newmeyer et al., 1994; Vayssière et al., 1994; Zamzami et al., 1995), and age-related disorders (Luft, 1994; Brouillet et al., 1995). These findings may provide useful guidelines for the development of the next generation of drugs targeted against neurodegeneration and stroke.
Footnotes
This work was supported by grants from National Institutes of Health (GM-49711 to M.M., NS-15918 to N.C.S.) and the U.S. Army Medical Research and Material Command (DAMD 17-93-C-3100 to M.M.). We are indebted to P. Bernardi, F. H. Gage, Y. Mika, C. D. Patten, J. L. Vergara, G. Zlokarnik, and the members of the Montal lab for valuable discussions and comments. We thank Drs. D. Römer, E. Rissi, G. Engel, and H. Widmer from Sandoz (Basel, Switzerland) for kindly providing CsA.
Correspondence should be addressed to Mauricio Montal, Department of Biology, University of California at San Diego, 9500 Gilman Drive, La Jolla, CA 92093-0366.
REFERENCES
- 1.Akerman KE. Changes in membrane potential during calcium ion influx and efflux across the mitochondrial membrane. Biochim Biophys Acta. 1978;502:359–366. doi: 10.1016/0005-2728(78)90056-7. [DOI] [PubMed] [Google Scholar]
- 2.Ankarcrona M, Dypbukt JM, Bonfoco E, Zhivotovsky B, Orrenius S, Lipton SA, Nicotera P. Glutamate-induced neuronal death: a succession of necrosis or apoptosis depending on mitochondrial function. Neuron. 1995;15:961–973. doi: 10.1016/0896-6273(95)90186-8. [DOI] [PubMed] [Google Scholar]
- 3.Beal MF. Does impairment of energy metabolism result in excitotoxic neuronal death in neurodegenerative illnesses? Ann Neurol. 1992;31:119–130. doi: 10.1002/ana.410310202. [DOI] [PubMed] [Google Scholar]
- 4.Beatrice MC, Palmer JW, Pfeiffer DR. The relationship between mitochondrial membrane permeability, membrane potential, and the retention of Ca2+ by mitochondria. J Biol Chem. 1980;255:8663–8671. [PubMed] [Google Scholar]
- 5.Bernardi P, Broekemeier KM, Pfeiffer DR. Recent progress on regulation of the mitochondrial permeability transition pore, a cyclosporin-sensitive pore in the inner mitochondrial membrane. J Bioenerg Biomembr. 1994;26:509–517. doi: 10.1007/BF00762735. [DOI] [PubMed] [Google Scholar]
- 6.Bonfoco E, Krainc D, Ankarcrona M, Nicotera P, Lipton SA. Apoptosis and necrosis: two distinct events induced, respectively, by mild and intense insults with N -methyl-d-aspartate or nitric oxide/superoxide in cortical cell cultures. Proc Natl Acad Sci USA. 1995;92:7162–7166. doi: 10.1073/pnas.92.16.7162. [DOI] [PMC free article] [PubMed] [Google Scholar]
- 7.Brouillet E, Hantraye P, Ferrante RJ, Dolan R, Leroy-Willig A, Kowall NW, Beal MF. Chronic mitochondrial energy impairment produces selective striatal degeneration and abnormal choreiform movements in primates. Proc Natl Acad Sci USA. 1995;92:7105–7109. doi: 10.1073/pnas.92.15.7105. [DOI] [PMC free article] [PubMed] [Google Scholar]
- 8.Brown RH., Jr Amyotrophic lateral sclerosis, recent insights from genetics and transgenic mice. Cell. 1995;80:687–692. doi: 10.1016/0092-8674(95)90346-1. [DOI] [PubMed] [Google Scholar]
- 9.Budd SL, Nicholls DG. A reevaluation of the role of mitochondria in neuronal Ca2+ homeostasis. J Neurochem. 1996;66:403–411. doi: 10.1046/j.1471-4159.1996.66010403.x. [DOI] [PubMed] [Google Scholar]
- 10.Choi DW. Ionic dependence of glutamate neurotoxicity. J Neurosci. 1987;7:369–379. doi: 10.1523/JNEUROSCI.07-02-00369.1987. [DOI] [PMC free article] [PubMed] [Google Scholar]
- 11.Choi DW. Glutamate neurotoxicity and diseases of the nervous system. Neuron. 1988;1:623–634. doi: 10.1016/0896-6273(88)90162-6. [DOI] [PubMed] [Google Scholar]
- 12.Choi DW. Calcium: still center-stage in hypoxic-ischemic neuronal death. Trends Neurosci. 1995;18:58–60. [PubMed] [Google Scholar]
- 13.Choi DW, Koh JY, Peters S. Pharmacology of glutamate neurotoxicity in cortical cell culture: attenuation by NMDA. J Neurosci. 1988;8:185–196. doi: 10.1523/JNEUROSCI.08-01-00185.1988. [DOI] [PMC free article] [PubMed] [Google Scholar]
- 14.Coyle JT, Puttfarcken P. Oxidative stress, glutamate, and neurodegenerative disorders. Science. 1993;262:689–695. doi: 10.1126/science.7901908. [DOI] [PubMed] [Google Scholar]
- 15.Dawson VL, Dawson TM, London ED, Bredt DS, Snyder SH. Nitric oxide mediates glutamate neurotoxicity in primary cortical cultures. Proc Natl Acad Sci USA. 1991;88:6368–6371. doi: 10.1073/pnas.88.14.6368. [DOI] [PMC free article] [PubMed] [Google Scholar]
- 16.Dawson TM, Steiner JP, Dawson VL, Dinerman JL, Uhl GR, Snyder SH. Immunosuppressant FK506 enhances phosphorylation of nitric oxide synthase and protects against glutamate neurotoxicity. Proc Natl Acad Sci USA. 1993;90:9808–9812. doi: 10.1073/pnas.90.21.9808. [DOI] [PMC free article] [PubMed] [Google Scholar]
- 17.de Erausquin GA, Manev H, Guidotti A, Costa E, Brooker G. Gangliosides normalize distorted single-cell intracellular free Ca2+ dynamics after toxic doses of glutamate in cerebellar granule cells. Proc Natl Acad Sci USA. 1990;87:8017–8021. doi: 10.1073/pnas.87.20.8017. [DOI] [PMC free article] [PubMed] [Google Scholar]
- 18.Dubinsky JM, Rothman SM. Intracellular calcium concentrations during “chemical hypoxia” and excitotoxic neuronal injury. J Neurosci. 1991;11:2545–2551. doi: 10.1523/JNEUROSCI.11-08-02545.1991. [DOI] [PMC free article] [PubMed] [Google Scholar]
- 19.Dykens JA, Stern A, Trenkner E. Mechanism of kainate toxicity to cerebellar neurons in vitro is analogous to reperfusion tissue injury. J Neurochem. 1987;49:1222–1228. doi: 10.1111/j.1471-4159.1987.tb10014.x. [DOI] [PubMed] [Google Scholar]
- 20.Farkas DL, Wei MD, Febbroriello P, Carson JH, Loew LM. Simultaneous imaging of cell and mitochondrial membrane potentials. Biophys J. 1989;56:1053–1069. doi: 10.1016/S0006-3495(89)82754-7. [DOI] [PMC free article] [PubMed] [Google Scholar]
- 21.Gunter TE, Pfeiffer DR. Mechanisms by which mitochondria transport calcium. Am J Physiol. 1990;258:C755–C786. doi: 10.1152/ajpcell.1990.258.5.C755. [DOI] [PubMed] [Google Scholar]
- 22.Halliwell B, Gutteridge JMC. Clarendon; Oxford: 1989. Free radicals in biology and medicine, pp 86–188. . [Google Scholar]
- 23.Hartley DM, Choi DW. Delayed rescue of N -methyl-d-aspartate receptor-mediated neuronal injury in cortical culture. J Pharmacol Exp Ther. 1989;250:752–758. [PubMed] [Google Scholar]
- 24.Hoek JB, Farber JL, Thomas AP, Wang X. Calcium ion-dependent signalling and mitochondrial dysfunction: mitochondrial calcium uptake during hormonal stimulation in intact liver cells and its implication for the mitochondrial permeability transition. Biochim Biophys Acta. 1995;1271:93–102. doi: 10.1016/0925-4439(95)00015-v. [DOI] [PubMed] [Google Scholar]
- 25.Jouaville LS, Ichas F, Holmuhamedov EL, Camacho P, Lechleiter JD. Synchronization of calcium waves by mitochondrial substrates in Xenopus laevis oocytes. Nature. 1995;377:438–441. doi: 10.1038/377438a0. [DOI] [PubMed] [Google Scholar]
- 26.Kao JP, Harootunian AT, Tsien RY. Photochemically generated cytosolic calcium pulses and their detection by Fluo-3. J Biol Chem. 1989;264:8179–8184. [PubMed] [Google Scholar]
- 27.Kunz J, Hall MN. Cyclosporin A, FK506 and rapamycin: more than just immunosuppression. Trends Biochem Sci. 1993;18:334–338. doi: 10.1016/0968-0004(93)90069-y. [DOI] [PubMed] [Google Scholar]
- 28.Lafon-Cazal M, Pietri S, Culcasi M, Bockaert J. NMDA-dependent superoxide production and neurotoxicity. Nature. 1993;364:535–537. doi: 10.1038/364535a0. [DOI] [PubMed] [Google Scholar]
- 29.Lipton SA, Choi YB, Pan ZH, Lei SZ, Chen HS, Sucher NJ, Loscalzo J, Singel DJ, Stamler JS. A redox-based mechanism for the neuroprotective and neurodestructive effects of nitric oxide and related nitroso-compounds. Nature. 1993;364:626–632. doi: 10.1038/364626a0. [DOI] [PubMed] [Google Scholar]
- 30.Loew LM, Carrington W, Tuft RA, Fay FS. Physiological cytosolic Ca2+ transients evoke concurrent mitochondrial depolarizations. Proc Natl Acad Sci USA. 1994;91:12579–12583. doi: 10.1073/pnas.91.26.12579. [DOI] [PMC free article] [PubMed] [Google Scholar]
- 31.Luft R. The development of mitochondrial medicine. Proc Natl Acad Sci USA. 1994;91:8731–8738. doi: 10.1073/pnas.91.19.8731. [DOI] [PMC free article] [PubMed] [Google Scholar]
- 32.Mattson MP, Zhang Y, Bose S. Growth factors prevent mitochondrial dysfunction, loss of calcium homeostasis, and cell injury, but not ATP depletion in hippocampal neurons deprived of glucose. Exp Neurol. 1993;121:1–13. doi: 10.1006/exnr.1993.1066. [DOI] [PubMed] [Google Scholar]
- 33.Michaels RL, Rothman SM. Glutamate neurotoxicity in vitro , antagonist pharmacology and intracellular calcium concentrations. J Neurosci. 1990;10:283–292. doi: 10.1523/JNEUROSCI.10-01-00283.1990. [DOI] [PMC free article] [PubMed] [Google Scholar]
- 34.Miller RJ. The control of neuronal Ca2+homeostasis. Prog Neurobiol. 1991;37:255–285. doi: 10.1016/0301-0082(91)90028-y. [DOI] [PubMed] [Google Scholar]
- 35.Newmeyer DD, Farschon DM, Reed JC. Cell-free apoptosis in Xenopus egg extracts, inhibition by Bcl-2 and requirement for an organelle fraction enriched in mitochondria. Cell. 1994;79:353–364. doi: 10.1016/0092-8674(94)90203-8. [DOI] [PubMed] [Google Scholar]
- 36.Nicolli A, Basso E, Petronilli V, Wenger RM, Bernardi P. Interactions of cyclophilin with the mitochondrial inner membrane and regulation of the permeability transition pore, a cyclosporin A-sensitive channel. J Biol Chem. 1996;271:2185–2192. doi: 10.1074/jbc.271.4.2185. [DOI] [PubMed] [Google Scholar]
- 37.Petronilli V, Cola C, Bernardi P. Modulation of the mitochondrial cyclosporin A-sensitive permeability transition pore. J Biol Chem. 1993;268:1011–1016. [PubMed] [Google Scholar]
- 38.Prehn JH, Bindokas VP, Marcuccilli CJ, Krajewski S, Reed JC, Miller RJ. Regulation of neuronal Bcl2 protein expression and calcium homeostasis by transforming growth factor type beta confers wide-ranging protection on rat hippocampal neurons. Proc Natl Acad Sci USA. 1994;91:12599–12603. doi: 10.1073/pnas.91.26.12599. [DOI] [PMC free article] [PubMed] [Google Scholar]
- 39.Randall RD, Thayer SA. Glutamate-induced calcium transient triggers delayed calcium overload and neurotoxicity in rat hippocampal neurons. J Neurosci. 1992;12:1882–1895. doi: 10.1523/JNEUROSCI.12-05-01882.1992. [DOI] [PMC free article] [PubMed] [Google Scholar]
- 40.Reynolds IJ, Hastings TG. Glutamate induces the production of reactive oxygen species in cultured forebrain neurons following NMDA receptor activation. J Neurosci. 1995;15:3318–3327. doi: 10.1523/JNEUROSCI.15-05-03318.1995. [DOI] [PMC free article] [PubMed] [Google Scholar]
- 41.Rizzuto R, Brini M, Murgia M, Pozzan T. Microdomains with high Ca2+ close to IP3-sensitive channels that are sensed by neighboring mitochondria. Science. 1993;262:744–747. doi: 10.1126/science.8235595. [DOI] [PubMed] [Google Scholar]
- 42.Saporito MS, Heikkila RE, Youngster SK, Nicklas WJ, Geller HM. Dopaminergic neurotoxicity of 1-methyl-4-phenylpyridinium analogs in cultured neurons, relationship to the dopamine uptake system and inhibition of mitochondrial respiration. J Pharmacol Exp Ther. 1992;260:1400–1409. [PubMed] [Google Scholar]
- 43.Schinder AF, Montal M. Two distinct modalities of NMDA-receptor inactivation induced by calcium influx in cultured rat hippocampal neurons. FEBS Lett. 1993;332:44–48. doi: 10.1016/0014-5793(93)80480-i. [DOI] [PubMed] [Google Scholar]
- 44.Schinder AF, Olson E, Spitzer NC, Montal M. The role of mitochondria in glutamate-induced neurotoxicity. Biophys J. 1995;68:A384. [Google Scholar]
- 45.Siesjö BK. Pathophysiology and treatment of focal cerebral ischemia. I. Pathophysiology. J Neurosurg. 1992;77:169–184. doi: 10.3171/jns.1992.77.2.0169. [DOI] [PubMed] [Google Scholar]
- 46.Thastrup O, Cullen PJ, Drobak BK, Hanley MR, Dawson AP. Thapsigargin, a tumor promoter, discharges intracellular Ca2+ stores by specific inhibition of the endoplasmic reticulum Ca2+-ATPase. Proc Natl Acad Sci USA. 1990;87:2466–2470. doi: 10.1073/pnas.87.7.2466. [DOI] [PMC free article] [PubMed] [Google Scholar]
- 47.Thayer SA, Miller RJ. Regulation of the intracellular free calcium concentration in single rat dorsal root ganglion neurones in vitro . J Physiol (Lond) 1990;425:85–115. doi: 10.1113/jphysiol.1990.sp018094. [DOI] [PMC free article] [PubMed] [Google Scholar]
- 48.Tymianski M, Charlton MP, Carlen PL, Tator CH. Source specificity of early calcium neurotoxicity in cultured embryonic spinal neurons. J Neurosci. 1993a;13:2085–2104. doi: 10.1523/JNEUROSCI.13-05-02085.1993. [DOI] [PMC free article] [PubMed] [Google Scholar]
- 49.Tymianski M, Wallace MC, Spigelman I, Uno M, Carlen PL, Tator CH, Charlton MP. Cell-permeant Ca2+ chelators reduce early excitotoxic and ischemic neuronal injury in vitro and in vivo . Neuron. 1993b;11:221–235. doi: 10.1016/0896-6273(93)90180-y. [DOI] [PubMed] [Google Scholar]
- 50.Vayssière JL, Petit PX, Risler Y, Mignotte B. Commitment to apoptosis is associated with changes in mitochondrial biogenesis and activity in cell lines conditionally immortalized with simian virus 40. Proc Natl Acad Sci USA. 1994;91:11752–11756. doi: 10.1073/pnas.91.24.11752. [DOI] [PMC free article] [PubMed] [Google Scholar]
- 51.Vergara J, DiFranco M. Imaging of calcium transients during excitation-contraction coupling in skeletal muscle fibers. Adv Exp Med Biol. 1992;311:227–236. doi: 10.1007/978-1-4615-3362-7_16. [DOI] [PubMed] [Google Scholar]
- 52.Wang GJ, Randall RD, Thayer SA. Glutamate-induced intracellular acidification of cultured hippocampal neurons demonstrates altered energy metabolism resulting from Ca2+loads. J Neurophysiol. 1994;72:2563–2569. doi: 10.1152/jn.1994.72.6.2563. [DOI] [PubMed] [Google Scholar]
- 53.Weiss JH, Yin HZ, Choi DW. Basal forebrain cholinergic neurons are selectively vulnerable to AMPA/kainate receptor-mediated neurotoxicity. Neuroscience. 1994;60:659–664. doi: 10.1016/0306-4522(94)90494-4. [DOI] [PubMed] [Google Scholar]
- 54.White RJ, Reynolds IJ. Mitochondria and Na+/Ca2+ exchange buffer glutamate-induced calcium loads in cultured cortical neurons. J Neurosci. 1995;15:1318–1328. doi: 10.1523/JNEUROSCI.15-02-01318.1995. [DOI] [PMC free article] [PubMed] [Google Scholar]
- 55.Witt MR, Dekermendjian K, Frandsen A, Schousboe A, Nielsen M. Complex correlation between excitatory amino acid-induced increase in the intracellular Ca2+concentration and subsequent loss of neuronal function in individual neocortical neurons in culture. Proc Natl Acad Sci USA. 1994;91:12303–12307. doi: 10.1073/pnas.91.25.12303. [DOI] [PMC free article] [PubMed] [Google Scholar]
- 56.Wong PC, Pardo CA, Borchelt DR, Lee MK, Copeland NG, Jenkins NA, Sisodia SS, Cleveland DW, Price DL. An adverse property of a familial ALS-linked SOD1 mutation causes motor neuron disease characterized by vacuolar degeneration of mitochondria. Neuron. 1995;14:1105–1116. doi: 10.1016/0896-6273(95)90259-7. [DOI] [PubMed] [Google Scholar]
- 57.Zamzami N, Marchetti P, Castedo M, Zanin C, Vayssière JL, Petit PX, Kroemer G. Reduction in mitochondrial potential constitutes an early irreversible step of programmed lymphocyte death in vivo . J Exp Med. 1995;181:1661–1672. doi: 10.1084/jem.181.5.1661. [DOI] [PMC free article] [PubMed] [Google Scholar]