

Abstract
Glutamate has an important neuromodulatory role in synaptic transmission through metabotropic glutamate receptors (mGluRs) linked to a variety of G-protein-coupled second messenger pathways. Activation of these receptors on relay cells in the lateral geniculate nucleus (LGN) with the agonist trans-(1S,3R)−1-amino-1,3-cyclopentanedicarboxylic acid produces a membrane depolarization that inactivates the low-threshold Ca2+ spike, causing a transition from burst to tonic response mode. The excitatory effects of metabotropic receptor activation in the LGN appear to be produced through the receptors linked to phosphoinositide hydrolysis and apparently only through activation of the corticogeniculate pathway. Two mGluRs, mGluR1α (a splice variant of mGluR1) and mGluR5, are linked to the phosphoinositide system. We examined the localization of these receptors with affinity-purified, anti-peptide, polyclonal antibodies raised to the C-terminal region of each receptor protein. Under examination with the light microscope, we found that both types of receptors are present in the geniculate neuropil and in that of the overlying thalamic reticular nucleus, including the perigeniculate nucleus. We also examined the ultrastructural localization of immunolabel with the electron microscope, using a postembedding immunogold marker to identify terminals, dendrites, and somata that contain GABA. Label for the antibody directed against mGluR1α was primarily localized in the dendrites of relay cells, postsynaptic to various terminal types. Of these, terminal profiles normally associated with corticogeniculate inputs predominated, whereas retinal terminal profiles were scarce. Label for the antibody directed against mGluR5 label was prominent in inhibitory F2-terminal profiles associated with the retinal input to relay cells. In the perigeniculate nucleus, both mGluRs were localized to dendrites. The distribution of the two phosphoinositide-linked mGluRs in the LGN suggests very different functional roles for the two receptor types. We conclude from these data that mGluR1 appears to have a dominant role in corticogeniculate control of response mode through the feedback glutamatergic pathway from layer VI, whereas mGluR5 is positioned to affect retinogeniculate activation of relay cells through feed forward glomerular interactions.
Keywords: thalamus, vision, interneurons, corticogeniculate, glomerulus, immunocytochemistry
Glutamate is used as a neurotransmitter by both retinal and cortical synaptic inputs to the cat’s lateral geniculate nucleus (LGN) (Scharfman et al., 1990). The glutamate receptors used by geniculate cells include two broad classes, ionotropic and metabotropic glutamate receptors (iGluRs and mGluRs). The iGluRs, which include NMDA and non-NMDA receptors, directly gate ion channels to generate fast EPSPs. In contrast, activation of mGluRs affects ion channels and other cellular processes indirectly through a variety of second messenger pathways, which can result in slow changes in membrane conductances, much like a classical neuromodulator. Although both retinal and cortical inputs use iGluRs, recent evidence suggests that, in addition, cortical (but not retinal) synapses activate an excitatory mGluR on geniculate relay cells (McCormick and von Krosigk, 1992).
There are at least eight subtypes of mGluR that are further segregated into three groups based on sequence similarity, intracellular second messenger involvement, and agonist sensitivity (Suzdak et al., 1994;Watkins and Collingridge, 1994). Group I comprises mGluR1 and mGluR5, which are coupled, via phosphoinositide (PI)-specific phospholipase C to PI hydrolysis and intracellular calcium mobilization. A variety of anatomical detection techniques have revealed a heterogenous distribution of group I mGluRs throughout the mammalian brain. MGluR1 is richly expressed in the cerebellum (Fotuhi et al., 1994; Nusser et al., 1994) and the CA3 region of hippocampus, as well as the stratum oriens of area CA1 (Fotuhi et al., 1994). MGluR5 is expressed in cortex and striatum and within hippocampus in regions CA1, CA3, and the dentate gyrus (Romano et al., 1995).
Group I mGluRs are also involved in relay cell responses in the LGN. Iontophoretic application in vivo of specific mGluR agonists and antagonists in the LGN implicate mGluR1 involvement in a key effect of mGluR activation, the switching of the response mode of relay cells from burst to tonic firing via membrane depolarization (Godwin et al., 1996a). We have also reported preliminary evidence that trans-(1S,3R)−1-amino-1,3-cyclopentanedicarboxylic acid (ACPD), an agonist of mGluRs, may cause a release of GABA from local interneurons, which does not appear to depend on generation of action potentials within the geniculate slice (Zhou et al., 1994). These seemingly unique retinal and cortical roles of excitatory mGluRs revealed by the known physiology imply a diverse localization within the circuitry of the LGN, because geniculate cells receive these glutamatergic inputs in distinct retinal and cortical zones (Wilson et al., 1984).
To confirm and extend the pharmacological evidence of group I involvement in the geniculate circuitry, we used antibodies specific to mGluR1α (a splice variant of mGluR1) and mGluR5 to localize these receptors morphologically with respect to retinal and cortical inputs. We found that mGluR1 is primarily localized within relay cell dendrites in close and specific association with the corticogeniculate pathway, whereas mGluR5 is primarily located postsynaptic to retinal inputs in dendritic terminals of interneurons.
Portions of this work were reported previously in abstract form (Godwin et al., 1995).
MATERIALS AND METHODS
Antibody verification
The mGluR1α and mGluR5 antibodies used in the current study were also used in previous receptor localization studies (Martin et al., 1992; Reid et al., 1995; Romano et al., 1995). These were affinity-purified, anti-peptide, polyclonal antibodies raised to the C-terminal region of each receptor protein. We prepared Western blots for each antibody from tissue removed from the cat’s LGN and visual cortex. The tissue was harvested and kept at −80°C until processed, and all steps in the membrane preparation were performed at 0–4 °C. We homogenized the tissue in lysis buffer (2 mm HEPES and 2 mm EDTA), pH 7.5, containing protease inhibitors (50 μm phenylmethyl sulfonyl fluoride and 1 μg/ml each aprotinin, antipain, bacitracin, bestatin, chymostatin, leupeptin, and pepstatin A). After centrifugation at 1000 × g for 10 min, the nuclear pellet was discarded and the synaptic membranes pelleted by centrifugation at 30,000 × g for 20 min and washed in TBS (50 mm Tris HCL, 154 mmNaCl), pH 7.5, containing protease inhibitors. Protein was determined using the BCA method, and aliquots were stored at −80°C. For electrophoresis, membranes (20 μg of protein) were incubated in sample buffer containing 20 mm dithiotheitol and subjected to SDS-PAGE. Separated proteins were transferred to Immobilon P membranes in a BioRad (Richmond, CA) MiniTrans Blot apparatus. Blots were incubated in TTBS (TBS + 0.1% Tween-20) containing 2.5% nonfat dry milk for 15 min, then overnight in the same buffer together with antibody (0.1 5 gm/ml) and sodium azide (0.1% w/v). After several washes in TTBS, the membranes were incubated in TTBS/2.5% milk containing goat anti-rabbit (GAR) coupled to horseradish peroxidase (HRP) (2000/1, GAR-HRP, Fisher Scientific, Houston, TX) for 2 hr. After several washes in TTBS, bands were visualized by enhanced chemiluminescence.
The resultant Western blots, which are illustrated in Figure1, show that antibodies recognized specific bands of the appropriate molecular weights for each receptor in cat tissue. These are 142 kDa for mGluR1α and 148 kDa for mGluR5 (Martin et al., 1992;Reid et al., 1995). The mGluR1α band is somewhat broad. Because the antibody is highly selective for mGluR1α and monospecific (Martin et al., 1992), this likely represents microheterogeneity of the mGluR1α protein. There are several sites for N-linked glycosylation in the extracellular domain as well as several consensus sites for phosphorylation in the C-terminal intracellular domain (Masu et al., 1991). Because both glycosylation and phosphorylation alter the migration of proteins on SDS gels, heterogeneity in electrophoretic mobility likely reflects heterogeneity of these post-translational modifications in the population of mGluR1α molecules.
Fig. 1.

Western blots of the cat’s LGN and visual cortex. The vertical scale is in kilodaltons. These confirm recognition by the antibody of proteins of the appropriate molecular weight for mGluR1α (142 kDa) and mGluR5 (148 kDa).
Immunohistochemistry
We used tissue from five adult cats for the immunohistochemistry, and we analyzed the tissue with both light and electron microscopy. We have published details of most of these techniques previously (Wilson et al., 1984; Cucchiaro et al., 1991,1993; Bickford et al., 1994), and they are briefly outlined here. We perfused the cats transcardially with 4% paraformaldehyde and 0.1–0.3% EM grade glutaraldehyde in 0.1 m sodium phosphate buffer (PB), pH 7.4. The brains were removed and placed in the fixative overnight. Sections were cut on a vibratome at a thickness of 50 μm and collected in a bath of 0.1 m PB or 0.1m PBS.
We chose sections containing the LGN and thalamic reticular nucleus (TRN) and processed them for mGluR1α and mGluR5 immunohistochemistry using antibodies directed against these mGluRs. We pretreated sections with 0.3% Triton X-100 in 10% normal goat serum (NGS)/PBS for 30 min and placed them in the appropriate primary antibody at a dilution of 1:500 in 1% NGS/PBS for 2 d at 4°C. On the third day, the tissue was rinsed three times for 10 min each in PBS and transferred to goat anti-rabbit biotinylated IgG secondary antibody with a dilution of 1:100 in 1% NGS/PBS for 1 hr. The sections were again rinsed three times for 10 min each in PBS and incubated in avidin–biotin complex (ABC, Vector Labs, Burlingame, CA) at a dilution of 1:100 in PBS for 1 hr. After rinsing the sections in PBS three times for 10 min each, we used either a glucoseoxidase–nickel or a cobalt chloride DAB intensification reaction to visualize the antibodies.
Microscopy
We used the light microscope only for qualitative evaluation to determine which regions of the LGN and TRN contained label directed against mGluR1α or mGluR5. All analysis done at the electron microscopic level was confined to the A-laminae of the LGN and the perigeniculate nucleus, which is a region of the TRN. We prepared the material for electron microscopy as follows. Sections containing the LGN and perigeniculate nucleus labeled for mGluR1α and mGluR5 were osmicated in 2% osmium tetroxide (OsO4) in 0.1m PB for 1 hr, rinsed in PB three times for 10 min each, dehydrated through a graded series of ethyl alcohol, placed for 1 hr each into a 1:1 and then a 3:1 mixture of Durcupan ACM/Fluka (Electron Microscopy Sciences, Fort Washington, PA) resin and 100% ethyl alcohol, transferred to pure resin, and vacuum-infiltrated overnight. Each section was then flat-embedded between two pieces of ACLAR (Ted Pella, Reading, CA) and placed in an oven at 62 °C for 48–72 hr. We used a Reichart–Jung Ultracut E ultramicrotome to take thin sections at ∼80 nm, and we picked these up on Formvar-coated, nickel single-slot grids. Sections were stained with uranyl acetate followed by lead citrate and examined on a JEOL1200 EXII electron microscope. We included a process or terminal for analysis only if it was clearly bounded by intact membrane. We considered a process or terminal to be immunolabeled only if the electron-dense diaminobenzidine reaction product was contained within the extent of the dendrite, soma, or terminal within the section. We measured the diameters of dendritic profiles by computing the area of the measured process then solving for the diameter, assuming a circular morphology for the measured profile. This procedure tended to overestimate the dendritic diameters. However, our purpose was to compare the diameters of labeled versus unlabeled dendrites, and we employed the same within-section methodology for both labeled and unlabeled dendrites.
Classification of synaptic profiles. We adopted previous nomenclature (Guillery, 1969a,b; Montero, 1989) for identification of synaptic profiles in the A-laminae and found that >95% of all terminals there could be identified in this manner. RLPterminals ( round vesicles in large profiles with pale mitochondria) derive exclusively from optic tract axons. These form asymmetric contacts. RSD terminals ( round vesicles in small profiles with dark mitochondria) derive mostly from corticogeniculate axons but also from brainstem axons. These also form asymmetric contacts. The cortical terminals, which are glutamatergic, innervate distal dendrites of relay cells, whereas the brainstem terminals, which are mostly cholinergic, innervate proximal dendrites (Guillery, 1969a,b; Wilson et al., 1984; Erişir et al., 1996). Fterminals ( flat or pleomorphic vesicles) make symmetrical contacts, and these are GABAergic. We used GABA immunohistochemistry as an aid to distinguish F from RSD terminals (see below). Where possible, F profiles were identified further as F1 and F2 terminals. F1 terminals derive from axons of interneurons, of cells of the TRN, or of cells of the nucleus of the optic tract, and they are strictly presynaptic. F2 terminals derive from dendrites of interneurons, and these are both presynaptic and postsynaptic.
Postembedding immunohistochemistry. The immunohistochemical labeling for mGluRs is a preembedding procedure. We also used a postembedding procedure to label the same tissue with an antibody directed against GABA. For this, we modified a protocol describe previously (Phend et al., 1992). Briefly, thin sections were rinsed in Tris-buffered saline with Triton X-100 (TBST), pH 7.6, then incubated in rabbit anti-GABA (Sigma, St. Louis, MO) primary antibody at a dilution of 1:500–1:1000 in TBST, pH 7.6, for 24 hr at room temperature and then rinsed in TBST, pH 7.6, and TBST, pH 8.2. We then incubated the sections in GAR–IgG-conjugated gold (15 nm, Amersham Life Sciences, Arlington Heights, IL) at 1:25 in TBST, pH 8.2, for 1 hr; we then rinsed them in TBST, pH 7.6, and deionized water. Thin sections were then placed in 2% glutaraldehyde (EM grade), rinsed in deionized water, and then counterstained and examined.
To ascertain whether a profile was GABA-positive, we used our criterion described previously (Bickford et al., 1994). We determined the density of gold label in the profiles under study, and we compared this with background labeling. We assessed background labeling in the following way. We calculated the distribution of label density in every RLP terminal seen in the thin section. RLP terminals are easily identified and are known to be glutamatergic; there is no evidence that they contain GABA. Because the overall amount of gold labeling varied among sections, this density distribution was determined separately for every thin section. We computed for each section the density level that exceeded the level seen in 95% of the RLP terminals, and this became our cut-off level for background labeling. We classified a terminal or process as GABA-positive if the gold particle density exceeded this 95% level.
RESULTS
Our attention in examining the distribution of mGluR1α and mGluR5 labeling was focused on the LGN and TRN. In the TRN, most of our observations were directed at the perigeniculate nucleus, which is the region of the TRN lying just dorsal to the LGN. Although we did not exhaustively analyze more dorsal regions of the TRN, we did not observe obvious differences in labeling among the perigeniculate nucleus and these other regions of the TRN. As we shall demonstrate, at both the light and electron microscopic levels, we see differences in the staining patterns for antibodies directed against mGluR1α and mGluR5.
Light microscopic observations
Labeling with antibodies directed against both mGluR1α and mGluR5 was found in the neuropil of the LGN and TRN (Fig.2A,B). Neither antibody labeled somata within the LGN. Some soma labeling was seen with mGluR1α in the TRN but not with mGluR5 labeling. Overall, the neuropil labeling for both antibodies was denser in the LGN than in the TRN.
Fig. 2.

Light-level photomicrographs of immunocytochemical labeling of mGluR1α and mGluR5 in the LGN and TRN. The views are in the sagittal plane. A, Lower-power view of mGluR1α labeling. Label is seen in both the LGN (the A- and C-laminae) (seeB), and the TRN (TRN), including the perigeniculate nucleus, which lies just dorsal to A-lamina (seeB). B, Lower-power view of mGluR5 labeling. The main geniculate laminae seen are lamina A (a), lamina A1 (a1), and the C complex of laminae (c). C, Higher-power view of mGluR1α labeling. At this level, most staining is evident as thin fibers (arrowheads). No somata are stained, and little punctate staining is seen except along dendrite-like processes.D, Higher-power view of mGluR5 labeling. As inC, no somata are stained, but instead of fiber staining, most staining is in the form of clusters of dense puncta (arrowheads). Scale bars: A,C, 10 μm; B, D, 1 mm.
One obvious difference in the labeling pattern of these two antibodies is that the antibody directed against mGluR1α does not define laminar boundaries within the LGN (Fig. 2A), whereas that directed against mGluR5 does (Fig. 2B). This results from sparse mGluR5 labeling in the interlaminar regions. Another difference is seen at higher magnification. Here, we observed fine-caliber fibers labeled with the antibody directed against mGluR1α (Fig. 2C), whereas tissue labeled for the mGluR5 antibody showed immunolabeled puncta in prominent clusters not seen with mGluR1α (Fig. 2D). Although punctate labeling is sometimes seen with the mGluR1α antibody, such labeled puncta are found in elongated strands that appear to follow the course of dendrites, whereas the puncta of mGluR5 labeling are more globular and do not appear to be associated in any clear way with elongated processes. These observations are consistent with those described below that were obtained with electron microscopy, and the significance of this is indicated in Discussion.
Electron microscopic observations
As noted in Materials and Methods, we used preembedding and postembedding double-labeling techniques with electron microscopy to colocalize mGluR and GABA labeling in the same sections. The determination of whether a profile contained GABA (i.e., GABA-positive) or did not (i.e., GABA-negative) was based on a quantitative algorithm described in Materials and Methods. This enabled us to distinguish dendritic profiles of interneurons, which are GABA-positive, from those of relay cells, which are GABA-negative. GABA labeling also allowed us to distinguish the positively labeled F terminals from the RSD and RLP terminals, which do not contain appreciable levels of GABA.
Localization of mGluR1α in the LGN
Labeled profiles. We observed mGluR1α immunolabel within dendrites of relay cells. Figure 3Ashows an example of such a labeled dendrite, and this is consistent with the fiber staining seen at the light microscopic level (Fig.2C). The labeled dendrite shown in Figure 3Areceives numerous asymmetric synaptic contacts from terminal profiles of RSD morphology, and no RLP terminals were seen to contact this dendritic segment. We occasionally observed F terminals forming contacts onto labeled dendrites of relay cells, and these were found among RSD terminals contacting the same dendrite. Figure 3Bshows an example of this.
Fig. 3.

Electron micrographs of mGluR1α staining in neuropil of geniculate A-laminae. A, Dense staining is seen in a dendrite (d*). The tissue was also labeled postembedding for GABA, and on this basis, the dendrite is identified as from a relay cell, because it is not labeled for GABA (see Materials and Methods). Numerous unlabeled RSD terminals are also seen (RSD), and many of these contact the labeled dendrite in this section (arrowheads); others also contact the dendrite, but in nearby sections. Also shown are F terminals (F) with significant GABA labeling.B, Example of GABA-labeled F terminal (F) contacting dendrite labeled for mGluR1α (d*) but unlabeled for GABA.
We did not detect labeled dendrites within glomeruli, which are complex synaptic zones encapsulated by glia and associated with retinal inputs. Glomeruli are particularly associated with X cells and are rare for Y cells (Wilson et al., 1984; Hamos et al., 1985, 1987). In contrast to this pattern of dendrites labeled for the mGluR1α antibody, the pattern of unlabeled dendrites is very different. Figure4 shows an example of this difference. The relay cell dendrite contacted within the glomerulus by the RLP terminal is unlabeled, although the contact zone is not visible in this plane of section. Outside this glomerulus, another unlabeled dendrite is contacted by an RLP terminal. In contrast, also outside the glomerulus is found a labeled relay cell dendrite that is contacted by an RSD terminal.
Fig. 4.
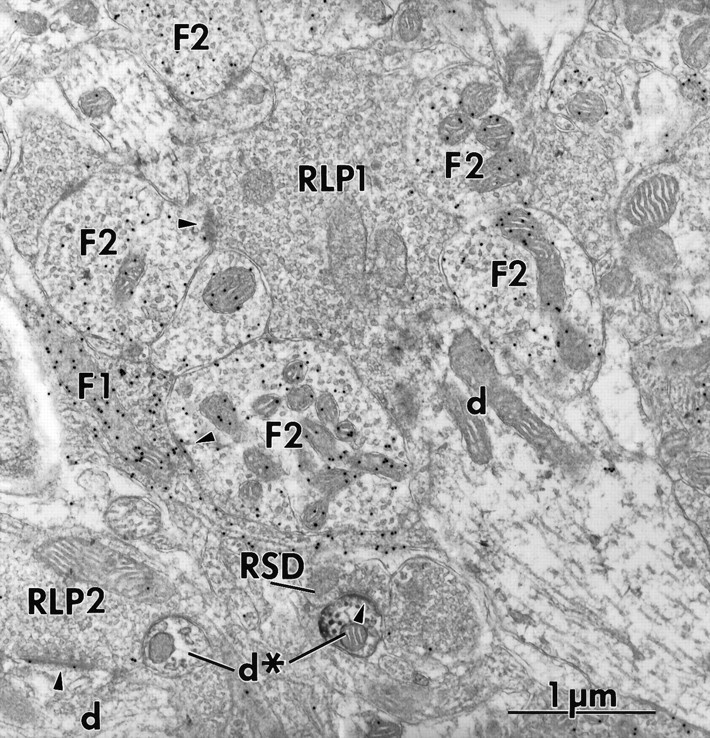
Electron micrograph showing lack of mGluR1α labeling within a glomerulus. In the center of the glomerulus is a large RLP terminal (RLP1) surrounded by numerous F2 terminals (F2) labeled for GABA. An F1 terminal (F1) is also seen in the glomerulus. Although not seen in this section, the relay cell dendritic profile within the glomerulus (d) is contacted by the RLP terminal and many of the F terminals. Another RLP terminal (RLP2) is seen outside the glomerulus, and this contacts another unlabeled relay cell dendrite (d) nearby. Also outside the glomerulus are two relay cell dendrites labeled for mGluR1α (d*), and one of these is contacted (arrowhead) by a nearby RSD terminal (RSD).
Figure 5 shows various features of profiles for our entire sample for the mGluR1α antibody, both labeled and unlabeled. This documents the fact that the examples shown in Figure 3 are fairly representative. Figure 5A shows that all but one of the 68 profiles (99%) labeled for mGluR1α were dendritic profiles, and of these 67 dendritic profiles, 61 (91%) were confirmed as dendrites of relay cells. None of the 67 labeled dendritic profiles was found in a glomerulus, and dendrites in glomeruli were always unlabeled for the mGluR1α antibody.
Fig. 5.

Summary of mGluR1α labeling within the A-laminae. A, Relative percentage of different labeled profiles and whether they contain GABA. Nearly all labeled profiles were dendrites of relay cells. B, Relative percentage of different terminals forming synapses on labeled relay cell dendrites. Most of these are RSD terminals.
Synaptic terminals contacting labeled dendrites. Excitatory effects of mGluR activation have been observed in vitro only via stimulation of the corticogeniculate pathway (McCormick and Von Krosigk, 1992). The corticogeniculate and retinogeniculate inputs are virtually completely segregated on each relay cell’s dendritic arbor. The retinal input contacts the proximal dendrites in the retinal recipient zone, often in glomeruli, and the cortical input contacts distal dendrites, in the cortical recipient zone (Guillery, 1969a,b;Wilson et al., 1984; Hamos et al., 1987; Erişir et al., 1996). This synaptic arrangement provides the opportunity to determine the relative access of the retinal and cortical inputs to dendrites staining positively for mGluR1α. We did this by examining the morphology of profiles making clearly identifiable synapses on labeled processes.
Figure 5B shows the entire population of terminals found making synapses onto relay cell dendrites labeled for mGluR1α. Of these 78 terminals, only 4 (5.1%) were RLP terminals, and the rest were RSD (61 or 78.2%) or F (13 or 16.7%) terminals. Thus, the most common profile labeled for mGluR1α was a relay cell dendrite contacted mostly by RSD and occasional F terminals. This pattern indicates that the dendrites labeled for mGluR1α are chiefly from the cortical recipient zone of relay cell arbors (Guillery, 1969a,b; Wilson et al., 1984; Hamos et al., 1987; Erişir et al., 1996).
Analysis of dendritic diameter. Because dendrites taper, at the cortical recipient zone they are finer, on average, than those at the retinal recipient zone. Thus, dendrites labeled with the mGluR1α should tend to be finer than unlabeled dendrites, which are generally within the retinal recipient zone. To test this, we measured the dendritic diameters of labeled dendrites and compared this with the dendritic diameters of unlabeled dendrites within the same thin sections. Figure 6 summarizes this analysis. Although the diameter distributions of labeled and unlabeled dendrites overlap, those of the labeled dendrites are significantly thinner (p < 0.02 on a Mann–Whitney Utest). This is consistent with the observation that mGluR1α label is concentrated in the cortical recipient zone. However, there is considerable overlap between the distributions. This is not unexpected, partly because proximal dendrites are not always thicker than distal dendrites and partly because some larger cells (e.g., Y cells) have generally thicker dendrites than some smaller cells (e.g., X cells), so that some dendrites at the cortical recipient zone of the larger cells would be thicker than dendrites at the retinal recipient zone of the smaller cells.
Fig. 6.

Distribution of diameters for dendrites labeled and unlabeled for mGluR1α.
Localization of mGluR5 in the LGN
The ultrastructural pattern of mGluR5 immunolabel was fundamentally different from that associated with mGluR1α labeling. Figure 7A shows elements of a synaptic glomerulus that illustrate the pattern of mGluR5 label we found in the LGN. In this single thin section is an RLP terminal contacting an F2 terminal and another F2 terminal contacting a relay cell dendrite. Both F2 profiles contained GABA as shown by the postembedding immunogold particles. These terminals also show clear labeling for the antibody directed against mGluR5. We commonly found mGluR5 label in F2 terminals within glomeruli, but we never encountered either F2 terminals or any other profile within glomeruli with label for mGluR1α (see above).
Fig. 7.
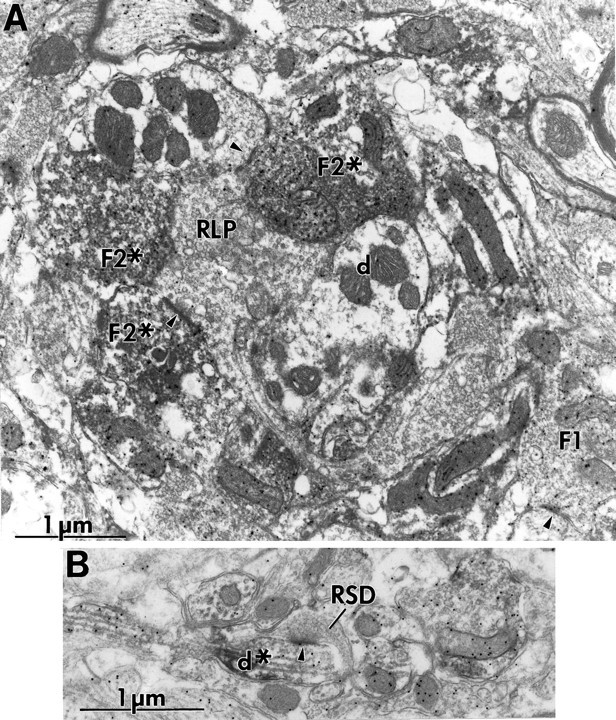
Electron micrographs showing mGluR5 labeling in A-laminae. A, Labeled F2 terminals (F2*) in glomeruli innervated by RLP terminal (RLP). One of the synapses seen in this section is indicated by anarrowhead. This was the most common pattern. Note the unlabeled relay cell dendrite (d) in the glomerulus. B, Extraglomerular labeling of a fine-caliber dendrite (d*) that is also labeled for GABA. This dendrite is contacted (arrowhead) by an RSD terminal (RSD).
Figure 8A summarizes the observed pattern of mGluR5 labeling. Of 155 labeled profiles, 114 (73.6%) were F terminals. Without serial reconstruction, it is often difficult to distinguish between F1 and F2 terminals. We made no attempt to do so unless the section being studied included sufficient data in the form of relevant synaptic contacts as follows. If the F terminal was postsynaptic to any other terminal, it was identified as an F2 terminal, because F1 terminals are never postsynaptic (Guillery, 1969a,b; Hamos et al., 1985, 1987). Conversely, if the F terminal contacted another synaptic terminal (in our hands, always another F terminal), it was deemed an F1 terminal, because F2 terminals contact only dendrites (Guillery, 1969a,b; Hamos et al., 1985, 1987). Using these criteria, we were able to further identify 50 of the F terminals (44.2%): 46 (92.0%) were F2 terminals, and only 4 (8.0%) were F1. Because 92% of labeled F terminals are F2, and F terminals comprise 73.6% of labeled profiles in the geniculate neuropil, we conclude that most (67.7%) profiles labeled with the mGluR5 antibody are F2 terminals.
Fig. 8.

Summary of mGluR5 labeling within the A-laminae.A, Relative percentage of different labeled profiles and whether they contain GABA. Most of the labeling was in F terminals. Many of these (F?) could not be distinguished further as F1 or F2. B, Relative percentage of different terminals forming synapses onto the dendrites and F2 terminals labeled for mGluR5. Whereas the dendrites were contacted chiefly by RSD terminals, the F2 terminals were innervated almost exclusively by RLP terminals.
We also less commonly observed mGluR5 immunolabel within fine-caliber dendrites that also labeled for GABA, and Figure 7B shows such an example. Figure 8A summarizes this dendritic labeling. Overall, 41 (26.4%) of the labeled profiles were these thin dendrites, and of these, 21 (48.8%) also contained GABA. Presumably, these are the same interneuron dendrites that give rise to the F2 terminals that also label for mGluR5 and GABA (e.g., Fig.7A).
The meaning of the dendrites labeled for mGluR5 but not for GABA is less clear, and there are two obvious possibilities. The first possibility is that they are from relay cells. If so, their fine caliber suggests that they derive from distal dendrites in the cortical recipient zone and might therefore contain both mGluR1α and mGluR5 types. In fact, Figure 8B shows that the majority of terminals (38 of 52, or 73.1%) contacting dendrites labeled for mGluR5 are RSD terminals. The second possibility is that many of these very fine-caliber dendrites are interneurons, but the small cross-sectional area of the profile might mean that even though it contains GABA, no gold particles are seen. Whatever the meaning of these dendrites labeled for mGluR5 but not GABA, our data show that most of the profiles (134 of 155, or 86.5%) labeled for mGluR5 in the LGN clearly label for GABA and thus derive from interneurons. Figure8B also shows that 43 of the 46 terminals (93.5%) contacting F2 terminals labeled for mGluR5 are RLP terminals, and the few remaining F1 terminals (3 of 46, or 6.5%) contacting these labeled F2 terminals are GABAergic. Thus, the only known source of glutamatergic input that is a plausible candidate to activate the mGluR5 on F2 terminals is retinal input.
It is worth emphasizing that the pattern of labeling with the mGluR1α antibody differs markedly from that associated with the mGluR5 antibody. Thus, the staining patterns shown in Figure 5, Aand B, differ significantly from those shown in Figures 8,A and B (p < 0.001 on χ2 tests for both comparisons). These comparisons serve to emphasize the specific and exclusive nature of the staining patterns of both mGluR antibodies.
Localization of mGluR1α and mGluR5 in the perigeniculate nucleus
The pattern of mGluR localization did not differ markedly between mGluR1α and mGluR5 in the perigeniculate nucleus. Our electron microscopic observations confirmed our light-level examination of labeled tissue. In the perigeniculate nucleus, both mGluR1α and mGluR5 labeled dendrites that also contained GABA (Fig.9). In the case of both receptors, immunolabel was found postsynaptic to various types of synaptic terminal, including F terminals that contained GABA and other terminals that were GABA-negative. The latter were predominantly of the RSD type, although from our material it was not possible to determine the origin of these terminals. This is because collaterals of both corticogeniculate and geniculocortical axons end in RSD terminals and innervate perigeniculate cells (Montero, 1989). These are glutamatergic and may activate these mGluRs. However, cholinergic axons from the parabrachial region of the brainstem end in RSD terminals and innervate the perigeniculate nucleus (de Lima et al., 1985; Uhlrich et al., 1988;Erişir et al., 1996), so we cannot be absolutely certain of the transmitter used by these terminals contacting labeled dendrites in the perigeniculate nucleus. Finally, we saw somata labeled for mGluR1α (Fig. 9C) but not for mGluR5, and this is consistent with our light microscopic observations.
Fig. 9.

Examples of mGluR1α and mGluR5 labeling in perigeniculate nucleus. A, F terminal (F) contacting dendrite labeled for mGluR1α (d*). The synapse is indicated by anarrowhead. B, RSD terminal (RSD) contacting dendrite labeled for mGluR1α (d*). The synapse is indicated by anarrowhead. C, Soma labeled for mGluR1α (soma). Note the spine-like process extending from the soma (asterisk). D, RSD terminal (RSD) contacting fine-caliber dendrite (arrowhead) labeled for mGluR5 (d*). Scale bars (shown in C), 1 μm.
DISCUSSION
We detected both mGluR1αs and mGluR5s in the LGN, but the location of the receptors within the geniculate circuitry revealed interesting and important differences indicative of two, fundamentally different, functional roles. In broad terms, mGluR1α staining is associated with relay cell dendrites in the cortical recipient zone, whereas mGluR5 staining is associated with interneuronal dendrites and dendritic terminals postsynaptic to retinal inputs. The differential distribution of the mGluRs observed in the current study underscores the important idea that the response repertoire of a neuron is not only dependent on the nature of its synaptic input but also on both the type and the placement of its postsynaptic receptors. Both retinal and cortical synapses apparently activate NMDA and AMPA iGluRs on relay cells (Scharfman et al., 1990), but apparently they do not activate the same set of mGluRs. Furthermore, as explained in more detail below, the observed pattern of mGluR localization has implications for parallel processing in the geniculate relay involving X and Y cells, which are the two classes of relay cell found in the A-laminae. Figure10 summarizes these patterns.
Fig. 10.

Schematic showing major patterns of immunolabel and relationship to known pathways related to excitatory mGluRs in the LGN. Shown are two relay cells, an X cell (left) and a Y cell (right). Both cells have mGluR1α labeling on peripheral dendrites postsynaptic to cortical input. The interneuron associated with the X cell extends a dendrite that forms an F2 terminal onto the proximal dendrite of the relay cell. This F2 contact contains label for mGluR5 and is innervated by a retinal terminal that also contacts the relay cell in a triadic arrangement. The Y cell has no similar interneuron input. See text for details.
The pattern of labeling seen with the electron microscope is also consistent with the light microscopic observations of Figure 2,A and B. Because interneurons are entirely contained within a single lamina (A or A1) (Friedlander et al., 1981), there are no interneuron processes in interlaminar zones to exhibit the label. Thus, interlaminar zones are relatively free of mGluR5 label. In contrast, mGluR1α labels peripheral dendrites of relay cells. Many of these, particularly for Y cells, freely cross laminar boundaries (Friedlander et al., 1981). Thus, mGluR1α label is common in the interlaminar zones.
Localization of mGluR1α
Previous in vitro studies suggested that the depolarization of relay cells seen with activation of mGluRs is normally achieved only via activation of corticogeniculate but not retinogeniculate axons. Although one may consider several plausible patterns of mGluR localization consistent with these data, the simplest pattern was observed: mGluRs on relay cell dendrites are seen only in the cortical recipient zone and not in the retinal recipient zone. Because both retinal and cortical inputs are glutamatergic, this means that relay cells are able to localize their mGluRs to specific dendritic loci that represent only a specific subset of their glutamatergic inputs. Thus, the input from layer 6 of visual cortex has almost exclusive glutamatergic access to these excitatory mGluRs.
The function of the corticothalamic pathway has been one of the enduring mysteries of the thalamus, and with a few exceptions, it remains an enigma (for review, see Sherman and Guillery, 1996). Our studies point to at least one unique function of this pathway for the LGN, a switching of the response mode of geniculate cells from burst to tonic firing via activation of mGluRs (Godwin et al., 1996a). We have shown previously that in vivo pharmacological activation of these mGluRs, which mimic activation of corticogeniculate inputs, caused a marked transition of relay cell firing from burst to tonic response mode, and our pharmacological data implicate mGluR1 in this process (Godwin et al., 1996a). Burst firing is based on the activation of a voltage-dependent, low-threshold Ca2+ conductance. Inactivation of this conductance by depolarization leads to tonic firing (Jahnsen and Llinás, 1984a,b; McCormick and Huguenard, 1992). Key to this switch from burst to tonic firing is the prolonged EPSP generated by mGluR activation, because the much briefer EPSP resulting from iGluR activation is much less suited for long-term inactivation of the Ca2+ conductance (McCormick and Von Krosigk, 1992; Godwin et al., 1996a).
This transition from burst to tonic firing is significant, because it has been shown that the firing mode, burst or tonic, used by the geniculate relay cells has important implications for visual processing (Guido et al., 1995; Sherman, 1995; Sherman and Guillery, 1996). When these relay cells fire in burst mode, they signal the presence of a visual stimulus more effectively, but burst firing confers nonlinear distortion into the signal relayed to cortex. When in tonic mode, the cells relay more linearly but are less able to signal the presence of a stimulus. Thus, activation of these mGluRs by the corticogeniculate input may be a powerful mechanism for controlling response mode (Godwin et al., 1996a).
Activation of the cholinergic projection from the parabrachial region of the brainstem also depolarizes LGN relay cells and leads to tonic firing. However, an important anatomical distinction between the corticogeniculate and brainstem projection is their retinotopic precision: that of the corticogeniculate input is very high, whereas that of the brainstem is not (for review, see Sherman and Guillery, 1996). The anatomical arrangement of cortical glutamatergic inputs in close association with mGluRs as revealed in the present study could provide for retinotopically precise mode-switching that serves to enhance certain features of visual stimuli as a function of behavioral state or stimulus attribute (Godwin et al., 1996a).
Localization of mGluR5
Another important mystery of the thalamus is the function of the triadic synaptic arrangements found in glomeruli, a feature characteristic of relay X cells (Wilson et al., 1984; Hamos et al., 1985, 1987). Within glomeruli, F2 terminals are involved in synaptic triads in which a retinal input contacts a GABAergic F2 terminal as well as a relay cell dendrite, and the F2 terminal also contacts the same dendrite (Guillery, 1969a,b; Famiglietti and Peters, 1972; Hamos et al., 1985). These terminals are thought to be involved in feedforward, GABAergic inhibitory postsynaptic potentials in relay cells on stimulation of the retinal input (Soltesz et al., 1989), but their specific role in visual information processing is vague. Our data demonstrate a unique pattern of mGluR5 label related to F2 terminals within glomeruli that sets this inhibitory circuitry apart from other GABAergic inputs.
The mGluR5 labeling was most prominent in inhibitory interneurons but largely limited to their F2 terminals, which are the dendritic outputs of interneurons, and less so to dendrites. Furthermore, whereas F2 terminals may be postsynaptic to a variety of different inputs, the mGluR5 labeling was primarily limited to F2 terminals postsynaptic to retinal terminals. Furthermore, triadic circuitry and glomeruli represent the dominant retinal input to relay X cells but is rare in Y cells (Wilson et al., 1984; Hamos et al., 1985, 1987). As Figure 10shows, the mGluR5 labeling is thus mostly a feature of the X pathway and not the Y. This pattern of mGluR5 labeling supports two physiological observations regarding responses of interneurons and possible functioning of the synaptic triads that include F2 terminals.
First, the lack of labeling on proximal (thicker) dendrites or somata of interneurons suggests that mGluR activation would have little effect on responses recorded at the interneuron soma. This is because the F2 terminals and peripheral dendrites may be electrotonically isolated from the soma (Bloomfield and Sherman, 1989). Indeed, application of ACPD, an mGluR agonist, fails to excite interneurons (Pape and McCormick, 1995; Godwin et al., 1996b).
Second, on the basis of the labeling alone, one cannot determine whether activation of these mGluR5s leads to inhibition or excitation of the F2 terminals. Although a precedent for presynaptic inhibition via mGluR5s exists for hippocampus (Gereau and Conn, 1995), our preliminary pharmacological evidence from both in vitro andin vivo recording indicates that ACPD application produces excitation of these F2 terminals (Zhou et al., 1994; Godwin et al., 1996b). Such F2 excitation leads to inhibition of relay X cells that is TTX-independent and bicuculline-sensitive; little effect is seen on relay Y cells (Zhou et al., 1994; Godwin et al., 1996b). This is most readily explained by ACPD activation of mGluRs in the F2 terminals normally activated by retinal terminals and found chiefly as parts of triads in glomeruli, a feature associated with X rather than Y retinogeniculate circuitry (Wilson et al., 1984; Hamos et al., 1985,1987).
We thus suggest that mGluR5 may subserve feedforward inhibition of the retinal signal through F2 terminals in glomeruli and that this inhibition is quite local, because it depends on passive, electrotonic spread of a retinal EPSP and not an actively conducted action potential. Furthermore, because mGluR activation appears to require high-frequency stimulation (McCormick and Von Krosigk, 1992), it may be that the feedforward inhibition associated with mGluR5 activation may only be evoked during high rates of firing of the retinal afferents. This could prevent saturation of the response of the relay cell during high rates of firing among its retinal inputs and thereby extend the dynamic range of the geniculate relay (Koch, 1985), particularly in the X pathway, which is especially concerned with linear processing (Enroth-Cugell and Robson, 1966; Hochstein and Shapley, 1976a,b;Shapley and Lennie, 1985).
Footnotes
This work was supported by research grants from National Institutes of Health (EY03604, EY02687, EY09370, EY08089, and AG11355) and from Research to Prevent Blindness. D.W.G. was supported through National Research Service Award (NSRA) EY06645 and A.E. through NRSA EY06473. We gratefully acknowledge the technical assistance of Olga Levin, and we thank Lee Martin for providing the mGluR1α antibody.
Correspondence should be addressed to Dr. S. Murray Sherman, Department of Neurobiology, State University of New York, Stony Brook, NY 11794-5230.
Dr. Sesma’s current address: Office of Scientific Review, National Institute of General Medical Sciences, National Institutes of Health, 45 Center Drive, MSC 6200, Bethesda, MD 20892-6200.
Dr. Romano’s current address: Department of Ophthalmology and Visual Sciences, Washington University School of Medicine, 660 South Euclid Avenue, St. Louis, MO 63110.
REFERENCES
- 1.Bickford ME, Günlük AE, Van Horn SC, Sherman SM. GABAergic projection from the basal forebrain to the visual sector of the thalamic reticular nucleus in the cat. J Comp Neurol. 1994;348:481–510. doi: 10.1002/cne.903480402. [DOI] [PubMed] [Google Scholar]
- 2.Bloomfield SA, Sherman SM. Dendritic current flow in relay cells and interneurons of the cat’s lateral geniculate nucleus. Proc Natl Acad Sci USA. 1989;86:3911–3914. doi: 10.1073/pnas.86.10.3911. [DOI] [PMC free article] [PubMed] [Google Scholar]
- 3.Cucchiaro JB, Uhlrich DJ, Sherman SM. Electron-microscopic analysis of synaptic input from the perigeniculate nucleus to the A-laminae of the lateral geniculate nucleus in cats. J Comp Neurol. 1991;310:316–336. doi: 10.1002/cne.903100304. [DOI] [PubMed] [Google Scholar]
- 4.Cucchiaro JB, Uhlrich DJ, Sherman SM. Ultrastructure of synapses from the pretectum in the A-laminae of the cat’s lateral geniculate nucleus. J Comp Neurol. 1993;334:618–630. doi: 10.1002/cne.903340409. [DOI] [PubMed] [Google Scholar]
- 5.de Lima AD, Montero VM, Singer W. The cholingergic innervation of the visual thalamus: an EM immunocytochemical study. Exp Brain Res. 1985;59:206–212. doi: 10.1007/BF00237681. [DOI] [PubMed] [Google Scholar]
- 6.Enroth-Cugell C, Robson JG. The contrast sensitivity of retinal ganglion cells of the cat. J Physiol (Lond) 1966;187:517–552. doi: 10.1113/jphysiol.1966.sp008107. [DOI] [PMC free article] [PubMed] [Google Scholar]
- 7.Erişir A, Van Horn SC, Bickford ME, Sherman SM (1996) Immunocytochemistry and distribution of parabrachial terminals in the lateral geniculate nucleus of the cat: a comparison with corticogeniculate terminals. J Comp Neurol, in press. [PubMed]
- 8.Famiglietti EV, Peters A. The synaptic glomerulus and the intrinsic neuron in the dorsal lateral geniculate nucleus of the cat. J Comp Neurol. 1972;144:285–334. doi: 10.1002/cne.901440304. [DOI] [PubMed] [Google Scholar]
- 9.Fotuhi M, Standaert DG, Testa CM, Penney JB, Jr, Young AB. Differential expression of metabotropic glutamate receptors in the hippocampus and entorhinal cortex of the rat. Brain Res Mol Brain Res. 1994;21:283–292. doi: 10.1016/0169-328x(94)90259-3. [DOI] [PubMed] [Google Scholar]
- 10.Friedlander MJ, Lin C-S, Stanford LR, Sherman SM. Morphology of functionally identified neurons in lateral geniculate nucleus of the cat. J Neurophysiol. 1981;46:80–129. doi: 10.1152/jn.1981.46.1.80. [DOI] [PubMed] [Google Scholar]
- 11.Gereau RW, 4th, Conn PJ. Multiple presynaptic metabotropic glutamate receptors modulate excitatory and inhibitory synaptic transmission in hippocampal area CA1. J Neurosci. 1995;15:6879–6889. doi: 10.1523/JNEUROSCI.15-10-06879.1995. [DOI] [PMC free article] [PubMed] [Google Scholar]
- 12.Godwin DW, Van Horn SC, Günlük AE, Sesma MA, Romano C, Sherman SM. Localization of two metabotropic glutamate receptors (mGluR1α and mGluR5) in cat LGN. Soc Neurosci Abstr. 1995;21:658. [Google Scholar]
- 13.Godwin DW, Vaughan JW, Sherman SM. Metabotropic glutamate receptors switch visual response mode of lateral geniculate nucleus cells from burst to tonic. J Neurophysiol. 1996a;76:1800–1816. doi: 10.1152/jn.1996.76.3.1800. [DOI] [PubMed] [Google Scholar]
- 14.Godwin DW, Zhou Q, Sherman SM. Evidence for activation of feedforward GABAergic circuitry in cat LGN via a specific metabotropic glutamate receptor. Soc Neurosci Abstr. 1996b;22:1606. [Google Scholar]
- 15.Guido W, Lu SM, Vaughan JW, Godwin DW, Sherman SM. Receiver operating characteristic (ROC) analysis of neurons in the cat’s lateral geniculate nucleus during tonic and burst response mode. Vis Neurosci. 1995;12:723–741. doi: 10.1017/s0952523800008993. [DOI] [PubMed] [Google Scholar]
- 16.Guillery RW. The organization of synaptic interconnections in the laminae of the dorsal lateral geniculate nucleus of the cat. Z Zellforsch Mikrosk Anat. 1969a;96:1–38. doi: 10.1007/BF00321474. [DOI] [PubMed] [Google Scholar]
- 17.Guillery RW. A quantitative study of synaptic interconnections in the dorsal lateral geniculate nucleus of the cat. Z Zellforsch Mikrosk Anat. 1969b;96:39–48. doi: 10.1007/BF00321474. [DOI] [PubMed] [Google Scholar]
- 18.Hamos JE, Van Horn SC, Raczkowski D, Uhlrich DJ, Sherman SM. Synaptic connectivity of a local circuit neurone in lateral geniculate nucleus of the cat. Nature. 1985;317:618–621. doi: 10.1038/317618a0. [DOI] [PubMed] [Google Scholar]
- 19.Hamos JE, Van Horn SC, Raczkowski D, Sherman SM. Synaptic circuits involving an individual retinogeniculate axon in the cat. J Comp Neurol. 1987;259:165–192. doi: 10.1002/cne.902590202. [DOI] [PubMed] [Google Scholar]
- 20.Hochstein S, Shapley RM. Quantitative analysis of retinal ganglion cell classifications. J Physiol (Lond) 1976a;262:237–264. doi: 10.1113/jphysiol.1976.sp011594. [DOI] [PMC free article] [PubMed] [Google Scholar]
- 21.Hochstein S, Shapley RM. Linear and non-linear subunits in Y cat retinal ganglion cells. J Physiol (Lond) 1976b;262:265–284. doi: 10.1113/jphysiol.1976.sp011595. [DOI] [PMC free article] [PubMed] [Google Scholar]
- 22.Jahnsen H, Llinás R. Electrophysiological properties of guinea-pig thalamic neurones: an in vitro study. J Physiol (Lond) 1984a;349:205–226. doi: 10.1113/jphysiol.1984.sp015153. [DOI] [PMC free article] [PubMed] [Google Scholar]
- 23.Jahnsen H, Llinás R. Ionic basis for the electroresponsiveness and oscillatory properties of guinea-pig thalamic neurones in vitro. J Physiol (Lond) 1984b;349:227–247. doi: 10.1113/jphysiol.1984.sp015154. [DOI] [PMC free article] [PubMed] [Google Scholar]
- 24.Koch C. Understanding the intrinsic circuitry of the cat’s LGN: electrical properties of the spine-triad arrangement. Proc R Soc Lond [B] 1985;225:365–390. doi: 10.1098/rspb.1985.0067. [DOI] [PubMed] [Google Scholar]
- 25.Martin LJ, Blackstone CD, Huganir RL, Price DL. Cellular localization of a metabotropic glutamate receptor in rat brain. Neuron. 1992;9:259–270. doi: 10.1016/0896-6273(92)90165-a. [DOI] [PubMed] [Google Scholar]
- 26.Masu M, Tanabe Y, Tsuchida K, Shigemoto R, Nakanishi S. Sequence and expression of a metabotropic glutamate receptor. Nature. 1991;349:760–765. doi: 10.1038/349760a0. [DOI] [PubMed] [Google Scholar]
- 27.McCormick DA, Huguenard JR. A model of the electrophysiological properties of thalamocortical relay neurons. J Neurophysiol. 1992;68:1384–1400. doi: 10.1152/jn.1992.68.4.1384. [DOI] [PubMed] [Google Scholar]
- 28.McCormick DA, Von Krosigk M. Corticothalamic activation modulates thalamic firing through glutamate “metabotropic” receptors. Proc Natl Acad Sci USA. 1992;89:2774–2778. doi: 10.1073/pnas.89.7.2774. [DOI] [PMC free article] [PubMed] [Google Scholar]
- 29.Montero VM. Ultrastructural identification of synaptic terminals from cortical axons and from collateral axons of geniculo-cortical relay cells in the perigeniculate nucleus of the cat. Exp Brain Res. 1989;75:65–72. doi: 10.1007/BF00248531. [DOI] [PubMed] [Google Scholar]
- 30.Nusser Z, Mulvihill E, Streit P, Somogyi P. Subsynaptic segregation of metabotropic and ionotropic glutamate receptors as revealed by immunogold localization. Neuroscience. 1994;61:421–427. doi: 10.1016/0306-4522(94)90421-9. [DOI] [PubMed] [Google Scholar]
- 31.Pape HC, McCormick DA. Electrophysiological and pharmacological properties of interneurons in the cat dorsal lateral geniculate nucleus. Neuroscience. 1995;68:1105–1125. doi: 10.1016/0306-4522(95)00205-w. [DOI] [PubMed] [Google Scholar]
- 32.Phend KD, Weinberg RJ, Rustioni A. Techniques to optimize post-embedding single and double staining for amino acid neurotransmitters. J Histochem Cytochem. 1992;40:1011–1020. doi: 10.1177/40.7.1376741. [DOI] [PubMed] [Google Scholar]
- 33.Reid SNM, Romano C, Hughes T, Daw NW. Immunohistochemical study of two phosphoinositide-linked metabotropic glutamate receptors (mGluR1α and mGluR5) in the cat visual cortex before, during, and after the peak of the critical period for eye-specific connections. J Comp Neurol. 1995;355:470–477. doi: 10.1002/cne.903550311. [DOI] [PubMed] [Google Scholar]
- 34.Romano C, Sesma MA, McDonald CT, O’Malley K, Van den Pol AN, Olney JW. Distribution of metabotropic glutamate receptor mGluR5 immunoreactivity in rat brain. J Comp Neurol. 1995;355:455–469. doi: 10.1002/cne.903550310. [DOI] [PubMed] [Google Scholar]
- 35.Scharfman HE, Lu S-M, Guido W, Adams PR, Sherman SM. N-methyl-d-aspartate (NMDA) receptors contribute to excitatory postsynaptic potentials of cat lateral geniculate neurons recorded in thalamic slices. Proc Natl Acad Sci USA. 1990;87:4548–4552. doi: 10.1073/pnas.87.12.4548. [DOI] [PMC free article] [PubMed] [Google Scholar]
- 36.Shapley R, Lennie P. Spatial frequency analysis in the visual system. Annu Rev Neurosci. 1985;8:547–583. doi: 10.1146/annurev.ne.08.030185.002555. [DOI] [PubMed] [Google Scholar]
- 37.Sherman SM. Dual response modes in lateral geniculate neurons: mechanisms and functions. Vis Neurosci. 1995;13:205–213. doi: 10.1017/s0952523800007446. [DOI] [PubMed] [Google Scholar]
- 38.Sherman SM, Guillery RW. The functional organization of thalamocortical relays. J Neurophysiol. 1996;76:1367–1395. doi: 10.1152/jn.1996.76.3.1367. [DOI] [PubMed] [Google Scholar]
- 39.Soltesz I, Lightowler S, Leresche N, Crunelli V. On the properties and origin of the GABAB inhibitory postsynaptic potential recorded in morphologically identified projection cells of the cat dorsal lateral geniculate nucleus. Neuroscience. 1989;33:23–33. doi: 10.1016/0306-4522(89)90307-2. [DOI] [PubMed] [Google Scholar]
- 40.Suzdak PD, Thomsen C, Mulvihill E, Kristensen P. Molecular cloning, expression, and characterization of metabotropic glutamate receptor subtypes. In: Conn PJ, Patel J, editors. The metabotropic glutamate receptors. Humana; Totowa, NJ: 1994. pp. 1–30. [Google Scholar]
- 41.Uhlrich DJ, Cucchiaro JB, Sherman SM. The projection of individual axons from the parabrachial region of the brainstem to the dorsal lateral geniculate nucleus in the cat. J Neurosci. 1988;8:4565–4575. doi: 10.1523/JNEUROSCI.08-12-04565.1988. [DOI] [PMC free article] [PubMed] [Google Scholar]
- 42.Watkins J, Collingridge G. Phenylglycine derivatives as antagonists of metabotropic glutamate receptors. Trends Pharmacol Sci. 1994;15:333–342. doi: 10.1016/0165-6147(94)90028-0. [DOI] [PubMed] [Google Scholar]
- 43.Wilson JR, Friedlander MJ, Sherman SM. Fine structural morphology of identified X- and Y-cells in the cat’s lateral geniculate nucleus. Proc R Soc Lond [B] 1984;221:411–436. doi: 10.1098/rspb.1984.0042. [DOI] [PubMed] [Google Scholar]
- 44.Zhou Q, Godwin DW, Bickford ME, Sherman SM, Adams PR. Relay cells and local GABAergic cells contribute to responses mediated by metabotropic glutamate receptors in cat LGN. Soc Neurosci Abstr. 1994;20:133. [Google Scholar]