

Abstract
Voltammetry was used to monitor dopamine (DA) transmission in nucleus accumbens (NAcc) of rats lever-pressing for food. Under standard conditions, animals responded on a fixed ratio 1 (FR1) schedule for 0.2 ml of milk delivered over 30 sec; milk delivery was paired with a 30 sec cue light. Consumption of the initial few milk rewards of the session caused DA signal increases. These initial signal increases were typical of the first and, at times, the second test days. On subsequent days, the most pronounced initial signal increases coincided with presentation of conditioned stimuli that marked the start of the session. Biphasic changes in DA signal that were time-locked to each reinforced lever-press were also observed; responses were preceded by increases and were followed, during milk consumption, by decreases in DA signal. At the end of milk delivery, the signal increased again in apparent anticipation of the next lever-press. Delaying milk delivery caused a corresponding delay in DA signal decreases, and the amount of time signals remained depressed was bound by the duration of milk consumption. Greater decreases in DA signal were observed when the rate of milk delivery was doubled or tripled, and such increases in reward value were associated with more pronounced signal increases during the period that preceded each lever-press. In contrast, DA signal increases were seen when milk was delivered at half the usual rate or was withheld altogether or when animals were denied access to the lever. Under partial reinforcement conditions, reinforced lever-presses were preceded by more pronounced signal increases and decreases of comparable magnitude accompanied milk consumption. These results suggest that meso-NAcc DA neurons are activated primarily in response to the incentive rather than to the reinforcing properties of rewards.
Keywords: voltammetry, mesolimbic dopamine, feeding behavior, instrumental conditioning, chronoamperometry, incentive motivation, reward
Under the appropriate conditions, food can serve as a reward to reinforce operant responses and other learned associations. The dopamine (DA) projection from the ventral tegmental area (VTA) to nucleus accumbens (NAcc) is thought to be an important link in the neuronal circuitry that mediates the reinforcing effect of food and other rewards, including many drugs abused by humans. Evidence derived from behavioral studies indicates that increased DA transmission in NAcc, at some point, is necessary to generate behavioral responses to rewards. Exactly what causes this DA system to become more active is less clear. Increased NAcc DA transmission may be responsible for the behavioral activation elicited by the stimulus properties of food (e.g., sight and smell) and other distal cues that become associated with food. Alternatively, it may be that NAcc DA transmission increases in response to such positive, behavior-reinforcing outcomes as consuming earned food. Although rewards can both incite and reinforce behavior, it is not clear which of these effects reflect increased DA transmission in NAcc.
Although several studies have reported that feeding behavior is associated with elevated DA levels in NAcc (Heffner et al., 1980;Hernandez and Hoebel, 1988; Radhakishun et al., 1988; Yoshida et al., 1992), evidence from various other sources suggests that such increases in NAcc DA transmission do not occur as a consequence of food consumption (Blackburn et al., 1986, 1989, 1992; Chance et al., 1987;Weatherford et al., 1991; McCullough and Salamone, 1992; Elbaz et al., 1993; McCullough et al., 1993; Phillips et al., 1993; Salamone et al., 1994). This conclusion also emerged from a recent electrochemical study in which we monitored DA levels in NAcc of rats lever-pressing for a food reward (Kiyatkin and Gratton, 1994). The results of this study suggested that NAcc DA transmission increases primarily in anticipation of earning food and that the immediate consequence of receiving the food reward is a transient suppression of this increase. These findings are opposite to an assumption implicit to much of the current thinking on meso-NAcc DA function, that is, increased DA transmission is a central correlate of the behavioral reinforcing action of rewards (Wise et al., 1978; Wise, 1982; Koob, 1992). The biphasic, time-locked changes in NAcc DA transmission suggested by our data, although unexpected, are nonetheless congruent with electrophysiological evidence that similar changes in VTA DA cell activity are associated with food reinforcement (Schultz, 1986; Nishino et al., 1987; Romo and Schultz, 1990; Schultz and Romo, 1990; Ljungberg et al., 1992; Schultz et al., 1993). The present study was designed to test further the hypothesis that the DA projection to NAcc mediates the behavioral reinforcing effect of food. We used voltammetry and monoamine-selective probes to characterize in greater detail how NAcc DA transmission changes in relation to lever-presses reinforced by controlled presentations of a condensed milk reward. Specifically, we investigated how the apparent suppression of NAcc DA transmission seen during food consumption is affected by changes in the (1) rate of milk delivery, (2) duration of milk presentation, (3) temporal contiguity between the operant response and milk presentation, and (4) the reinforcement schedule.
MATERIALS AND METHODS
Animals. Male Long–Evans rats (Charles River, St-Constant, Québec, Canada) weighing 300–400 gm at the time of surgery were used. Animals were housed singly on a 12 hr reversed light/dark cycle (lights on from 8 P.M. to 8 A.M.) with water freely available. Food was restricted to 18 gm/d presented in the home cage immediately after each test session. The animals’ weights remained stable during the course of the study; average weight loss was <10%. All of the animals had been trained to lever-press on a fixed ratio 1 (FR1) schedule for a 0.05 ml meal of condensed milk (Eaglebrand; diluted 1:4 with water) presented by a liquid dispenser (Lafayette). Animals were trained during two to three daily 50 min sessions in an environment different from that used to perform electrochemical recordings.
Surgery. Animals were pretreated with atropine sulfate (0.3 mg/kg, s.c.) and then implanted under sodium pentobarbital anesthesia (60 mg/kg, i.p.) with a voltammetric electrode aimed at the NAcc. The flat skull coordinates for the electrode were as follows: 1.6 mm anterior to bregma, 1.6 mm lateral to the midline, and 7.2 mm ventral to the surface of the cortex. A Ag/AgCl reference electrode and a stainless steel ground electrode were implanted in contralateral and ipsilateral parietal cortex, respectively. Pin connectors soldered to the electrochemical, reference, and ground electrodes were inserted into a miniature plastic strip connector secured with acrylic dental cement to five stainless steel screws threaded into the cranium. All procedures were performed in accordance with the Canadian Council on Animal Care Guidelines and the Society for Neuroscience Policy on the Use of Animals in Research.
Electrochemical probes. Each electrochemical probe consisted of three 30-μm-diameter carbon fibers (Avco Specialty Materials, Lowell, MA) that extended 50–100 μm beyond the tip of a pulled glass capillary. The carbon fiber bundle was fixed with a drop of Epoxylite, and the exposed tip was repeatedly coated with Nafion (Aldrich, Milwaukee, WI), a perfluoro ionomer that promotes the exchange of cations, such as DA, and impedes that of anions, notably ascorbic acid (AA) and the DA metabolite dihydroxyphenylacetic acid (DOPAC) (Gerhardt et al., 1984; Capella et al., 1990). Electrodes were calibrated immediately before implantation to determine their sensitivity to DA and their selectivity for DA against AA. Calibrations were performed in 0.1 m PBS, pH 7.4, containing 250 μm AA. Only electrodes exhibiting a DA-to-AA selectivity ratio of at least 1000:1 (range 3100:1 to 5700:1) and a linear response (r > 0.997) to increasing concentrations of DA were used. The average DA detection threshold for the electrodes used in the present study was 17.13 nm with a 2:1 signal-to-noise ratio.
Electrochemical measurements. Electrochemical recordings were performed using a computer-controlled, high-speed chronoamperometric apparatus (Medical Systems Corp., Greenvale, NY). An oxidative potential of +0.55 V (with respect to the reference electrode) was applied to the electrode for 100 msec at a rate of 5 Hz. The amplitude of the resulting oxidation current was digitized and integrated over the last 80 msec of each pulse. Every 10 digitized current measures were automatically averaged and converted into equivalent values of nanomolar DA concentration using the in vitro calibration factor before being graphically displayed on a video monitor at 2 sec intervals. The reduction current generated when the potential was returned to resting level (0.0 V for 100 msec) was digitized and averaged in the same manner and served as an index to identify the main electroactive species contributing to changes in oxidation current. With Nafion-coated electrodes and a sampling rate of 5 Hz, the magnitude of the reduction current flow elicited by an increase in DA concentration is typically 60–80% of the corresponding increase in oxidation current (red:ox = 0.6–0.8). In comparison, the oxidation of AA is virtually irreversible (red:ox = 0), whereas that of DOPAC is almost entirely reversible (red:ox = 0.9–1.0); the reduction-to-oxidation ratios for NA and 5-HT are 0.4–0.5 and 0.1–0.3, respectively. The mean reduction-to-oxidation ratio for the electrodes used in the present study was 0.68 (range 0.59–0.83). Extensive discussions concerning the interpretation ofin vivo voltammetry data have been published previously (Mitchell and Gratton, 1991, 1992; Doherty and Gratton, 1992, 1996;Kiyatkin et al., 1993; Gratton and Wise, 1994; Kiyatkin and Gratton, 1994; Noel and Gratton, 1995; Banks and Gratton, 1995).
Apparatus and procedure. The recording chamber consisted of a wooden box with a glass facade. A lever connected to a microswitch protruded from one of the walls, 5 cm above the floor of the chamber. During testing, depression of the lever would trigger delivery of the condensed milk solution via a spout made of 18-gauge stainless steel tubing. The spout protruded 1 cm from the chamber wall, 5 cm above the floor, and 6 cm from the lever and was connected by a length of polyethylene tubing to a syringe pump (Razel) equipped with a digital flow rate control. The syringe pump was connected to a gated digital timer that allowed temporal parameters to be varied (e.g., duration of delivery). A 60 W light inside the recording chamber was illuminated when the syringe pump was activated.
Electrochemical recordings started 3 d after surgery; animals were allowed to acclimatize to the testing environment during the intervening days. Immediately before a recording session, the in vitro calibration factor for the animal’s electrode—the slope of the function relating increases in oxidation current to increases in DA concentration—was entered in the data acquisition software. This allowed on-line conversion of an increase in oxidation current to a value equivalent to the nanomolar change in DA concentration that was required to produce an equal signal increase in vitro. Each animal was placed in the recording chamber and connected to the chronoamperometric instrument by a shielded cable and a low-impedance commutator. To minimize electrical interference, the signal was routed through a low-current bias preamplifier configured as a current-to-voltage converter (gain = 1 × 10⁸) that could be connected directly into the animal’s head assembly. The electrochemical signal was allowed to stabilize for 30–60 min, during which access to the lever was blocked by a glass jar.
Once the signal had stabilized, the syringe pump was loaded with a fresh supply of condensed milk. The start of the session was then signaled by illuminating the chamber light for 30 sec, after which the spout was inserted into the chamber and the glass jar covering the lever was removed. Under the standard condition, each lever-press resulted in the delivery of 0.2 ml of condensed milk over 30 sec (flow rate 7 μl/sec); lever-presses during the period of milk delivery had no programmed consequences. Each reinforced lever-press also caused the chamber light to be illuminated concurrently with the period of milk delivery. At the end of the session, the glass jar was replaced over the lever, but recording continued until the electrochemical signal had again stabilized.
Animals were tested on consecutive daily 60–90 min sessions, during which the pattern of electrochemical signal changes produced by one of four sets of experimental conditions was examined.
Delay of reinforcement. The period of milk delivery after each lever-press was delayed by 20 or 30 sec; lever-presses during the delay period had no programmed consequences. Animals were tested for an entire session first under the 20 sec and then under the 30 sec delay condition.
Magnitude of reinforcement. The total volume of milk delivered during each 30 sec reward period was halved (0.1 ml), doubled (0.4 ml), or tripled (0.6 ml) by varying the flow rate (3.5, 14, or 21 μl/sec, respectively). Animals were tested also under a no-reward (0 ml) condition for which lever-presses had no programmed consequences; milk delivery was reinstated after 90–120 sec to avoid response extinction. Animals were allowed to lever-press 10–20 times under each randomly presented condition.
Duration of reinforcement. Keeping the flow rate constant at 7 μl/sec, the total volume of milk delivered was halved, doubled, or tripled by decreasing or increasing the duration of the reward period to 15, 60, or 90 sec, respectively. The duration of the light cue was equal to that of milk delivery. The animals were allowed 10–20 responses on the lever under each condition before changing to a new, randomly chosen duration.
Reinforcement schedule. The response requirement for the standard reward was increased from an FR1 to one of three schedules: FR3, FR5, or FR10. Depending on how quickly they adapted to the new schedule, animals were allowed 10–40 reinforced responses under each new schedule, presented in random order.
Beginning on Day 1, one group of animals (n = 7) was tested under the standard condition for the first 10–15 lever-presses of each session before changing to one of the above four sets of experimental conditions. To investigate day-to-day changes in electrochemical signal, a second group of animals (n = 8) was allowed to lever-press under the standard condition throughout each of the first three test sessions (Days 1, 2, and 3). On the fourth and subsequent days, these animals were then tested under the standard condition for the first 10–15 lever-presses of the session before changing conditions. Because the changes in electrochemical signal were generally of low amplitude, the number of conditions that could be tested in any given animal depended entirely on obtaining noise-free recordings. Hence, 5 animals were tested under all four sets of experimental conditions. Of the remaining 10 animals, 5 were tested under at least three sets of conditions and 4 were tested under only two sets. Data were obtained from a comparable number of animals for each set of conditions: delay of reinforcement, n = 6; magnitude of reinforcement, n = 9; duration of reinforcement, n = 7; reinforcement schedule,n = 7.
After completion of the experiment, the animals were deeply anesthetized with sodium pentobarbital (70 mg/kg, i.p.) and transcardially perfused with PBS followed by 10% formalin. Electrode placements were confirmed from 20 μm coronal sections stained with formol–thionine.
Data format. Because the rate of responding varied among animals and as a function of the test condition, averaged data are presented as changes in electrochemical signal (nanomolar DA equivalent) relative to the moment of the lever-press (Time 0). Because the record at Time 0 was the point of comparison for changes in electrochemical signal that preceded and followed the lever-press, it was given a value of 0 (see Fig. 1). A value of 0 nm, therefore, does not correspond to the absolute concentration of extracellular DA. Unlike microdialysis, voltammetry does not provide measures of absolute changes in DA concentration. Rather, the electrochemical data reflect changes in DA concentration elicited by a defined event or stimulus; hence, negative and positive values indicate DA levels that were lower and higher, respectively, than those at moment of the lever-press.
Fig. 1.

A, Example of changes in electrochemical signal recorded in NAcc of one animal lever-pressing for the standard volume of milk reward (0.2 ml). Arrowsmark the time of each lever-press, and length of horizontal bars corresponds to the 30 sec period of milk delivery that followed. Note the decreases in signals during milk consumption and rapid increases after termination of milk delivery before each subsequent lever-press. B, Average of signal changes shown in A.
Data analysis. Only data from animals with histologically confirmed electrode placements in NAcc were analyzed. Electrochemical records with movement-related artifacts were excluded from the data analysis. Data were also excluded when animals either ignored or did not consume all of the earned milk reward as it emerged from the spout; records during which animals consumed any milk that had accumulated in the small spillage cup under the spout were also disregarded.
A one-way ANOVA was used to test the significance of signal changes observed under different conditions. For most of the conditions, the signal level recorded during the final 2 sec of the milk delivery period was the point of comparison. In some cases (e.g., duration and magnitude of reinforcement), changes in signal recorded after 15 sec of milk delivery (8th data point) were also compared. When indicated, apost hoc analysis was performed using Newman–Keuls test for multiple comparisons.
RESULTS
Within- and between-session changes
Eight animals were allowed to lever-press under the standard condition throughout the first 3 d of testing. All of these animals learned to lever-press reliably by the second test day; the average response rate on the first, second, and third test session was 10.6, 70.5, and 68.2 responses/hr, respectively. In general, small changes in electrochemical signal that were time-locked to each lever-press and to the 30 sec delivery of milk that followed were observed throughout the 3 d of testing. However, there were both within- and between-session differences in the magnitude and the direction of the electrochemical responses associated with each lever-press. The data presented in Figure 2 are averaged changes in signal associated with the first and last three to four lever-presses of test days 1, 2, and 3. As can be seen, the initial few lever-presses of each session were followed by increases in signal. The most robust of these increases were observed on Day 1. Signals would start to rise 5–10 sec into the period of milk consumption and, after termination of milk delivery, would either start decreasing slowly or continue to increase at a slower rate as the animals continued to lick the spout briefly before returning to the lever. In those animals that responded at regular intervals, the initial few bouts of milk consumption resulted in a stepwise elevation in the electrochemical signal. As the session progressed, however, increments in signal gradually became smaller and tended to occur later during milk delivery until eventually little if any signal increase could be observed. If anything, decreases in signal were more typical of the changes associated with milk consumption during the latter period of the session. When increases were seen, these were small in comparison to those observed at the beginning of the session and usually occurredafter the animal had finished consuming milk.
Fig. 2.

Within- and between-session differences in electrochemical signal changes. Data are averaged records (n = 8 animals) of the first (START) and last (END) 3–4 responses of each of the first 3 test days. Each lever-press (vertical line) was followed immediately by 0.2 ml of condensed milk delivered at a constant rate over 30 sec (horizontal bar). For all 3 days, signal levels recorded during the final 2 sec of milk delivery were significantly lower at the end of the session compared to the start of the session: DAY 1, F(1,40) = 4.3881,p < 0.05; DAY 2,F(1,62) = 4.1039, p < 0.05; DAY 3, F(1,61) = 6.9628, p < 0.01.
Similar within-session differences in the electrochemical responses to each lever-press were observed on the second and third test days. However, in comparison to Day 1, fewer of the initial bouts of milk consumption elicited signal increases, and these were generally smaller and rose more slowly. Lever-presses that were followed by signal decreases also tended to be observed earlier in the session and, by the end of the third test day, these were clearly more pronounced than at any time during the previous two test days. At the end of milk delivery, these decreases were followed by signal increases of comparable magnitude that peaked at the moment or slightly after the animal pressed the lever again.
Conditioned changes
After as little a 1 d of testing, increases in signal were seen at the beginning of the session, before the animals were given access to the lever (Fig. 3). Such increases in signal were observed in all animals tested, although the magnitude varied from one day to another and from one animal to another. Although increases in signal coincided with the 30 sec light cue that marked the start of the session, increases were also observed as early as 5 minbefore presentation of the light cue. During this period, the syringe pump was loaded with a fresh supply of condensed milk and the sounds associated with these preparations often caused animals to lick the wall area where the spout would be located and to paw at the jar covering the lever. These behaviors usually intensified and signal increases accelerated during presentation of the light cue. Thus, on the second and subsequent test days, the single largest increase in DA signal would often occur during the few minutes thatpreceded the start of the session. In contrast, the initial signal increases seen on Day 1 coincided with consumption of the first earned milk reward of the session.
Fig. 3.

Evidence of conditioned increases in electrochemical signal was observed at the beginning of the second and subsequent test days (Days 2→). At the start of each session (open arrow), access to the lever (filled arrow) was signaled by presenting alone a 30 sec light cue (dashed horizontal bar) that would be paired with delivery of each earned milk reward. Signal levels recorded during the final 2 sec of light cue presentation were significantly higher (F(1,123) = 9.1872,p < 0.01) than those recorded at 2 min (−120 sec) before the start of the second and subsequent test sessions. No such increase in signal was observed when animals were inexperienced (Day 1); the first signal increases of this session were associated with consumption of the initial few earned milk rewards.
Delay of reinforcement
Figure 4 presents the average of 88 and 57 records obtained under the 20 and 30 sec delay conditions, respectively. As can be seen, relatively small, biphasic changes in DA signal accompanied responses under the standard condition (n = 516 records); in general, lever-presses were followed first by small transient increases in signal and then by gradual decreases starting 5–10 sec into the period of milk delivery. Under delayed reinforcement conditions, signals would also start increasing after the lever-press but would remain elevated during the delay period as the animals alternated between licking the spout and pressing the lever. Signals would start decreasing only when the animals eventually received and started to consume the milk reward.
Fig. 4.
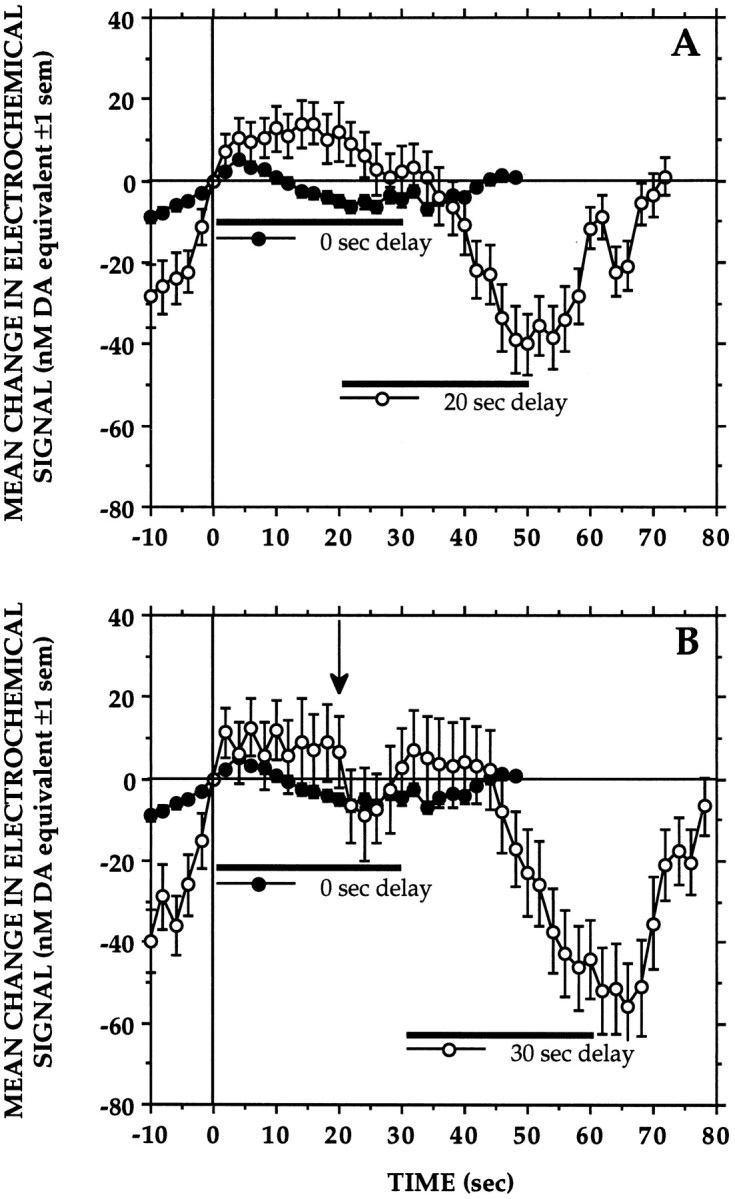
Delaying milk delivery by 20 sec (A) or 30 sec (B) resulted in a corresponding delay in the onset of signal decreases associated with milk consumption. The pattern of signal changes recorded in these animals under the standard condition (0 sec delay) is also shown for comparison. Signal levels recorded during the final 2 sec of milk delivery differed significantly between the delay conditions (F(2,658) = 40.0260, p< 0.01); at this time point, signal decreases recorded under the 20 and 30 sec delay conditions did not differ, but both were significantly greater (Newman–Keuls, p < 0.01) than those seen under the 0 sec delay condition. The fact that animals were tested first under the 20 sec delay condition may account for the transient signal decrease ∼20 sec into the 30 sec delay period (arrow in B).
That the decreases in signal were time-locked to the period of milk delivery is clearly seen under the 20 sec delay condition. Whereas signals decreased steadily during milk consumption, they started to increase within 10 sec after the end of milk delivery and continued to rise until the animals received the next milk reward. A similar pattern was seen when earned milk presentations were delayed by 30 sec, with the exception that signal decreases were observed not only when milk was delivered but apparently also when milk delivery was expected. Relatively small transient decreases in signal were frequently observed approximately 20 sec (Fig. 4, arrow) after the initial few lever-presses under the 30 sec delay condition. Since the 20 sec delay condition was tested first, animals may have learned to expect milk delivery at that time. More pronounced signal decreases were observed when the animals eventually received and consumed the milk reward. Although the signals tended to start decreasing later into the period of milk delivery, the magnitude of the signal decreases and of the subsequent increases was comparable to that observed under the 20 sec delay condition.
Magnitude of reinforcement
Figure 5A presents averaged records obtained when the usual rate of milk delivery (0.2 ml/30 sec;n = 602) was halved (0.1 ml/30 sec; n = 322), doubled (0.4 ml/30 sec; n = 143), or tripled (0.6 ml/30 sec; n = 337). Also shown are the data obtained when earned milk was withheld (0 ml; n = 246). As can be seen, doubling or tripling the rate of milk delivery resulted in more rapid and pronounced signal decreases. Signals decreased at almost identical rates whether the animals received milk at 2 or 3 times the usual rate. Signals would often continue to decrease after delivery of a triple volume of milk before they started to increase; because of the back-pressure at this high flow rate, milk would continue to emerge from the spout for a few seconds after the pump was turned off. A similar pattern was observed when animals received the milk at twice the usual rate, with the difference that signals tended to start increasing sooner after termination of milk delivery. Opposite changes were observed when the rate of milk delivery was reduced by half; after the lever-press, signals would first increase to peak ∼10-15 sec into the delivery period before gradually decreasing to levels close to those seen at the time of the lever-press. Withholding the milk reward also resulted in signal increases; as the animals alternated between pressing the lever and exploring the spout, signals would continue to increase slowly until milk delivery was eventually reinstated.
Fig. 5.

A, Mean changes in electrochemical signal recorded when the standard rate of milk delivery (0.2 ml/30 sec) was tripled (0.6 ml/30 sec), doubled (0.4 ml/30 sec), halved (0.1 ml/30 sec), or withheld (0.0 ml). Flow rate significantly affected signal levels recorded at 15 sec (F(4,1645) = 16.6162, p < 0.01) and 30 sec (F(4,1645) = 27.6817, p< 0.01) of the milk delivery period. At these two time points, signal levels under the 0.4 and 0.6 ml conditions did not differ, but both were significantly lower than those seen at 0, 0.1, and 0.2 ml (p < 0.01), whereas levels under the 0 ml condition were significantly higher than those at 0.2, 0.4, and 0.6 ml (p < 0.01). B, The magnitude of signal decreases associated with milk consumption did not depend on the rate of milk delivery per se but, rather, on the rate of milk delivery relative to what the animals were trained to expect. The pronounced decrease in signal seen when milk delivered at 0.6 ml/30 sec was consumed by animals trained to expect the standard reward (0.2 ml/30 sec) was significantly attenuated (F(1,393) = 12.1373, p< 0.01) in animals trained to expect milk at 0.6 ml/30 sec.
Figure 5B presents data from a separate group of three animals that had been initially trained for 3–4 d to lever-press for milk delivered at a rate of 0.6 ml/30 sec (n = 58), that is, 3 times the delivery rate normally used during training. As can be seen, milk consumption in these animals was associated with significantly smaller decreases in DA signal than were seen in animals that had been initially trained on the standard reward (0.2 ml/30 sec).
Duration of reinforcement
Figure 6 presents averaged records obtained from seven animals when the usual volume of milk (0.2 ml; n= 48 records) was halved (0.1 ml; n = 90), doubled (0.4 ml; n = 63), or tripled (0.6 ml; n = 51) by decreasing or increasing the duration of the standard period of milk delivery (30 sec). As can be seen, signals decreased at almost identical rates regardless of the duration of milk delivery. Where signal decreases differed with each condition was at the end of the period of milk delivery. Whereas signals would start increasing within 6–8 sec after termination of the standard 30 sec milk delivery, they would continue to decrease slowly throughout the two longer periods of milk delivery returning, often abruptly, to levels close to or slightly above those at the time of the lever-press. Similar decreases in signals were observed when milk consumption was limited to 15 sec; unexpected termination of milk delivery caused a rapid return of signals to levels close to those at the time of the lever-press.
Fig. 6.

Mean changes in electrochemical signal recorded when the standard volume of milk (0.2 ml) was halved (0.1 ml), doubled (0.4 ml), or tripled (0.6 ml) by decreasing the usual period of delivery (30 sec) to 15 sec (A) or increasing it to 60 sec (B) or 90 sec (C), respectively. Signals decreased at the same rate under the four conditions; signal levels recorded at 15 sec of the delivery periods did not differ significantly (F(3,251) = 0.9136,p = 0.4349). By the end of milk delivery, however, signals had decreased to significantly different levels (F(3,248) = 2.8234, p < 0.05); signal levels at 90 sec were lower than at 15, 30, and 60 sec (p < 0.01), and levels at 15 sec were higher than at 30 and 60 sec (p < 0.05).
Reinforcement schedule
Figure 7 shows mean changes in electrochemical signal recorded when animals were reinforced either continuously (FR1,n = 516) or only after every third (FR3,n = 69), fifth (FR5, n = 191), or 10th (FR10, n = 259) lever-press. Imposing greater response requirements for each reward augmented the amplitudes of the signal decreases associated with milk consumption and of the increases in signal that preceded delivery of earned milk. After changing to a partial reinforcement schedule, animals would typically alternate between licking the spout and responding on the lever, and this period was associated with a gradual increase in electrochemical signal qualitatively similar to that observed when the expected reward was withheld (see Fig. 5A). Signals would increase as long as the animals actively explored the spout and responded on the lever, peaking within 2–3 sec of the reinforced lever-press before starting to decrease after milk delivery. Thus, the amplitude of the signal decrease seen during milk consumption was proportional to the signal increase associated with earning the milk reward.
Fig. 7.

Mean changes in electrochemical signal recorded when the response requirement for each 0.2 ml milk reward was increased from an FR1 schedule to an FR3, FR5, or FR10 schedule. There was a significant effect of reinforcement schedule on the amplitude of signal decreases recorded at the end of milk delivery (F(3,1031) = 32.9518, p< 0.01). Signal decreases seen under the FR5 and FR10 schedules did not differ, but both were significantly greater than those seen under either the FR3 or the FR1 schedules (p < 0.01); the differences between the two less demanding schedules failed to reach statistical significance.
End of session
The end of each session was signaled by placing a glass jar over the lever. Blocking access to the lever was followed within 20–30 sec by marked and relatively long-lasting (3–4 min) signal increases (Fig.8). These elevations in signal were associated with increased motor activity as the animals attempted to dislodge the jar.
Fig. 8.

Mean increase in electrochemical signal recorded at the end of each session when access to milk was denied by placing a glass jar over the lever.
Histology
Figure 9 is a reconstruction of the electrode placements in the animals used in the present study. Using the atlas ofPaxinos and Watson (1986) as a reference, tissue damage produced by the electrode was found in four animals to extend into the NAcc shell. In the remaining animals, the deepest tissue damage was assessed to be within the boundaries of the NAcc core either medial or ventral to the anterior commissure. When allowances are made for estimation error, the electrode of at least one of these animals may have extended into the NAcc shell. There was no obvious difference, however, between DA signal changes recorded from animals with NAcc core and shell electrodes.
Fig. 9.

Histological reconstruction of electrode placements in NAcc. The filled circles indicate the deepest tissue damage found during histological analysis. The length of the vertical bar extending from each symbol corresponds to the average error (∼150 μm) in estimating the point of deepest electrode penetration. NAcc-S, Nucleus accumbens-shell;NAcc-C, nucleus accumbens-core (Paxinos and Watson, 1986).
DISCUSSION
In general, the present results suggest that the DA projection to NAcc is not activated so much by gustatory stimuli as it is by cues that signal the availability of food. Similar conclusions have emerged from other studies involving different approaches (Blackburn et al., 1992; McCullough and Salamone, 1992; Phillips et al., 1993; Salamone et al., 1994). The present findings are congruent also with those of our previous studies (Kiyatkin et al., 1993; Gratton and Wise, 1994;Kiyatkin and Gratton, 1994) and with evidence from other sources indicating that increased DA cell activity is a correlate of reward expectancy (Nishino et al., 1987; Schultz and Romo, 1990; Ljungberg et al., 1992; Schultz et al., 1993). Furthermore, the present results indicate that the main consequence of food consumption is a suppression of such anticipatory increases in NAcc DA transmission. This finding, more than any other, is at odds with the idea that increased DA transmission in NAcc is a central correlate of the behavioral reinforcing action of rewards (Wise et al., 1978; Wise, 1982; Koob, 1992). Insofar as the period of milk consumption is the critical requirement for positive reinforcement, it is a widely held assumption that this period would also be associated with increased DA release in NAcc. This assumption appears to be falsified by the present data.
Reward-dependent changes
The decreases in NAcc DA transmission suggested by the present data were closely related to, if not a direct consequence of, consuming the food reward. Delaying delivery of earned milk caused a corresponding delay in the onset of DA signal decreases, and the duration of these decreases was bound by the period of milk consumption. Orderly changes in DA signals were seen also as a result of varying the rate of milk delivery. Interestingly, varying theduration or the rate of milk delivery produced different effects on DA signals even when the volume of milk delivered in each condition was identical. Hence, whereas increasing the rate of delivery accelerated DA signal decreases associated with milk consumption, transient increases in DA signal were seen when delivery rate was reduced. In contrast, DA signals decreased at identical rates regardless of the duration of milk delivery. Because the rate of delivery under this condition was constant, reward value was determined solely by the time available to consume milk; thus, signal decreases would not be expected to differ because, at the onset of delivery, animals had no indication of the total amount of milk they would receive. This was not the case when the rate of delivery was varied. Here the rate at which milk emerged from the spout would have been a reliable indicator of the total volume of milk that would be delivered. Thus, animals may have learned to assess changes in reward value from the amount of milk received during the initial few seconds of the delivery period. More important perhaps is that DA signal increases were seen when the standard delivery rate was halved. This finding plus the fact that DA signals also increased when earned milk was withheld or when access to the lever was blocked is incompatible with the notion that NAcc DA transmission increases as a function of increasing reward magnitude. Rather, it would appear that changes in NAcc DA transmission reflect, at least in part, discrepancies between the rewards animals expect and the rewards they ultimately receive.
Contrast effects
The magnitude of DA signal decreases associated with consumption of the standard reward depended on the parameter being manipulated during the session. When rate of delivery was varied, small increases followed by comparable decreases in signal were observed as animals consumed the standard reward. The same reward, however, elicited abrupt signal decreases when the duration was varied. A negative contrast effect may explain why different changes in DA signal were elicited by seemingly identical rewards. Such an effect would occur as a result of a reduction, or negative shift, in the value of the expected reward; that is, the contrast between two rewards of different values, in itself, diminishes the effectiveness of the lesser reward. A contrast effect would not be expected to influence the DA response to the standard reward when duration of milk delivery was varied, because animals had no means of determining whether the value of the reward they were receiving was greater or lesser than that of rewards received on previous trials. This would not have been the case when the rate of delivery was varied. Here, animals would have been able to assess the value of the milk reward they were consuming relative to the value of previous milk rewards. That changes in NAcc DA transmission reflect changes in relative reward value is suggested also by the fact that only minor changes in DA signal accompanied consumption of milk delivered at 3 times the standard rate when this was the reward animals had been trained to expect. The important point here is that these animals received milk at the same rate that caused pronounced signal decreases in animals that had been trained to expect the standard reward.
Experience-dependent changes
The present data indicate that the ability of food reward to activate NAcc DA transmission decreases as a function of training. A similar conclusion has been suggested on the basis of electrophysiological data showing that activation of DA cell firing associated with consumption of earned food disappears progressively as a function of the animals’ training (Ljungberg et al., 1992). These authors have also found evidence indicating that, with training, DA cells are increasingly activated by stimuli that are predictive of food presentation (Ljungberg et al., 1992; Schultz et al., 1993). Consistent with this, the present data suggest that increases in NAcc DA elicited on Day 1 by the initial few bouts of milk consumption, rather than becoming smaller on subsequent days, were being shifted earlier in time in response to stimuli that signaled the start of the session.
Reinforcement schedule
The changes in NAcc DA transmission suggested by the present data were influenced also by the reinforcement schedule, that is, DA signal increases that preceded each reinforced lever-press and the signal decreases associated with the period of milk consumption that followed became more pronounced as a function of increasing response demands. That more pronounced increases in DA signals resulted from imposing a more demanding schedule would be expected because withholding earned milk also resulted in DA signal increases. This finding is in general agreement with electrophysiological data showing that responding on an FR20 or FR30 schedule causes ventral tegmental DA cells to increase their firing rate to the point of entering a burst firing mode (Nishino et al., 1987). DA release increases monotonically with increasing cell firing, but will increase at faster rates as neurons start firing in bursts (Gonon and Buda, 1985). These findings suggest that increased burst firing in meso-NAcc DA cells is responsible for the pronounced DA signal increases that accompanied unreinforced responses.
Milk consumption under a partial reinforcement schedule resulted in DA signal decreases, the amplitude of which closely matched that of signal increases that preceded reinforced responses. This finding suggests that DA signal decreases associated with milk consumption depend not only on the magnitude of the reward but also on the amount of work required to earn it. Because reward magnitude was held constant (0.2 ml/30 sec), milk consumption would have been associated with comparable signal decreases regardless of the reinforcement schedule had reward value been the only determining factor. This was clearly not the case here. Although open to many interpretations, perhaps the simplest explanation for these data would again be that of a contrast effect. In this case, the magnitude of the signal decrease would reflect the positive contrast between responses that went unrewarded and milk consumption that followed the reinforced response. The implicit suggestion here is that the magnitude of the positive shift in reward value was proportional to the number of unreinforced responses.
Conclusions
The findings reported here add to a body of evidence indicating that the DA projection to NAcc is responsible for mediating the behavior-activating effects of rewards and of other biologically relevant conditions, including a variety of aversive and stressful stimuli (Abercrombie et al., 1989; Doherty and Gratton, 1992, 1996). Although the present data indicate that food reinforcement can activate the DA projection to NAcc, this effect was found to be transient. One working hypothesis suggested by the present findings is that rewards produce their behavior-reinforcing effects as a consequence of suppressing activation of meso-NAcc DA neurons by conditioned incentives. Exactly what mechanism would be responsible for exerting this inhibitory influence is open to speculation. The medial prefrontal cortex (PFC), however, is one possibility made increasingly attractive by evidence that meso-PFC DA neurons act indirectly, via corticofugal inputs to VTA and NAcc, to dampen concurrent increases in NAcc DA transmission (for review, see by Deutch, 1992; Grace, 1993; Gratton, 1996).
Footnotes
This study was made possible by grants from the Medical Research Council (MRC) and by an MRC studentship to N.R.R. and a Fonds de la Recherche en Santé du Québec Career Scientist Award to A.G.
Correspondence should be addressed to Alain Gratton, Douglas Hospital Research Centre, 6875 LaSalle Boulevard, Verdun, Québec, Canada H4H 1R3.
REFERENCES
- 1.Abercrombie ED, Keefe KA, DiFrischia DS, Zigmond MJ. Differential effect of stress on in vivo dopamine release in striatum, nucleus accumbens, and medial prefrontal cortex. J Neurochem. 1989;52:1655–1658. doi: 10.1111/j.1471-4159.1989.tb09224.x. [DOI] [PubMed] [Google Scholar]
- 2.Banks KE, Gratton A. Possible involvement of medial prefrontal cortex in amphetamine-induced sensitization of mesolimbic dopamine function. Eur J Pharmacol. 1995;282:157–167. doi: 10.1016/0014-2999(95)00306-6. [DOI] [PubMed] [Google Scholar]
- 3.Blackburn JR, Phillips AG, Jakubovic A, Fibiger HC. Increased dopamine metabolism in the nucleus accumbens and striatum following consumption of a nutritive meal but not a palatable non-nutritive saccharin solution. Pharmacol Biochem Behav. 1986;25:1095–1100. doi: 10.1016/0091-3057(86)90091-2. [DOI] [PubMed] [Google Scholar]
- 4.Blackburn JR, Phillips AG, Jakubovic A, Fibiger HC. Dopamine and preparatory behavior. II. A neurochemical analysis. Behav Neurosci. 1989;103:15–23. doi: 10.1037//0735-7044.103.1.15. [DOI] [PubMed] [Google Scholar]
- 5.Blackburn JR, Pfaus JC, Phillips AG. Dopamine functions in appetitive and defensive behaviors. Prog Neurobiol. 1992;39:247–279. doi: 10.1016/0301-0082(92)90018-a. [DOI] [PubMed] [Google Scholar]
- 6.Capella P, Ghasemzadeh B, Mitchell K, Adams RN. Nafion-coated carbon fiber electrodes for neurochemical studies in brain tissue. Electroanalysis. 1990;2:175–182. [Google Scholar]
- 7.Chance WT, Foley-Nelson T, Nelson JL, Fisher JE. Neurotransmitter alterations associated with feeding and satiety. Brain Res. 1987;416:228–234. doi: 10.1016/0006-8993(87)90901-2. [DOI] [PubMed] [Google Scholar]
- 8.Deutch AY. The regulation of subcortical dopamine systems by the prefrontal cortex: interactions of central dopamine systems and the pathogenesis of schizophrenia. J Neural Trans [Suppl] 1992;36:61–89. doi: 10.1007/978-3-7091-9211-5_5. [DOI] [PubMed] [Google Scholar]
- 9.Doherty MD, Gratton A. High-speed chronoamperometric measurements of mesolimbic and nigrostriatal dopamine release associated with repeated daily stress. Brain Res. 1992;586:295–302. doi: 10.1016/0006-8993(92)91639-v. [DOI] [PubMed] [Google Scholar]
- 10.Doherty MD, Gratton A. Medial prefrontal cortical D1 receptor modulation of the meso-accumbens dopamine response to stress: a electrochemical study in freely-behaving rats. Brain Res. 1996;715:86–97. doi: 10.1016/0006-8993(95)01557-4. [DOI] [PubMed] [Google Scholar]
- 11.Elbaz Z, Rochford J, Gratton A. In vivo electrochemical monitoring of conditioned stress responses in nucleus accumbens and prefrontal cortex of rat. Soc Neurosci Abstr. 1993;19:1827. [Google Scholar]
- 12.Gerhardt GA, Oke AF, Nahy G, Moghaddam B, Adams RN. Nafion-coated electrodes with high selectivity for CNS electrochemistry. Brain Res. 1984;290:390–395. doi: 10.1016/0006-8993(84)90963-6. [DOI] [PubMed] [Google Scholar]
- 13.Gonon FG, Buda MJ. Regulation of dopamine release by impulse flow and by autoreceptors as studied by in vivo voltammetry in the rat striatum. Neuroscience. 1985;14:765–774. doi: 10.1016/0306-4522(85)90141-1. [DOI] [PubMed] [Google Scholar]
- 14.Grace AA. Cortical regulation of subcortical dopamine systems and its possible relevance to schizophrenia. J Neural Trans. 1993;91:111–134. doi: 10.1007/BF01245228. [DOI] [PubMed] [Google Scholar]
- 15.Gratton A. In vivo analysis of the role of dopamine in stimulant and opiate self-administration. J Psychiatr Neurosci. 1996;21:264–279. [PMC free article] [PubMed] [Google Scholar]
- 16.Gratton A, Wise RA. Drug- and behavior-associated changes in dopamine-related electrochemical signals during intravenous cocaine self-administration in rats. J Neurosci. 1994;14:4130–4146. doi: 10.1523/JNEUROSCI.14-07-04130.1994. [DOI] [PMC free article] [PubMed] [Google Scholar]
- 17.Heffner TG, Hartman JA, Seiden LS. Feeding increases dopamine metabolism in the rat brain. Science. 1980;208:1168–1170. doi: 10.1126/science.7375926. [DOI] [PubMed] [Google Scholar]
- 18.Hernandez L, Hoebel BG. Food reward and cocaine increase extracellular dopamine in the nucleus accumbens as measured by microdialysis. Life Sci. 1988;42:1705–1712. doi: 10.1016/0024-3205(88)90036-7. [DOI] [PubMed] [Google Scholar]
- 19.Kiyatkin EA, Gratton A. Electrochemical monitoring of extracellular dopamine in nucleus accumbens of rats lever-pressing for food. Brain Res. 1994;652:225–234. doi: 10.1016/0006-8993(94)90231-3. [DOI] [PubMed] [Google Scholar]
- 20.Kiyatkin EA, Wise RA, Gratton A. Drug- and behavior-associated changes in dopamine-related electrochemical signals during intravenous heroin self-administration in rats. Synapse. 1993;14:60–72. doi: 10.1002/syn.890140109. [DOI] [PubMed] [Google Scholar]
- 21.Koob C-F. Neuronal mechanisms of drug reinforcement. Ann NY Acad Sci. 1992;654:171–191. doi: 10.1111/j.1749-6632.1992.tb25966.x. [DOI] [PubMed] [Google Scholar]
- 22.Ljungberg T, Apicella P, Schultz W. Responses of monkey dopamine neurons during learning of behavioral reactions. J Neurophysiol. 1992;67:145–163. doi: 10.1152/jn.1992.67.1.145. [DOI] [PubMed] [Google Scholar]
- 23.McCullough LD, Salamone JD. Involvement of nucleus accumbens dopamine in the motor activity induced by periodic food presentation: a microdialysis and behavioral study. Brain Res. 1992;592:29–36. doi: 10.1016/0006-8993(92)91654-w. [DOI] [PubMed] [Google Scholar]
- 24.McCullough LD, Cousins MS, Salamone JD. The role of nucleus accumbens dopamine in responding on a continuous reinforcement operant schedule: a neurochemical and behavioral study. Pharmacol Biochem Behav. 1993;46:581–586. doi: 10.1016/0091-3057(93)90547-7. [DOI] [PubMed] [Google Scholar]
- 25.Mitchell JB, Gratton A. Opioid modulation and sensitization of dopamine release elicited by sexually relevant stimuli: a high-speed chronoamperometric study in freely behaving rats. Brain Res. 1991;551:20–27. doi: 10.1016/0006-8993(91)90908-e. [DOI] [PubMed] [Google Scholar]
- 26.Mitchell JB, Gratton A. Partial dopamine depletion of the prefrontal cortex leads to enhanced mesolimbic dopamine release elicited by repeated exposure to naturally reinforcing stimuli. J Neurosci. 1992;12:3609–3618. doi: 10.1523/JNEUROSCI.12-09-03609.1992. [DOI] [PMC free article] [PubMed] [Google Scholar]
- 27.Nishino H, Ono T, Muramoto K, Fukuda M, Sasaki K. Neuronal activity in the ventral tegmental area during motivated bar press feeding in the monkey. Brain Res. 1987;413:302–313. doi: 10.1016/0006-8993(87)91021-3. [DOI] [PubMed] [Google Scholar]
- 28.Noel MB, Gratton A. Electrochemical evidence of increased dopamine transmission in prefrontal cortex and nucleus accumbens elicited by ventral tegmental μ-opioid receptor activation in freely behaving rats. Synapse. 1995;21:110–122. doi: 10.1002/syn.890210204. [DOI] [PubMed] [Google Scholar]
- 29.Paxinos G, Watson C. The rat brain in stereotaxic coordinates. Academic; New York: 1986. [DOI] [PubMed] [Google Scholar]
- 30.Phillips AG, Atkinson LJ, Blackburn JR, Blaha CD. Increased extracellular dopamine in the nucleus accumbens of the rat elicited by a conditional stimulus for food: an electrochemical study. Can J Physiol Pharmacol. 1993;71:387–393. doi: 10.1139/y93-059. [DOI] [PubMed] [Google Scholar]
- 31.Radhakishun FS, van Ree JM, Westerink BHC. Scheduled eating increases dopamine release in the nucleus accumbens of food-deprived rats as assessed with on-line brain dialysis. Neurosci Lett. 1988;85:351–356. doi: 10.1016/0304-3940(88)90591-5. [DOI] [PubMed] [Google Scholar]
- 32.Romo R, Schultz W. Dopamine neurons in the monkey midbrain: contingencies of responses to acute touch during self-initiated arm movements. J Neurophysiol. 1990;63:592–606. doi: 10.1152/jn.1990.63.3.592. [DOI] [PubMed] [Google Scholar]
- 33.Salamone JD, Cousins MS, McCullough LD, Carriero DL, Berkowitz RJ. Nucleus accumbens dopamine release increases during instrumental lever pressing for food but not free food consumption. Pharmacol Biochem Behav. 1994;49:25–31. doi: 10.1016/0091-3057(94)90452-9. [DOI] [PubMed] [Google Scholar]
- 34.Schultz W. Responses of midbrain dopamine neurons to behavioral trigger stimuli in the monkey. J Neurophysiol. 1986;56:1439–1461. doi: 10.1152/jn.1986.56.5.1439. [DOI] [PubMed] [Google Scholar]
- 35.Schultz W, Romo R. Dopamine neurons of the monkey midbrain: contingencies of responses to stimuli eliciting immediate behavioral reactions. J Neurophysiol. 1990;63:607–624. doi: 10.1152/jn.1990.63.3.607. [DOI] [PubMed] [Google Scholar]
- 36.Schultz W, Apicella P, Ljungberg T. Responses on monkey dopamine neurons to reward and conditioned stimuli during successive steps of learning a delayed response task. J Neurosci. 1993;13:900–913. doi: 10.1523/JNEUROSCI.13-03-00900.1993. [DOI] [PMC free article] [PubMed] [Google Scholar]
- 37.Weatherford SC, Greenberg D, Melville LD, Jerome C, Gibbs J, Smith GP. Failure to detect increases in brain dopamine metabolism in rats sham feeding sucrose and corn oil. Pharmacol Biochem Behav. 1991;39:1025–1028. doi: 10.1016/0091-3057(91)90070-i. [DOI] [PubMed] [Google Scholar]
- 38.Wise RA. Neuroleptics and operant behavior: the anhedonia hypothesis. Behav Brain Sci. 1982;5:39–87. [Google Scholar]
- 39.Wise RA, Spinder J, DeWit H, Gerber GJ. Neuroleptic-induced “anhedonia” in rats: pimozide blocks the reward quality of food. Science. 1978;201:262–264. doi: 10.1126/science.566469. [DOI] [PubMed] [Google Scholar]
- 40.Yoshida M, Yokoo H, Mizoguchi K, Kawahara H, Tsuda A, Nishikawa T, Tanaka M. Eating and drinking cause increased dopamine release in the nucleus accumbens and ventral tegmental area in the rat: measurement by in vivo microdialysis. Neurosci Lett. 1992;139:73–76. doi: 10.1016/0304-3940(92)90861-z. [DOI] [PubMed] [Google Scholar]