Abstract
Some of the most complex auditory neurons known are contained in the songbird forebrain nucleus HVc. These neurons are highly sensitive to auditory temporal context: they respond strongly to the bird’s own song, but respond weakly or not at all when the sequence of the song syllables is altered. It is not known whether this property arises de novo in HVc or whether it is relayed from the properties of neurons in afferent nuclei. To address this issue, we recorded from neurons in both HVc and its afferent nuclei, collectively called field L. Experimental tests were designed to determine the degree of auditory context sensitivity in field L and HVc. Tests were also performed to compare the responses to individual syllables and syllable combinations to see whether these responses could account for the response seen to the entire song.
Our results show a substantial increase in the auditory temporal context sensitivity between field L and HVc. Most field L neurons respond equally well both to normal song and to temporally manipulated versions of the same song. A few field L neurons show sensitivity to local temporal structure, such as the sequence of syllable pairs. In contrast, HVc neurons are highly dependent on the song’s local and global temporal structure. This shows that HVc neurons can integrate auditory context over periods much longer than neurons in field L and suggests that additional mechanisms are required to explain the marked sensitivity of HVc neurons to the temporal structure of the bird’s own song.
Keywords: hierarchical organization, auditory response properties, neural integration, context sensitivity, order sensitivity, song system, field L, HVc
Neurons selective for complex stimuli occur in high-order brain areas in most sensory systems, such as face-selective neurons in the macaque monkey (Gross et al., 1972;Perrett et al., 1992), neurons sensitive to combinations of pheromone components in the Manduca moth (Christensen et al., 1989), phase-amplitude combination-sensitive neurons in the electric fish Eigenmannia (Heiligenberg, 1991), auditory space-specific neurons in the barn owl (Knudsen and Konishi, 1978), harmonic-combination-sensitive neurons in the moustached bat (Suga, 1994), and song-specific neurons in songbirds (Margoliash, 1983). How the stimulus selectivities of these neurons are derived from integration of information from lower-order simpler neurons is known only in a few cases, but these successful examples show that both bottom-up and top-down approaches can lead to the elucidation of the underlying neural circuitry.
Song-specific neurons respond exclusively or preferentially to the individual bird’s own (autogenous) song (Margoliash, 1983, 1986) and are sensitive to the song’s spectral and temporal structure: some require combinations of harmonics, similar to the frequencies contained in autogenous song; others are sensitive to the temporal order of sequences of these acoustic features and can integrate auditory temporal context over several hundred milliseconds (Margoliash, 1983;Margoliash and Fortune, 1992; Lewicki and Konishi, 1995).
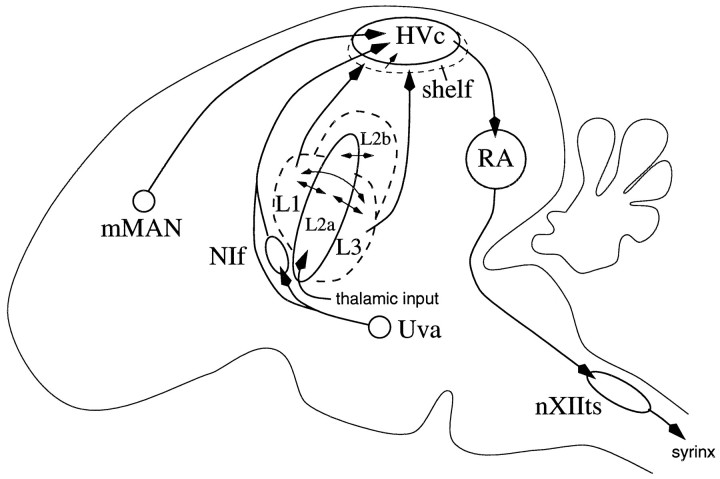
The circuitry by which song selectivity is established is not known. The song nucleus HVc is the first known site containing song-specific neurons (Margoliash, 1986). As detailed in Figure1, there are several nuclei afferent to HVc, but it is believed that the primary source of auditory input is the forebrain field L areas L1 and L3, which are thought to connect to HVc through HVc dendrites that extend into the “shelf” region (Katz and Gurney, 1981; Fortune and Margoliash, 1995; Vates et al., 1996). Areas L1 and L3 may also send sparse direct projections (Fortune and Margoliash, 1995; Vates et al., 1996) into HVc. The response properties of song-specific neurons in HVc are likely to be the result of the integration of neurons with simpler tuning properties, but it has not been established whether the neurons with simpler tuning properties also arise in HVc or are already present in the areas of field L.
Fig. 1.
A simplified diagram of the song system.Dashed lines indicate indistinct anatomical borders. AreasL1, L2a, L2b, and L3 are collectively called field L. The primary source of auditory input to HVc (via the shelf) is areas L1 and L3 (Kelley and Nottebohm, 1979; Fortune and Margoliash, 1995; Vates et al., 1996). Thalamic auditory areas project primarily throughout L2a andL2b (L2b connection not shown) (Vates et al., 1996). The other nuclei afferent to HVc, mMAN (medial magnocellular nucleus of the anterior neostriatum), NIf (nucleus interfacialis), and Uva (nucleus uvaeformis), have not been characterized physiologically, although NIf andUva are thought to be involved in song production (McCasland, 1987; Williams and Vicario, 1993). The diagram also shows that HVc is part of the descending motor control pathway; HVc projects toRA (robust nucleus of the archistriatum), which directly innervates the motor neurons of the vocal musculature in nXIIts(tracheosyringeal part of the hypoglossal nucleus).
As a population, field L neurons show no preference for the autogenous song over other songs (Margoliash, 1986), but are sensitive to spectral patterns (Leppelsack and Vogt, 1976; Leppelsack, 1978;Scheich et al., 1979; Langner et al., 1981; Scheich, 1983), amplitude and frequency modulation (Bonke et al., 1979; Leppelsack, 1983;Müller and Leppelsack, 1985; Hose et al., 1987; Knipschild et al., 1992; Heil et al., 1992), and the spectral and temporal patterns of human speech sounds (Langner et al., 1981; Uno et al., 1991). These tuning properties can account for some of the response properties of HVc neurons, but it is not known whether field L contains neurons that show the same capacity to integrate long periods of auditory context that is seen in HVc neurons. The present paper makes a systematic comparison between the response properties of field L and HVc neurons that show a significant response to song so as to determine where the neural response properties underlying the context-sensitive properties of song-specific neurons are first computed.
MATERIALS AND METHODS
Surgery. Experiments were performed on 25 adult (older than 120 d) male zebra finches (Taeniopygia guttata) raised in our own colony. A few days before the experiment, birds were anesthetized with Equithesin [0.03–0.04 ml intramuscular injection (0.85 gm of chloral hydrate, 0.21 gm of pentobarbital, 0.42 gm of MgSO4, 2.2 ml of 100% ethanol, 8.6 ml of propylene glycol, filled to a total volume of 20 ml with water); all chemicals were purchased from Sigma (St. Louis, MO)], and a small metal post, used to immobilize the head during later physiological recordings, was cemented to the skull with dental cement. One or two days later, the birds were anesthetized with urethane (65–90 μl of a 20% solution, Sigma) for physiological recordings.
Electrodes were lowered through a craniotomy that was made small (400 μm diameter) so as to minimize brain edema and pulsation. If neurons were isolated in field L, the next electrode track was made into HVc and vice versa so as to maximize the number of single neurons from field L and HVc in each bird. Extracellular recordings were obtained with parylene-coated tungsten electrodes with impedances (at 1.0 kHz) ranging from 1 to 10 MΩ (AM Systems, Everett, WA).
The anatomical locations of the recording sites were determined from reference marks consisting of two or more electrolytic lesions (−2 to −3 μA twice for 10 sec each) spaced at least 500 μm apart. At the end of the experiment, birds were perfused transcardially with 0.9% saline followed by 4% paraformaldehyde. Thirty micrometer frozen sections were cut on a microtome, mounted, and stained with cresyl violet for localization of lesions.
Spike analysis. Extracellular waveforms containing action potentials of different shapes were sorted using a new real-time software spike discrimination algorithm (Lewicki, 1994) that automatically determines the spike shapes in the extracellular waveform and accurately classifies overlapping action potentials. Otherwise, single units were isolated with conventional methods using a level or window discriminator. Spike classes that were not stable throughout the experiment were omitted from the analyses.
Stimuli. Before each experiment, the autogenous song was recorded, digitized, and analyzed on a DSP Sona-graph 5500 (Kay Elemetrics, Pinebrook, NJ) and on a computer using custom software (written by M.S.L., Dr. Larry Proctor, and Dr. James Mazer). The bird’s own song was used as a search stimulus in both field L and HVc. Well isolated single neurons were selected for further analysis only if they demonstrated a significant response to song. Because the purpose of the present study was to compare the relative sensitivity to temporal structure between the field L areas and HVc, the general selectivity of the song responsive cells was not determined. Previous studies have shown that most (>90%) song-responsive HVc cells respond more to the bird’s own song than to other songs of the same species (Margoliash, 1986). The electrode was advanced at least 150 μm between isolated neurons.
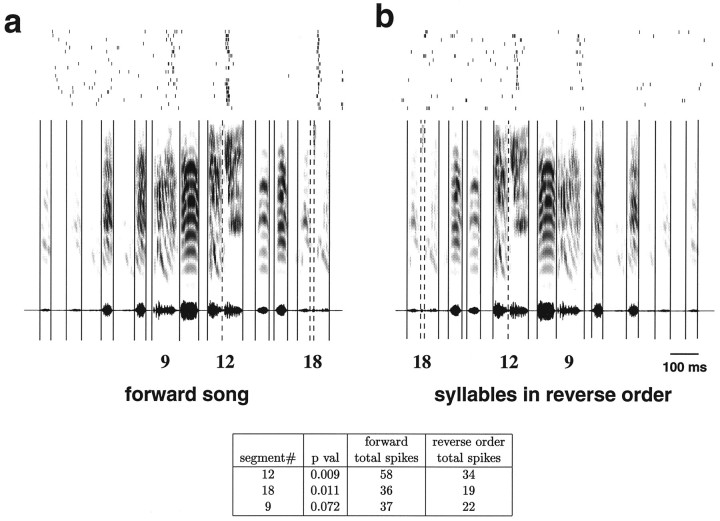
Some of the stimuli used in these experiments were constructed by manipulating the order of syllables and subsyllables in the autogenous song. Four stimuli were used in the tests for context sensitivity: forward song, reversed song (the song played backward), subsyllables in reverse order, and syllables in reverse order. Syllable boundaries were defined as points where the song’s amplitude falls to zero. Subsyllable boundaries were defined as places where the sonogram of the song indicated an abrupt change in spectral composition. Typically, this was a change in the harmonic pattern or a change in the direction of the frequency modulation. An example of these divisions is shown in Figure 2. An envelope (3 msec rise–fall) was placed around each syllable and subsyllable to remove any transients. All stimuli were presented in free field conditions in a sound-attenuating chamber (Acoustic Systems, Austin, TX) with a calibrated speaker (JBL, Northridge, CA). The frequency response of the speaker, as measured from the bird’s position in the stereotaxic apparatus inside the chamber, was flat to within 8 dB between 500 and 8000 Hz. Stimuli were presented with a peak amplitude between 60 and 70 dB SPL.
Fig. 2.
An illustration of the procedure for selecting syllable pairs for performing the tests for temporal combination sensitivity. The graphs show the response of an HVc cell in response to the forward song (a) and to the syllables in reverse order (b). The top of each graph shows the spike rasters. The sonogram and oscillogram of the stimulus are shownbelow. The solid and dotted vertical lines indicate the syllable and subsyllable boundaries, respectively. This divides the song into segments that are numbered from left to right, counting both syllables and the silent periods in between the syllables. The numbers below the oscillogram indicate the segment numbers referred to in the table. The table shows the song segments that had the greatest difference (in terms of the p value of a pairedt test) between the response in the forward song and the response to the song with the syllables in reverse order. Entries with few spikes were omitted. In this example, there were 58 total spikes during segment 12 during the forward song. The same syllable elicited only 34 spikes in the context of the syllable-reversed song. Thus, segments 10–12 (2 syllables, separated by a silent segment) would be selected for presentation in isolation to test for temporal combination sensitivity.
An automated procedure was developed to select syllable pairs for which a neuron would be likely to show order and combination sensitivity. This procedure is illustrated in Figure 2. Syllable pairs were selected by comparing the response to each syllable when presented as part of the forward song to the same syllable as part of a song constructed by playing the syllables in reverse order. The syllables (or subsyllables) with the greatest statistically different responses (by a pairedt test) and the syllables (or subsyllables) preceding them were selected to test for temporal combination sensitivity. This yielded two syllables, A and B (and the intervening silent period), which were presented in the following combinations: A, B, AB, BA, AA, and BB. Syllables at the beginning of the song were not considered, because significant differences can result simply from an onset response. Sometimes more than two syllables were necessary to evoke a response, in which case the set of syllables was divided into two groups and manipulated as above.
The trials for both types of experimental tests were either interleaved or randomized. No difference was observed between these conditions. During the collections to measure the response to syllables and syllable pairs, the response to forward song was also measured. Cells that did not show a stable response to forward song were omitted from the analysis. The collection duration was 5 sec for the song stimuli and between 2 and 3 sec for syllables. For all trials, a delay of at least 2 sec was inserted between each stimulus with an additional random delay of up to 500 msec to minimize the effect of any periodicity in the noise or in successive responses. This yielded an effective interstimulus interval between 4 and 6.5 sec for song stimuli and between 3 and 3.5 sec for syllables.
Data analysis. The response of a cell to autogenous song and the synthetic songs was measured by the average spike rate during the stimulus presentation minus the spontaneous rate. The variation of the response is reported as mean ± SEM. For shorter stimuli, such as single syllables, the time course of the response of HVc neurons can be highly variable from neuron to neuron: some neurons respond during the stimulus, and others respond well after the stimulus has ended. This variability makes it difficult to determine exactly when and how much a cell responded. We determined the regions of significant response automatically by calculating where the spike rate differed significantly from background by sliding a 50 msec window from the start of the stimulus (plus latency) to the end of the collection. Because a standard t test can inaccurately report significant response regions when most or all of the window counts across trials are zero, we determined statistical significance using a Poisson model that takes into account the window size. Excitatory and inhibitory regions were analyzed separately.
The statistical significance of the sensitivity to syllable order was determined by comparing the total spike counts in the significant response regions of syllable pairs AB and BA using a t test. The significance of the sensitivity to syllable combinations was determined using a t test to compare the sum of the spike counts in the regions of syllables A and B to the spike counts from the regions of AB.
RESULTS
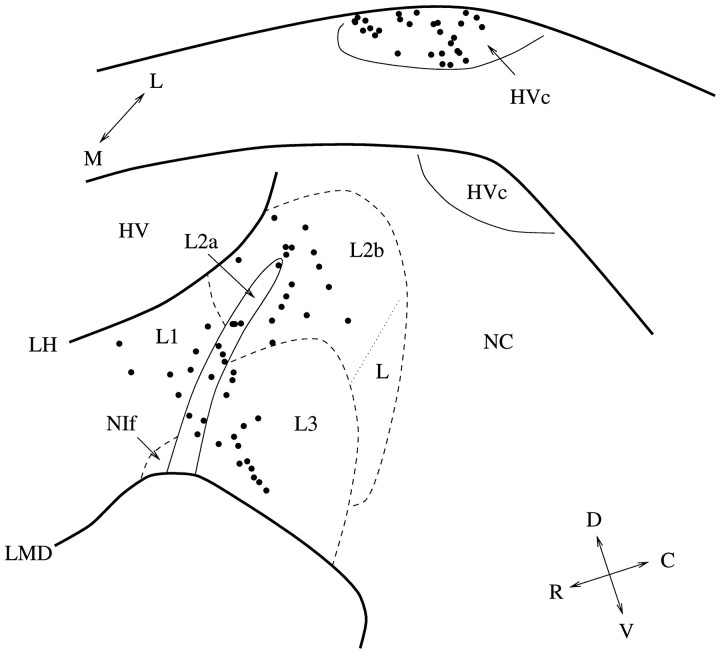
We recorded from 52 well isolated neurons in HVc and 56 neurons in the field L areas that had a significant response to song (shown in Fig. 3). In the areas of field L, there were 8 well isolated units in L1, 11 in L2a, 10 in L2b, 16 in L3, and 11 that bordered two or more field L regions. Neurons that were on the border between field L and non-field L areas, such as caudal neostriatum (NC) and ventral hyperstriatum (HV), were omitted from the analysis. Both phasic and tonic responses were seen in each of the areas. Cells in HVc sometimes responded with bursts of action potentials. Bursting was rarely observed in field L.
Fig. 3.
The anatomical sites of the neurons analyzed in this study (note that because spikes were sorted using a software discrimination algorithm, some sites may contain more than one isolated neuron). The upper diagram shows the sites in HVc, and thelower diagram shows the sites in field L. The average medial–lateral position was 2.3 mm (range 1.8–2.65) for HVc and 1.5 mm (range 1.1–1.9) for field L. Area L2a of the field L complex as well as HVc can be clearly identified in cresyl violet-stained sections. The dashed lines indicate the approximate anatomical areas as described by Fortune and Margoliash (1992).
Comparison of context sensitivity in HVc and field L
The first set of experiments compares auditory context sensitivity in field L and HVc. A cell is sensitive to the auditory temporal context if the response at one point depends on previous parts of the stimulus. For example, if a cell’s response was determined solely by spectral structure, then reversing the song should have little effect on the response, because playing the song backward alters the temporal structure but not the spectral structure. The response of song-specific neurons to autogenous song is often abolished if the song is played backward (Margoliash, 1983), indicating that these neurons are sensitive to at least the local auditory temporal context.
The extent of the temporal context sensitivity was estimated by reversing the order of segments of different lengths, i.e., by comparing the response to forward song with the responses to reversed song, subsyllables in reverse order, and syllables in reverse order. This preserves the local spectral and temporal structure within each segment, but alters the global auditory context in which each segment occurs.
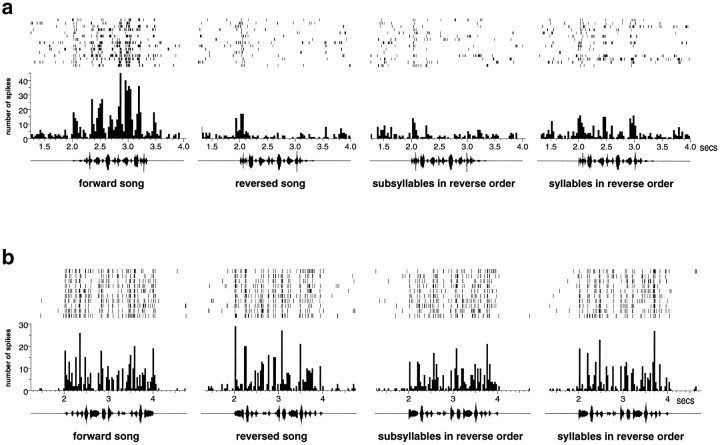
The response of a typical HVc neuron is shown in Figure4a. This particular neuron shows a strong response to forward song (22.78 ± 4.32 spikes/sec) and is slightly inhibited by the reversed song (−2.01 ± 0.09 spikes/sec). The response is also greatly reduced when the order of the subsyllables or syllables is reversed (−1.30 ± 1.61 and 3.98 ± 2.44 spikes/sec, respectively). The differences between the response to forward song and to the synthetic songs are all statistically significant (p < 0.001, pairedt test). Because the acoustic structure of each syllable or subsyllable is identical to that in the forward song, this HVc neuron is dependent on the auditory context which, in this case, extends beyond a single syllable. Performing this analysis on the population of HVc cells showed that about half of the neurons responded significantly (p < 0.01) more to the forward song than to the reverse song (28/52) or to the subsyllables in reverse order (26/52). About one-quarter of HVc neurons responded more strongly to the forward song than to the syllables in reverse order (12/52). About one-third of the HVc cells (18/52) showed no statistical differences between the response to the forward song and the response to the three temporally altered songs. None of the cells in HVc responded more to any of the three temporally altered songs than to the forward song. These data are summarized in Figure 5.
Fig. 4.
The response of representative cells from HVc (a) and field L (b) to autogenous song and three manipulations of the song’s temporal structure. The graphs show the spike rasters and peristimulus time histograms of the response recorded from two well isolated units. The oscillograms of the stimuli are shownbelow each histogram.
Fig. 5.
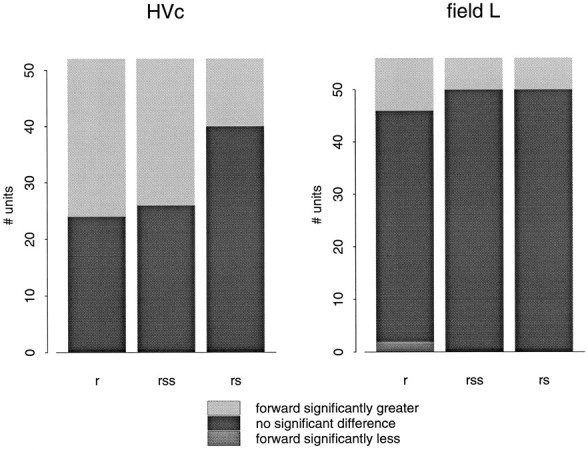
The bar graphs show the number of times the response to forward song differed significantly from the response to reversed song (r), to subsyllables in reverse order (rss), or to syllables in reverse order (rs).
Neurons in field L showed much less sensitivity to manipulations of the auditory temporal context than neurons in HVc. Neurons in all areas of field L responded strongly throughout the forward song, the reversed song, and to the syllables and subsyllables in reverse order. The response of a typical field L neuron (in area L3) is shown in Figure 4b. The differences between the response to forward and the temporally altered songs is much less than in HVc (forward song, 19.07 ± 0.74 spikes/sec; reversed song, 16.17 ± 1.18 spikes/sec; subsyllables in reverse order, 15.29 ± 0.76 spikes/sec; syllables in reverse order, 14.10 ± 0.55 spikes/sec). A majority of field L cells (41/56) show no significant difference (p > 0.01) between the response to the forward song and the response to any of the three temporally altered songs. These data are summarized in the bar plots in Figure 5.
Of the field L subdivisions, only L3 contained neurons that showed a significant difference in response between the forward song and the syllable-reversed song (6/16). Both L1 and L3 had neurons that showed a significant difference between the forward song and subsyllable-reversed song (1/8 and 4/16, respectively). All subdivisions of field L had neurons that showed a significant difference between the forward and reversed song (L2a, 3/11; L2b, 2/10; L1, 1/8; L3, 5/16).
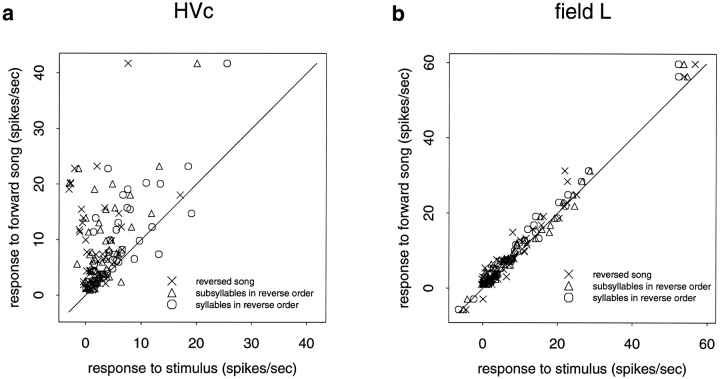
Although both field L and HVc contained cells that were significantly dependent on the temporal order, the difference in response rates between the forward song and the altered songs for these cells was much greater in HVc. This difference in the response properties of the two populations can be summarized by plotting the response of the forward song against the response of altered songs. Figure 6 shows that responses of the population of field L neurons was largely the same for all four types of stimuli, but the response of many neurons in HVc compared to forward song is greatly reduced or inhibited when the temporal structure of the forward song is altered. Each graph plots the response to forward song against the response to the three temporally altered songs. In HVc, many of the neurons responded much more to the forward song than to the temporally altered songs. This is indicated on the graph in Figure 6aby the large number of points above the line y = x (solid line). The further a point is above the line, the greater difference in response. If a neuron shows no sensitivity to auditory context, the responses to forward and the temporally altered stimuli would be the same, and the points would fall near the line y = x (solid line). This is indeed the case for the field L data shown in Figure6b.
Fig. 6.
The graphs show summary data for HVc (a) and field L (b). Response is defined as the average spikes/sec during stimulus minus the spontaneous rate. The response to the forward song is plotted against the response to the altered song. The solid diagonal line is y = x.a, Many neurons in HVc show a large dependence on the song’s temporal structure. b, Infield L, however, the response to the altered song is typically similar in magnitude to the response to forward song.
HVc neurons clearly show greater sensitivity to the auditory temporal context than field L neurons. The difference between the HVc and field L responses is statistically significant for forward versus reversed song (p < 0.001, unpaired ttest), forward versus subsyllables in reverse order (p < 0.001), and forward versus syllables in reverse order (p < 0.05). A one-way ANOVA indicated no statistical differences (p > 0.2, F test) among any of the field L areas between the forward song and the temporally altered stimuli. Because there are relatively few neurons in each of the field L subdivisions, these tests do not rule out the possibility that more subtle differences among these areas do exist.
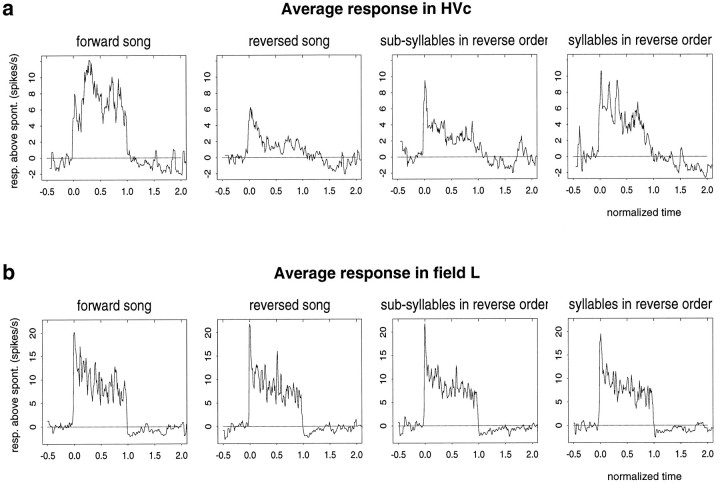
Another way to see the difference between HVc and field L response properties is to look at the time course of the responses. Figure7 shows the average response to the forward song and the three altered songs for HVc and field L neurons. The plots were generated by computing for each cell the response in 50 msec time windows over the duration of the collection. The average response was computed by normalizing the time axis so that the song was from 0.0 and 1.0 and then averaging the response rates across cells. The average response plots show that both HVc and field L neurons have an onset response. For HVc cells, the average response to forward song builds up during the course of the song, whereas the response attenuates during the course of reverse song and the subsyllables and syllables in reverse order. For field L neurons, the average response to the forward song and the three altered songs is roughly the same. Neurons typically have a strong onset response and accommodate at the same rate over the course of all four types of stimuli.
Fig. 7.
The graphs show the average response for HVc and field L areas, with the time axis normalized so that the song was from 0.0 to 1.0 (see text). a, The average response of HVc cells builds up during the course of the forward song, but only has an onset response to the other stimuli. b, The average responses in field L were the same for all manipulations of the song with a strong onset response in all cases.
Comparison of order and combination sensitivity in HVc and field L
The second part of this study addresses the question of whether the auditory context sensitivity observed in song-specific neurons can be accounted for by the response measured for syllables presented in isolation. A cell is said to be combination-sensitive if the response to a syllable pair AB is greater than the sum of the responses to syllables A and B presented in isolation (Margoliash, 1983). Comparing responses to AB and to BA determines whether a cell is sensitive to the order of the syllables. Previous studies have shown that HVc neurons are sensitive to the order and combination of syllables from the autogenous song, a property called temporal combination sensitivity (TCS) (Margoliash, 1983; Margoliash and Fortune, 1992), but it is not known if such neurons are present in field L.
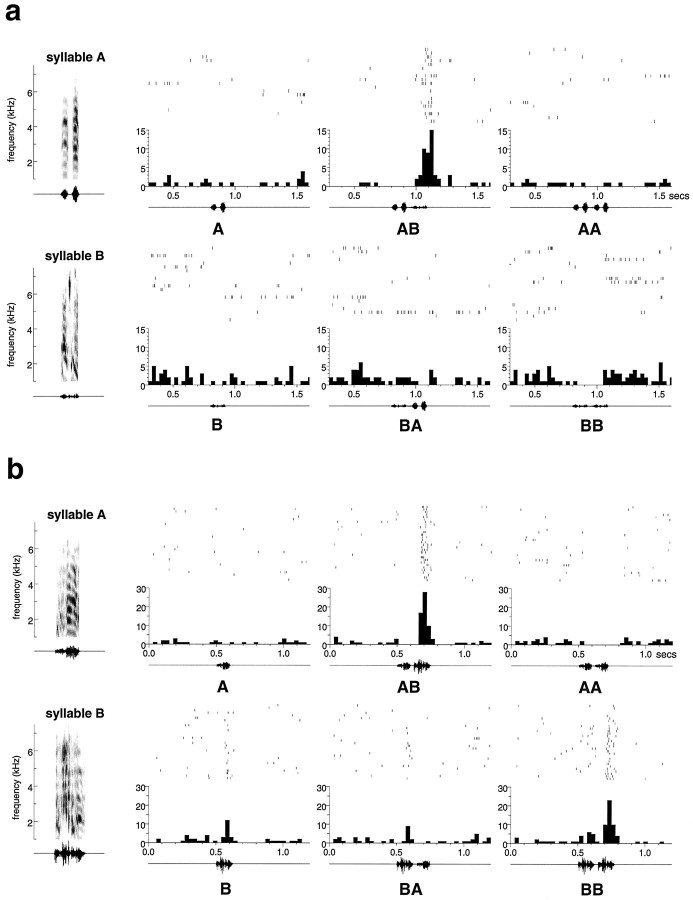
Figure 8a shows an example of a TCS neuron in HVc. The syllables A and B were selected using the automated procedure described in Materials and Methods. Because the response to AB is significantly greater than the response to BA (p < 0.001, paired t test), this cell shows order sensitivity. The cell also shows combination sensitivity, because the response to AB is significantly greater than the sum of the responses to A and B presented in isolation (p < 0.001). It is possible that the response to the pair AB could be explained by a nonspecific facilitation. For example, syllable A may facilitate the response to any subsequent stimulus. Conversely, it is also possible that any auditory stimulus facilitates the response to B. To test for these possibilities, the present study also measured the responses to repetitions of each syllable, AA and BB. This cell shows no response to either, which provides further evidence that the cell is indeed selective for the syllable combination AB.
Fig. 8.
To the left of each set of histograms are the sonogram and oscillogram of the stimuli, which are syllables selected from the autogenous song. a, A temporal combination-sensitive (TCS) neuron from HVc. b, A field L TCS neuron.
In field L, temporal combination sensitivity was also observed despite the lack of strong sensitivity to syllable order of the whole autogenous song as reported in the previous section. Figure8b shows an example of a TCS neuron in field L. This cell shows order sensitivity, because the response to the syllable pair AB was significantly greater (18.03 ± 2.52 spikes/sec,p < 0.001) than the response to BA (6.23 ± 2.21 spikes/sec). This cell was also combination-sensitive, because the response to AB was significantly greater than the response to the sum of the responses to A and B in isolation (p < 0.001). The response to AB cannot be accounted for by facilitation by syllable A because the syllable pair AA produces no response. This cell, however, did show significant facilitation by syllable B (p = 0.018), because the response to BB was greater than twice the response to syllable B when presented alone. The other two examples of temporal combination sensitivity seen in field L (data not shown) showed strong responses to individual syllables and syllable pairs (but still satisfied the criteria listed above). None of the temporal combination sensitive units in HVc responded to individual syllables in isolation.
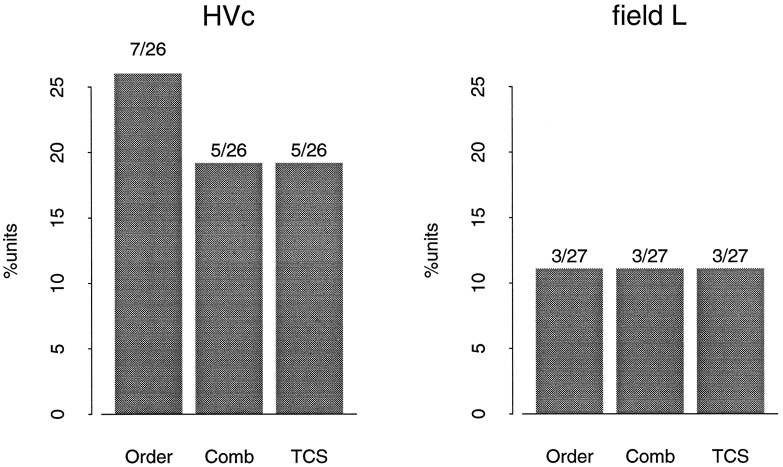
Tests for order and combination sensitivity were performed on 31 and 42 well isolated neurons in HVc and field L, respectively. All of these cells showed a significant response to autogenous song as determined from the tests for temporal context sensitivity described in the previous section. Cells that did not show a significant response to the selected syllable pair AB when presented in isolation were not analyzed. There were 26 neurons in HVc and 27 in field L that showed a significant response to a syllable pair AB in isolation. Most of the syllable pairs selected for HVc neurons produced a significant response (26/31) compared to 27/42 in field L. This difference arises because several field L neurons had a relatively weak, but statistically significant, response to autogenous song. Subsequently, these neurons did not produce a significant response to isolated syllables. Most of the HVc neurons responded more strongly to autogenous song and also to the syllables presented in isolation. The results of the syllable tests on the population of HVc and field L neurons are summarized in Figure9. A greater percentage of HVc units showed some sensitivity, but in both areas there were instances of order and combination sensitivity.
Fig. 9.
The tests for order and combination sensitivity were performed on cells that showed a significant response to forward song. For each set of tests, a pair of syllables (AB) was selected that was likely to show order sensitivity (see Materials and Methods). Thebars indicate the percentage of cells that satisfied the listed conditions given a significant response to the syllable pair AB.Order, The response to AB is significantly greater than the response to BA; Comb, the response to the syllable combination AB is significantly greater than the response to A or B when presented in isolation; TCS, the cell showed both order and combination sensitivity. The incidence of TCS is low but not inconsistent with previous studies.
The data were also analyzed for significant responses to the syllable pairs in reverse order. Twenty cells in HVc and 29 cells in field L showed a significant response to the syllable pair BA in isolation. Of these, one HVc cell showed significant reverse order sensitivity (BA > AB) compared to 4 in field L. In HVc, 2 cells showed significant reverse combination sensitivity (BA > B + A) compared to 3 cells in field L. No cells in HVc showed both of these properties, whereas 1 cell did in field L. The number of HVc cells showing significant order or combination sensitivity for the reverse order, BA, was lower than for the normal order, AB (20 vs 26). In field L, there were roughly equal numbers for both the reverse and normal order (29 vs 27).
Not all of the cells that showed auditory context sensitivity also showed order or combination sensitivity. In HVc, tests for order and combination sensitivity were performed on 13 cells that showed a significant difference between the response to the forward song and the response to the syllable- or subsyllable-reversed songs. Of these, only 7 cells were sensitive to the temporal order and/or combination of the syllables, despite large differences in response between the forward and syllable-reversed songs. In field L, order and combination tests were performed on 4 cells that showed significant sensitivity to the syllable or subsyllable order. Three of these showed either order or combination sensitivity, and the other showed significant facilitation.
DISCUSSION
The neural circuitry that gives rise to the complex auditory response properties of song-specific neurons is not known. These results show that there is a substantial increase in the auditory temporal context sensitivity associated with the progression from the areas of field L to HVc. Neurons in field L typically respond equally well to autogenous song and to the temporally manipulated versions of the song. In contrast, neurons in HVc are highly dependent on the song’s temporal structure. They respond strongly to the forward song but weakly to the reversed song and to the song with the syllables or subsyllables in reverse order. These results extend previous findings that neuronal preference for autogenous song is observed in HVc but not in field L (Margoliash, 1986) by demonstrating that song-responsive neurons in HVc are much more sensitive to temporal structure than song-responsive neurons in field L.
The response of song-specific units in HVc depends on auditory temporal context that extends beyond a single syllable. FM sensitivity alone is insufficient to account for the context-sensitive properties of these neurons. Previous studies comparing the context sensitivity of HVc and field L neurons used only forward and reverse song (Margoliash, 1986;Margoliash et al., 1994). Reversing the order of the syllables or subsyllables does not change the direction of the frequency sweeps in the song. Thus, any change in response between the forward and syllable- or subsyllable-reversed song cannot be attributed to FM sensitivity and must arise from the integration of the auditory context of the previous syllables.
Earlier studies suggested that the responses of field L neurons could be accounted for by the sensitivity to short-term spectro-temporal structure, such as amplitude and frequency modulation (Schafer et al., 1992). The presence of TCS neurons in field L provides new evidence that field L neurons can also encode information about syllable combination and order. This observation agrees with previous findings that field L neurons in Mynah birds can be sensitive to the learned temporal structure of human vowel sounds (Uno et al., 1991). Sensitivity to syllable order and combination requires integration of auditory context over longer periods of time, as much as a hundred milliseconds. Thus, it is not clear how these responses could be accounted for by FM or AM sensitivity, which covers only a few milliseconds.
One explanation for the temporal context sensitivity of HVc song-specific units is in terms of the neural sensitivity to syllable order and combinations. In this model, sensitivity to the order of the syllables in the autogenous song results either from sensitivity to the order of particular syllable combinations or from integrating the output of such neurons. Several HVc neurons, however, showed strong sensitivity to the order of the syllables in the whole song, but were not sensitive to either the order or the combination of syllable pairs when presented in isolation. These data show that HVc neurons integrate auditory context over periods greater than the duration of syllable pairs, which supports the conclusions reached by earlier studies (Margoliash and Fortune, 1992; Margoliash and Bankes, 1993; Lewicki and Konishi, 1995).
These findings suggest that there is a hierarchical arrangement of the temporal tuning properties in the song system auditory pathway. At the simplest level, field L neurons can be sensitive to amplitude and frequency modulation, which requires integrating just a few milliseconds of auditory temporal context. This work showed that field L neurons can also show nonlinear tuning properties such as sensitivity to combinations of syllables. This requires integration on the order of tens of milliseconds and also a nonlinear mechanism for combination sensitivity. The increase in auditory temporal context sensitivity from field L to HVc, however, represents a significant computation, because it is the first known location in the songbird auditory pathway where neurons are sensitive to much longer periods of temporal context, often as much as several hundred milliseconds. The hierarchical organization continues beyond HVc to the auditory nuclei in the anterior forebrain, where neurons become increasingly selective for autogenous song (Doupe and Konishi, 1991).
A hierarchical arrangement of response properties would be expected, because L2a and L2b, which are the main recipients of thalamic auditory projections, project to L1 and L3, which in turn project to the shelf (Kelley and Nottebohm, 1979; Vates et al., 1996). The shelf may represent an additional stage of processing between field L and HVc, but the nature of the connection between the shelf and HVc remains unclear. It is not known whether projections from L1 and L3 synapse onto shelf neurons that then innervate HVc neurons, or if L1 and L3 projections synapse directly onto HVc dendrites that extend into the shelf. The shelf was thought previously to be limited to a thin (80 μm) band immediately ventral to HVc and was not targeted in the present study. Recent evidence, however, suggests that L1 and L3 innervates an area as much as 400 μm ventral to HVc (Vates et al., 1996). This study recorded from this region on nearly every pass through HVc but, in contrast to HVc and field L, it was not obviously auditory. Many well isolated neurons appeared to have no auditory response, and only 3 neurons were found to have significant response to forward song. Of these, 2 did respond significantly less to reversed song, but were insensitive to manipulation of the syllable order. The lack of strong auditory responses in this area suggests that it is not a separate processing stage, but the reason for the unusual innervation pattern from L1 and L3 remains unclear. A demonstration of synaptic responses in HVc neurons by selective stimulation of L1 or L3 efferent fibers would provide a definitive answer to this important issue, but such an experiment remains difficult because other fiber tracts, e.g. from NIf, also pass through this area.
The present data show highly significant differences between field L and HVc, but they are insufficient to allow meaningful comparisons between the different subareas of field L. These need to be studied in greater detail, but we can summarize the trends observed in the present study. All field L areas and HVc contained some neurons that were sensitive to the local temporal structure, as evidenced from the differences in response between the forward and reversed song. Only L1, L3, and HVc contained neurons that showed significant sensitivity to the order of the syllables or subsyllables in the autogenous song. Dramatic dependencies on the auditory temporal structure of autogenous song, in some cases having little or no response to the song with syllables in reverse order, were only observed in HVc.
New anatomical results suggest that there could be additional auditory pathways between field L and HVc, parallel to those studied here. A recent report showed that NIf, which sends projections throughout HVc, receives auditory inputs via the caudolateral hyperstriatum ventrale (clHV), which has reciprocal connections with all of the field L areas and also sends projections to the shelf (Vates et al., 1996). Area clHV also receives indirect projections from field L via caudomedial hyperstriatum ventrale (cmHV) and caudomedial neostriatum (Ncm). Other recent studies have reported that neurons in Ncm selectively habituate to complex auditory stimuli (Chew et al., 1995, 1996). In light of these new data, the auditory response properties of these areas clearly need to be investigated to determine whether they are indeed parallel auditory pathways connecting field L and HVc. Although not targeted in this study, many song-responsive neurons were recorded in clHV en route to field L, but only 1 cell showed significant context sensitivity.
The hierarchical organization suggested by the studies presented here agrees with behavioral data from HVc lesion studies. In male songbirds, it is difficult to separate any perceptual roles HVc might have from its crucial role in song production. Female songbirds, however, need to discriminate their own species’ song from those of other species. Brenowitz (1991) found that bilateral lesions of HVc in females resulted in copulation solicitations to both conspecific and heterospecific songs. Because these songs differed primarily in their temporal structure, it suggests that HVc is necessary to make these more complex discriminations.
The mechanisms that give rise to the dramatic increase in sensitivity in HVc are still unknown. Some initial studies have been made (Lewicki and Konishi, 1995; Lewicki, 1996) that suggest that these mechanisms include long-lasting intrinsic and synaptic currents, but it is not known which properties, if any, are unique to HVc. One common property of HVc neurons that was not observed in field L was high-frequency bursts of action potentials. Intracellular studies have suggested that burst firing could play a role in temporal order sensitivity (Lewicki and Konishi, 1995) and could contribute to the more complex response properties of these neurons. It is also possible that the sensitivity of song-specific cells to long periods of auditory context could be subserved by the extensive intrinsic projections within HVc (Katz and Gurney, 1981; Fortune and Margoliash, 1995). These allow for the possibility of complex feedback circuitry that could combine the current auditory inputs with the results of processing on previous input. This may provide an additional mechanism with which song-specific neurons could dynamically integrate auditory information over the entire duration of the song.
Sensitivity to auditory temporal structure has been observed in other systems, such as the cat (Weinberger and McKenna, 1988; McKenna et al., 1989) and monkey (Wollberg and Newman, 1972; Newman and Wollberg, 1973;Glass and Wollberg, 1983), but none has been observed that depends on as much auditory context as song-specific neurons. One advantage of the song system is the use of a behaviorally significant stimulus to evoke neural responses. Recently, a similar ethological approach has been applied successfully by Rauschecker et al. (1995) to investigate complex auditory neurons in the rhesus monkey. But with the obvious exception of human speech, few animals process auditory signals that are as complex as birdsong, which makes the song system well suited for investigating the neural representation of temporally complex sounds.
Footnotes
This work was supported by a National Institutes of Health Research Training Grant, a Caltech Engineering Research Center fellowship (M.S.L.), and a National Science Foundation graduate fellowship (B.J.A.). We thank Allison Doupe, Mark Konishi, James Mazer, and Marc Schmidt for valuable comments on this manuscript.
Correspondence should be addressed to Dr. Michael Lewicki, The Salk Institute, Computational Neurobiology Laboratory, 10010 North Torrey Pines Road, La Jolla, CA 92037.
REFERENCES
- 1.Bonke D, Scheich H, Langner G. Responsiveness of units in the auditory neostriatum of the guinea fowl (Numida meleagris) to species-specific calls and synthetic stimuli. I. Tonotopy and functional zones of field L. J Comp Physiol [A] 1979;132:243–255. [Google Scholar]
- 2.Brenowitz EA. Altered perception of species-specific song by female birds after lesions of a forebrain nucleus. Science. 1991;251:303–305. doi: 10.1126/science.1987645. [DOI] [PubMed] [Google Scholar]
- 3.Chew SJ, Mello C, Nottebohm F, Jarvis E, Vicario DS. Decrements in auditory responses to a repeated conspecific song are long-lasting and require two periods of protein-synthesis in the songbird forebrain. Proc Natl Acad Sci USA. 1995;92:3406–3410. doi: 10.1073/pnas.92.8.3406. [DOI] [PMC free article] [PubMed] [Google Scholar]
- 4.Chew SJ, Vicario DS, Nottebohm F. A large-capacity memory system that recognizes the calls and songs of individual birds. Proc Natl Acad Sci USA. 1996;93:1950–1955. doi: 10.1073/pnas.93.5.1950. [DOI] [PMC free article] [PubMed] [Google Scholar]
- 5.Christensen TA, Hildebrand JG, Tumlinson JH, Doolittle RE. Sex-pheromone blend of Manduca sexta: responses of central olfactory interneurons to antennal stimulation in male moths. Arch Insect Biochem Physiol. 1989;10:281–291. [Google Scholar]
- 6.Doupe AJ, Konishi M. Song-selective auditory circuits in the vocal control system of the zebra finch. Proc Natl Acad Sci USA. 1991;88:11339–11343. doi: 10.1073/pnas.88.24.11339. [DOI] [PMC free article] [PubMed] [Google Scholar]
- 7.Fortune ES, Margoliash D. Cytoarchitectonic organization and morphology of cells of the field-L complex in male zebra finches (Taeniopygia guttata). J Comp Neurol. 1992;325:388–404. doi: 10.1002/cne.903250306. [DOI] [PubMed] [Google Scholar]
- 8.Fortune ES, Margoliash D. Parallel pathways and convergence onto HVc and adjacent neostriatum of adult zebra finches (Taeniopygia guttata). J Comp Neurol. 1995;360:413–441. doi: 10.1002/cne.903600305. [DOI] [PubMed] [Google Scholar]
- 9.Glass I, Wollberg Z. Auditory-cortex responses to sequences of normal and reversed squirrel-monkey vocalizations. Brain Behav Evol. 1983;22:13–21. doi: 10.1159/000121503. [DOI] [PubMed] [Google Scholar]
- 10.Gross CG, Rocha-Miranda CE, Bender DB. Visual properties of neurons in inferotemporal cortex of the macaque. J Neurophysiol. 1972;35:96–111. doi: 10.1152/jn.1972.35.1.96. [DOI] [PubMed] [Google Scholar]
- 11.Heil P, Langner G, Scheich H. Processing of frequency-modulated stimuli in the chick auditory-cortex analog: evidence for topographic representations and possible mechanisms of rate and directional sensitivity. J Comp Physiol [A] 1992;171:583–600. doi: 10.1007/BF00194107. [DOI] [PubMed] [Google Scholar]
- 12.Heiligenberg W (1991) Neural nets in electric fish. Cambridge: MIT.
- 13.Hose B, Langner G, Scheich H. Topographic representation of periodicities in the forebrain of the myna bird: one map for pitch and rhythm. Brain Res. 1987;422:367–373. doi: 10.1016/0006-8993(87)90946-2. [DOI] [PubMed] [Google Scholar]
- 14.Katz LC, Gurney ME. Auditory responses in the zebra finch’s motor system for song. Brain Res. 1981;211:192–197. doi: 10.1016/0006-8993(81)91073-8. [DOI] [PubMed] [Google Scholar]
- 15.Kelley DB, Nottebohm F. Projections of a telencephalic auditory nucleus—field L—in the canary. J Comp Neurosci. 1979;183:455–470. doi: 10.1002/cne.901830302. [DOI] [PubMed] [Google Scholar]
- 16.Knipschild M, Dorrscheidt GJ, Rubsamen R. Setting complex tasks to single units in the avian auditory forebrain. I. Processing of complex artificial stimuli. Hearing Res. 1992;57:216–230. doi: 10.1016/0378-5955(92)90153-e. [DOI] [PubMed] [Google Scholar]
- 17.Knudsen EI, Konishi M. Space and frequency are represented separately in auditory midbrain of the owl. J Neurophysiol. 1978;41:870–884. doi: 10.1152/jn.1978.41.4.870. [DOI] [PubMed] [Google Scholar]
- 18.Langner G, Bonke D, Sheich H. Neuronal discrimination of natural and synthetic vowels in field L of trained mynah birds. Exp Brain Res. 1981;43:429–436. doi: 10.1007/BF00238805. [DOI] [PubMed] [Google Scholar]
- 19.Leppelsack HJ. Unit responses to species-specific sounds in the auditory forebrain center of birds. Fed Proc. 1978;37:2336–2341. [PubMed] [Google Scholar]
- 20.Leppelsack HJ. Analysis of song in the auditory pathway of songbirds. In: Ewert JP, editor. Advances in vertabrate neuroethology. Plenum; New York: 1983. pp. 783–800. [Google Scholar]
- 21.Leppelsack HJ, Vogt M. Responses of auditory neurons in the forebrain of a songbird to stimulation with species-specific sounds. J Comp Physiol [A] 1976;107:263–274. [Google Scholar]
- 22.Lewicki MS. Bayesian modeling and classification of neural signals. Neural Comput. 1994;6:1005–1030. [Google Scholar]
- 23.Lewicki MS (1996) Intracellular characterization of song-specific neurons in the zebra finch auditory forebrain. J Neurosci, in press. [PubMed]
- 24.Lewicki MS, Konishi M. Mechanisms underlying the sensitivity of songbird forebrain neurons to temporal order. Proc Natl Acad Sci USA. 1995;92:5582–5586. doi: 10.1073/pnas.92.12.5582. [DOI] [PMC free article] [PubMed] [Google Scholar]
- 25.Margoliash D. Acoustic parameters underlying the responses of song-specific neurons in the white-crowned sparrow. J Neurosci. 1983;3:1039–1057. doi: 10.1523/JNEUROSCI.03-05-01039.1983. [DOI] [PMC free article] [PubMed] [Google Scholar]
- 26.Margoliash D. Preference for autogenous song by auditory neurons in a song system nucleus of the white-crowned sparrow. J Neurosci. 1986;6:1643–1661. doi: 10.1523/JNEUROSCI.06-06-01643.1986. [DOI] [PMC free article] [PubMed] [Google Scholar]
- 27.Margoliash D, Bankes SC. Computations in the ascending auditory pathway in songbirds related to song learning. Am Zoologist. 1993;33:94–103. [Google Scholar]
- 28.Margoliash D, Fortune ES. Temporal and harmonic combination-sensitive neurons in the zebra finch HVc. J Neurosci. 1992;12:4309–4326. doi: 10.1523/JNEUROSCI.12-11-04309.1992. [DOI] [PMC free article] [PubMed] [Google Scholar]
- 29.Margoliash D, Fortune ES, Sutter ML, Yu AC, Wren-Hardin BD, Dave A. Distributed representation in the song system of oscines: evolutionary implications and functional consequences. Brain Behav Evol. 1994;44:247–264. doi: 10.1159/000113580. [DOI] [PubMed] [Google Scholar]
- 30.McCasland JS. Neuronal control of bird song production. J Neurosci. 1987;7:23–39. doi: 10.1523/JNEUROSCI.07-01-00023.1987. [DOI] [PMC free article] [PubMed] [Google Scholar]
- 31.McKenna TM, Weinberger NM, Diamond DM. Responses of single auditory cortical-neurons to tone sequences. Brain Res. 1989;481:142–153. doi: 10.1016/0006-8993(89)90494-0. [DOI] [PubMed] [Google Scholar]
- 32.Müller CM, Leppelsack HJ. Feature extraction and tonotopic organization in the avian forebrain. Exp Brain Res. 1985;59:587–599. doi: 10.1007/BF00261351. [DOI] [PubMed] [Google Scholar]
- 33.Newman JD, Wollberg Z. Multiple coding of species-specific vocalizations in the auditory cortex of squirrel monkeys. Brain Res. 1973;54:287–304. doi: 10.1016/0006-8993(73)90050-4. [DOI] [PubMed] [Google Scholar]
- 34.Perrett DI, Hietanen JK, Oram MW, Benson PJ. Organization and functions of cells responsive to faces in the temporal cortex. Philos Trans R Soc Lond [Biol] 1992;335:23–30. doi: 10.1098/rstb.1992.0003. [DOI] [PubMed] [Google Scholar]
- 35.Rauschecker JP, Tian B, Hauser M. Processing of complex sounds in the macaque nonprimary auditory-cortex. Science. 1995;268:111–114. doi: 10.1126/science.7701330. [DOI] [PubMed] [Google Scholar]
- 36.Schafer M, Rubsamen R, Dorrscheidt GJ, Knipschild M. Setting complex tasks to single units in the avian auditory forebrain. II. Do we really need natural stimuli to describe neuronal response characteristics? Hearing Res. 1992;57:231–244. doi: 10.1016/0378-5955(92)90154-f. [DOI] [PubMed] [Google Scholar]
- 37.Scheich H. Two columnar systems in the auditory neostriatum of the chick: evidence from 2-deoxyglucose. Exp Brain Res. 1983;51:199–205. doi: 10.1007/BF00237195. [DOI] [PubMed] [Google Scholar]
- 38.Scheich H, Langner G, Bonke D. Responsiveness of units in the auditory neostriatum of the guinea fowl (Numida meleagris) to species-specific calls and synthetic stimuli. II. Discrimination of iambus-like calls. J Comp Physiol [A] 1979;132:257–276. [Google Scholar]
- 39.Suga N. Multifunction theory for cortical processing of auditory information: implications of single-unit and lesion data for future-research. J Comp Physiol [A] 1994;175:135–144. doi: 10.1007/BF00215109. [DOI] [PubMed] [Google Scholar]
- 40.Uno H, Ohno Y, Yamada T, Miyamoto K. Neural coding of speech sound in the telencephalic auditory area of the myna bird. J Comp Physiol [A] 1991;169:231–239. [Google Scholar]
- 41.Vates GE, Broome BM, Mello CV, Nottebohm F. Auditory pathways of caudal telencephalon and their relation to the song system of adult male zebra finches (Taeniopygia guttata). J Comp Neurol. 1996;366:613–642. doi: 10.1002/(SICI)1096-9861(19960318)366:4<613::AID-CNE5>3.0.CO;2-7. [DOI] [PubMed] [Google Scholar]
- 42.Weinberger NM, McKenna TM. Sensitivity of single neurons in auditory cortex to contour: toward a neurophysiology of music perception. Music Percept. 1988;5:355–390. [Google Scholar]
- 43.Williams H, Vicario DS. Temporal patterning of song production: participation of nucleus-uvaeformis of the thalamus. J Neurobiol. 1993;24:903–912. doi: 10.1002/neu.480240704. [DOI] [PubMed] [Google Scholar]
- 44.Wollberg Z, Newman JD. Auditory cortex of squirrel monkey: response patterns of single cells to species-specific vocalizations. Science. 1972;175:212–214. doi: 10.1126/science.175.4018.212. [DOI] [PubMed] [Google Scholar]


