

Abstract
The locus coeruleus (LC)–noradrenergic system modulates forebrain electroencephalographic (EEG) activity in halothane-anesthetized rat. For example, unilateral enhancement of LC neuronal activity increases cortical EEG (ECoG) and hippocampal EEG (HEEG) indices of arousal bilaterally (Berridge and Foote, 1991). Conversely, bilateral suppression of LC discharge activity increases EEG measures of sedation (Berridge et al., 1993b). The EEG-activating effects of LC stimulation appear to involve noradrenergic β-receptors (Berridge and Foote, 1991).
Two candidate sites at which LC efferents could influence ECoG and HEEG are the medial septum/vertical limb of the diagonal band of Broca (MS) and the substantia innominata/nucleus basalis of Meynert (SI). To determine whether norepinephrine mediates such actions within either of these regions, the EEG effects of small infusions of a β-agonist or antagonist into MS or SI were examined in halothane-anesthetized rat. Unilateral infusions (150 nl) of the β-agonist isoproterenol (ISO) (3.75 μg, 17 nmol) into MS, but not SI (150–450 nl), elicited robust bilateral activation of ECoG and HEEG. Infusions of glutamate (0.5 μg, 3.0 nmol) into either MS or SI elicited bilateral ECoG and HEEG activation. Neither vehicle infusions into MS nor infusions of ISO into regions adjacent to MS altered forebrain EEG activity. Bilateral, but not unilateral, MS infusions of the β-antagonist timolol (3.75 μg, 8.7 nmol) decreased EEG indices of arousal in the lightly anesthetized preparation. Power spectral analyses provided quantitative confirmation of these qualitative observations.
These results indicate that under these experimental conditions, noradrenergic efferents, presumably arising from LC, modulate forebrain EEG state via actions at β-receptors located within MS. The results presented in the accompanying report extend these observations to the unanesthetized preparation and incorporate additional measures of behavioral state.
Keywords: norepinephrine, medial septum, arousal, EEG, β-receptors, locus coeruleus, waking, basal forebrain
Distinct amplitude and frequency patterns in forebrain electroencephalographic (EEG) activity constitute major defining characteristics of behavioral states (Timo-Iaria et al., 1970;Buzsaki et al., 1988; Steriade and McCarley, 1990; Steriade and Buzsaki, 1990). During non-rapid eye movement (non-REM) sleep, cortical EEG (ECoG) exhibits predominant large-amplitude, slow-wave activity (<1 Hz), whereas hippocampal EEG (HEEG) is characterized by the presence of mixed-frequency activity. EEG activation, characterized by low-amplitude, high-frequency fluctuations (desynchronized activity) in ECoG and theta activity in HEEG, occurs during most periods of alert waking and REM sleep (Vanderwolf and Robinson, 1981). EEG activation appears to reflect a state of readiness of cortical neurons for reception of information and rapid response to received information (Steriade and Buzsaki, 1990).
One system posited to participate in the modulation of behavioral state and state-dependent processes is the noradrenergic nucleus locus coeruleus (LC) and its efferents (for review, see Foote et al., 1983;Foote and Morrison, 1987). Anatomically, this nucleus is well positioned to affect global brain electrophysiological activity. LC is a small cluster of norepinephrine (NE)-containing neurons in the pontine brainstem possessing an extensive efferent projection system through which it innervates virtually all major regions of the CNS. LC neurons display state-dependent discharge rates, such that they are more active in waking than in sleep (Hobson et al., 1975; Foote et al., 1980; Aston-Jones and Bloom, 1981a; Hobson et al., 1986). Within waking, changes in LC neuronal discharge rates precede changes in behavioral and EEG measures of arousal (Foote et al., 1980; Aston-Jones and Bloom, 1981b). These and other observations suggest that the LC–noradrenergic system participates in the induction of changes in behavioral state and/or state-dependent processes (see Aston Jones et al., 1991).
In previous studies in halothane-anesthetized rats, microelectrode recordings were used to guide placement of small (35–150 nl) peri-LC infusions of drugs and verify that they altered LC discharge levels. This approach avoids many of the problems associated with techniques available previously for manipulation of the LC–noradrenergic system such as lesions, electrical stimulation, and local infusions guided solely by stereotaxic coordinates (see Berridge and Foote, 1991;Berridge et al., 1993b). It was observed that selective and reversible unilateral activation of LC neurons results in bilateral activation of ECoG and HEEG. These EEG responses are blocked by intracerebroventricular (ICV) pretreatment with the β-receptor antagonist propranolol (Berridge and Foote, 1991). Bilateral, but not unilateral, suppression of LC activity increased EEG measures of sedation (Berridge et al., 1993b). Additional studies demonstrated that enhanced LC discharge activity is a critical component of the mechanisms by which hypotensive stress elicits forebrain EEG activation in the halothane-anesthetized rat (Page et al., 1993). These results indicate that, at least in the halothane-anesthetized preparation, the LC–noradrenergic system is a potent modulator of forebrain EEG state through actions of NE at noradrenergic β-receptors.
The site(s) at which LC efferents act to modulate EEG state remains to be elucidated. Among the candidate sites are portions of the basal forebrain containing the medial septum/vertical limb of the diagonal band of Broca (collectively referred to as MS) and the substantia innominata/nucleus basalis of Meynert (SI). MS and SI receive a dense noradrenergic innervation (Segal, 1976; Gaspar et al., 1985; Vertes, 1988; Chang, 1989), the preponderance of which arises from LC (Zaborsky et al., 1991). Further, both send efferent projections widely throughout the hippocampal formation and neocortex, respectively (Meibach and Siegel, 1977; Swanson and Cowan, 1979; McKinney et al., 1983), and influence HEEG and ECoG (Belardetti et al., 1977; Detari and Vanderwolf, 1987; Buzsaki et al., 1988; Smythe et al., 1991; Metherate et al., 1992). The present studies tested the hypothesis that noradrenergic projections modulate ECoG and HEEG state in halothane-anesthetized rats through actions at β-receptors located within MS and SI. In these studies, the EEG effects of small infusions of a β-adrenergic agonist, a β-antagonist, and glutamate into sites within and adjacent to MS and SI were examined. A portion of these results were reported in preliminary form (Berridge et al., 1993a).
MATERIALS AND METHODS
Animals and surgery. Male Sprague Dawley rats (Charles River, Wilmington, MA), weighing 280–350 gm, were anesthetized with halothane using a face mask. A tracheotomy was then performed, and halothane (0.75–1.25% in air) was administered via this route for the duration of the experiment. The animal was placed in a stereotaxic instrument with the incisor bar set 11.5 mm below ear bar zero. Body temperature was maintained at 36–38°C.
Drugs/intratissue infusions. In the majority of cases, 26 gauge guide cannulae were then positioned over areas of interest and cemented into place with dental acrylic. MS cannulae were inserted at an angle of 4° from vertical (within the coronal plane) to minimize infusion-induced damage to fibers of passage that travel along the medial aspect of MS. In some cases (e.g., mapping studies), a cannula was cemented to a plastic holder held in a micromanipulator. This facilitated making infusions into multiple sites within a given subject. Infusions were made via a 33 gauge needle that was inserted into the cannula and extended 3 mm beyond its ventral tip. This needle was slightly beveled to minimize travel of fluid up the length of the needle. The infusion needle was attached to PE20 tubing via a 26 gauge stainless steel sleeve glued to the needle. The other end of the tubing was attached to a 10 μl syringe, the plunger of which was advanced using a microprocessor-controlled infusion pump (Harvard Apparatus, South Natick, MA). Infusions consisted of 150 nl given over a 60 sec period. If no effect of drug or vehicle was observed within 10 min of the first infusion, a second infusion was given. This strategy was based on previous studies using peri-LC infusions to alter LC neuronal discharge activity (Berridge and Foote, 1991; Berridge et al., 1993b). It was observed that under similar conditions, the first infusion was often less effective than subsequent infusions, presumably because of dilution of drug within the needle over time. For this reason, when vehicle infusions were made, two 150 nl infusions were performed, separated by 10 min. Isoproterenol (ISO) (hydrochloride, 3.75 μg, 17 nmol), timolol (maleate salt, 3.75 μg, 8.7 nmol), and glutamate (0.4 μg, 3.0 nmol) were dissolved in PBS containing 2% Pontamine Sky Blue dye on the day of the experiment. All drugs were obtained from Sigma (St. Louis, MO). Atropine sulfate was dissolved in PBS and injected into the femoral vein via a catheter (PE10 tubing) inserted before the beginning of data collection.
EEG recording and analyses. Bipolar surface-to-depth electrodes were used to record ECoG (anterior, +3.0; lateral, ±1.5) and HEEG (anterior, −4.8; lateral, ±2.5; ventral −2.8) bilaterally. EEG signals were amplified, filtered (0.1–50.0 Hz bandpass), and recorded on a polygraph and on magnetic tape. EEG epochs were selected from preinfusion, postinfusion, and in some cases, recovery portions of each experiment for power-spectrum analysis (PSA). Each segment was digitized at a sampling frequency of 300 Hz and tapered at the ends as a cosine function. The preinfusion segment was defined as ending immediately before the start of the infusion. The postinfusion epoch was selected on the basis of visual inspection as the initial portion of the greatest change in EEG activity from baseline. The recovery period was defined as the point at which EEG activity first returned to preinfusion activity levels. Each segment was subjected to fast Fourier transform and PSA. The mean absolute power and mean relative power (percentage of total power) were calculated for the frequency bands 0.3–2.3, 3–6.9, 6.9–13.0, 13.0–20.0, 20.0–30.0, 30.0–40.0, and 40.0–50.0 Hz. These frequency bands were selected on the basis of visual inspection of EEG patterns as being sensitive to changes induced by sensory stimulation such as tail pinch (see Berridge and Foote, 1991). For experiments involving ISO and glutamate infusions, 1 min EEG segments were subjected to PSA, whereas for the bilateral timolol infusion experiments, 5 min epochs were used (see below).
Statistical analyses. For MS ISO infusions, ECoG and HEEG absolute power and relative power for each frequency bandwidth were analyzed using a paired t test with Bonferoni correction to compare pre- and postinfusion segments. A one-way, repeated-measures ANOVA, followed by the Duncan’s multiple-range test, was used to statistically assess EEG recovery in the subset of MS ISO animals for which spontaneous recovery data were collected. Repeated-measures, one-way ANOVA was used to assess EEG effects of bilateral MS vehicle and timolol infusions.
Histology. After each experiment, the animal was deeply anesthetized and then perfused with 50 ml of 4% formaldehyde. The brain was removed and placed in perfusion solution. After a minimum of 24 hr, the brain was frozen and 40 μm sections were cut and collected through MS and other areas in which infusions were made. The sections were stained with neutral red dye for subsequent examination of the infusion sites. The distribution of Pontamine Sky Blue dye was noted in both freshly sectioned and stained tissue.
Dopamine β-hydroxylase (DBH)-immunohistochemistry. Animals were administered an overdose of sodium pentobarbital (100 mg/kg, i.p.) then perfused transcardially with 100 ml saline, followed by 250 ml 4% paraformaldehyde in 0.1 m phosphate buffer (PB). The brain was then removed, blocked and postfixed for 4–6 hr in 4% paraformaldehyde in 0.1 m PB, then cryoprotected by saturation with a 30% sucrose solution in 0.1 m PB for 24–48 hr. Coronal sections (35 μm thick) were cut on a freezing microtome and either rinsed in PB for immediate use or stored in a cryoprotectant solution containing 30% glycerol and 30% ethylene glycol in 0.1 m PB for up to 3 months at −15°C.
Sections were incubated in the following solutions for the indicated times for immunocytochemical localization of DBH: (1) 0.3% hydrogen peroxide in 0.1 m PB, 30 min; (2) 1% BSA, 10% normal horse serum (Sigma) in 0.1 m Tris-buffered saline (TBS) containing 0.3% Triton X-100, 60 min; (3) mouse anti-DBH (Chemicon International, Temecula, CA), diluted 1:1500, in TBS containing 2% normal horse serum, 0.1% BSA, and 0.3% Triton X-100, 24 hr at 4°C with constant shaking; (4) horse anti-mouse IgG (Vector Labs, Burlingame, CA) diluted 1:300 in the same diluent as in (3), 60 min; (5) avidin–biotin–peroxidase complex (ABC Elite, Vector Labs), diluted 1:200, in TBS-0.1% BSA, 60 min; and (6) substrate solution containing 0.05% diaminobenzidine tetrahydrochloride (Sigma), 0.0004% nickel chloride, and 0.0002% hydrogen peroxide in 0.1 mTris buffer for four 10 min rinses. All incubations were performed at room temperature unless otherwise indicated. Three 10 min rinses in the appropriate buffers were performed between steps. Sections were dehydrated in ascending concentrations of ethanol, then cleared in xylenes. For dark-field photomicrography, sections were additionally incubated in chloroform–ethanol (50:50 v/v) for 30 min before clearing in xylenes. Tissue sections were coverslipped with DPX (BDH Laboratory Supplies, Poole, England) then photographed using a Nikon Optiphot microscope with a 4× objective.
Data selection criteria. Data from a particular animal were included in the analyses for all cases, and in only those cases in which EEG electrode placements were accurate, EEG recordings were electrically adequate, and placement of the infusion needle could be anatomically verified.
RESULTS
General observations
In previous studies, we observed that LC-induced changes in EEG state are reliable and robust when observed during a stable, carefully maintained, and appropriate level of anesthesia (Berridge and Foote, 1991; Berridge et al., 1993b). For example, LC activation increases EEG indices of arousal only when the level of anesthesia is adjusted such that noxious stimuli (e.g., tail pinch) are capable of eliciting EEG activation against a background of synchronized ECoG and non-theta HEEG (Berridge and Foote, 1991). Preliminary studies indicated that MS ISO infusions altered EEG state only under similar anesthetic conditions. Therefore, in all the ISO and glutamate experiments described below, halothane concentration was adjusted such that baseline ECoG was characterized by the stable presence of slow-wave activity (at least 30 min of uninterrupted slow-wave activity before data collection) and a 2 sec tail pinch applied 2.5 cm from the tip of the tail elicited robust ECoG desynchronization that persisted 10–120 sec beyond termination of the pinch. Once data collection was initiated, the concentration of halothane being administered was not altered. Placement of an infusion needle into MS and other brain regions often induced short periods (2–3 min) of spreading depression unilaterally in ECoG and HEEG. Therefore, in all experiments, either dummy needles were first inserted into the site of interest early in the procedure or the drug-containing infusion needle was inserted at least 30 min before making an infusion.
In preliminary studies (n = 35), various infusion volumes and concentrations of ISO were used. In these studies, EEG responses were observed, and spread of dye from the infusion site was assessed. Dye was readily visible at sectioning of fixed tissue. After a 150 nl infusion, the spread of dye was limited to a radius of ∼600-800 μm from the infusion site. This radius was somewhat smaller in the medial–lateral direction where the midline and lateral ventricles appeared to form barriers across which the dye did not readily penetrate. Thus, dye was usually visible only in the region between midline and the lateral ventricles and was confined to an area defined by the most anterior and posterior aspects of MS. Dye rarely spread as far dorsally as the lateral septum. These observations, together with the EEG effects of these infusions, suggested that an infusion volume of ∼150 nl was adequate to ensure spread of drug throughout MS while minimizing its spread beyond this region. Doses substantially below that used in these studies appeared to elicit less consistent EEG effects.
Effects of unilateral ISO and glutamate infusions into MS on ECoG and HEEG
Unilateral infusions of ISO (150 nl) into MS (Fig. 1) (n = 21) resulted in a shift from slow-wave, large-amplitude to high-frequency, low-amplitude activity in ECoG and the appearance of nearly pure theta activity in HEEG (Fig.2). These EEG responses were observed only when infusions were placed within a radius of ∼500 μm of MS (see Figs.1, 3). In ∼30% of the cases, two infusions (separated by 10 min) were required to elicit this effect (see Materials and Methods). The EEG responses were observed bilaterally, within 3–8 min of termination of the infusion, and persisted for 5–90 min (median = 16 min), as determined from visual inspection. Comparable EEG responses were observed with repeated ISO infusions. Response duration and magnitude appeared to most closely correlate with the level of anesthesia, assessed by intensity and duration of tail pinch-induced ECoG desynchronization, rather than with the specific location of the infusion site within MS. Within the limits of the temporal resolution of the analyses (∼1 sec), HEEG and ECoG responses were generally observed simultaneously. However, in ∼50% of the experiments, the onset of HEEG responses appeared to occur 1–5 sec before the onset of the ECoG responses. Glutamate infusions into MS elicited an activation of both ECoG and HEEG similar to that observed after ISO infusions (n = 7). However, the latency to onset of the EEG responses was much shorter after glutamate infusions, ranging from before termination of the infusion to 30 sec after termination of the infusion. Comparable EEG responses were observed after repeated glutamate infusions. In nine experiments, two 150 nl infusions of vehicle were made before effective infusions of ISO (n = 5) or glutamate (n = 4) (see below). In all cases, vehicle infusions had no obvious effects on either HEEG or ECoG (data not shown).
Fig. 1.
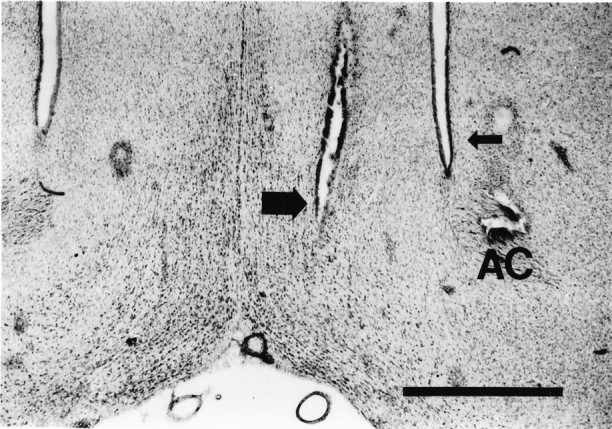
Photomicrograph of a neutral red-stained coronal section showing the position of an effective ISO MS infusion site from a typical experiment (large arrow). The infusion needle was lowered into MS at an angle of 4° from vertical, and a 150 nl infusion of ISO was made over 1 min. The most ventral extent of the needle track is shown in this section. The lateral ventricle on the same side is indicated by a small arrow.AC, Anterior commissure. Original magnification, 25×. Scale bar, 1 mm.
Fig. 2.

Raw ECoG and HEEG traces and PSA from pre- and postinfusion periods of a typical MS ISO experiment. A 40 sec raw EEG trace taken from the 60 sec interval from which the PSA was computed is shown above each power spectrum. The most striking postinfusion changes are the decrease in power of the slowest frequencies in ECoG and the appearance of theta (3–4 Hz) activity in HEEG. Shading indicates the theta frequency band (2.3–6.9 Hz) in the HEEG power spectra.
Fig. 3.

Schematic diagram depicting effective and ineffective MS (A) and SI (B) ISO infusion sites. A depicts sites at which 150 nl ISO infusions made within and around the region of MS were either effective or ineffective at inducing activation of forebrain EEG.B indicates sites at which ISO infusions (either 150 or 450 nl) were made into SI. In all cases, SI ISO infusions were ineffective at eliciting EEG activation. Shaded boxesindicate sites at which ISO infusions elicited forebrain EEG activation, whereas solid circles indicate sites at which they did not. AC, Anterior commissure;CC, corpus callosum; CP, caudate–putamen; GP, globus pallidus; I, internal capsule; LS, lateral septum; LV, lateral ventricle; MS, medial septum; NA, nucleus accumbens; SI, substantia innominata. Each level within A or B is separated by 250 μm, with the most anterior section on the left (modified from Swanson, 1992).
PSA of the MS ISO-induced changes in EEG
PSA demonstrated statistically significant effects of unilateral MS ISO infusions on ECoG and HEEG consistent with the above-described qualitative observations (Fig. 2; Table 1). In ECoG (n = 20) (in one case, it was not possible to obtain an electrically adequate ECoG recording), the primary effect was a significant decrease in absolute and relative power of the lowest frequency band (0.3–2.3 Hz). There were also significant increases in the relative power of the 20–30, 30–40, and 40–50 Hz bands. In HEEG (n = 21), ISO induced a decrease in the absolute and relative power of the 0.3–2.3 Hz frequency band and increased the absolute and relative power of the theta-activity frequency band (2.3–6.8 Hz). There was a tendency for increased absolute and relative power of the higher-frequency bands. However, this was statistically significant only for absolute power of the 30.0–40.0 Hz band and relative power of the 20.0–30.0 Hz band. Because of prolonged drug-induced responses or additional experimental manipulations, recovery epochs were analyzed only in a subset of the experiments (n = 13). Absolute and relative power of recovery EEG epochs for all frequency bands in both ECoG and HEEG did not significantly differ from preinfusion values (data not shown).
Table 1.
Effects of MS ISO infusions on EEG: mean absolute and relative power of postinfusion segments of ECoG and HEEG expressed as percentage of preinfusion means
| Frequency | ECoG | HEEG | ||
|---|---|---|---|---|
| Absolute | Relative | Absolute | Relative | |
| 0.3 –2.3 | 53 ± 6** | 76 ± 5** | 67 ± 5** | 64 ± 4** |
| 2.3 –6.8 | 82 ± 5 | 114 ± 8 | 116 ± 5* | 118 ± 4** |
| 6.8 –13.0 | 79 ± 6 | 107 ± 8 | 95 ± 4 | 105 ± 4 |
| 13.0 –20.0 | 78 ± 5 | 108 ± 8 | 96 ± 4 | 102 ± 5 |
| 20.0 –30.0 | 87 ± 5 | 119 ± 10* | 109 ± 5 | 117 ± 2** |
| 30.0 –40.0 | 88 ± 5 | 123 ± 11* | 114 ± 5** | 125 ± 10 |
| 40.0 –50.0 | 91 ± 8 | 132 ± 13** | 104 ± 3 | 117 ± 10 |
Absolute and relative power expressed as percentages of preinfusion means (±SEM) for ECoG (n = 20) and HEEG (n = 21) for the specified frequency bands. *p < 0.05, **p < 0.01 significantly different from preinfusion mean determined by t test with Bonferoni correction (n = 20).
Effects of ISO infusions made outside the region of MS on ECoG and HEEG
To determine whether the MS ISO-induced changes in forebrain EEG resulted from diffusion and subsequent action of ISO outside of MS, ISO infusions were made into the following regions: (1) the striatum, at a similar distance from the lateral ventricle as the MS infusions (n = 6); (2) the region immediately lateral to the effective MS infusion sites (n = 6); and (3) the lateral septum (n = 4) (see Fig. 3). These infusions were made in a subset of the experiments described above using a within-subjects design. ISO infusions were made into one or two of the regions listed above outside of MS before making a final, effective infusion into MS. This design was chosen to minimize the possibility that negative effects of control-site injections could arise from factors other than those directly related to the issue of anatomical site of action such as level of anesthesia or other physiological concerns. In all cases, if no effects were observed within 10 min after an infusion, a second infusion was performed. If no effects were observed within 15 min after the second infusion, the infusion was considered to be ineffective.
Infusions into striatum, 200–800 μm lateral to the lateral ventricle, did not elicit noticeable changes in either ECoG or HEEG. This indicates that diffusion of ISO into the ventricular system is not responsible for EEG activation observed after ISO infusions into MS. For infusions into the nucleus accumbens and lateral septum, only infusions closest to MS elicited EEG activation (see Fig. 3).
Effects of ISO and glutamate infusions into SI on ECoG and HEEG
In nine cases, 150 nl (n = 6) or 450 nl (n = 3) infusions of ISO were made into SI (see Fig.3). In all cases, these infusions did not noticeably alter baseline HEEG or ECoG as determined by visual inspection (Fig.4). The ineffectiveness of SI ISO infusions in altering EEG state might result from insufficient infusion volume or properties unique to this experimental preparation that interfere with the normal EEG modulatory action of SI neurons. To assess this possibility, infusions of glutamate (150 nl) were made into SI. As in previous studies (Metherate et al., 1992), glutamate infusions elicited robust bilateral activation of both ECoG and HEEG within 30–90 sec after initiation of the infusion (Fig. 4). Within the temporal resolution of the EEG measures, both ECoG and HEEG responses usually appeared to occur simultaneously. However, in a limited number of cases, SI infusions appeared to elicit ECoG activation 1–3 sec before HEEG activation.
Fig. 4.

Effects of ISO and glutamate (Glu) infusions made into SI on ECoG and HEEG. A, ECoG and HEEG before and after a 150 nl infusion of glutamate into SI. These infusions elicited robust activation of both ECoG and HEEG as demonstrated by the reduction of slow-wave activity in ECoG and the induction of theta-activity in HEEG. B, ECoG and HEEG taken from same experiment depicted in A before and after a 450 nl infusion of ISO.
Effects of bilateral MS infusions of the β-antagonist timolol
To determine the degree to which endogenous NE contributes to the maintenance of forebrain activation, the effects of bilateral infusions of the β-antagonist timolol into MS on ECoG and HEEG activity were examined (n = 8). Bilateral rather than unilateral infusions were examined, because in preliminary studies, unilateral MS timolol infusions did not elicit obvious changes in either ECoG or HEEG. This is consistent with our previous observation that under similar experimental conditions, bilateral suppression of LC neuronal discharge activity was necessary to elicit changes in forebrain EEG activity (Berridge et al., 1993b). In all of these experiments, halothane was carefully adjusted so that low-voltage, high-frequency activity in ECoG and theta activity in HEEG were consistently present but that no overt motor responses were observed to noxious stimulation such as tail pinch. This lightly anesthetized preparation was chosen because previous studies had demonstrated minimal effects of bilateral LC suppression on EEG when large-amplitude, slow-wave activity predominated (Berridge et al., 1993b). Often, several adjustments of the level of anesthesia were necessary to obtain these conditions. In some of the animals, it was not possible to maintain stable EEG activation. In these cases, short periods (1–2 min) of large-amplitude, slow-wave activity would appear intermittently. To ensure that these fluctuations were accurately represented in the data analyses, at least 30 min of baseline EEG data was collected before experimental manipulations were initiated, and long (5 min) EEG segments were used for PSA analyses. The concentration of halothane was not altered after initiation of data collection.
Under these conditions, bilateral infusion of timolol (3.75 μg/150 nl in each hemisphere) consistently resulted in the alteration of both ECoG and HEEG activity (Fig. 5). This concentration was chosen on the basis of pilot studies that demonstrated inconsistent EEG effects at concentrations substantially below this. ECoG changes consisted of a shift from predominantly desynchronized (high-frequency, low-amplitude) to large-amplitude, slow-wave activity. In the HEEG, theta-dominated activity was replaced with mixed-frequency activity. The onset of these EEG responses occurred within 3–30 min (median = 10 min) after the termination of the infusions. The latency between the initial and the maximal EEG responses, as estimated from visual inspection of the EEG trace, ranged from 2 to 10 min. The duration of these EEG responses ranged from 60 min to >120 min. In four of the eight experiments, the first obvious signs of recovery were observed before 120 min. However, in two of these cases, additional manipulations were then made, precluding the use of these animals in statistical analyses of EEG recovery epochs. In the remaining four experiments, recovery was not observed within 120 min after the infusions.
Fig. 5.

Effects of bilateral MS timolol infusions on ECoG and HEEG. Representative 40 sec epochs of ECoG and HEEG traces taken from a 5 min epoch used to compute PSA values in Table 2. Displayed are data taken before any infusions (Pre-Infusion), 15 min after bilateral MS vehicle infusions (Post-Vehicle), and 15 min after bilateral timolol infusions (Post-Timolol). Whereas bilateral vehicle infusions did not noticeably affect either ECoG or HEEG, bilateral timolol infusions increased the occurrence of slow-wave, large-amplitude activity in ECoG and substantially decreased the presence of theta activity in HEEG.
Bilateral vehicle infusions were made in seven of the above experiments 30–45 min before bilateral timolol infusions, following a within-subjects design. In these experiments, 15–30 min after bilateral vehicle infusions, the needles were removed and filled with timolol and reinserted into the cannulae. Fifteen minutes after insertion of the timolol-containing needles, an infusion was made into each hemisphere.
In all cases, vehicle infusions did not have consistent obvious effects on either ECoG or HEEG (see Fig. 5, Table 2). Unilateral infusion of a comparable dose (10–20 μg) of timolol directly into the lateral ventricles had no obvious effects on either ECoG or HEEG (data not shown). In four cases, the infusion needles were not successfully positioned bilaterally within MS (see Fig.6). In all of these cases, at least one of the infusion needles was positioned in the most posterior extent of MS, at the level of the decussation of the anterior commissure, in close proximity to portions of the bed nucleus of the stria terminalis. In these four experiments, no obvious effects on either ECoG or HEEG were observed (data not shown).
Table 2.
Effects of bilateral MS timolol infusions on EEG: mean absolute and relative power of ECoG and HEEG expressed as percentage of prevehicle infusion means
| Frequency | Absolute power | Relative power | ||
|---|---|---|---|---|
| Vehicle | Timolol | Vehicle | Timolol | |
| ECoG | ||||
| 0.3 –2.3 | 142 ± 38 | 346 ± 70** | 111 ± 13 | 170 ± 12** |
| 2.3 –6.8 | 127 ± 21 | 205 ± 33** | 109 ± 5 | 105 ± 5 |
| 6.8 –13.0 | 100 ± 8 | 129 ± 10 | 94 ± 9 | 71 ± 5** |
| 13.0 –20.0 | 94 ± 6 | 122 ± 9 | 91 ± 9 | 67 ± 6** |
| 20.0 –30.0 | 92 ± 3 | 100 ± 4 | 94 ± 12 | 59 ± 7** |
| 30.0 –40.0 | 93 ± 4 | 78 ± 11 | 95 ± 13 | 55 ± 7** |
| 40.0 –50.0 | 98 ± 7 | 93 ± 5 | 94 ± 14 | 54 ± 6** |
| HEEG | ||||
| 0.3 –2.3 | 117 ± 11 | 138 ± 7** | 113 ± 8 | 152 ± 8** |
| 2.3 –6.8 | 100 ± 3 | 72 ± 5** | 98 ± 5 | 79 ± 3** |
| 6.8 –13.0 | 109 ± 11 | 98 ± 7 | 104 ± 8 | 106 ± 5 |
| 13.0 –20.0 | 101 ± 5 | 102 ± 5 | 98 ± 3 | 111 ± 3** |
| 20.0 –30.0 | 103 ± 4 | 99 ± 3 | 101 ± 3 | 110 ± 3* |
| 30.0 –40.0 | 100 ± 4 | 87 ± 4* | 98 ± 6 | 97 ± 5 |
| 40.0 –50.0 | 100 ± 5 | 81 ± 4** | 100 ± 7 | 92 ± 5 |
Absolute and relative power of the subset of experiments (n = 7) for which 5 min preinfusion, postvehicle, and post-timolol EEG epochs were collected. Data are expressed as percentages of preinfusion means (±SEM) for ECoG and HEEG. *p < 0.05, **p < 0.01 significantly different from preinfusion mean. Statistical significance determined using a one-way ANOVA followed by Duncan’s multiple-range test.
Fig. 6.

Schematic diagram depicting effective and ineffective bilateral timolol infusion sites. Each symbol pair represents the left and right infusion sites for an individual experiment. Infusions placed bilaterally within the general region of MS increased ECoG and HEEG indices of sedation (EFFECTIVE). Cases in which either one infusion or both infusions were placed outside of MS did not alter ECoG/HEEG activity patterns (INEFFECTIVE). See Figure 3 legend for abbreviations. Schematic depicts three levels through MS separated by 250 μm (modified from Swanson, 1992).
PSA of the bilateral MS timolol-induced changes in EEG
PSA was conducted on a subset of animals (n = 7) for which 5 min prevehicle, postvehicle, and post-timolol EEG epochs were collected (see Table 2). EEG segments were taken immediately before vehicle infusions, 15 min after bilateral vehicle infusions, and 15–30 min after bilateral timolol infusions. Post-timolol epochs containing maximum EEG responses were selected on the basis of visual inspection. PSA demonstrated statistically significant effects of bilateral MS timolol infusions, but not vehicle, on ECoG and HEEG activity consistent with the qualitative observations described above. Thus, in ECoG, absolute power of the 0.3–2.3 and 2.3–6.8 Hz frequency bands was significantly increased. Relative power of the 0.3–2.3 Hz band was also increased, whereas relative power of the five highest frequency bands was decreased. In HEEG, absolute power and relative power were increased in the 0.3–2.3 Hz band and decreased in the 2.3–6.8 Hz (theta) frequency band. Absolute power in the 30.0–40.0 and 40.0–50.0 Hz frequency bands was decreased. A small, statistically significant increase in relative power of the 13.0–20.0 and 20.0–30.0 Hz frequency bands was also observed.
DBH immunoreactivity in MS
The distribution of noradrenergic fibers in the MS region was examined using immunohistochemical staining for DBH. At the anterior–posterior level at which the largest number of successful infusions were made, the highest concentration of DBH-like immunoreactive (DBH-LI) fibers was contained within the general region of MS (see Fig. 7). Within this area, DBH-LI was contained within moderately long, vertically or diagonally oriented fibers intermingled with shorter, randomly oriented, highly varicose terminal branches. Some vertically oriented thick fibers that ran parallel to the midline exhibited large round varicosities and occasional large terminal boutons. Laterally, toward the edge of the medial septum–diagonal band complex and just beyond, a rich network of highly varicose DBH fibers was observed. At the level shown in Figure7, a low to moderate density of fibers was seen in the region between the lateral edge of the medial septum and the nucleus accumbens core, probably contained within the shell of the nucleus accumbens. The density of these fibers rapidly diminished anteriorally.
Fig. 7.
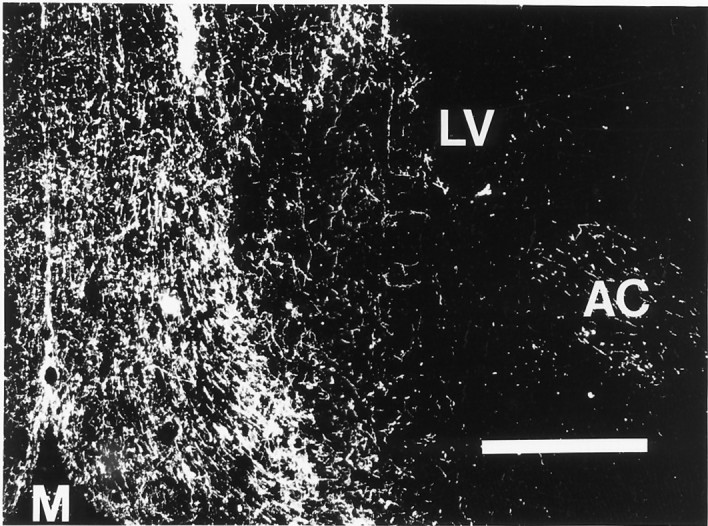
Dark-field photomicrograph of a coronal section through MS prepared for immunocytochemical localization of DBH. Note the high density of DBH-positive fibers in the vicinity of the medial septum–diagonal band area compared with the much lower density of fibers laterally (compare with Fig. 1 showing a typical infusion site).M, midline. Original magnification, 40×. Scale bar, 0.5 mm.
At slightly more rostral levels (∼0.5 mm rostral to Fig. 7), DBH-LI fibers were even more clearly concentrated within the boundaries of the medial septum and vertical limb of the diagonal band of Broca. The majority of DBH-positive fibers were vertically or diagonally oriented and exhibited occasional round or fusiform varicosities. Intermixed with these were a few highly varicose fibers with no obvious preferred orientation. Moving laterally toward the anterior commissure, only a few DBH-LI fibers were observed. In the anterior nucleus accumbens and the striatum, only rare DBH-LI fibers of passage were observed (data not shown). In more caudal sections, (∼0.6 mm caudal to Fig. 7) DBH-LI fibers were more widely distributed. MS exhibited many fine varicose DBH fibers with nearly random orientation, but the density of DBH-LI increased dramatically in the vicinity of the anterior commissure and the bed nucleus of the stria terminalis (data not shown).
EEG effects of atropine
In four experiments, the effects of the cholinergic antagonist atropine (50 mg/kg, i.v.) on MS ISO- and MS glutamate-induced ECoG and HEEG activation were examined. After intravenous saline infusions, ISO and glutamate infusions into MS elicited robust EEG activation. Ten minutes after intravenous atropine administration, neither ISO nor glutamate elicited EEG activation (data not shown). Atropine also blocked tail pinch-induced EEG activation. Thus, as described for urethane-anesthetized rats (Vanderwolf and Robinson, 1981; Buzsaki et al., 1983), blockade of cholinergic receptors blocks/attenuates EEG activation observed in response to a variety of manipulations in the halothane-anesthetized rat.
DISCUSSION
These results indicate that a region of the basal forebrain, situated either within or immediately lateral to MS, is a site at which NE acts to modulate forebrain EEG in the halothane-anesthetized rat through actions at β-receptors. Thus, 150 nl infusions of the β-agonist ISO into this region elicited robust, bilateral activation of HEEG/ECoG. Conversely, bilateral, but not unilateral, infusions of the β-antagonist timolol into this region decreased forebrain EEG indices of arousal in the lightly anesthetized preparation. Glutamate infusions into MS also elicited ECoG/HEEG activation, with a response latency shorter than that observed with ISO. Differences in response latency after ISO and glutamate could stem from differences in receptor mechanisms (ionotropic vs metabotropic), pharmacokinetic properties of these drugs, or differences in circuitry associated with glutamate- and β-receptor-bearing cells. As is the case for the EEG effects produced by manipulation of LC neuronal activity, the β-receptor-mediated EEG responses occurred only with rigorous control of the level of anesthesia. ISO-induced EEG activation occurred only when anesthesia was adjusted to permit tail pinch-induced EEG activation, whereas the β-antagonist increased EEG measures of sedation only when baseline EEG was in an activated state (lightly anesthetized).
A number of observations suggest that the drug-induced changes in EEG stem from actions at β-receptors. First, neither isoproterenol nor timolol appears to display substantial affinity for other receptors. Although certain β-antagonists display moderate affinity for serotonin receptors, the affinity of these drugs for serotonin receptors is substantially below that for β-receptors (Middlemiss, 1986). The low dose of both ISO and timolol used in these studies suggests that the primary action of these drugs was β-receptors. Second, the fact that opposite EEG responses were observed with agonist and antagonist infusions suggests that the EEG effects result from the opposing actions of these drugs at β-receptors. Finally, in previous studies, it was observed that both ICV propranolol (Berridge and Foote, 1991) and bilateral MS timolol (C. W. Berridge and S. L. Foote, unpublished observations) blocked/attenuated EEG activation induced by LC activation, indicating that both treatments prevent noradrenergic-mediated activation of forebrain EEG.
Site of action
A number of observations indicate that the infusion-induced changes in ECoG and HEEG stem from action of the infused drugs within the general region of MS. First, the relatively small infusion volume (150 nl) imposes a limit on the distance over which physiologically active drug concentrations will be maintained. Second, ISO infusions placed outside the immediate vicinity of MS did not alter EEG, indicating that EEG effects were not attributable to diffusion of drug into the ventricular system or into the core of the nucleus accumbens (Zaborsky et al., 1985) (for review, see Deutch et al., 1993). Finally, timolol infusions placed posterior to MS lacked EEG effects. Thus, the only region examined in which consistent EEG effects were observed after ISO and timolol infusions was MS and the immediately surrounding area. This region receives a relatively dense noradrenergic innervation (Segal, 1976; Gaspar et al., 1985; Vertes, 1988; Chang, 1989;Zaborszky, 1989) (see Fig. 7), the vast preponderance of which arise from LC (Zaborsky et al., 1991).
MS, as defined here, is an anatomically complex area containing neurons located within the medial septum, the vertical limb of the diagonal band of Broca, the islands of Calleja, portions of the lateral preoptic area, and the shell region of the nucleus accumbens. Infusions placed as far laterally to the shell region of the nucleus accumbens as effective MS infusions were placed medially did not elicit changes in EEG state. This suggests that the shell region of the accumbens is not the site at which β-receptors modulate EEG state. However, these experiments were not designed to differentiate between actions within the shell of the accumbens and the medial septum. Given that the posterior portion of the shell of the accumbens lies within close proximity to the effective infusion sites (Zaborsky, 1985; Deutch et al., 1993) and that it appears to receive a moderate noradrenergic innervation (C. W. Berridge, T. L. Stratford, S. L. Foote, and A. E. Kelley, unpublished observations), it is currently not possible to reach a definitive conclusion as to whether infusions did or did not act within the shell of the nucleus accumbens to influence forebrain EEG.
Potential circuitry underlying bilateral, simultaneous ECoG, and HEEG responses
Both SI and MS receive a dense innervation from LC (see above) and both have been implicated in the regulation of forebrain EEG. SI influences ECoG (Belardetti et al., 1977; Detari and Vanderwolf, 1987;Buzsaki et al., 1988; Metherate et al., 1992), whereas MS exerts a strong modulatory influence on HEEG (Buzsaki et al., 1983; Smythe et al., 1991). Thus, one plausible hypothesis tested in the present studies was that LC modulation of ECoG and HEEG is dependent on NE-induced modulation of SI and MS neuronal activity, respectively. Infusions of ISO into SI (150–450 nl) did not alter either ECoG or HEEG. The fact that 150 nl infusions of glutamate into SI elicited robust activation of ECoG and HEEG indicates the following: (1) the infusion volumes used in the current study were sufficiently large to elicit physiologically relevant effects in SI; and (2) modulation of SI neuronal activity results in modulation of forebrain EEG state in the halothane-anesthetized rat. The latter observation argues that the lack of EEG effects of ISO infusions in this region cannot be ascribed to a unique physiological property of the experimental preparation.
Noradrenergic receptors located within SI other than β-receptors might be involved in noradrenergic-dependent modulation of ECoG. However, the ability of ICV pretreatment with a β-antagonist to block EEG activation elicited by selective LC activation indicates that β-receptors are critically involved in LC-dependent activation of ECoG (Berridge and Foote, 1991). Combined, these observations suggest that SI is not a site at which NE exerts a strong modulatory influence on ECoG activity under these experimental conditions.
Within the limits of temporal resolution (∼1-2 sec), near simultaneous activation of ECoG and HEEG was observed after ISO and glutamate infusions into MS as well as glutamate infusions into SI. A number of possible substrates could support the coordinated activation of cortical and HEEG activity. First, reciprocal projections linking cortex and hippocampus could provide an anatomical substrate through which such coordination could be achieved (Van Hoesen et al., 1972;Rosene and Van Hoesen, 1977; Swanson, 1981). This would be consistent with the observation that in a limited number of cases, the HEEG responses preceded ECoG responses by one to many seconds after MS ISO or glutamate infusions, whereas occasionally ECoG responses were observed before HEEG responses after SI glutamate infusions. Second, there exists a prominent septocortical projection, primarily to cingulate cortex (Saper, 1984; Stewart et al., 1985; Marston et al., 1994). Thus, alterations in MS neuronal activity could simultaneously affect cortical and hippocampal activity through direct, monosynaptic projections. Finally, MS infusions could alter ECoG and HEEG via efferents to other regions involved in regulation of state such as hypothalamus, thalamus, or midbrain. Such efferents could be either direct projections to these regions (Meibach and Siegel, 1977; Swanson and Cowan, 1979; Cunningham et al., 1992) or indirect via hippocampal efferents (Swanson and Cowan, 1977; Walaas and Fonnum, 1980; Ino et al., 1988).
Cholinergic systems
Cholinergic neurons located within MS have been implicated in the regulation of HEEG theta activity (for review, see Buzsaki et al., 1983). Additional studies have indicated that the ratio of MS GABAergic to cholinergic neuronal activity may be a critical factor in this function (Colom et al., 1991). NE exerts a primarily inhibitory action on basal discharge activity of MS neurons (Segal, 1976). Consistent with these findings, we observed in a limited number of cases (n = 3, data not shown) that MS ISO infusions inhibited MS neuronal activity, including two neurons that appeared to meet the criteria for “theta-on” cells (Ford et al., 1989). Thus, it is unlikely that the EEG effects observed after ISO infusions into MS result from the activation of cholinergic neurons. If HEEG theta activity is dependent on the ratio of the activity between MS GABAergic and cholinergic neurons, ISO may induce HEEG theta activity through inhibitory actions on GABAergic neurons.
In urethane-anesthetized rats, systemic administration of the cholinergic antagonist atropine elicits a profound suppression of EEG activation (Vanderwolf and Robinson, 1981; Buzsaki et al., 1983). Similarly, we observed that in the halothane-anesthetized rat, atropine blocked HEEG/ECoG activation in response to tail pinch and MS ISO infusions. This could imply that enhanced cholinergic neurotransmission mediates the EEG effects observed in this study at a stage subsequent to the noradrenergic manipulations. However, similar inhibitory effects on EEG activation are observed after systemic or brainstem administration of clonidine and other adrenergic α2-agonists, which act to inhibit LC neuronal activity and NE release (De Sarro et al., 1987; Segal et al., 1988; Berridge and Foote, 1991; Correa-Sales et al., 1992), or after ICV administration of the noradrenergic β-antagonist propranolol in the halothane-anesthetized rat (Berridge and Foote, 1991). Further, inhibition of serotonergic neurotransmission (Vanderwolf, 1988) and blockade of dopaminergic D2-dopamine receptors (Hartmann, 1978; Trampus and Ongini, 1990) increases ECoG slow-wave activity. These observations suggest that normally occurring forebrain EEG activation is dependent on the simultaneous and concerted action of multiple ascending systems (Buzsaki et al., 1988; Steriade et al., 1990).
Conclusions
Previous studies demonstrated that selective enhancement of LC discharge rates increases EEG measures of arousal (Berridge and Foote, 1991), whereas bilateral suppression of LC activity increases EEG measures of sedation (Berridge et al., 1993b). Of direct relevance to the present report, these EEG-activating effects were blocked/attenuated with bilateral timolol infusions into MS (C. W. Berridge and S. L. Foote, unpublished observations). Together with the current observations, these results suggest that in the halothane-anesthetized rat, LC modulates EEG state via actions of NE at MS β-receptors. Because EEG state fluctuates with behavioral state, these observations suggest the possibility that LC terminals located within MS may modulate behavioral state.
The anesthetized preparation offers distinct advantages for experimentally addressing the question of whether, and at what site, noradrenergic systems modulate EEG state. This preparation facilitates the following: (1) electrically adequate EEG recordings; (2) stable baseline EEG activity; and (3) performance of small infusions in multiple brain sites using a within-subjects design. However, the use of the anesthetized preparation substantially limits the degree to which inferences can be made concerning modulation of behavioral state. This concern has motivated the studies conducted in the unanesthetized rat, which are described in the accompanying article (Berridge and Foote, 1996). Combined, these studies provide strong support for the hypothesis that the LC–noradrenergic system acts within the region of the basal forebrain containing MS to exert a potent modulatory influence on behavioral state.
Footnotes
This work was supported by Public Health Service Grant MH40008 (S.L.F.) and a grant from the University of Wisconsin Graduate School (C.W.B.).
Correspondence should be addressed to Dr. Craig W. Berridge, Psychology Department, University of Wisconsin, 1202 West Johnson Street, Madison, WI 53706-1611.
REFERENCES
- 1.Aston-Jones G, Bloom FE. Activity of norepinephrine-containing locus coeruleus neurons in behaving rats anticipates fluctuations in the sleep-waking cycle. J Neurosci. 1981a;1:876–886. doi: 10.1523/JNEUROSCI.01-08-00876.1981. [DOI] [PMC free article] [PubMed] [Google Scholar]
- 2.Aston-Jones G, Bloom FE. Norepinephrine-containing locus coeruleus neurons in behaving rats exhibit pronounced responses to non-noxious environmental stimuli. J Neurosci. 1981b;1:887–900. doi: 10.1523/JNEUROSCI.01-08-00887.1981. [DOI] [PMC free article] [PubMed] [Google Scholar]
- 3.Aston-Jones G, Chiang C, Alexinsky T. Discharge of noradrenergic locus coeruleus neurons in behaving rats and monkeys suggests a role in vigilance. Prog Brain Res. 1991;88:501–520. doi: 10.1016/s0079-6123(08)63830-3. [DOI] [PubMed] [Google Scholar]
- 4.Belardetti F, Borgia R, Mancia M. Proencephalic mechanisms of ECoG desynchronization in cerveau isole cats. Electroencephalogr Clin Neurophysiol. 1977;42:213–235. doi: 10.1016/0013-4694(77)90028-1. [DOI] [PubMed] [Google Scholar]
- 5.Berridge CW, Foote SL. Effects of locus Coeruleus activation on electroencephalographic activity in neocortex and hippocampus. J Neurosci. 1991;11:3135–3145. doi: 10.1523/JNEUROSCI.11-10-03135.1991. [DOI] [PMC free article] [PubMed] [Google Scholar]
- 6.Berridge CW, Foote SL. Enhancement of behavioral and electroencephalographic (EEG) indices of waking following stimulation of noradrenergic β-receptors within the medial septal region of the basal forebrain. J Neurosci. 1996;16:6999–7009. doi: 10.1523/JNEUROSCI.16-21-06999.1996. [DOI] [PMC free article] [PubMed] [Google Scholar]
- 7.Berridge CW, Bolen SJ, Foote SL. Modulation of forebrain EEG by medial septal noradrenergic β-receptors. Soc Neurosci Abstr. 1993a;19:1832. doi: 10.1523/JNEUROSCI.16-21-07010.1996. [DOI] [PMC free article] [PubMed] [Google Scholar]
- 8.Berridge CW, Page ME, Valentino RJ, Foote SL. Effects of locus coeruleus inactivation on electroencephalographic activity in neocortex and hippocampus. Neuroscience. 1993b;55:381–393. doi: 10.1016/0306-4522(93)90507-c. [DOI] [PubMed] [Google Scholar]
- 9.Buzsaki G, Leung LWS, Vanderwolf CH. Cellular bases of hippocampal EEG in the behaving rat. Brain Res Rev. 1983;6:139–171. doi: 10.1016/0165-0173(83)90037-1. [DOI] [PubMed] [Google Scholar]
- 10.Buzsaki G, Bickford RG, Ponomareff G, Thal LJ, Mandel R, Gage FH. Nucleus Basalis and thalamic control of neocortical activity in the freely moving rat. J Neurosci. 1988;8:4007–4026. doi: 10.1523/JNEUROSCI.08-11-04007.1988. [DOI] [PMC free article] [PubMed] [Google Scholar]
- 11.Chang HT. Noradrenergic innervation of the substantia innominata: a light and electron microscopic analysis of dopamine β-hydroxylase immunoreactive elements in the rat. Exp Neurol. 1989;104:101–112. doi: 10.1016/s0014-4886(89)80002-0. [DOI] [PubMed] [Google Scholar]
- 12.Colom LV, Nassif-Caudarella S, Dicson CT, Smythe JW, Bland BH. In vivo intrahippocampal microinfusion of carbachol and bicuculline induces theta-like oscillations in the septally deafferented hippocampus. Hippocampus. 1991;1:381–390. doi: 10.1002/hipo.450010406. [DOI] [PubMed] [Google Scholar]
- 13.Correa-Sales C, Rabin BC, Maze M. A hypnotic response to dexmedetomidine, an α2-agonist, is mediated in the locus coeruleus in rats. Anesthesiology. 1992;76:948–952. doi: 10.1097/00000542-199206000-00013. [DOI] [PubMed] [Google Scholar]
- 14.Cunningham JT, Nissen R, Renaud LP. Norepinephrine injections in diagonal band of Broca selectively reduce the activity of vasopressin supraoptic neurons in the rat. Brain Res. 1992;610:152–155. doi: 10.1016/0006-8993(93)91229-l. [DOI] [PubMed] [Google Scholar]
- 15.De Sarro GB, Ascioti C, Froio F, Libri V, Nistico G. Evidence that locus coeruleus is the site where clonidine and drugs acting at alpha-1- and alpha-2-adrenoceptors affect sleep and arousal mechanisms. Br J Pharmacol. 1987;90:675–685. doi: 10.1111/j.1476-5381.1987.tb11220.x. [DOI] [PMC free article] [PubMed] [Google Scholar]
- 16.Detari L, Vanderwolf CH. Activity of identified cortically projecting and other basal forebrain neurones during large slow waves and cortical activation in anaesthetized rats. Brain Res. 1987;437:1–8. doi: 10.1016/0006-8993(87)91521-6. [DOI] [PubMed] [Google Scholar]
- 17.Deutch AY, Bourdelais AJ, Zahm DS. The nucleus accumbens core and shell: accumbal compartments and their functional attributes. In: Kalivas PW, Barnes CD, editors. The mesolimbic motor circuit and its role in neuropsychiatric disorders. CRC; Boca Raton, FL: 1993. pp. 45–88. [Google Scholar]
- 18.Foote SL, Morrison JH. Extrathalamic modulation of neocortical function. Annu Rev Neurosci. 1987;10:67–95. doi: 10.1146/annurev.ne.10.030187.000435. [DOI] [PubMed] [Google Scholar]
- 19.Foote SL, Aston-Jones G, Bloom FE. Impulse activity of locus coeruleus neurons in awake rats and monkeys is a function of sensory stimulation and arousal. Proc Natl Acad Sci USA. 1980;77:3033–3037. doi: 10.1073/pnas.77.5.3033. [DOI] [PMC free article] [PubMed] [Google Scholar]
- 20.Foote SL, Bloom FE, Aston-Jones G. The nucleus locus ceruleus: new evidence of anatomical and physiological specificity. Physiol Rev. 1983;63:844–914. doi: 10.1152/physrev.1983.63.3.844. [DOI] [PubMed] [Google Scholar]
- 21.Ford RD, Colom LV, Bland BH. The classification of medial septum-diagonal band cells as theta-on or theta-off in relation to hippocampal EEG states. Brain Res. 1989;493:269–282. doi: 10.1016/0006-8993(89)91162-1. [DOI] [PubMed] [Google Scholar]
- 22.Gaspar P, Berger B, Alvarez C, Vigny A, Henry JP. Catecholaminergic Innervation of the septal area in man: immunocytochemical study using TH and DBH antibodies. J Comp Neurol. 1985;241:12–33. doi: 10.1002/cne.902410103. [DOI] [PubMed] [Google Scholar]
- 23.Hartmann E. Effects of psychotropic drugs on sleep: catecholamines and sleep. In: Lipton MA, DiMascio A, Killam KF, editors. Psychopharmacology: a generation of progress. Raven; New York: 1978. pp. 711–728. [Google Scholar]
- 24.Hobson JA, McCarley RW, Wyzinski PW. Sleep cycle oscillation: reciprocal discharge by two brainstem neuronal groups. Science. 1975;189:55–58. doi: 10.1126/science.1094539. [DOI] [PubMed] [Google Scholar]
- 25.Hobson JA, Lydic R, Baghdoyan HA. Evolving concepts of sleep cycle generation: from brain centers to neuronal populations. Behav Brain Sci. 1986;9:371–448. [Google Scholar]
- 26.Ino T, Itoh K, Kamiya H, Shigemoto R, Akiguchi I, Mizuno N. Direct projections of non-pyramidal neurons of Ammon’s horn to the supramammillary region in the cat. Brain Res. 1988;460:173–177. doi: 10.1016/0006-8993(88)91219-x. [DOI] [PubMed] [Google Scholar]
- 27.Marston HM, West HL, Wilkinson LS, Everitt BJ, Robbins TW. Effects of excitotoxic lesions of the septum and vertical limb nucleus of the diagonal band of Broca on conditional visual discrimination: relationship between performance and choline acetyltransferase activity in the cingulate cortex. J Neurosci. 1994;14:2009–2019. doi: 10.1523/JNEUROSCI.14-04-02009.1994. [DOI] [PMC free article] [PubMed] [Google Scholar]
- 28.McKinney M, Coyle JT, Hedreen JC. Topographic analysis of the innervation of the rat neocortex and hippocampus by the basal forebrain cholinergic system. J Comp Neurol. 1983;217:103–121. doi: 10.1002/cne.902170109. [DOI] [PubMed] [Google Scholar]
- 29.Meibach RC, Siegel A. Efferent connections of the septal area in the rat: an analysis utilizing retrograde and anterograde transport methods. Brain Res. 1977;119:1–20. doi: 10.1016/0006-8993(77)90088-9. [DOI] [PubMed] [Google Scholar]
- 30.Metherate R, Cox CL, Ashe JH. Cellular bases of neocortical activation: modulation of neural oscillations by the nucleus basalis and endogenous acetylcholine. J Neurosci. 1992;12:4701–4711. doi: 10.1523/JNEUROSCI.12-12-04701.1992. [DOI] [PMC free article] [PubMed] [Google Scholar]
- 31.Middlemiss DN. Blockade of the central 5-HT autoreceptor by β-adrenoceptor antagonists. Eur J Pharmacol. 1986;120:51–56. doi: 10.1016/0014-2999(86)90638-2. [DOI] [PubMed] [Google Scholar]
- 32.Page ME, Berridge CW, Foote SL, Valentino RJ. Corticotropin-releasing factor in the locus coeruleus mediates EEG activation associated with hypotensive stress. Neurosci Lett. 1993;164:81–84. doi: 10.1016/0304-3940(93)90862-f. [DOI] [PubMed] [Google Scholar]
- 33.Rosene DL, Van Hoesen GW. Hippocampal efferents reach widespread areas of cerebral cortex and amygdala in the rhesus monkey. Science. 1977;198:315–317. doi: 10.1126/science.410102. [DOI] [PubMed] [Google Scholar]
- 34.Saper CB. Organization of cerebral cortical afferent systems in the rat. II. Magnocellular basal nucleus. J Comp Neurol. 1984;222:313–342. doi: 10.1002/cne.902220302. [DOI] [PubMed] [Google Scholar]
- 35.Segal IS, Vickery RG, Walton BS, Dose VA, Maze M. Dexmedetomidine diminishes halothane anesthetic requirements in rats through a postsynaptic alpha2 adrenergic receptor. Anesthesiology. 1988;69:818–823. doi: 10.1097/00000542-198812000-00004. [DOI] [PubMed] [Google Scholar]
- 36.Segal M. Brain stem afferents to the rat medial septum. J Physiol (Lond) 1976;261:617–631. doi: 10.1113/jphysiol.1976.sp011577. [DOI] [PMC free article] [PubMed] [Google Scholar]
- 37.Smythe JW, Christie BR, Colom LV, Lawson VH, Bland BH. Hippocampal theta field activity and theta-on/theta-off cell discharges are controlled by an ascending hypothalamo-septal pathway. J Neurosci. 1991;11:2241–2248. doi: 10.1523/JNEUROSCI.11-07-02241.1991. [DOI] [PMC free article] [PubMed] [Google Scholar]
- 38.Steriade M, Buzsaki G. Parallel activation of thalamic and cortical neurons by brainstem and basal forebrain cholinergic systems. In: Steriade M, Biesold D, editors. Brain cholinergic systems. Oxford UP; Oxford: 1990. pp. 3–62. [Google Scholar]
- 39.Steriade M, McCarley RW (1990) Brainstem control of wakefulness and sleep. New York: Plenum.
- 40.Steriade M, Datta S, Pare D, Oakson G, Dossi RC. Neuronal activities in brain-stem cholinergic nuclei related to tonic activation processes in thalamocortical systems. J Neurosci. 1990;10:2541–2559. doi: 10.1523/JNEUROSCI.10-08-02541.1990. [DOI] [PMC free article] [PubMed] [Google Scholar]
- 41.Stewart DJ, Macfabe DF, Leung LWS. Topographical projection of cholinergic neurons in the basal forebrain to the cingulate cortex in the rat. Brain Res. 1985;358:404–407. doi: 10.1016/0006-8993(85)90994-1. [DOI] [PubMed] [Google Scholar]
- 42.Swanson LW. A direct projection from ammon’s horn to prefrontal cortex in the rat. Brain Res. 1981;217:150–154. doi: 10.1016/0006-8993(81)90192-x. [DOI] [PubMed] [Google Scholar]
- 43.Swanson LW (1992) Brain maps: structure of the rat brain. Amsterdam: Elsevier.
- 44.Swanson LW, Cowan WM. An autoradiographic study of the organization of the efferent connections of the hippocampal formation in the rat. J Comp Neurol. 1977;172:49–84. doi: 10.1002/cne.901720104. [DOI] [PubMed] [Google Scholar]
- 45.Swanson LW, Cowan WM. The connections of the septal region in the rat. J Comp Neurol. 1979;186:621–656. doi: 10.1002/cne.901860408. [DOI] [PubMed] [Google Scholar]
- 46.Timo-Iaria C, Negrao N, Schmidek WR, Hoshino K, Lobato de Menezes CE, Da Rocha TL. Phases and states of sleep in the rat. Physiol Behav. 1970;5:1057–1062. doi: 10.1016/0031-9384(70)90162-9. [DOI] [PubMed] [Google Scholar]
- 47.Trampus M, Ongini E. The D1 dopamine receptor antagonist SCH 23390 enhances REM sleep in the rat. Neuropharmacology. 1990;29:889–893. doi: 10.1016/0028-3908(90)90138-h. [DOI] [PubMed] [Google Scholar]
- 48.Vanderwolf CH. Cerebral activity and behavior: control by central cholinergic and serotonergic systems. Int Rev Neurobiol. 1988;30:225–341. doi: 10.1016/s0074-7742(08)60050-1. [DOI] [PubMed] [Google Scholar]
- 49.Vanderwolf CH, Robinson TE. Reticulo-cortical activity and behavior: a critique of the arousal theory and a new synthesis. Behav Brain Sci. 1981;4:459–514. [Google Scholar]
- 50.Van Hoesen GW, Pandya DN, Butters N. Cortical afferents to the entorhinal cortex of the rhesus monkey. Science. 1972;175:1471–1473. doi: 10.1126/science.175.4029.1471. [DOI] [PubMed] [Google Scholar]
- 51.Vertes RP. Brainstem afferents to the basal forebrain in the rat. Neuroscience. 1988;24:907–935. doi: 10.1016/0306-4522(88)90077-2. [DOI] [PubMed] [Google Scholar]
- 52.Walaas I, Fonnum F. Biochemical evidence for glutamtate as a transmitter in hippocampal efferents to the basal forebrain and hypothalamus in the rat. Neuroscience. 1980;5:1691–1698. doi: 10.1016/0306-4522(80)90088-3. [DOI] [PubMed] [Google Scholar]
- 53.Zaborszky L. Afferent connections of the forebrain cholinergic projection neurons, with special reference to monaminergic and peptidergic fibers. In: Frotscher M, Misgel U, editors. Central cholinergic synaptic transmission. Birkhauser; Basel: 1989. pp. 12–32. [DOI] [PubMed] [Google Scholar]
- 54.Zaborszky L, Alheid GF, Beinfeld MC, Eiden LE, Heimer L, Palkovits M. Cholecystokinin innervation of the ventral striatum: a morphological and radioimmunological study. Neuroscience. 1985;14:427–453. doi: 10.1016/0306-4522(85)90302-1. [DOI] [PubMed] [Google Scholar]
- 55.Zaborszky L, Cullinan WE, Braun A. Afferent to basal forebrain cholinergic projection neurons: an update. In: Napier TC, editor. The basal forebrain. Plenum; New York: 1991. pp. 43–100. [DOI] [PubMed] [Google Scholar]