

Abstract
These studies tested the hypothesis that survival-promoting effects of neurotrophins on basal forebrain cholinergic neurons are enhanced under stress. Septal neurons from embryonic day 14–15 rats exposed for 10–14 d to neurotrophin [nerve growth factor (NGF), brain-derived neurotrophic factor (BDNF), neurotrophin-3 (NT-3), or neurotrophin-4 (NT-4), each at 100 ng/ml] showed a two- to threefold increase in choline acetyltransferase (ChAT) activity, with little evidence of synergistic interactions. Neurotrophins produced no significant increase in the survival of total or acetylcholinesterase (AChE)-positive neurons at moderate plating density (1200–1600 cells/mm2). However, with very low plating densities (2–28 cells/mm2) BDNF, NT-3, and NT-4 (but not NGF) increased total neuronal survival, and BDNF increased survival of AChE-positive neurons.
NGF and BDNF enhanced ChAT activity and survival of cholinergic neurons after a 24 hr hypoglycemic stress, even when added 1 hr after stress onset. All four tested neurotrophins increased total neuronal survival after hypoglycemic stress. These results suggest that neurotrophins are important for preservation of central cholinergic function under stress conditions, with different neurotrophins protecting against different stresses. The stress-associated survival-promoting effects of neurotrophins were not limited to the cholinergic subpopulation.
Keywords: basal forebrain, septum, central cholinergic neurons, neurotrophins, hypoglycemia, stress protection, nerve growth factor, brain-derived neurotrophic factor, neurotrophin-3, neurotrophin-4, choline acetyltransferase, neuronal survival
Neurotrophins have trophic effects on a variety of peripheral and central neurons, including the cholinergic neurons of the basal forebrain that project to hippocampus and cerebral cortex (for review, see Lindsay et al., 1994). The trophic effects of nerve growth factor (NGF) on these neurons in vivo and in vitro include increasing the activity of the acetylcholine (ACh)-synthesizing enzyme ChAT and increasing expression of both the low-affinity (p75NTR) and high-affinity (TrkA, p140trk) NGF receptors and of ChAT and TrkA mRNA (for review, see Whittemore and Seiger, 1987; Hartikka and Hefti, 1988;Hatanaka et al., 1988; Cavicchioli et al., 1989; Higgins et al., 1989;Alderson et al., 1990; Holtzman et al., 1992; Li et al., 1995). Most of NGF’s trophic effects are thought to be exerted via TrkA, a tyrosine kinase, or by TrkA working in concert with p75NTR receptors (Hempstead et al., 1991; Kaplan et al., 1991; Klein et al., 1991a; Jing et al., 1992; Meakin et al., 1992; Hantzopoulos et al., 1994). BDNF exerts similar effects on basal forebrain cholinergic neurons in vitro (Alderson et al., 1990), probably via a different tyrosine kinase, TrkB (p145) (Klein et al., 1991b; Soppet et al., 1991; Squinto et al., 1991). Neurotrophin-4 (NT-4; or NT-4/5) also activates TrkB receptors (Berkemeier et al., 1991; Klein et al., 1992; Ip et al., 1992) and increases basal forebrain ChAT activity (Friedman et al., 1993). NT-3, which acts with highest affinity on TrkC receptors (p145trkC) (Lamballe et al., 1991) also increases ChAT activity in vitro (Friedman et al., 1993).
Studies of the effects of neurotrophins on survival of basal forebrain cholinergic neurons in vitro and in vivo have yielded seemingly contradictory results. Several laboratories have reported that NGF increases the number of ChAT-immunoreactive or AChE-positive neurons in embryonic septal cultures (Hartikka and Hefti, 1988; Grothe et al., 1989; Alderson et al., 1990; Svendsen et al., 1994), but we and others have found no effect of NGF or of antibodies against NGF on in vitro survival of embryonic and/or neonatal cholinergic neurons (Hefti et al., 1985; Hatanaka et al., 1988; Nonner et al., 1992, 1993, 1994; Friedman et al., 1993). Intracerebral injection of NGF reduces neuronal atrophy and increases the number of septal cholinergic neurons detected after transection of the septo-hippocampal tract (Gage et al., 1986, 1988; Hefti, 1986;Williams et al., 1986; Kromer, 1987; Hagg et al., 1989; Wilcox et al., 1995). However, NGF is not required for in vivo survival of unlesioned neurons, because basal forebrain cholinergic neurons persist in mutant mice lacking NGF or TrkA (Crowley et al., 1994; Smeyne et al., 1994).
BDNF, NT-3, and NT-4 have also been reported to enhance in vitro survival of basal forebrain cholinergic neurons (Alderson et al., 1990; Friedman et al., 1993). Intracerebral injection of BDNF reduces the loss of ChAT immunostaining in the medial septum after transection of cholinergic axons in the fimbria (Knusel et al., 1992;Morse et al., 1993).
A hypothesis that might help reconcile some of the divergent findings in this field is that neurotrophins enhance survival of basal forebrain cholinergic neurons primarily under stress conditions. We tested this hypothesis by subjecting cultured septal neurons to low-density and hypoglycemic stresses, and we found that the survival-promoting effects of neurotrophins were indeed greater during stress.
MATERIALS AND METHODS
Cell culture. The septal region was dissected from embryonic day 14 and 15 (E14–E15) Sprague Dawley rats (Charles River Laboratories, Wilmington, MA) and dissociated by gentle trituration. Dissociated cells were plated in a defined culture medium (N5) (Kawamoto and Barrett, 1986) supplemented with an acid-stable 55 kDa fraction of horse serum (1 mg/ml protein) prepared as described byKaufman and Barrett (1983). In this serum fraction, embryonic central neurons (including cholinergic neurons) survive longer and non-neuronal cells proliferate more slowly than in media supplemented with whole serum. Bioassays described in Nonner et al. (1992, 1993) demonstrated that this serum fraction contains no detectable neurotrophin or basic fibroblast growth factor bioactivity.
Cultures to be assayed for ChAT activity or for neuronal survival using the MTT or Alamar Blue assay (see below) were plated into polylysine-coated 96-well plates at a standard density of 1200–1600 cells/mm2. Cultures to be assayed for neuronal survival using cell counts were plated into polylysine-coated Terasaki microculture dishes at this or a specified lower density. For the very-low-density experiments of Figures 4 and 5, 2, 3, 4, 5, 6, 7, 8, 9, 10, 11, 12, 13, 14, 15, 16, 17, 18, 19, 20, 21, 22, 23, 24, 25, 26, 27, 28 cells/mm2 were plated into Terasaki microculture plates and bathed in N5 medium containing an increased concentration of the 55 kDa serum fraction (4 mg/ml protein), as described in Nonner et al. (1992). No antibiotics or mitotic inhibitors were used.
Fig. 4.

Neurotrophin effects on survival of neurons plated at very low density. Ordinate plots the percentage (mean ± SEM) of neurons surviving as a function of time after plating in control medium (circles) or with addition of 100 ng/ml NGF (diamonds), BDNF (filled squares), NT-4 (filled triangles), or NT-3 (×). Survival in NT-3 significantly exceeded that in control medium at days 7, 10, and 14 (p < 0.05, Dunnett’s test). The increased survival in BDNF and NT-4 was statistically significant when data from days 7–14 were pooled (p < 0.05). These data came from 110 culture wells with a mean plating density of 13.9 ± 0.43 cells/well, with at least 12 wells per treatment. The medium in these experiments and those of Figure 5contained an increased concentration of the neuronal survival-promoting 55 kDa serum fraction.
Fig. 5.

Neurotrophin effects on survival of total neurons (open bars) and AChE-positive neurons (hatched bars) plated at very low density. Cultures were maintained in the indicated neurotrophin or neurotrophin combinations (each at 100 ng/ml) for 14 d in vitro. Data are normalized to survival measured in sister cultures maintained throughout in control medium: in these cultures, the total number of neurons per microwell ranged from 1.15 ± 0.14 to 4.84 ± 0.32 (mean 2.56 ± 0.11 in 391 microwells), and the number of AChE-positive neurons per microwell ranged from 0.71 ± 0.16 to 1.33 ± 0.33 (mean 1.01 ± 0.09 in 152 microwells). Initial plating densities ranged from 2.43 ± 0.07 to 25.5 ± 2.1 (mean 8.96 ± 0.25) cells per microwell (981 microwells). Each bar shows the mean ± SEM of at least 36 microwells (total of 1034 microwells for total neurons and 682 microwells for AChE-positive neurons, from 14 separate platings). *, Significant difference from control atp ≤ 0.05 (Dunnett’s test).
Fig. 2.

ChAT activity of E15 septal cultures exposed sequentially to various neurotrophins (each at 100 ng/ml) over 14 d in vitro. The first and second symbols on the abscissa indicate the treatment during the first and second week, respectively; for example, C-NT4 indicates cultures exposed to control medium (no exogenous neurotrophins) during the first week, and to NT-4 (NT4) during the second week. Treatments are grouped according to the neurotrophin present during the second week. ChAT activity is normalized to that measured in sister cultures maintained throughout in control medium (C-C). These control activities ranged from 0.92 ± 0.09 to 1.94 ± 0.09 (mean 1.29 ± 0.05) pmol ACh/min/culture (n = 78). All cultures were washed with control medium between the first and second treatments. Plotted data show the results of three separate experiments including a total of 536 culture wells. Each bar gives the mean ± SEM of at least 16 culture wells.
Fig. 3.

Neurotrophin effects on ChAT activity (A) and survival of AChE-positive (B) and total (C) neurons as a function of plating density. Densities ranged from 25 to 100% of control, where control = 1200–1600 cells/mm2. Cultures were maintained 10 din vitro. Each neurotrophin was present at 100 ng/ml. All variables are plotted relative to those measured in sister cultures plated at the same density and maintained throughout in control medium. Control activities in A were (pmol ACh/min/culture, mean ± SEM) 0.03 ± 0.01 (n = 14 wells) for 25% density, 0.32 ± 0.04 (n = 14 wells) for 50% density, and 1.14 ± 0.02 (n = 16 wells) for 100% density. Control AChE-positive counts inB were (cells/mm2) 1.21 ± 0.24 (n = 17 wells) for 25% density, 5.16 ± 0.37 (n = 31 wells) for 50% density, and 8.38 ± 0.43 (n = 40 wells) for 100% density. Control total neuronal counts in C were (cells/mm2) 57.9 ± 4.1 (n = 28 wells) for 25% density, 282.7 ± 23.5 (n = 39 wells) for 50% density, and 776.8 ± 19.3 (n = 25 wells) for 100% density. *, Significant difference from control atp ≤ 0.05, Student–Newman–Keuls test. These results summarize three separate experiments, and each bar represents at least 12 culture wells.
Fig. 6.

Neurotrophin effects on neuronal survival in sister cultures exposed to 24 hr zero-glucose stress. Stress only equals exposure to hypoglycemic stress with no added neurotrophin. NT during stress equals exposure to indicated neurotrophin (100 ng/ml) throughout the stress. No stress equals exposure to normal glucose concentration throughout. All cultures were maintained in control (normoglycemic) medium with no exogenous neurotrophin for 2 weeks before the stress, and in control medium containing NGF for 1 week after the stress. *, Significant difference from stress-only controls (p < 0.05 for NT-4, p < 0.01 for all others; Dunnett’s test). Bars indicate mean ± SEM for two to nine culture wells.
Fig. 7.

Neurotrophin effects on ChAT activity in sister cultures after hypoglycemic stress. Cultures were maintained for 2 weeks in control medium (no exogenous neurotrophins) and then exposed to 55 μm glucose in the presence or absence of the indicated neurotrophin (100 ng/ml). During the poststress week before assay, cultures were maintained in the normal complete culture medium containing the indicated neurotrophin. No stress cultures were maintained throughout in normoglycemic media and exposed to NGF during the poststress week. *, Significant difference from stress-only controls for that neurotrophin (p < 0.01, Student’s paired t test). Bars indicate mean ± SEM for five to six culture wells. ChAT activity is expressed as pmol ACh/min/culture.
Fig. 8.

Effect of timing of neurotrophin addition on ChAT activity after hypoglycemic stress. Numbers on abscissa indicate time of neurotrophin addition relative to onset of a 24 hr exposure to 55 μm glucose: 0 = neurotrophin addition at stress onset, −24 = neurotrophin presence during the 24 hr preceding the stress, −24+0 = neurotrophin present both 24 hr before and throughout the stress, and 1 and 6 = neurotrophin addition 1 or 6 hr after stress onset, respectively. ChAT activity is normalized relative to that measured in sister cultures exposed to hypoglycemic medium lacking exogenous neurotrophin (0.68 ± 0.04 pmol ACh/min/culture, 248 wells). The ChAT activity of unstressed sister cultures was 5.08 ± 0.5 times greater than that of stress-only controls (n = 155 wells). All cultures were maintained for 2 weeks in control medium lacking exogenous neurotrophin before the stress and exposed to neurotrophin (usually NGF) during the poststress week before assay. *, Significant difference from control atp ≤ 0.05. Each point represents data from 12–132 culture wells in 2–14 experiments.
Fig. 9.
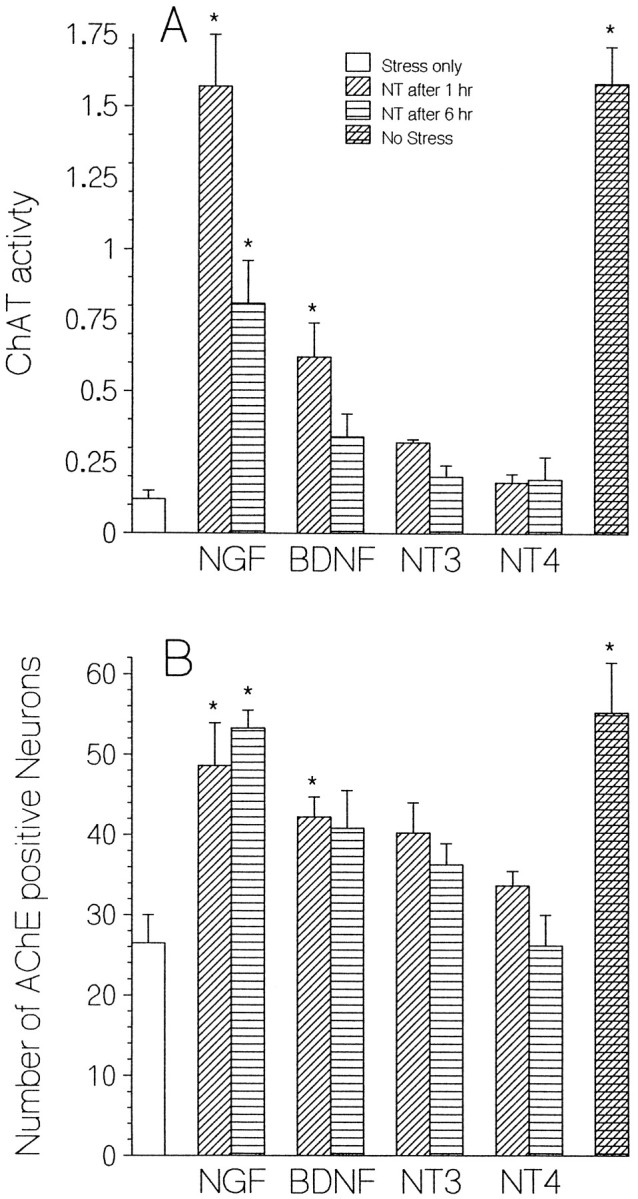
Effect of delayed addition of neurotrophin on ChAT activity (A) and survival of AChE-positive neurons (B) after hypoglycemic stress. Sister cultures were exposed for 24 hr to 55 μm glucose in the absence of exogenous neurotrophins (stress only; open bar) or in the presence of the indicated neurotrophin added 1 hr (diagonal stripes) or 6 hr (horizontal stripes) after stress onset. The far right bar in each histogram indicates values for controls maintained throughout in normal glucose (no stress). Pre- and poststress protocols are as in Figure 8. *, Significant difference from stress-only controls atp ≤ 0.05 (Dunnett’s test). ChAT activity is measured as pmol ACh/min/culture; survival is measured as AChE-positive neurons per culture well (1.43 mm2). Bars inA and B indicate mean ± SEM from 7–12 and 5–8 culture wells, respectively.
Tested neurotrophins were rHu-NGF, BDNF (from Chinese hamster ovary cells) and rHu-met-BDNF, NT-3 (from Escherichia coli) and rHu-NT-3, and NT-4 (from E. coli), generously supplied by Dr. Ron Lindsay (Regeneron Pharmaceuticals, Tarrytown, NY). The alternate forms of BDNF and NT-3 yielded comparable results. Most experiments involving NGF used the 7S form (MW ∼ 133 kDa; Sigma, St. Louis, MO), a complex that includes two β monomers. This 7S form was more effective than the monomer form available to us when these experiments were initiated. Figure 1 shows that, when normalized for the number of β monomers, 7S NGF increased ChAT activity about as effectively as rHu-NGF, which became available to us late in the course of these experiments. Unless otherwise specified, neurotrophins at 100 ng/ml were added 1 hr after plating and were replenished when fresh medium was added at 6–7 d intervals. This concentration of 7S NGF contains ∼1.5 nm β monomer (active dimer concentration ≤ 0.75 nm). This concentration of rHu-NGF and the other neurotrophins (MW ∼ 13.5 kDa) corresponds to a monomer concentration of ∼7.4 nm(active dimer concentration ≤ 3.7 nm). These concentrations would be expected to fully activate Trk receptors, which have Kd values of ∼10−11m for their specific neurotrophin ligands (Rodríguez-Tébar et al., 1992). All other chemicals were from Sigma.
Fig. 1.

Dose–response curves for neurotrophin enhancement of ChAT activity (expressed as pmol ACh/min/culture). E15 septal cultures were maintained 10 d in medium containing 0, 1, 10, or 100 ng/ml exogenous NGF (7S NGF, filled circles; rHu-NGF, squares), rHu-met-BDNF (open circles), NT-3 (×), or NT-4 (triangles). Concentrations greater than zero are plotted on a logarithmic scale as the molar concentration of the β monomer; 1–100 ng/ml corresponds to 0.015–1.5 nm 7S NGF and 0.074–7.4 nm of all other neurotrophins. Assays used two sets of sister cultures, one set for BDNF, NT-3, and NT-4 (total of 78 culture wells for BDNF, 51 for NT-3, and 34 for NT-4), the other set for the two forms of NGF (34 culture wells for 7S NGF, 32 for rHu-NGF). Each point represents the mean ± SEM of at least eight culture wells.
Assays for neuronal survival and cholinergic properties.Total neuronal survival was determined by counting the number of phase-bright, round cell bodies with intact processes and/or by using the MTT assay described by Manthorpe et al. (1986) or the Alamar Blue assay (protocols and reagents were from Alamar Biosciences, Sacramento, CA).
Only 1–13% of cultured basal forebrain neurons are cholinergic (Hartikka and Hefti, 1988; Alderson et al., 1990; Shingai et al., 1990;Nonner et al., 1993; Jonakait et al., 1994). Cholinergic neurons were identified by histochemical staining for AChE using the procedure ofTago et al. (1986), which uses acetylthiocholine (iodide salt) and diaminobenzidine as substrates. Tetraisopropyrophosphoramide (10−5m) was added 30 min before and during incubation to block nonspecific esterases. No staining was seen in control wells when acetylthiocholine was omitted from, or when 1 mm eserine was added to, the incubation medium. AChE staining (rather than ChAT immunostaining) was used to identify cholinergic neurons because ChAT immunostaining usually requires high ChAT activities (Hefti et al., 1985; Vantini et al., 1989). Studiesin vivo and in vitro have demonstrated that in the septum almost all ChAT-positive septal neurons are AChE-positive and that 82–94% of AChE-positive neurons are also ChAT-positive (Eckenstein and Sofroniew, 1983; Levey et al., 1983; Hefti et al., 1985; Nakajima et al., 1985).
ChAT activity was assayed after 10–14 d in vitro (unless otherwise specified) using the method of Fonnum (1969), as detailed inKaufman and Barrett (1983).
Hypoglycemic stress. Hypoglycemic stress was applied after cultures had been grown for 2 weeks in control culture medium lacking exogenous neurotrophins. Cultures were washed at least three times in medium containing normal salts (in mm: 125 NaCl, 2.7 KCl, 1.5 MgCl2, 0.05 MgSO4, 2 CaCl2, 0.83 NaH2PO4, 24 NaHCO3), 1 mg/ml bovine serum albumin, and reduced glucose (0–55 μm; see Results) and maintained in this hypoglycemic medium for 24 hr. During this stress period, test cultures were exposed to one of the four neurotrophins (100 ng/ml), whereas stress-only sister cultures were exposed to hypoglycemic medium without exogenous neurotrophins. Each experiment also included unstressed control sister cultures that were washed as frequently as the stressed cultures, but exposed to neurotrophin-free, normoglycemic salt solution during the time that sister cultures were hypoglycemic. Neurotrophins were added to test cultures at the onset of the hypoglycemic stress, except in the experiments of Figures 8 and 9, in which we varied the time of neurotrophin addition.
After the 24 hr hypoglycemic stress, all cultures were washed and then maintained in normal culture medium (containing 5.5 mmglucose as well as the 55 kDa serum fraction) plus neurotrophin for 1 week before ChAT activity and neuronal survival were measured. This poststress exposure to neurotrophin was included to ensure that all surviving cholinergic neurons would be detected by the AChE stain and to ensure detectable ChAT activities. The neurotrophin present during the poststress period was either NGF (Figs. 6, 8, 9) or the neurotrophin to which the cultures were exposed during the hypoglycemic stress (Fig. 7). Results shown in Figure 7 indicated that the identity of the poststress neurotrophin had no significant effect on ChAT activities measured after hypoglycemia. NGF was used as the poststress neurotrophin for measurements of neuronal survival after hypoglycemia, because results shown in Figures 3, 4, 5 indicated that NGF was the only tested neurotrophin that had no effect on neuronal survival in normoglycemic medium for any cell density. Thus, any observed effects on neuronal survival would be attributable to the neurotrophin present during (rather than after) the hypoglycemic stress (see also Table4).
Table 4.
Comparison of effects on neuronal survival of NGF exposure during and after hypoglycemic stress
| Treatment during stress | Neurotrophin after stress | Neuronal survival (%) |
|---|---|---|
| None | None | 14.8 ± 4.72 (9) |
| None | NGF | 28.6 ± 3.84 (6) |
| NGF | None | 60.5 ± 5.12 (13)* |
| NGF | NGF | 65.5 ± 6.45 (9)* |
Hypoglycemic stress protocol as described in Materials and Methods. Total neuronal survival expressed as a percentage (mean ± SEM) of the Alamar Blue reduction measured in nonstressed sister cultures. Number of culture wells for each treatment is indicated in parentheses. *, Significant difference from survival measured in cultures with no exogenous neurotrophin during the stress (p < 0.01, Dunnett’s test).
Statistical analysis. Figures and tables show mean ± SEM. Tests for statistical significance included ANOVA followed by the Student–Newman–Keuls test and Dunnett’s test (for comparison of multiple experimental treatments to a common control value). In cases in which paired comparisons were appropriate (Fig. 7), Student’s paired t test and/or Welch’s nonparametric test were used. p ≤ 0.05 was considered significant.
RESULTS
Enhancement of ChAT activity by neurotrophins presented singly, in combination, or sequentially
Initial experiments tested whether the various tested neurotrophins increase ChAT activity via independent or similar mechanisms. Figure 1 plots the concentration dependence of neurotrophin enhancement of ChAT activities measured in cultures plated at standard density and exposed for 10 d to 1–100 ng/ml 7S NGF, rHu-NGF, BDNF, NT-3, or NT-4. In these experiments, the effects of recombinant NGF, BDNF, and NT-4 saturated at ∼10 ng/ml (0.74 nm), with higher concentrations of NT-3 (50–100 ng/ml) required to yield a maximal enhancement (see also Table 1). The dose–response relationships for NGF and BDNF resemble those published by Alderson et al. (1990) with respect to concentration range and maximal stimulation (two- to threefold). A higher concentration of these neurotrophins (1000 ng/ml; data not shown) yielded ChAT activities substantially lower than those obtained at 100 ng/ml. Table1 summarizes ChAT activities measured in multiple experiments with neurotrophin concentrations ranging from 10 to 100 ng/ml, normalized with respect to ChAT activities measured in sister cultures not exposed to exogenous neurotrophins. These averaged results indicate that NGF (7S) and BDNF usually enhanced ChAT activity more than NT-3 or NT-4.
Table 1.
Effects of different concentrations and combinations of neurotrophins on ChAT activity
| Treatment | 10 ng/ml | 50 ng/ml | 100 ng/ml |
|---|---|---|---|
| NGF | 2.30 ± 0.18 (31) | 3.00 ± 0.39 (18) | 3.01 ± 0.21 (47) |
| BDNF | 2.40 ± 0.21 (34) | 2.71 ± 0.29 (18) | 2.87 ± 0.17 (79) |
| NT-3 | 1.35 ± 0.19 (24) | 2.01 ± 0.16 (29) | 2.18 ± 0.78 (99) |
| NT-4 | 1.61 ± 0.14 (18) | 1.95 ± 0.19 (17) | 2.15 ± 0.15 (20) |
| NGF+BDNF | 2.49 ± 0.22 (19) | 2.90 ± 0.15 (19) | 2.82 ± 0.23 (17) |
| NGF+NT-3 | 1.43 ± 0.32 (24) | 2.88 ± 0.14 (19) | 2.69 ± 0.21 (17) |
| NGF+NT-4 | 2.66 ± 0.24 (14) | 3.45 ± 0.35 (17) | 3.0 ± 0.37 (14) |
| BDNF+NT-3 | 2.51 ± 0.23 (18) | 2.12 ± 0.15 (19) | 2.39 ± 0.21 (17) |
| BDNF+NT-4 | 1.69 ± 0.14 (13) | 2.67 ± 0.27 (18) | 2.96 ± 0.21 (13) |
| NT-3+NT-4 | 1.59 ± 0.13 (14) | 2.50 ± 0.31 (20) | 2.67 ± 0.22 (13) |
| NGF+BDNF+ NT-3 | 2.28 ± 0.24 (19) | 2.77 ± 0.23 (19) | 2.61 ± 0.67 (22) |
| NGF+BDNF+ NT-3+NT-4 | 2.79 ± 0.27 (14) | 4.31 ± 0.75 (12) | 4.46 ± 0.77 (15) |
Cultures were exposed to the indicated neurotrophin(s) for 10 d. ChAT activities are normalized to those measured in sister cultures maintained in the absence of exogeneous neurotrophins, which averaged 1.03 ± 0.03 pmol ACh/min/culture (n = 15 experiments, total of 155 culture wells). Values are mean ± SEM of the (treatment/control) ratio, with at least two separate experiments for each combination. The total number of culture wells is given in parentheses. The combination of all four neurotrophins (each at 50 ng/ml) yielded a higher ChAT activity than any tested single, double, or triple neurotrophin combination (p < 0.01, Student–Newman–Keuls test).
Table 1 also shows the effect of various neurotrophin combinations on normalized ChAT activity. Pairs of neurotrophins thought to act via different Trk receptors (e.g., NGF+BDNF, NGF+NT-3, NGF+NT-4, BDNF+NT-3, NT-4+NT-3) were no more effective than the pair of neurotrophins thought to act via the same TrkB receptor (BDNF+NT-4), and none of these pairwise combinations was more effective than NGF or BDNF alone. These results suggest that these four neurotrophins all act on the same cholinergic neurons via mechanisms that overlap at some step(s). However, addition of NT-4 to a mixture of NGF, BDNF, and NT-3 (each at 50–100 ng/ml) produced a 4.3- to 4.4-fold increase, greater than the 2.6- to 2.8-fold increase produced by the combination of NGF, BDNF, and NT-3. This result is surprising, because the triple combination would be expected to saturate TrkA, TrkB, and TrkC receptors.
Figure 2 plots ChAT activities measured after pairs of neurotrophins were added sequentially, e.g., 1 week in NGF followed by 1 week in BDNF (abbreviated NGF-BDNF on abscissa). For any given neurotrophin present during the first week, ChAT activities were always greater when NGF was present during the second week (p < 0.01, Student–Newman–Keuls multiple comparisons test). This finding may be related to the report of Knusel et al. (1990, 1991), who found that a 3 d exposure to NGF produced a greater percentage enhancement of ChAT activity when applied at late (≥3 d after plating) than at earlier times in vitro. This enhanced response to NGF at later times may be attributable to increased expression of NGF receptors by cholinergic neurons at these later times, because of neuronal maturation, neuronal interactions, and/or enhancement of receptor expression by exogenous or endogenously produced neurotrophins. NGF increases expression of TrkA receptors in basal forebrain cholinergic neurons (Holtzman et al., 1992) and is produced within the basal forebrain in vivo (Saporito and Carswell, 1995) and at low levels in vitro (Roback et al., 1992; Nonner et al., 1993). Both NGF and BDNF increase expression of p75NTR receptors (Cavicchioli et al., 1989; Higgins et al., 1989; Alderson et al., 1990).
Another interesting result in Figure 2 concerns the reversibility of neurotrophin enhancement of ChAT activity. Cultures exposed to NGF during the first week and to control medium during the second (NGF-C) had ChAT activities similar to those of cultures maintained throughout in control medium, whereas cultures exposed to BDNF during either the first or the second week showed similar enhancement of ChAT activity (compare BDNF-C to C-BDNF). This result suggests that the ChAT enhancement produced by NGF may be more rapidly reversible than that produced by BDNF (see also Nonner et al., 1993). Table 2 shows the results of an experiment supporting this interpretation. Here ChAT activity was assayed in sister cultures after 1 or 2 week exposure to control medium, NGF, or BDNF. Cultures assayed after a 1 week exposure to NGF had a ChAT activity (pmol ACh/min/culture) of 2.69, whereas cultures similarly exposed to NGF during the first week but assayed after an additional week in control medium had a ChAT activity of only 1.71, not significantly different from the activity of 1.50 measured in cultures exposed only to control medium for 2 weeks. In contrast, there was relatively little difference between the ChAT activities of cultures exposed to BDNF for 1 or 2 weeks, in agreement with results in Figure 2.
Table 2.
ChAT activity after 1 or 2 wk exposure to NGF or BDNF
| Treatment | ChAT activity (pmol/min/culture) |
|---|---|
| 1 week | |
| C | 0.92 ± 0.02 (8) |
| NGF | 2.69 ± 0.14 (8)* |
| BDNF | 1.66 ± 0.03 (8)* |
| 2 weeks | |
| C-C | 1.50 ± 0.11 (7) |
| NGF-C | 1.71 ± 0.11 (7) |
| NFG-NGF | 4.20 ± 0.07 (8)* |
| BDNF-C | 1.73 ± 0.11 (8) |
| BDNF-BDNF | 2.09 ± 0.12 (8)* |
For 2 week cultures, the first and second terms in the pair indicate the treatment during the first and second week, respectively (C = control medium lacking exogenous neurotrophin). All data were obtained from sister cultures, with the number of culture wells indicated in parentheses. *, Significant difference from same-age control at p < 0.01 (Dunnett’s test).
These results suggest that the enhancement of ChAT activity produced by BDNF is longer-lived than that produced by NGF. However, the effects of first week exposure to NGF were evident if another neurotrophin was present during the second week, because in Figure 2 the increases in ChAT activity produced by NGF-NGF, NGF-BDNF, NGF-NT3, and NGF-NT4 exceeded those produced by C-NGF, C-BDNF, C-NT3, and C-NT4, respectively.
None of the four tested neurotrophins increased total or cholinergic neuronal survival at our standard plating density (1200–1600 cells/mm2, labeled 100% in Fig.3B,C). Thus, neurotrophin enhancement of ChAT activity at this plating density was not attributable to increased neuronal survival.
Neurotrophin enhancement of ChAT activity and neuronal survival in low-density cultures
Plating at low density constitutes a stress for cultured neurons, because neurons plated at low density die faster than neurons plated at higher densities (Hartikka and Hefti, 1988; Grothe et al., 1989), perhaps because of reduction of trophic interactions mediated by endogenously produced soluble factors and/or cell–cell contact. Experiments summarized in Figure 3A demonstrate that the magnitude of neurotrophin enhancement of ChAT activity was density-dependent. Sister cultures were plated at the standard density and at 50 and 25% of this density, and then maintained for 10 d in control medium or with addition of NGF, BDNF, NT-3, or NT-4 (100 ng/ml). Although all four neurotrophins produced comparable two- to threefold enhancements of ChAT activity at the control plating density (100%), they had markedly different effects at 25% density: BDNF and NT-4 produced 11- to 13-fold enhancements, whereas NGF, a potent stimulator of ChAT activity in higher density cultures, produced no enhancement at low density.
Neuronal survival was density-dependent: after 2 weeks in control medium, ∼50% of plated neurons survived from an initial plating density of 1200–1600 cells/mm2, ∼30% from an initial density of 600–800 cells/mm2, and ∼15% from an initial density of 300–400 cells/mm2. The neurotrophins that increased ChAT activity in low density cultures also increased survival of AChE-positive (Fig. 3B) and/or total (Fig. 3C) neurons. At 25% of the normal plating density, NT-4 and BDNF significantly increased total neuronal survival, and NT-3 and NT-4 increased survival of AChE-positive neurons (these latter increases did not reach statistical significance, probably because of the large SE associated with counts of this subpopulation).
The neuronal survival-enhancing effects of BDNF, NT-3, and NT-4 were also assayed at even lower plating densities (2–28 cells/mm2) to minimize cell–cell interactions. Figure4 plots the percentage of surviving neurons counted at 3, 7, 10, and 14 d after plating in control medium and in the presence of the various neurotrophins (each at 100 ng/ml). NT-3 produced the greatest increase in neuronal survival at all tested intervals, with statistical significance (p < 0.05, Dunnett’s test) at intervals ≥7 d. BDNF and NT-4 also yielded more surviving neurons than control medium at all intervals tested, and this increased survival was statistically significant when data from days 7–14 were pooled (p < 0.05). Neuronal survival in NGF was no greater than that seen in control medium.
The open bars in Figure 5 summarize the results of additional similar experiments with single and combined neurotrophins at very low densities, with neuronal survival after 2 weeks in vitro normalized to that measured in control medium. Consistent with the results of Figure 4, BDNF, NT-3, and NT-4, but not NGF, significantly increased total neuronal survival. BDNF and several neurotrophin combinations significantly increased survival of AChE-positive neurons. The survival-promoting effects of BDNF and NT-3 on total and cholinergic neuronal survival at low densities were roughly comparable (two- to threefold increases).
Our results thus suggest that the neuronal survival-promoting effects of exogenous BDNF, NT-3, and NT-4 are density-dependent, with more powerful effects in lower-density cultures. Thus, in low-density cultures part of the enhancement of ChAT activity by BDNF, NT-3, and NT-4 (Fig. 3) was likely attributable to increased survival of total and/or cholinergic neurons. The lack of effect of NGF on survival of total or AChE-positive neurons is consistent with our and others’ findings that neither NGF nor anti-NGF antibodies alter the survival of total, AChE-positive, or p75NTR-immunoreactive neurons in low- or normal-density septal cultures (Nonner et al., 1992, 1993;Friedman et al., 1993).
Neurotrophin enhancement of ChAT activity and neuronal survival after hypoglycemic stress
To determine whether neurotrophins increase neuronal survival after a hypoglycemic stress, sister cultures plated at standard density and maintained for 2 weeks in control medium lacking exogenous neurotrophins were exposed for 24 hr to a glucose-free salt solution (see Materials and Methods) in the presence or absence of exogenous neurotrophin. Cultures were assayed after 1 week in normoglycemic control medium containing NGF. A 24 hr exposure to glucose-free solution produced widespread neuronal death. In three experiments in which some neurons did survive, their number was reduced to 6.55 ± 1.16% of that measured in unstressed sister cultures. Figure6 shows the results of one such experiment, in which the presence of any one of the four tested neurotrophins during the hypoglycemic stress dramatically increased total neuronal survival, to 38–77% of that measured in nonstressed sister cultures. Normalized survival data for all three experiments are plotted in Table3.
Table 3.
Neurotrophin effects on survival of total and AChE-positive neurons after 24 hr hypoglycemic stress
| Treatment | Total neurons/stress control | AChE+ neurons/stress control |
|---|---|---|
| NGF | 6.62 ± 1.07 (43)* | 1.78 ± 0.34 (128) |
| BDNF | 2.94 ± 0.68 (26)* | 1.98 ± 0.43 (52) |
| NT-3 | 3.13 ± 0.68 (26)* | 2.60 ± 0.74 (65)* |
| NT-4 | 2.33 ± 0.37 (27)* | 1.45 ± 0.47 (44) |
| No stress | 9.43 ± 1.41 (44)* | 1.80 ± 0.30 (48) |
Total neuronal survival was measured after exposure to zero glucose, AChE-positive neuronal survival after exposure to 55 μm glucose. Other protocols are as for Figure 6. Values are normalized to those measured in sister cultures stressed in the absence of exogenous neurotrophin, which were 7.8 ± 1.22 total neurons/mm2 (24 wells in 4 experiments) and 5.15 ± 0.61 AChE-positive neurons/mm2 (119 wells in 5 experiments). Number of culture wells for each treatment is indicated in parentheses. *, Significant difference from stress control at p ≤ 0.05.
Results summarized in Table 4 demonstrate that neurotrophin enhancement of neuronal survival after hypoglycemic stress was attributable mainly to the presence of neurotrophin during the stress rather than to the NGF present during the poststress week. This experiment compared neuronal survival in sister cultures exposed to NGF or to control medium alone during the poststress week. Cultures stressed in the presence of NGF showed similar survival (61–66% of that measured in nonstressed controls) whether or not NGF was also present during the poststress week. For cultures stressed in the absence of exogenous neurotrophin, the presence of NGF during the poststress week increased the measured mean survival from 15 to 29% (compared to nonstressed controls). This difference, although not statistically significant, raises the possibility that poststress exposure to neurotrophin might rescue some neurons deprived of neurotrophin during the stress.
Neurotrophins did not consistently rescue the cholinergic subpopulation or ChAT activity in cultures exposed to glucose-free solutions, perhaps because too few cholinergic neurons remained to permit significant counts. Other experiments (data not shown) indicated that the optimal glucose concentration for measuring the stress-protective effects of neurotrophins on cholinergic neurons was ∼55 μm (1% of the normal glucose concentration), so this concentration was used in the experiments described below. This hypoglycemic stress reduced the number of AChE-positive neurons in cultures stressed without added neurotrophins to 42.6 ± 6% of those counted in unstressed controls (44 wells in 3 experiments), but had minimal effects on total neuronal survival. Normalized results plotted in Table 3 show that the presence of neurotrophins during the hypoglycemic stress increased the number of surviving AChE-positive neurons by 1.45- to 2.6-fold, although only the enhancement of NT-3 reached statistical significance. No detailed morphological analysis of the AChE-stained neurons was undertaken, but there were no obvious differences in soma diameter or extent of neurite branching in surviving AChE-positive neurons (data not shown). Thus, any sublethal morphological changes produced by the hypoglycemic stress appear to have been reversed during the poststress week (which included exposure to exogenous neurotrophin).
Figure 7 shows that the presence of NGF, BDNF, or NT-4 (but not NT-3) during the hypoglycemic stress significantly increased ChAT activities measured 1 week after the stress. ChAT activities measured in cultures stressed in the absence of neurotrophin were similar regardless of the nature of the neurotrophin present during the poststress week. This result was somewhat surprising in view of the results in Figure 2 indicating that in nonstressed cultures NGF added during the week before assay increased ChAT activity more than other neurotrophins. Although we cannot rule out the possibility that NGF differentially influences ChAT activity during the poststress week, the results of Figure 7 suggest that in cultures exposed to hypoglycemic stress the more important variable affecting ChAT activity is the neurotrophin present during the stress rather than the neurotrophin present during the poststress week.
In eight additional experiments (total of 70 wells) like that in Figure7, the 55 μm hypoglycemic stress reduced ChAT activity in stress-only cultures to 12.6 ± 1.3% of that measured in unstressed controls, a more dramatic reduction than that measured in the experiment of Figure 7. The average (neurotrophin/stress control) ChAT activity ratios after this hypoglycemic stress were 2.78 ± 0.38 for NGF (n = 8 experiments), 1.94 ± 0.24 (n = 4) for BDNF, and 1.41 ± 0.14 (n = 4) for NT-4, compared with only 0.92 ± 0.11 (n = 4) for NT-3 (plotted at time = 0 in Fig.8). Thus, the presence of NGF, BDNF, and NT-4 during the stress significantly protected ChAT activity. The presence of NT-3 during the stress failed to enhance ChAT activity even when the neurotrophin present during the poststress week was NGF instead of NT-3.
Control experiments (data not shown) showed no detectable difference between ChAT activities or number of AChE-positive neurons measured in unstressed cultures exposed to neurotrophins for 7 versus 8 d. Thus, the protective effect of neurotrophins was specific for stressed neurons and not caused simply by the fact that test cultures were exposed to neurotrophins for 8 d (24 hr stress + poststress week) rather than 7 d. NGF also protected against hypoglycemic stress at 10 ng/ml (data not shown), consistent with involvement of high-affinity TrkA receptors.
The results of Figure 6 suggest that the enhancement of poststress ChAT activity produced by NGF, BDNF, and NT-4 may have been related to increased neuronal survival. It was interesting that NT-3 enhanced poststress survival of AChE-positive and total neurons, but not poststress ChAT activity. Perhaps other neurotrophins protect cholinergic neurons against sublethal damage affecting ChAT activity better than NT-3.
Experiments summarized in Figure 8 explored whether neurotrophin enhancement of poststress cholinergic function varied with the timing of neurotrophin addition. The indicated neurotrophin was added for the 24 hr period preceding the stress (labeled −24 on abscissa), at the onset of the stress (labeled 0), or 1 or 6 hr after stress onset. Some cultures were exposed to neurotrophin both before and during the hypoglycemic stress (labeled −24+0). For BDNF and NT-4, the poststress ChAT activity did not vary greatly with the timing of neurotrophin addition, but the ChAT-enhancing effects of NGF did appear to vary with timing. Mere pretreatment with NGF was ineffective, but NGF added 1–6 hr after stress onset enhanced poststress ChAT activity more than addition of NGF at stress onset.
Figure 9 shows the results of an experiment in which the effects of neurotrophin added 1 or 6 hr after stress onset were assayed for both ChAT activity (A) and survival of AChE-positive neurons (B). Delayed addition of both NGF (1 and 6 hr) and BDNF (1 hr) significantly increased both ChAT activity and survival of cholinergic neurons. NGF added after 1 hr produced nearly complete stress protection. Combined with results in Table 3, these results suggest that at least some of the sparing of ChAT activity produced by the presence of NGF and BDNF during a hypoglycemic stress was associated with increased survival of total and/or cholinergic neurons.
DISCUSSION
Neurotrophins enhance ChAT activity but not neuronal survival at moderate culture densities
Results presented here demonstrate that at the moderate plating density of 1200–1600 cells/mm2 all four tested neurotrophins enhanced ChAT activity in septal cultures by two- to threefold, but did not significantly increase survival of total or AChE-positive neurons. On average, NGF and BDNF enhanced ChAT activity more effectively than NT-3 or NT-4. The finding of significant enhancement of ChAT activity by NGF, BDNF, and NT-4 at concentrations as low as 1 ng/ml suggests involvement of high-affinity TrkA and TrkB receptors, whose presence in the septum has been confirmed by immunohistochemical staining (Steininger et al., 1993; Cheng and Mattson, 1994). TrkC receptors have also been detected in septal cultures (Cheng and Mattson, 1994), but the higher concentration of NT-3 required to increase ChAT activity (Fig. 1, Table 1) leaves open the possibility that NT-3 acted via TrkA or TrkB receptors (Cordon-Cardo et al., 1991; Klein et al., 1991b; Soppet et al., 1991;Squinto et al., 1991) (but see Ip et al., 1993).
Extensive testing of various combinations and concentrations of neurotrophins yielded little evidence of synergistic effects on ChAT activity (Table 1). This absence of synergistic effects suggests that NGF, BDNF, and NT-3 all enhance ChAT activity in the same population(s) of cholinergic neurons via mechanisms that have some step(s) in common. Others have reported near-additive effects of BDNF and NGF on ChAT activity (Alderson et al., 1990; Knusel and Hefti, 1993), but in their culture systems NGF and BDNF also increased the number of AChE-positive neurons (see below). Thus, their additive effects on ChAT activity may have been attributable to increased survival of cholinergic neurons.
BDNF, NT-3, and NT-4 protect total and/or cholinergic neurons during low-density stress
Although none of the four tested neurotrophins increased survival of total or AChE-positive neurons at moderate plating densities, all neurotrophins except NGF increased total and/or AChE-positive neuronal survival (as well as ChAT activity) in lower-density cultures (Figs.3, 4, 5). The survival-promoting effects may have been mediated by TrkB and/or TrkC receptors or by interactions between these Trk receptors and p75NTR receptors. The finding that the survival-enhancing effects of BDNF, NT-3, and NT-4 were not restricted to cholinergic neurons is consistent with the widespread distribution of mRNA and immunoreactivity for TrkB (receptor for BDNF/NT-4) and TrkC (receptor for NT-3) in basal forebrain (Merlio et al., 1992; Cheng and Mattson, 1994).
Neurotrophins protect total and cholinergic neurons during hypoglycemic stress
All four tested neurotrophins increased total neuronal survival after a 24 hr zero-glucose stress (Fig. 6; Tables 3, 4). NGF, BDNF, and NT-3 also increased the number of cholinergic neurons that survived a less severe hypoglycemic stress (Table 3, Fig. 9B). Neurotrophins have also been reported to protect other central neurons (e.g., hippocampal and neocortical) during hypoglycemia and other stresses in vitro and in vivo (for review, seeLindvall et al., 1994). Cheng and Mattson (1994) reported that addition of NGF (100 ng/ml), BDNF (300 ng/ml), or NT-3 (200 ng/ml) 24 hr before and during a 24 hr hypoglycemic stress increased the number of viable neurons counted immediately after the stress. Our results indicate that the presence of neurotrophins during a similar stress increased the number of neurons surviving a week after the stress and show that NGF, BDNF, and NT-4 also enhanced post-hypoglycemic ChAT activity. It is especially interesting that NGF increased post-hypoglycemic total neuronal survival, because in these cultures TrkA receptors appear to be restricted to the cholinergic subpopulation (Holtzman et al., 1992;Steininger et al., 1993).
The finding that NT-3 enhanced post-hypoglycemic survival of cholinergic neurons more than post-hypoglycemic ChAT activity suggests that in studies of neuroprotective effects it will be informative to assay for functional properties in addition to structural integrity after the stress. The mechanism(s) underlying the protective effects of neurotrophins during hypoglycemic stress remains to be determined; one mechanism appears to involve reduction of stress-induced increases in intracellular [Ca2+] (Cheng and Mattson, 1991, 1994).
In most previous studies investigating stress-protective effects, neurotrophins were added before or at the onset of the stress. Cheng and Mattson (1991) and Kokaia et al. (1994) tested the effects of delayed addition of BDNF and NGF to hippocampal cultures subjected to a 15–22 hr hypoglycemic stress and found that application of neurotrophin 4 hr after the onset of hypoglycemia increased neuronal survival. We found that delayed addition of NGF and BDNF also increases the survival and function of septal cholinergic neurons (Figs. 8, 9). Interestingly, the ability of NGF to protect ChAT activity may have been more pronounced when NGF was added 1 hr after, rather than at, the onset of the hypoglycemic stress. Perhaps the intracellular mechanisms activated by NGF addition are qualitatively or quantitatively different in stressed versus unstressed cholinergic neurons, with some of the changes elicited in unstressed neurons (e.g., enhancement of ChAT activity and neuronal growth) being either nonadaptive or even maladaptive for surviving a subsequent stress.
The protection of forebrain cholinergic neurons by NGF and BDNF applied 1 hr or more after the onset of hypoglycemia may have important correlates in vivo. A variety of stresses (including hypoglycemic coma) increase expression of BDNF and NGF mRNAs in hippocampus and neocortex, sometimes within 30 min to 1 hr of stress onset (Gall and Isackson, 1989; Ernfors et al., 1991; Isackson et al., 1991; Dugich-Djordjevic et al., 1992; Lindvall et al., 1992; Patterson et al., 1992). The resulting increase in neurotrophin expression may help protect not only hippocampal and neocortical neurons, but also the septal cholinergic axon terminals that innervate them.
The ability of neurotrophins to protect cholinergic neurons during certain stresses may help explain the divergent findings concerning neurotrophin-enhanced survival of cholinergic neurons reported for other culture systems. Others have also found that the survival-enhancing effects of exogenous neurotrophins are density-dependent, with effects disappearing as plating density increases (Hartikka and Hefti, 1988; Grothe et al., 1989). Such a result might be expected if these (and other) neurotrophic factors are produced at low levels by the cultures themselves. Differences between our and others’ results are that (1) we found survival-enhancing effects of BDNF, NT-3, and NT-4 only at plating densities lower than those used by others, and (2) we found no survival-enhancing effects of NGF in control medium at any plating density. However, NGF did protect neurons well against a hypoglycemic stress, raising the possibility that the NGF-enhanced neuronal survival reported by others was attributable in part to hypoglycemic stress. Dense (e.g., aggregate) cultures experiencing rapid glial proliferation may experience hypoglycemic stress during the intervals between replenishment of the culture medium, because embryonic central neuronal cultures metabolize glucose rapidly (Brass et al., 1992). Hypoglycemic stress may also explain the survival-enhancing effects of NGF reported by Svendsen et al. (1994), who used “sandwich” cultures grown under inverted coverslips. In their study, all neurons under the center of the coverslip died (regardless of whether or not NGF was added), with living neurons restricted to regions near the rim of the coverslip. This death of centrally located neurons may have been caused by hypoglycemia and/or hypoxia, because the restricted diffusion pathway under the coverslip would limit the supply of glucose and oxygen (or any other exogenously supplied energy substrate) available to neurons under the center of the coverslip. The ability of NGF to protect cholinergic function after hypoglycemic stress (Figs. 7, 8, 9), therefore, might help explain the finding of Svendsen et al. (1994), that NGF increased the number of cholinergic neurons surviving under a coverslip. Other possible stresses on cultured neurons include the neurotoxic components of whole serum (García et al., 1992), and antibiotics (e.g., gentamicin; Zheng et al., 1995) and mitotic inhibitors (e.g., cytosine arabinoside; Martin et al., 1990) added to the culture medium.
In summary, results presented here support the hypothesis that neurotrophins have a greater effect on survival of septal cholinergic neurons under stress conditions than under nonstress conditions. None of the four tested neurotrophins increased survival of cholinergic neurons in moderate density cultures grown in control culture medium, but BDNF significantly increased survival of cholinergic neurons and ChAT activity during low-density stress, and BDNF and NGF increased survival of cholinergic neurons and ChAT activity after a hypoglycemic stress. NGF provided significant protection against hypoglycemia even when added 6 hr after stress onset. These results suggest that neurotrophins not only enhance the differentiated functional properties of central cholinergic neurons, but also increase their ability to survive certain stresses in vitro and in vivo. Interestingly, the survival-promoting effects of neurotrophins were not limited to the cholinergic subpopulation: BDNF, NT-3, and NT-4 increased total neuronal survival in very-low-density cultures, and all four tested neurotrophins increased neuronal survival after a hypoglycemic stress.
Footnotes
This work was supported by National Institutes of Health Grant RO1 NS12207 and the University of Miami. We thank Dr. Wolfgang Nonner for developing data analytical and statistical programs, and Dr. Ronald Lindsay of Regeneron Pharmaceuticals for supplying recombinant neurotrophins.
Correspondence should be addressed to Doris Nonner, Department of Physiology and Biophysics, University of Miami School of Medicine, P.O. Box 016430, Miami, FL 33101.
REFERENCES
- 1.Alderson RF, Alterman AL, Barde Y-A, Lindsay RM. Brain-derived neurotrophic factor increases survival and differentiated functions of rat septal cholinergic neurons in culture. Neuron. 1990;5:297–306. doi: 10.1016/0896-6273(90)90166-d. [DOI] [PubMed] [Google Scholar]
- 2.Berkemeier LR, Winslow JW, Kaplan DR, Nikolics K, Goeddel DV, Rosenthal A. Neurotrophin-5: a novel neurotrophic factor that activates trk and trkB. Neuron. 1991;7:857–866. doi: 10.1016/0896-6273(91)90287-a. [DOI] [PubMed] [Google Scholar]
- 3.Brass BJ, Nonner D, Barrett JN. Differential effects of insulin on choline acetyltransferase and glutamic acid decarboxylase activities in neuron-rich striatal cultures. J Neurochem. 1992;59:415–424. doi: 10.1111/j.1471-4159.1992.tb09387.x. [DOI] [PubMed] [Google Scholar]
- 4.Cavicchioli L, Flanigan TP, Vantini G, Fusco M, Polato P, Toffano G, Walsh S, Leon A. NGF amplifies expression of NGF receptor messenger RNA in forebrain cholinergic neurons in rat. Eur J Neurosci. 1989;1:258–262. doi: 10.1111/j.1460-9568.1989.tb00793.x. [DOI] [PubMed] [Google Scholar]
- 5.Cheng B, Mattson MP. NGF and bFGF protect rat hippocampal and human cortical neurons against hypoglycemic damage by stabilizing calcium homeostasis. Neuron. 1991;7:1031–1041. doi: 10.1016/0896-6273(91)90347-3. [DOI] [PubMed] [Google Scholar]
- 6.Cheng B, Mattson MP. NT-3 and BDNF protect CNS neurons against metabolic/excitotoxic insults. Brain Res. 1994;607:275–285. doi: 10.1016/0006-8993(94)91857-0. [DOI] [PubMed] [Google Scholar]
- 7.Cordon-Cardo C, Tapley P, Jing S, Nanduri V, O’Rourke E, Lamballe F, Kovary K, Klein R, Jones K, Reichardt L, Barbacid M. The trk tyrosine kinase mediates the mitogenic properties of nerve growth factor and neurotrophin-3. Cell. 1991;66:173–183. doi: 10.1016/0092-8674(91)90149-s. [DOI] [PMC free article] [PubMed] [Google Scholar]
- 8.Crowley C, Spencer SD, Nishimura MC, Chen KS, Pitts-Meek S, Armanini MP, Ling LH, McMahon SB, Shelton DL, Levinson AD, Phillips HS. Mice lacking nerve growth factor display perinatal loss of sensory and sympathetic neurons yet develop basal forebrain cholinergic neurons. Cell. 1994;76:1001–1011. doi: 10.1016/0092-8674(94)90378-6. [DOI] [PubMed] [Google Scholar]
- 9.Dugich-Djordjevic MM, Tocco G, Pasinetti GM, Baudry M, Lapchak PA, Hefti F. Regionally specific and rapid increases in brain-derived neurotrophic factor messenger RNA in the adult rat brain following seizures induced by systemic administration of kainic acid. Neuroscience. 1992;47:303–315. doi: 10.1016/0306-4522(92)90246-x. [DOI] [PubMed] [Google Scholar]
- 10.Eckenstein F, Sofroniew MV. Identification of central cholinergic neurons containing both choline acetyltransferase and acetylcholinesterase and of central neurons containing only acetylcholinesterase. J Neurosci. 1983;3:2286–2291. doi: 10.1523/JNEUROSCI.03-11-02286.1983. [DOI] [PMC free article] [PubMed] [Google Scholar]
- 11.Ernfors P, Wetmore C, Olson L, Person H. Identification of cells in the rat brain and peripheral tissues expressing mRNA for members of the nerve growth factor family. Neuron. 1990;5:511–526. doi: 10.1016/0896-6273(90)90090-3. [DOI] [PubMed] [Google Scholar]
- 12.Fonnum R. Radiochemical micro assays for the determination of choline acetyltransferase and acetylcholinesterase activities. Biochem J. 1969;115:465–472. doi: 10.1042/bj1150465. [DOI] [PMC free article] [PubMed] [Google Scholar]
- 13.Friedman WJ, Ibanez CF, Hallbook F, Persson H, Cain LD, Dreyfus CF, Black IB. Differential actions of neurotrophins in the locus coeruleus and basal forebrain. Exp Neurol. 1993;119:72–78. doi: 10.1006/exnr.1993.1007. [DOI] [PubMed] [Google Scholar]
- 14.Gage FH, Armstrong DM, Williams LR, Varon S. Morphological responses of axotomized septal neurons to nerve growth factor. J Comp Neurol. 1988;269:147–155. doi: 10.1002/cne.902690112. [DOI] [PubMed] [Google Scholar]
- 15.Gage FH, Wictorin K, Fisher W, Williams LR, Varon S, Bjorklund A. Retrograde cell changes in medial septum and diagonal band following fimbria-fornix transection: Quantitative temporal analysis. Neurosci. 1986;19:241–255. doi: 10.1016/0306-4522(86)90018-7. [DOI] [PubMed] [Google Scholar]
- 16.Gall CM, Isackson PJ. Limbic seizures increase neuronal production of messenger RNA for nerve growth factor. Science. 1989;245:758–761. doi: 10.1126/science.2549634. [DOI] [PubMed] [Google Scholar]
- 17.García JE, Jr, Nonner D, Ross D, Barrett JN. Neurotoxic components in normal serum. Exp Neurol. 1992;118:309–316. doi: 10.1016/0014-4886(92)90188-v. [DOI] [PubMed] [Google Scholar]
- 18.Grothe C, Otto D, Unsicker K. Basic fibroblast growth factor promotes in vitro survival and cholinergic development of rat septal neurons: comparison with the effects of nerve growth factor. Neuroscience. 1989;31:649–661. doi: 10.1016/0306-4522(89)90430-2. [DOI] [PubMed] [Google Scholar]
- 19.Hagg T, Fass-Holmes B, Vahlsing HL, Manthorpe M, Conner JM, Varon S. Nerve growth factor (NGF) reverses axotomy-induced decreases in choline acetyltransferase, NGF receptor and size of medial septum cholinergic neurons. Brain Res. 1989;505:29–38. doi: 10.1016/0006-8993(89)90112-1. [DOI] [PubMed] [Google Scholar]
- 20.Hantzopoulos PA, Suri C, Glass DJ, Goldfarb MP, Yancopoulous GD. The low affinity NGF receptor, p75, can collaborate with each of the Trks to potentiate functional responses to the neurotrophins. Neuron. 1994;13:187–207. doi: 10.1016/0896-6273(94)90469-3. [DOI] [PubMed] [Google Scholar]
- 21.Hartikka J, Hefti F. Development of septal cholinergic neurons in culture: plating density and glial cells modulate effects of NGF on survival, fiber growth and expression of transmitter-specific enzymes. J Neurosci. 1988;9:2967–2985. doi: 10.1523/JNEUROSCI.08-08-02967.1988. [DOI] [PMC free article] [PubMed] [Google Scholar]
- 22.Hatanaka H, Tsukui H, Nihonmatsu I. Developmental change in the nerve growth factor action from induction of choline acetyltransferase to promotion of cell survival in cultured basal forebrain cholinergic neurons from postnatal rats. Dev Brain Res. 1988;39:85–95. doi: 10.1016/0165-3806(88)90069-7. [DOI] [PubMed] [Google Scholar]
- 23.Hefti F. Nerve growth factor promotes survival of septal cholinergic neurons after fimbrial transections. J Neurosci. 1986;6:2155–2162. doi: 10.1523/JNEUROSCI.06-08-02155.1986. [DOI] [PMC free article] [PubMed] [Google Scholar]
- 24.Hefti F, Hartikka J, Eckenstein F, Gnahn H, Heumann R, Schwab M. Nerve growth factor increases choline acetyltransferase but not survival or fiber outgrowth of cultured fetal septal cholinergic neurons. Neuroscience. 1985;14:55–68. doi: 10.1016/0306-4522(85)90163-0. [DOI] [PubMed] [Google Scholar]
- 25.Hempstead BL, Martin-Zanca D, Kaplan DR, Parada LF, Chao MV. High affinity binding requires co-expression of the trk proto-oncogene and the low affinity NGF receptor. Nature. 1991;350:678–683. doi: 10.1038/350678a0. [DOI] [PubMed] [Google Scholar]
- 26.Higgins GA, Koh S, Chen KS, Gage FH. NGF induction of NGF receptor gene expression and cholinergic neuronal hypertrophy within the basal forebrain of the adult rat. Neuron. 1989;3:247–256. doi: 10.1016/0896-6273(89)90038-x. [DOI] [PubMed] [Google Scholar]
- 27.Holtzman DM, Li Y, Parada LF, Kinsman S, Chen C-K, Valetta JS, Zhou J, Long JB, Mobley WC. p140trk mRNA marks the NGF-responsive forebrain neurons: evidence that trk gene expression is induced by NGF. Neuron. 1992;9:465–478. doi: 10.1016/0896-6273(92)90184-f. [DOI] [PubMed] [Google Scholar]
- 28.Ip NY, Ibanez CF, Nye SH, McClain J, Jones PF, Gies DR, Belluscio L, Le Beau MM, Espinosa R, Squinto SP, Persson H, Yancopoulos G. Mammalian neurotrophin-4: structure, chromosomal localization, tissue distribution, and receptor specificity. Proc Natl Acad Sci USA. 1992;89:3060–3064. doi: 10.1073/pnas.89.7.3060. [DOI] [PMC free article] [PubMed] [Google Scholar]
- 29.Ip NY, Stitt TN, Tapley P, Klein R, Glass DJ, Fandl J, Greene LA, Barbacid M, Yancopoulos GD. Similarities and differences in the way neurotrophins interact with the Trk receptors in neuronal and non-neuronal cells. Neuron. 1993;10:137–149. doi: 10.1016/0896-6273(93)90306-c. [DOI] [PubMed] [Google Scholar]
- 30.Isackson PJ, Huntsman MM, Murray KD, Gall CM. BDNF mRNA expression is increased in adult rat forebrain after limbic seizures: temporal patterns of induction distinct from NGF. Neuron. 1991;6:937–948. doi: 10.1016/0896-6273(91)90234-q. [DOI] [PubMed] [Google Scholar]
- 31.Jing S, Tapley P, Barbacid M. Nerve growth factor mediates signal transduction through trk homodimer receptors. Neuron. 1992;9:1067–1079. doi: 10.1016/0896-6273(92)90066-m. [DOI] [PubMed] [Google Scholar]
- 32.Jonakait GM, Wei R, Shen ZL, Hart RP, Ni L. Interferon-γ promotes cholinergic differentiation of embryonic septal nuclei and adjacent basal forebrain. Neuron. 1994;12:1149–1159. doi: 10.1016/0896-6273(94)90322-0. [DOI] [PubMed] [Google Scholar]
- 33.Kaplan DR, Hempstead BL, Martin-Zanca D, Chao MV, Parada LF. The trk protooncogene product: a signal transducing receptor for nerve growth factor. Science. 1991;252:554–558. doi: 10.1126/science.1850549. [DOI] [PubMed] [Google Scholar]
- 34.Kaufman LM, Barrett JN. Serum factor supporting long-term survival of rat central neurons in culture. Science. 1983;220:1394–1396. doi: 10.1126/science.6857258. [DOI] [PubMed] [Google Scholar]
- 35.Kawamoto JC, Barrett JN. Cryopreservation of primary neurons for tissue culture. Brain Res. 1986;384:84–93. doi: 10.1016/0006-8993(86)91222-9. [DOI] [PubMed] [Google Scholar]
- 36.Klein R, Jing S, Nanduri V, O-Rourke E, Barbacid M. The trk tyrosine proto-oncogene encodes a receptor for nerve growth factor. Cell. 1991a;65:189–197. doi: 10.1016/0092-8674(91)90419-y. [DOI] [PubMed] [Google Scholar]
- 37.Klein R, Nanduri V, Jing S, Lamballe F, Tapley P, Bryant S, Cordon-Cardo C, Jones KR, Reichardt LF, Barbacid M. The trkB tyrosine protein kinase is a receptor for brain-derived neurotrophic factor and neurotrophin-3. Cell. 1991b;66:395–403. doi: 10.1016/0092-8674(91)90628-c. [DOI] [PMC free article] [PubMed] [Google Scholar]
- 38.Klein R, Lamballe F, Bryant S, Barbacid M. The trkB tyrosine protein kinase is a receptor for neurotrophin-4. Neuron. 1992;8:947–956. doi: 10.1016/0896-6273(92)90209-v. [DOI] [PubMed] [Google Scholar]
- 39.Knusel B, Hefti F. Multiple and interactive responses of central neurons to neurotrophic factors. Semin Neurosci. 1993;5:259–267. [Google Scholar]
- 40.Knusel B, Michel PP, Schwaber JS, Hefti F. Selective and nonselective stimulation of central cholinergic and dopaminergic development in vitro by nerve growth factor, basic fibroblast growth factor, epidermal growth factor, insulin and the insulin-like growth factors I and II. J Neurosci. 1990;10:558–570. doi: 10.1523/JNEUROSCI.10-02-00558.1990. [DOI] [PMC free article] [PubMed] [Google Scholar]
- 41.Knusel B, Winslow JW, Rosenthal A, Burton LE, Seid DP, Nikolics K, Hefti F. Promotion of central cholinergic and dopaminergic neuron differentiation by brain-derived neurotrophic factor but not neurotrophin-3. Proc Natl Acad Sci USA. 1991;88:961–965. doi: 10.1073/pnas.88.3.961. [DOI] [PMC free article] [PubMed] [Google Scholar]
- 42.Knusel B, Beck KD, Winslow JW, Rosenthal A, Burton LE, Widmer HR, Nikolics K, Hefti F. Brain-derived neurotrophic factor administration protects basal forebrain cholinergic but not nigral dopaminergic neurons from degenerative changes after axotomy in the adult rat brain. J Neurosci. 1992;12:4391–4402. doi: 10.1523/JNEUROSCI.12-11-04391.1992. [DOI] [PMC free article] [PubMed] [Google Scholar]
- 43.Kokaia Z, Othberg A, Kokaia M, Lindvall O. BDNF makes cultured dentate granule cells more resistant to hypoglycaemic damage. NeuroReport. 1994;5:1241–1244. doi: 10.1097/00001756-199406020-00021. [DOI] [PubMed] [Google Scholar]
- 44.Kromer LF. Nerve growth factor treatment after brain injury prevents neuronal death. Science. 1987;235:214–216. doi: 10.1126/science.3798108. [DOI] [PubMed] [Google Scholar]
- 45.Lamballe F, Klein R, Barbacid M. trkC, a new member of the trk family of tyrosine kinases, is a receptor for neurotrophin-3. Cell. 1991;66:967–979. doi: 10.1016/0092-8674(91)90442-2. [DOI] [PubMed] [Google Scholar]
- 46.Levey AI, Wainer BH, Mufson EJ, Mesulam M-M. Colocalization of acetylcholinesterase and choline acetyltransferase in the rat cerebrum. Neuroscience. 1983;9:9–22. doi: 10.1016/0306-4522(83)90042-8. [DOI] [PubMed] [Google Scholar]
- 47.Li Y, Holtzman DM, Kromer LF, Kaplan DR, Chua-Couzens J, Clary DO, Knusel B, Mobley WC. Regulation of TrkA and ChAT expression in developing rat basal forebrain: evidence that both exogenous and endogenous NGF regulate differentiation of cholinergic neurons. J Neurosci. 1995;15:2888–2905. doi: 10.1523/JNEUROSCI.15-04-02888.1995. [DOI] [PMC free article] [PubMed] [Google Scholar]
- 48.Lindsay RM, Wiegand SJ, Altar A, Distefano PS. Neurotrophic factors: from molecule to man. Trends Neurosci. 1994;17:182–192. doi: 10.1016/0166-2236(94)90099-x. [DOI] [PubMed] [Google Scholar]
- 49.Lindvall O, Ernfors P, Bengzon J, Kokaia Z, Smith M-L, Siesju BK, Persson H. Differential regulation of mRNAs for nerve growth factor, brain-derived neurotrophin factor, and neurotrophin 3 in the adult rat brain following cerebral ischemia and hypoglycemic coma. Proc Natl Acad Sci USA. 1992;89:648–652. doi: 10.1073/pnas.89.2.648. [DOI] [PMC free article] [PubMed] [Google Scholar]
- 50.Lindvall O, Kokaia Z, Bengzon J, Elmer E, Kokaia M. Neurotrophins and brain insults. Trends Neurosci. 1994;17:490–496. doi: 10.1016/0166-2236(94)90139-2. [DOI] [PubMed] [Google Scholar]
- 51.Manthorpe M, Fagnani R, Skaper SD, Varon S. An automated colorimetric microassay for neuronotrophic factors. Dev Brain Res. 1986;25:191–198. doi: 10.1016/s0006-8993(86)80227-x. [DOI] [PubMed] [Google Scholar]
- 52.Martin DP, Wallace TL, Johnson EM. Cytosine arabinoside kills postmitotic neurons in a fashion resembling trophic factor deprivation: evidence that a deoxydytidine-dependent process may be required for nerve growth factor signal transduction. J Neurosci. 1990;10:184–193. doi: 10.1523/JNEUROSCI.10-01-00184.1990. [DOI] [PMC free article] [PubMed] [Google Scholar]
- 53.Meakin SO, Suter U, Drinkwater CC, Welcher AA, Shooter EM. The rat trk protooncogene product exhibits properties characteristic of the slow nerve growth factor receptor. Proc Natl Acad Sci USA. 1992;89:2374–2378. doi: 10.1073/pnas.89.6.2374. [DOI] [PMC free article] [PubMed] [Google Scholar]
- 54.Merlio JP, Ernfors P, Persson H. Molecular cloning of rat trkC and distribution of cells expressing messenger RNAs for members of the trk family in the rat central nervous system. Neuroscience. 1992;51:513–532. doi: 10.1016/0306-4522(92)90292-a. [DOI] [PubMed] [Google Scholar]
- 55.Morse JK, Wiegand SJ, Anderson K, You Y, Cai N, Carnahan J, Miller J, DiStefano PS, Altar CA, Lindsay RM, Alderson RF. Brain-derived neurotrophin factor (BDNF) prevents the degeneration of medial septal cholinergic neurons following fimbria transection. J Neurosci. 1993;13:4146–4156. doi: 10.1523/JNEUROSCI.13-10-04146.1993. [DOI] [PMC free article] [PubMed] [Google Scholar]
- 56.Nakajima Y, Nakajima S, Obata K, Carlson CG, Yamaguchi K. Dissociated cell culture of cholinergic neurons from nucleus basalis of Meynert and other basal forebrain nuclei. Proc Natl Acad Sci USA. 1985;82:6325–6329. doi: 10.1073/pnas.82.18.6325. [DOI] [PMC free article] [PubMed] [Google Scholar]
- 57.Nonner D, Barrett JN. Changes in the response of cultured septal cholinergic neurons to nerve growth factor exposure and deprivation during the first postnatal month. Dev Brain Res. 1994;79:219–228. doi: 10.1016/0165-3806(94)90126-0. [DOI] [PubMed] [Google Scholar]
- 58.Nonner D, Temple S, Barrett JN. Rat embryonic septal neurons survive and express cholinergic properties in isolation and without nerve growth factor. Dev Brain Res. 1992;70:197–205. doi: 10.1016/0165-3806(92)90198-6. [DOI] [PubMed] [Google Scholar]
- 59.Nonner D, Brass BJ, Barrett EF, Barrett JN. Reversibility of nerve growth factor’s enhancement of choline acetyltransferase activity in cultured embryonic rat septum. Exp Neurol. 1993;122:196–208. doi: 10.1006/exnr.1993.1120. [DOI] [PubMed] [Google Scholar]
- 60.Patterson SL, Grover LM, Schwartzkroin PA, Bothwell M. Neurotrophin expression in rat hippocampal slices: a stimulus paradigm inducing LTP in CA1 evokes increases in BDNF and NT-3 mRNAs. Neuron. 1992;9:1081–1088. doi: 10.1016/0896-6273(92)90067-n. [DOI] [PubMed] [Google Scholar]
- 61.Roback JD, Diede SJ, Downen M, Lee HJ, Kwon J, Large TH, Otten U, Wainer BH. Expression of neurotrophins and the low-affinity NGF receptor in septal and hippocampal reaggregate cultures: local physiologic effects of NGF synthesized in the septal region. Dev Brain Res. 1992;70:123–133. doi: 10.1016/0165-3806(92)90110-i. [DOI] [PubMed] [Google Scholar]
- 62.Rodríguez-Tébar A, Dechant G, Götz R, Barde Y-A. Binding of neurotrophin-3 to its neuronal receptors and interactions with nerve growth factor and brain-derived neurotrophic factor. EMBO J. 1992;11:917–922. doi: 10.1002/j.1460-2075.1992.tb05130.x. [DOI] [PMC free article] [PubMed] [Google Scholar]
- 63.Saporito MS, Carswell S. High levels of synthesis and local effects of nerve growth factor in the septal region of the adult rat brain. J Neurosci. 1995;15:2280–2286. doi: 10.1523/JNEUROSCI.15-03-02280.1995. [DOI] [PMC free article] [PubMed] [Google Scholar]
- 64.Shingai R, Itoh E, Harada K, Kimura H. Acetylcholinesterase-containing neurons in the striatum, septum and hippocampus of the rat in embryonic culture and adult in situ. Dev Brain Res. 1990;53:200–207. doi: 10.1016/0165-3806(90)90007-l. [DOI] [PubMed] [Google Scholar]
- 65.Smeyne RJ, Kelin R, Schnapp A, Long LK, Bryant S, Lewin A, Lira SA, Barbacid M. Severe sensory and sympathetic neuropathies in mice carrying a disrupted Trk/NGF receptor gene. Nature. 1994;368:246–249. doi: 10.1038/368246a0. [DOI] [PubMed] [Google Scholar]
- 66.Soppet D, Escandon E, Maragos J, Middlemas DS, Reid SW, Blair J, Burton LE, Stanton BR, Kaplan DR, Hunter T, Nickolics K, Parada LF. The neurotrophic factors brain-derived neurotrophic factor and neurotrophin-3 are ligands for the trkB tyrosine kinase receptor. Cell. 1991;65:895–903. doi: 10.1016/0092-8674(91)90396-g. [DOI] [PubMed] [Google Scholar]
- 67.Squinto SP, Stitt TN, Aldrich TH, Davis S, Bianco SM, Radziejewski C, Glass DJ, Masiakowski P, Furth ME, Valenzuela DM, Distefano PS, Yancopoulos GD. trkB encodes a functional receptor for brain-derived neurotrophic factor and neurotrophin-3 but not nerve growth factor. Cell. 1991;65:885–893. doi: 10.1016/0092-8674(91)90395-F. [DOI] [PubMed] [Google Scholar]
- 68.Steininger TL, Wainer BH, Klein R, Barbacid M, Palfrey HC. High-affinity nerve growth factor receptor (Trk) immunoreactivity is localized in cholinergic neurons of the basal forebrain and striatum in the adult rat brain. Brain Res. 1993;612:330–335. doi: 10.1016/0006-8993(93)91681-h. [DOI] [PubMed] [Google Scholar]
- 69.Svendsen CN, Kew JNC, Staley K, Sofroniew MV. Death of developing septal cholinergic neurons following NGF withdrawal in vitro: protection by protein synthesis inhibition. J Neurosci. 1994;14:75–87. doi: 10.1523/JNEUROSCI.14-01-00075.1994. [DOI] [PMC free article] [PubMed] [Google Scholar]
- 70.Tago H, Kimura H, Maeda T. Visualization of detailed acetylcholinesterase fiber and neuron staining in rat brain by a sensitive histochemical procedure. J Histochem Cytochem. 1986;34:1431–1438. doi: 10.1177/34.11.2430009. [DOI] [PubMed] [Google Scholar]
- 71.Vantini G, Schiavo N, Di Martine A, Polato P, Triban C, Callegaro L, Toffano G, Leon A. Evidence for a physiological role of nerve growth factor in the central nervous system of neonatal rats. Neuron. 1989;3:267–273. doi: 10.1016/0896-6273(89)90251-1. [DOI] [PubMed] [Google Scholar]
- 72.Whittemore SR, Seiger Å. The expression, localization and functional significance of β-nerve growth factor in the central nervous system. Brain Res Rev. 1987;12:439–464. doi: 10.1016/0165-0173(87)90008-7. [DOI] [PubMed] [Google Scholar]
- 73.Wilcox BJ, Applegate MD, Portera-Cailliau C, Koliatsos VE. Nerve growth factor prevents apoptotic cell death in injured central cholinergic neurons. J Comp Neurol. 1995;359:573–585. doi: 10.1002/cne.903590405. [DOI] [PubMed] [Google Scholar]
- 74.Williams LR, Varon S, Peterson GM, Wictorin K, Fischer W, Bjorklund A, Gage FH. Continuous infusion of nerve growth factor prevents basal forebrain neuronal death after fimbria fornix transection. Proc Natl Acad Sci USA. 1986;83:9231–9235. doi: 10.1073/pnas.83.23.9231. [DOI] [PMC free article] [PubMed] [Google Scholar]
- 75.Zheng JL, Stewart RR, Gao WQ. Neurotrophin-4/5 promotes survival of cultured primary auditory and vestibular neurons and protects them from ototoxins. Soc Neurosci Abstr. 1995;21:1054. [Google Scholar]