In the article “Expression and In Vitro Function of β1-Integrin Laminin Receptors in the Developing Avian Ciliary Ganglion” (Christine Weaver et al.), which appeared in the July, 1995 issue, there were errors in presentations or descriptions of several figures. Fortunately, none of these errors affects any conclusion derived from the data in the paper. However, for accuracy, corrected figures with complete legends are presented below. Many of the errors involved presentation of SEM instead of SD values, both of which were considered in the original analysis of these data. Where there was an error in a figure legend, sentences containing changes are indicated in boldface.
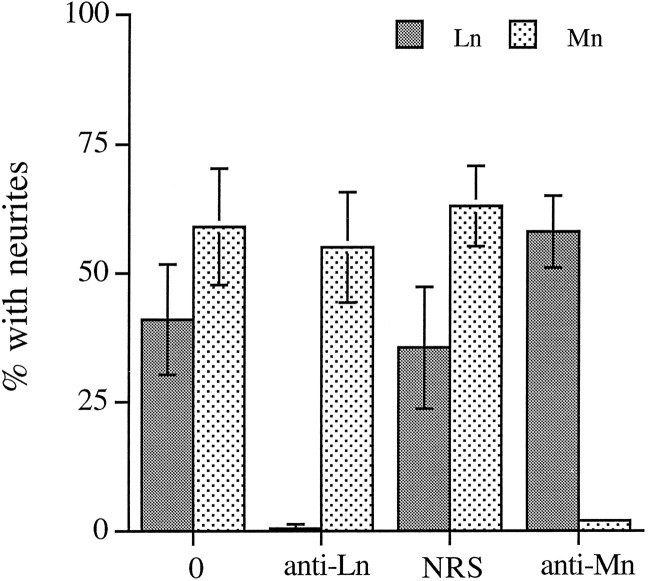
In the original Figure 2A, some error bars indicated SEM and were not standard deviations as described. The corrected figure appears below.
In vitro, CG neurite outgrowth on laminin-1 and merosin is sensitive to anti-laminin-1 and anti-merosin antibodies, respectively. Dissociated E7.5 CG neurons were plated on laminin-1 (Ln) and merosin (Mn) and allowed to extend neurites for 4–5 hr (Mn) or 9–10 hr (Ln) in the presence of no antibody (0), anti-Mn serum (1:25), normal rabbit serum (NRS; 1:25), or affinity-purified anti-laminin-1 (JW2; 20 μg/ml). Values represent the mean ± SD of 4 determinations from two experiments, each performed in duplicate.
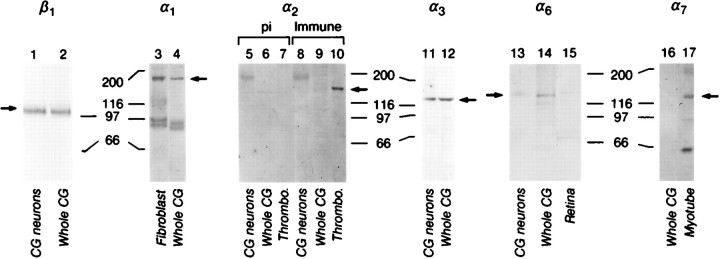
In Figure 3A, lanes 1, 2 and 3 were incorrect. The corrected figure appears below.
Integrin expression by E7–8 CG and purified CG neurons cultured on laminin-1. Whole CG (lanes 2, 4, 6, 9, 12, 14), CG membranes (lane 16), CG neurons plated on laminin-1 (lanes 1, 5, 8, 11, 13), fibroblasts (lane 3), E11 myotube membranes (lane 17), thrombocytes (lanes 7, 10), and E6–8 retinae (lane 15) were extracted in sample buffer (lanes 1, 2, 5–14, 16, 17) or 1% Triton X-100 (lanes 3, 4, 15) as described in Materials and Methods. Approximately equal amounts of protein were loaded per lane for each blot. Blots were incubated with polyclonal antibodies against α1 (lanes 3, 4), α2 cyto (preimmune, lanes 5, 6, 7; immune, lanes 8, 9, 10), α3 (Ex2, lanes 11, 12), α6 (Ex, lanes 13, 14, 15), or monoclonal antibodies against β1 (TASC, lanes 1, 2) or α7 (H1, lanes 16, 17). Immunoreactivity was visualized with alkaline phosphatase-conjugated anti-rabbit or anti-mouse antibodies. Arrows indicate bands corresponding to each subunit. The doublets around 97 kDa inlanes 3 and 4 are probably breakdown products of α1 (Duband et al., 1992). The band at 190 kDa inlanes 5 (preimmune) and 8 (immune) is nonspecific. The lower Mr band in lane 17 is a common breakdown product of α7 (Bao et al., 1993). Numbers denote positions of Mr marker proteins in kilodaltons. Abbreviation: pi, preimmune.
In Figure 3B, lanes 1 and 3 were described incorrectly. However, Sepharose CL-4B control precipitates were indistinguishable from those shown, so this figure is not reproduced. The legend should read as follows:
α6 and α3 heterodimerize with β1 in CG neurons. β1-Containing integrin heterodimers were immunoprecipitated from surface-biotinylated CG cells with anti-β1 (W1B10) mAb coupled to protein-A Sepharose. Immunoprecipitates were visualized directly by chemiluminescent detection of HRP-streptavidin (lane 1-sample buffer only; lane 2, antibody-coupled Sepharose), then probed with anti-α6Ex (lanes 3, 4). Similar immunoprecipitates were probed with anti-α3Ex2 (ip, lane 5). Triton X-100 extracts of chick breast fibroblasts (CEF, lane 6) and whole ciliary ganglia (CG, lane 7) were also blotted as positive controls.Arrows indicate bands corresponding to α6 or α3. Numbers indicate Mr in kilodaltons.
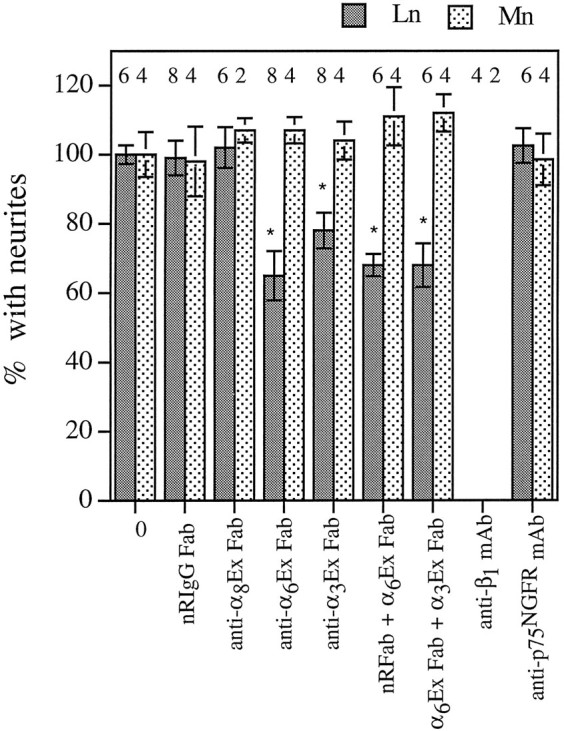
In Figure 6, some error bars were not standard deviations as described and some of the number of cultures examined per condition were incorrect. The corrected figure with error bars indicating standard deviations appears below.

Antibodies to α6 and α3inhibit CG outgrowth on laminin-1, but not on merosin.Dissociated E7.5 CG neurons were plated on laminin-1 (Ln) or merosin (Mn) and cultured for 4–5 hr (Mn) or 9–10 hr (Ln) in the presence of no antibody (0), normal rabbit IgG Fab (NRIgG Fab, 500 μg/ml), anti-α8Ex Fab (500 μg/ml), anti-α6Ex Fab (500 μg/ml), anti-α3Ex1 Fab (500 μg/ml), Fab combinations, anti-β1 mAb (W1B10, 25 μg/ml), or control mAb (anti-P75NGFR, 20 μg/ml). Values were normalized to the percentage of neurons with neurites in the absence of antibody (mean ± SD or range). The number of cultures examined per condition is indicated above each bar. Dunnett’s test for multiple comparisons against a single control was used to determine significance (Glanz, 1992). *p < 0.01 compared to no antibody (0) control.
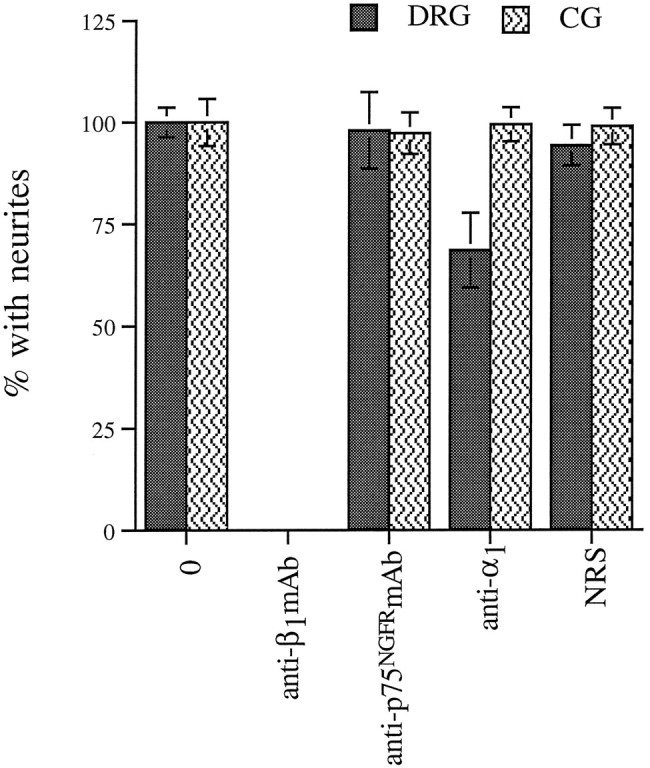
In Figure 7, the error bars were not standard deviations as described. The corrected figure with standard deviations correctly indicated appears below.

Anti-α1 antibodies fail to block outgrowth of CGs, but reduce DRG outgrowth on laminin-1.Dissociated E7 DRGs and CGs were plated on laminin-1 and allowed to extend neurites for 4–5 hr (DRGs) or 8–10 hr (CGs) in the presence of no antibodies (0), anti-chicken β1 mAb (W1B10; 50 μg/ml), anti-rat p75NGFRmAb (mc192; 50 or 20 μg/ml), anti-α1 serum (1:25), or control serum (NRS; 1:25).The degree of outgrowth reduction observed in the presence of the anti-α1 serum is very similar to that reported by Tomaselli et al. (1993) for human DRG cultured in the presence of a monoclonal anti-α1 antibody. Values represent mean ± SD of at least four determinations from at least two separate experiments, each performed in duplicate.
In Table 1, the legend should read as follows:
Neurite lengths in the presence of anti-α6Ex and anti-α3Ex1. Representative cultures from the experiments in Figure 6 were examined for effects of integrin-specific antibodies on neurite length. Processes longer than 1 cell body diameter were measured as described in Materials and Methods. Values represent mean neurite length ± SD (on laminin) or ± range (on merosin), normalized to mean length under control conditions.nindicates the number of processes measured for each condition.Statistical significance was determined using Dunnett’s test for multiple comparisons against a single control, performed using normalized data.
*p < 0.05; **p < 0.01;†p > 0.05 (not significantly different from control).
We apologize for these errors and deeply regret any inconvenience this has caused other scientists.


