

Abstract
Whether Ca2+ released from stores within the presynaptic nerve terminals also contributes to the Ca2+elevation evoked by action potentials was tested in intact bullfrog sympathetic ganglia. Intraterminal Ca2+ transients (Δ[Ca2+]i) were evoked by electrical shocks to the presynaptic nerves at 20 Hz and were monitored by fura-2 fluorimetry. Ca2+ released through intraterminal ryanodine-sensitive channels accounted for 46% of the peak Ca2+ elevation. Moreover, in half of the terminals when intraterminal release was blocked by ryanodine, Δ[Ca2+]i reached a plateau at 200 ± 24 nm. Because 20 Hz is a frequency favorable for the release of a neuropeptide, luteinizing hormone releasing hormone (LHRH) from these presynaptic nerve terminals, and because the threshold level for LHRH release is 186 nm, intraterminal Ca2+release during nerve firing is likely to play a major role in regulating LHRH release. The intraterminal ryanodine channels were facilitated by caffeine as in other tissue. The releasable ryanodine-sensitive store could elevate the intraterminal [Ca2+] by an amount as high as 1.6 μm at a rate as fast as 250 nm/sec. The store could be refilled within 100 sec after a maximal discharge of its content by 20 Hz firing. Oscillation of [Ca2+]i evoked by 20 Hz nerve firing occurred in normal Ringer solution, in ryanodine, and in caffeine with a periodicity of ∼10 sec. Besides the facilitatory effects on the ryanodine-sensitive channels, caffeine also had inhibitory effects on Δ[Ca2+]i via its action on a different process.
Keywords: synaptic transmission, presynaptic calcium dynamics, fura-2 fluorimetry, neuropeptide release, ryanodine channel, intraterminal Ca2+ store, ryanodine, caffeine
Unlike synaptic vesicles, which are clustered at the presynaptic release site (Heuser et al., 1974) where most of the voltage-gated Ca2+ channels are located (Robitaille et al., 1990), neuropeptide-containing dense-cored vesicles are typically located at some distance away from this site (Taxi, 1967) (Y.-y. Peng and A. Lysakowski, unpublished data). The distance of dense-cored vesicles from the Ca2+ entry zone on the plasma membrane makes it possible for Ca2+ released from the stores within the terminal to affect their exocytosis. One of these internal stores is the smooth endoplasmic reticulum, which is present in the nerve terminals (Taxi, 1967; McGraw et al., 1980; Hartter et al., 1987) (Y.-y. Peng and A. Lysakowski, unpublished data). The small diameter of typical nerve terminals (0.5–5 μm) allows Ca2+ entering through the plasma membrane channels during nerve firing to equilibrate throughout the terminal within 10 msec (Peng and Zucker, 1993). This means that the Ca2+ channels on smooth endoplasmic reticulum can be induced to release Ca2+ within 10 msec after the initial influx of Ca2+ through the voltage-gated channels. Given the fast activation time for the ryanodine-sensitive Ca2+ release channels (τact = 1.4 msec for the cardiac channel and 1.28 msec for the skeletal channel) (Gyorke et al., 1994), this release could potentially affect various Ca2+-dependent processes at the terminals that have an onset of ≥10 msec after the initial Ca2+ influx through the plasma membrane channels. Examples of such processes are exocytosis of the dense-cored vesicles and facilitation and potentiation of the release of fast-acting neurotransmitters.
Here I report that intraterminal Ca2+ release played a major role in determining the intraterminal Ca2+ transients that controls LHRH release from the preganglionic nerves in intact bullfrog sympathetic ganglia. The functional capacity and dynamics of the intraterminal ryanodine-sensitive Ca2+ store will also be described.
This work has been published in abstract form (Peng, 1993, 1995).
MATERIALS AND METHODS
Preparation of isolated bullfrog sympathetic ganglia, electrical stimulation to presynaptic nerve, selective filling of preganglionic nerve terminals with membrane-impermeant fura-2 pentapotassium salt, and fura-2 fluorimetric measurements of [Ca2+]i in these terminals were carried out as described previously (Dodd and Horn, 1983; Peng and Horn, 1991; Peng and Zucker, 1991, 1993). Briefly, preparations containing paravertebral ganglia 8–10 were isolated from 12–18 cm bullfrogs (Rana catesbiana). The sympathetic chain was cut ∼4 mm rostral to ganglion 9. A grain of fura-2 pentapotassium was placed at the cut end of the sympathetic chain, which was placed on a small platform. The presynaptic axons were filled with fura-2 within 2–4 hr, and the terminals were filled in an additional 2–10 hr. The presynaptic nerves were stimulated electrically via a suction electrode that was tightly fitted to the cut end of the sympathetic chain. Fura-2 emission from either individual terminals or a group of terminals apposed to individual C neurons was measured by a photomultiplier tube (Thorn EMI). The fura-2 emission from either a group of terminals on a given cell or one of these terminals was selectively measured by adjusting a field diaphragm that was interposed between the barrier filler for fura-2 emission and the photomultiplier tube. The Ca2+concentration was calculated as described previously (Peng and Zucker, 1993). The fluorimetric data were digitized at 0.2–1 kHz. Normal Ringer solution contained (in mm): NaCl 115, KCl 2, CaCl2 1.8, HEPES 2, pH 7.25–7.26. Salts were from Sigma (St. Louis, MO).
After ryanodine was added to the bathing solution, the preganglionic nerve was stimulated by 15–20 bursts of 40 shocks at 20 Hz every 2 min before the ryanodine effect was assayed. These brief stimulations were applied to open the ryanodine channels that can be better blocked by the drug. Ryanodine was from Calbiochem (La Jolla, CA), and caffeine was from Sigma.
Trains of electrical shocks delivered at 20 Hz were used to stimulate the presynaptic nerves, and fura-2 fluorimetry was used to monitor [Ca2+]i in a group of terminals, all of which were in contact with the same C cell. A group of such terminals will be called a unit. For a given unit, Ca2+ responses to one or more trains of stimuli were studied. When more than one stimulation train was used, the trains delivered every 2 min. Because the effects of ryanodine were irreversible, different trains of stimuli were delivered in normal Ringer solution first, and then the same set of trains was used in ryanodine. In ryanodine, different trains of stimuli were delivered in the same order as in normal Ringer solution for the consideration of possible temporal effects of intraterminal dynamics on the Ca2+ responses to a given stimulation. When more than one ryanodine concentration was used, the concentrations were applied incrementally.
RESULTS
Ryanodine has been shown to block the intracellular Ca2+ release channels on the smooth endoplasmic reticulum in other neuronal (Ashley, 1989; McPherson et al., 1991) and muscle (Fabiato, 1985; Rousseau et al., 1987) tissue. It was used, therefore, to assay the involvement of Ca2+ release from the smooth endoplasmic reticulum during nerve firing within the preganglionic nerve terminals.
Effects of ryanodine on intraterminal [Ca2+] transients evoked by nerve firing
The effects of ryanodine on intraterminal [Ca2+]i were studied in 19 groups of terminals, each group in contact with a single C cell, i.e., 19 units. Intraterminal [Ca2+]i, measured by fura-2 fluorimetry, was elevated by trains of electrical shocks to the cut end of presynaptic nerves. The stimuli were delivered at 20 Hz because it is the favorable stimulation for LHRH release (Peng and Horn, 1991). Intraterminal [Ca2+]i was studied in a group of boutons contacting a cell (i.e., a unit) instead of individual boutons for three reasons. First, like all other synapses, the preganglionic fiber(s) innervates a ganglionic cell through tens of synaptic boutons (Jan and Jan, 1982; Baluk, 1986; Peng and Zucker, 1993), and the amount of release recorded postsynaptically is the summation of release from all of these presynaptic sites. Second, synaptic transmission for any given terminal is a stochastic event. In other words, the probability for a specific release site to have a vesicle undergoing exocytosis after action potential invasion is less than one. Thus, for any release event recorded postsynaptically, a specific presynaptic release site may or may not contribute to this release. Third, as shown in Figure 1, for a given stimulation, the evoked [Ca2+] transients (Δ[Ca2+]i) in an individual bouton of a unit could differ greatly from the overall Δ[Ca2+]i for the unit. Therefore, Δ[Ca2+]i in a single bouton might very well not be correlated to the release recorded.
Fig. 1.

Comparison of Δ[Ca2+]iin a set of presynaptic terminals in contact with a C neuron (i.e., aunit) and in one of these terminals. Responses were evoked by 100 stimuli delivered at 20 Hz in normal Ringer solution (NR). The dotted line at the bottomindicates the 0 [Ca2+]i level.
Because the ryanodine effect was not readily reversible, it was important to ascertain that when ryanodine had no effect on an intraterminal Δ[Ca2+]i, the same stimulation train evoked similar responses over the entire period of an experiment. When a [Ca2+]i transient evoked by a stimulation train was not affected by four concentrations of ryanodine applied over a period of 3 hr, all of the transients evoked by the same stimulation were entirely superimposable (Fig.2A). For this unit, two more responses were evoked after the response shown in Figure 2A, and both were inhibited by ryanodine. The reason for this transient not to be affected by ryanodine will be discussed below. Figure2B illustrates that large Ca2+ responses that were ryanodine-sensitive remained stable in normal Ringer solution for 1.5 hr. Similar results were obtained in another five units in which, over periods between 1.5 and 2 hr, responses to the same stimulation remained stable (peak Ca2+ ranged from 400 to 750 nm). A typical experiment lasted for a much shorter time because only one or two ryanodine concentrations were used and because responses in normal Ringer solution were elicited within a much shorter period of time. Thus, the observed effects of ryanodine on intraterminal [Ca2+] transient were not caused by intrinsic temporal variability of the responses of a unit.
Fig. 2.
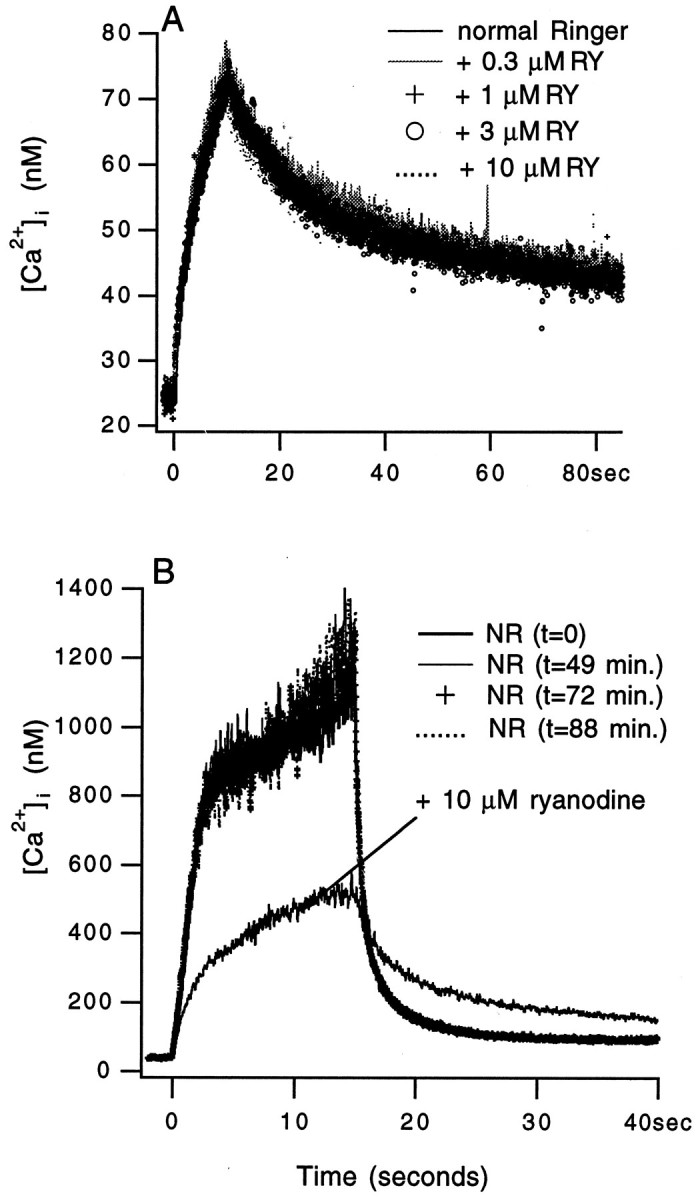
Stability of the intraterminal Δ[Ca2+]i in response to a given stimulation. A, Superimposed are five traces recorded from a unit in response to 200 stimuli delivered at 20 Hz in different bathing solutions. Ryanodine (RY) was added to the bathing solution in increasing concentrations. The 10 μmryanodine trace was recorded more than 3 hr after the trace in normal Ringer solution (NR) was taken. B, Superimposed are five traces recorded from another unit in response to 300 stimuli delivered at 20 Hz. The first four responses were recorded in normal Ringer solution over a period of 88 min. The response in ryanodine was recorded last.
Ryanodine inhibited the peak amplitude of the intraterminal Ca2+ transients
The amount of ryanodine inhibition was calculated as 100 × (1 − [Ca2+]peak,RY/[Ca2+]peak,NR), where RY and NR are abbreviations for ryanodine and normal Ringer, respectively. Ryanodine (10 μm) reduced peak [Ca2+]i in all of the units (n = 19) studied. Moreover, for different responses in a given unit, ryanodine reduced peak [Ca2+]iby different amounts. Typically, trains with more stimuli evoked higher peak [Ca2+]i in normal Ringer solution, which was more strongly inhibited by ryanodine as illustrated in Figure3. This is consistent with ryanodine blockade of the internal Ca2+ release channels, the probability of which for being open in a given response was proportional to [Ca2+]i (Bezprozvanny et al., 1991). In normal Ringer solution, responses to long stimulation trains (≥300 stimuli) tended to either reach a plateau or even decay during the later part of the stimulation (Fig. 3C). This was caused mainly by increased Ca2+ removal by the mitochondria as blockade of this process abolished both the apparent plateau and the decay of [Ca2+]i during stimulation (Peng, 1994).
Fig. 3.
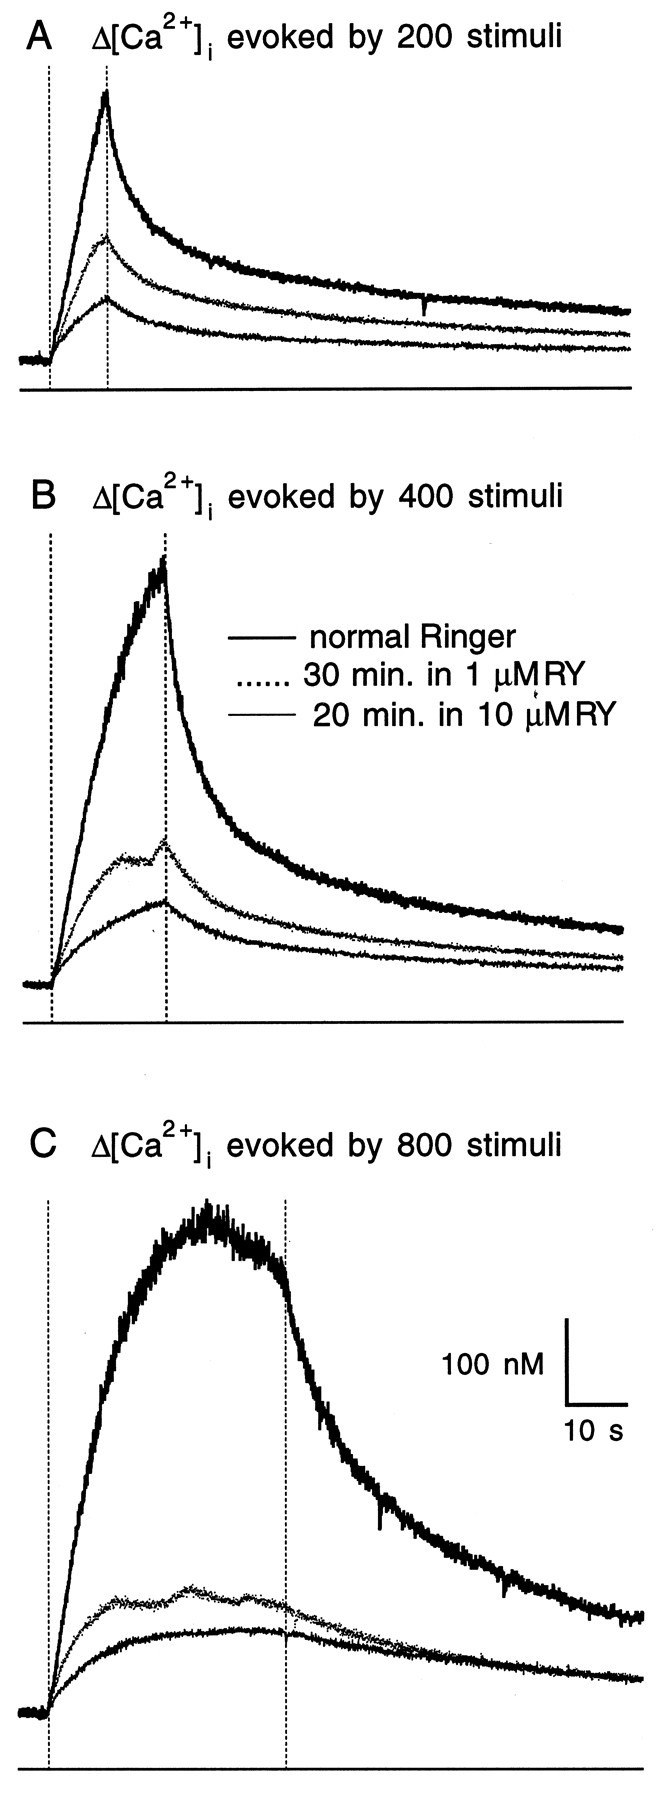
Effect of ryanodine on Δ[Ca2+]i in the presynaptic terminals synapsing onto a C cell. A–C, Superimposed traces are Δ[Ca2+]i recorded in normal Ringer solution and in ryanodine (RY) evoked by 200 (A), 400 (B), and 800 (C) stimuli. Ryanodine (10 μm) was added to the bathing solution after the effects of 1 μm RY on different responses were recorded. For each panel, the dotted vertical lines correspond to the beginning and the end of 20 Hz stimulation, and the thin line at thebottom indicates the 0 [Ca2+]ilevel.
The largest ryanodine inhibition in each of the 19 units varied from 12 to 83% (Fig. 4) with a mean value of 46.32 ± 5.46% (mean ± SE, n = 19). For the maximum inhibition observed in different units, the higher the nerve-evoked peak [Ca2+]i in normal Ringer solution the bigger the ryanodine inhibition, as in the case of different responses of a given unit. Despite the variability in the ryanodine effect, the fact that the drug affected the peak [Ca2+]iin all units studied indicated that ryanodine-sensitive Ca2+ transient was involved in intraterminal Δ[Ca2+]i evoked by nerve firing in all units.
Fig. 4.

Maximum ryanodine inhibitions of the peak [Ca2+]i ([Ca2+]p) in 19 units are plotted against their corresponding peak [Ca2+]i in normal Ringer solution. The percent inhibition was calculated as 100 × (1 − [Ca2+]peak,RY/[Ca2+]peak,NR).
Ryanodine decreased the rate of rise of the intraterminal Ca2+ transients
As ryanodine reduced the [Ca2+]p to a large extent, it followed that during the same duration of [Ca2+]i rise, i.e., the duration of the stimulation train, ryanodine decreased the overall rate of [Ca2+]i rise. Ryanodine inhibition on the rate of [Ca2+]i rise was detected as low as when [Ca2+]i was 41 nm (Fig.5).
Fig. 5.

Ryanodine decreased the rate of rise of Δ[Ca2+]i. The traces are the rising phases of the responses in Figure 3A.
Ryanodine clamped the intraterminal Ca2+ transients near the threshold level for LHRH release
In 10 of the 19 units, ryanodine channels played such a dominating role in nerve-evoked Δ[Ca2+]i that when they were blocked, [Ca2+]i either reached a plateau at or oscillated around a level (199.5 ± 24.0 nm) similar to the threshold for peptide release (186 ± 41 nm) (Peng and Zucker, 1992, 1993) (Figs.3C, 6).
Fig. 6.

Ryanodine clamped nerve-evoked Δ[Ca2+]i near the threshold level of [Ca2+]i for LHRH release. Superimposed [Ca2+]i traces were responses evoked by 50, 100, 150, 200, 300, 600, and 1000 stimuli. All stimuli were delivered at 20 Hz. The 0 [Ca2+]i level is indicated by the line at the bottom of each panel. Thedotted vertical lines in A and Bindicate the time when later stimuli no longer produced net increase in [Ca2+]i. Note that this time corresponded to the 460th stimulus in NR and the 200th stimulus in RY.
Dynamics and functional capacity of intraterminal ryanodine-sensitive store
For these investigations, 20 Hz stimulation trains with different durations were applied every 2 min. Both the dynamics of the refilling process and the capacity of the store reported below were limited to the refilling and the capacity of the store as revealed by 20 Hz nerve firing. They were not the maximal rate of the refilling process or the absolute capacity of the store.
The dynamics of the refilling of the ryanodine-sensitive store
Obviously, besides Ca2+ release from the ryanodine-sensitive store, the store is also refilled by Ca pump during the period between two stimulation trains. This refilling process is best demonstrated in the two units in which at rest the ryanodine-sensitive store did not appear to contain Ca2+that was releasable by 20 Hz stimulation. With one of the two antagonistic processes out of the picture, i.e., the Ca2+release process being inactive, the result of the refilling process was clearly discernable. Data from one of these units are shown in Figure7. In this case, ryanodine had no effect on the response to the stimulation train delivered at the beginning of the experiment (Fig.7A). In fact, this response remained unaltered over the course of more than 3 hr during the applications of four different concentrations of ryanodine (see Fig. 2). Traces in 10 μm ryanodine shown in Figure 7 were recorded as the last set of traces. Responses evoked later were inhibited by ryanodine (Fig.7B). Moreover, for the first 10 sec of the responses, the later stimulation (containing 400 stimuli) evoked higher Δ[Ca2+]i (Fig. 7C). These observations were consistent with a situation in which at the time of the first stimulation, the intraterminal store contained no releasable Ca2+. Charging of the store by the Ca2+ influx through the plasma membrane channels evoked by the first stimulation was followed by its subsequent release in the second response. This interpretation predicts that when the release is blocked by ryanodine, the initial 10 sec of the second response should be the same as that of the first response. This was the case as illustrated in Figure7D. Furthermore, the ryanodine-sensitive difference of the rising phases for sequential responses was observed for all of the other units as illustrated in Figure 8, whether the first response had a ryanodine-sensitive component or not. These results suggest that the ryanodine-sensitive store was typically filled to a slightly higher level 2 min after than at the beginning of a 20 Hz stimulation.
Fig. 7.

Refilling of the ryanodine-sensitive store by Ca2+ influx produced by 20 Hz nerve firing. A,The superimposed traces are the Δ[Ca2+]i in response to the first stimulation (200 stimuli) recorded from a unit in normal Ringer solution (NR) and in 10 μmryanodine (RY). Note that it was not inhibited by RY.B, The superimposed traces are the responses to the subsequent stimulation (400 stimuli), which was 2 min after the beginning of the 200 stimuli train in NR and in 10 μm RY. This response was reduced by RY. C, D, Superimposed traces are the first 20 sec of the Δ[Ca2+]i evoked by 200 and 400 stimuli recorded in NR (C) and in RY (D). The thin line at the bottom of each panel indicates the 0 [Ca2+]i level. Thevertical dotted line at the left in each panel indicates the time when the stimulation began, and the vertical dotted line at the right indicates 10 sec (A, C, D) and 20 sec (B) later.
Fig. 8.

Releasing and refilling of the ryanodine-sensitive store by 20 Hz nerve firing. The superimposed traces are the first 40 sec of the Δ[Ca2+]i recorded from the unit in Figure 3 in normal Ringer solution (NR; A) and in 10 μm ryanodine (RY; B). These transients were evoked by three stimulation trains containing 200, 400, and 800 stimuli, correspondingly. The stimulation trains were delivered every 2 min in the order of increasing durations. For each trace, the number of applied stimuli is indicated. The thin line at thebottom of each panel indicates the 0 [Ca2+]i level. The vertical dotted lines in each panel indicate the time in seconds (10 and 20) after the stimulation began.
The functional capacity of the store
An estimate of the functional capacity of the internal store was made operationally as the maximum amount of intraterminal [Ca2+]i elevation caused by release from the store during 20 Hz nerve firing. The difference traces, representing the ryanodine-sensitive component of Δ[Ca2+]i, were calculated by subtracting the ryanodine traces from the normal Ringer traces. The functional capacity of the store in a given unit was taken as the saturated peak amplitude of the difference traces. For the unit in Figure9, the peak amplitude of ryanodine-sensitive Δ[Ca2+]i increased as the number of stimuli increased from 50 to 460 and reached its saturating level (1.43 μm) 23 sec after the stimulation began, as later stimuli in the responses evoked by 600 and 1000 stimuli trains did not cause further increase (Fig. 9A).
Fig. 9.
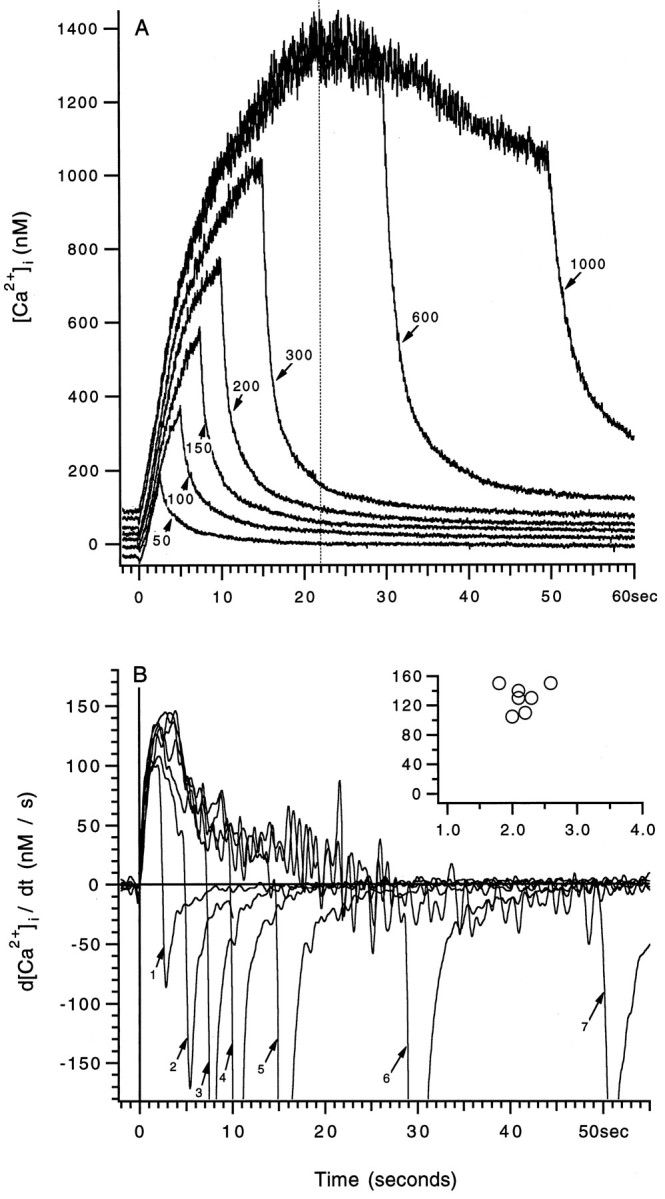
The functional capacity, the rate of discharge, and the recovery of the intraterminal ryanodine-sensitive Ca2+ store in a unit. A, Temporally superimposed difference traces of [Ca2+]i were obtained by subtracting the records collected in RY (data in Fig. 6B) from those collected in NR (data in Fig. 6A) that were evoked by the same stimulation. For each trace, the number of stimuli in the stimulation is indicated. B, The traces are the rates of discharge of the ryanodine-sensitive store (i.e., the time derivative of the difference traces in A) in response to 50, 100, 150, 200, 300, 600, and 1000 stimuli, correspondingly, labeled as1–7. Note that the peak rates for the responses were very similar in both their amplitudes and their times of occurrence. The maximum rates of discharge for the seven responses are plotted against their times of occurrence in the inset of B. For all panels, time 0 corresponds to the beginning of stimulation.
Another estimate of the functional capacity of the store was made by assessing the effect of caffeine on resting [Ca2+]i. This measurement was possible because caffeine increases the affinity of ryanodine channels for Ca2+ (Endo, 1985) and prolongs their open time (Rousseau et al., 1988). At rest, caffeine most likely had facilitated Ca2+ release through the ryanodine channels (inhibitory effects of caffeine on Δ[Ca2+]i are reported below). Caffeine was applied several minutes after the last train of stimulation in normal Ringer solution. Ryanodine was added to the bathing solution after the effect of caffeine on resting [Ca2+]i was washed out. For one unit, the capacity of the ryanodine-sensitive store was 0.625 μm as measured by the peak increase in resting [Ca2+]i by 10 mm caffeine (Fig.10).
Fig. 10.

The functional capacity of the intraterminal ryanodine-sensitive store as assayed by caffeine facilitation of intraterminal Ca2+ release. A, The trace was the change in resting [Ca2+]i(Δ[Ca2+]r) induced by bath application of 10 mm caffeine. The heavy bar below the trace marks the duration of caffeine presence. The resting [Ca2+]i returned to its control level in 5 min. B, The rate of increase of terminal [Ca2+]r in response to 10 mmcaffeine. Time 0 indicates the beginning of the caffeine-induced rise of the resting [Ca2+]i.
The functional capacity of the ryanodine-sensitive store was obtained for 12 of the 19 units studied, and the results were summarized in Figure 11. The capacity of the store in these units appeared to fall into three groups with values (mean ± SD) as 190 ± 71.5, 585 ± 29.8, and 1458 ± 80.4 nm. The small sample sizes of each group preclude any mechanistic interpretation of this clustering. The variability in the store capacities might reflect differences in these units’ smooth endoplasmic reticulum (SER) content and/or different amount of possible biases (listed below) in the estimation of the capacities for different units.
Fig. 11.

Summary of the functional capacity of the ryanodine-sensitive store in 12 units. The units are numbered arbitrarily.
It must be emphasized that these values are lower estimates of the true capacity of the store. First, because only 20 Hz stimulation was used in the estimation, it at best is the capacity that can be gauged by this paradigm. This is, in fact, the reason for defining the estimate as the functional capacity. Moreover, these are lower estimates of even the true functional capacities because the effects of intraterminal Ca2+ removal processes were ignored. The known cellular Ca2+ removal processes include the Ca2+ pumps on the SER and the plasma membrane, the Ca2+ uniporter on the mitochondria, and the Ca2+-binding proteins in the cytosol. The rates and, therefore, the total amount of Ca2+ removal of these mechanisms depends on the Ca2+ concentration in the cytosol. Thus, before blockade of Ca2+ release from the SER, the higher Ca2+ elevation was likely to cause the removal processes, with the exception of the SER (discussed below), to operate at a higher rate compared with the situation in which lower peak Ca2+ was reached in ryanodine. In other words, in normal Ringer solution for any given moment, the total Ca2+elevation equals: Flux through the plasma membrane Ca2+channels + Flux through the ryanodine channels + Flux from other intraterminal store(s) − removal by SER − removal by other mechanisms (Eq. 1).
In ryanodine, two different situations might arise. In situation 1, ryanodine totally blocked the ryanodine channels (McPherson et al., 1991) and the SER was not completely full so that it still served as a sink for Ca2+. The total Ca2+ elevation equals: Flux through the plasma membrane Ca2+ channels + Flux from other intraterminal store(s) − removal by SER − removal by other mechanisms (Eq. 2). The difference trace was obtained by Eq. 1 − Eq. 2. If the flux through the plasma membrane Ca2+ channels and from other intraterminal store(s) and the total removal were the same in Eqs. 1 and 2, then the difference should be exactly the flux through the ryanodine channels. Assuming ryanodine did not perturb flux from other intraterminal store(s), if there was any Ca2+-dependent inactivation of the plasma membrane channels, then the first term is likely to be smaller in Eq. 1 than in Eq. 2, whereas the absolute values of the last two terms are larger in Eq. 1 than in Eq. 2 for reasons given above. Both factors will cause the difference measurement to be a lower estimate of the true functional capacity.
In situation 2, SER was no longer a sink for Ca2+ in ryanodine. Thus, Eq. 2 becomes: total Ca2+ elevation = Flux through the plasma membrane Ca2+ channels + Flux from other intraterminal store(s) − removal by other mechanisms (Eq. 3). It could be the case that either ryanodine locked the channels at a subconductance state, as reported for ryanodine channels found in some neuronal and muscle tissues (Fabiato, 1985; Rousseau et al., 1987;Ashley, 1989) or the store was completely full and ryanodine blocked the channels. In the first case, the terms for flux through the ryanodine channels and removal by SER in Eq. 1 would cancel each other because they are equal in absolute value but opposite in their direction of movement. The intraterminal Ca2+ could thus be described by Eq. 3. In the latter case, as flux through the ryanodine channels and removal by SER both become zero, intraterminal Ca2+ could again be described by Eq. 3. Note that the difference between Eq. 1 − Eq. 3 has an additional negative term, i.e., “− removal by SER in normal Ringer,” as compared to Eq. 1 − Eq. 2 in situation 1. Other factors being equal to those for situation 1, the difference measurement in situation 2 would be an even lower estimate of the true functional capacity than in situation 1.
The rate of intraterminal Ca2+ elevation caused by discharge of the ryanodine-sensitive store
The rate of intraterminal [Ca2+] elevation caused by discharge of the ryanodine-sensitive store in response to 20 Hz nerve firing will be called simply the rate of discharge of the store. It was calculated by taking time derivatives of the difference traces (d[Ca2+]NR-RY/dt). Such traces for the responses evoked by sequential trains of increasing durations are illustrated in Figure 9B, and their peak values were plotted against their times of occurrence in the inset. For this unit, the peak discharge rates for the seven sequential responses evoked by increasing durations of stimulations were increased from 110 to 150 nm/sec, occurring 2–3 sec after the stimulation started.
For the 12 units in which the functional capacities of their ryanodine-sensitive store were estimated, their maximum rates of discharge of the store varied between 27 and 250 nm/sec with an average of 112.8 ± 21.9 nm/sec. For 10 of these 12 units, the maximum rates of release occurred between 0.5 and 3 sec from the onset of stimulation. The maximum rates were reached later for the other two units (at 7 and 15 sec, respectively). As in the case for estimating the functional capacity of the store, the values for the rate of discharge are likely to be the lower estimates of the true rates of release because the effects of intraterminal Ca2+removal processes were ignored.
The small variability of both the peak discharge rates and their times of occurrence in different responses for a given unit (Fig.9B) suggests that the store was refilled within the time interval between two successive stimulations, i.e., 2 min. Indeed, the store for the unit in Figure 9 was recharged within 100 sec after a maximum amount of discharge by 20 Hz firing, which was the time between the 23rd second during the 600 stimuli train and the beginning of the 1000 stimuli train.
Caffeine affects Δ[Ca2+]i through different intraterminal pathways
Because caffeine increases the affinity of ryanodine channels for Ca2+ and prolongs their open time, its effects on nerve evoked Δ[Ca2+]i were tested in 10 units in which a total of 33 responses were elicited. Surprisingly, caffeine (10 mm) caused the peak [Ca2+]i to increase in only 3 of the 10 units (Fig.12A and the circles in Fig. 12D that have positive values). It caused the peak [Ca2+]i to decrease in six units (Fig.12B and the circles in Fig.12D that have negative values). For another unit, caffeine facilitated and inhibited the peak [Ca2+]i for different responses. The effects of caffeine on [Ca2+]i were reversible.
Fig. 12.

Effect of caffeine on Δ[Ca2+]i. A–C, The superimposed traces are the Δ[Ca2+]i in response to 20 Hz nerve stimulation collected in normal Ringer solution (NR), 10 μm ryanodine (RY), and 10 mm caffeine (CF). For each panel, the duration of the stimulation is indicated by the vertical dotted lines, the 0 [Ca2+]i level is marked by the line below the traces, and the order by which CF and RY were added to NR is labeled at the top. D, Effects of 10 mm CF on the peak [Ca2+]i([Ca2+]p) compared to that in NR ([Ca2+]p,NR) are plotted against their corresponding [Ca2+]p in NR (33 responses in 10 units). The percent effects were calculated as 100 × [([Ca2+]p,CF/[Ca2+]p,NR) − 1]. The positive values indicate facilitation, whereas the negative values indicate inhibition. E, Inhibitions caused by 10 mm CF on [Ca2+]p compared to that in NR with 10 μm RY added ([Ca2+]p,(NR+RY)) are plotted against their corresponding [Ca2+]p in NR + RY (11 responses in 4 units). The effects were calculated as 100 × [([Ca2+]p,CF/[Ca2+]p,(NR+RY)) − 1]. Note that after ryanodine treatment, caffeine caused only inhibition.
Besides its well known effects on the ryanodine-sensitive channels, caffeine was reported recently to reduce intracellular [Ca2+] in epithelial cells and to promote Ca2+ sequestration into an IP3-insensitive store (Hoffer and Machen, 1994). Caffeine also blocked the IP3-activated Ca2+ release channels isolated from the cerebellum tissue (Bezprozvanny et al., 1994). Thus, there are at least two possible mechanisms whereby caffeine can reduce [Ca2+]i. Depending on the relative capacities and rates of release of the ryanodine-sensitive (facilitated by caffeine) and the caffeine-inhibited stores, caffeine alone would produce either a net facilitatory or a net inhibitory effect on the Δ[Ca2+]i.
Regardless of the mechanism(s) that underlies caffeine inhibition, if there were ryanodine channels facilitated by caffeine within the terminals, then addition of 10 μm ryanodine after caffeine treatment would invariably decrease the peak value of [Ca2+]i. This was the case for the six units tested in which caffeine facilitated the peak [Ca2+]i for three units (Fig.12A) and inhibited it for the other three units (Fig.12B). Ryanodine inhibition of the [Ca2+]i in caffeine is consistent with the well known antagonistic effects of caffeine and ryanodine on the ryanodine channels.
Because ryanodine further inhibited the peak [Ca2+]i for the three units in which caffeine had already decreased it (Fig. 12B), the apparent inhibitory effect of caffeine, as compared with the responses in normal Ringer solution, could not have been caused by the depletion of the smooth endoplasmic reticulum store via its effect on the ryanodine channels. Instead, the reduction of the peak [Ca2+]i by caffeine in these experiments was likely to be produced via a pathway other than the ryanodine-sensitive channels. This assessment was supported further by the results of another set of experiments, in which the effect of caffeine after ryanodine treatment was assayed (4 units). In all responses except one, caffeine caused an additional 5–70% inhibition (Fig.12C,E). For the exceptional response, caffeine produced no further effect on peak [Ca2+]i. For these experiments, because 10 μm ryanodine had already blocked most of the ryanodine channels, caffeine was not likely to reduce further the peak [Ca2+]i by opening the ryanodine channels and thereby depleting this store afterward. In summary, the net effect of caffeine on Δ[Ca2+]i depended on the proportionality by which the ryanodine-inhibitable and the caffeine-inhibitable Ca2+ fluxes contributed to a Δ[Ca2+]i in a given unit.
Oscillation of intraterminal [Ca2+]
Caffeine has been used to induce [Ca2+] oscillation in the cell body of many types of tissue (for review, see Tsien and Tsien, 1990). Here I report that intraterminal [Ca2+] oscillation occurred in response to nerve firing alone, as shown in Figure 12C, and in another three units with a period of 10.1 ± 1.7 sec (mean ± SE for 8 responses). It was also induced by inhibiting, instead of facilitating, Ca2+release through the ryanodine channels, as illustrated in Figures3C and 12C, and in another four units with a period of 9.0 ± 1.5 sec (for 16 responses). Furthermore, as shown in Figure 12C, when intraterminal [Ca2+] oscillation occurred both in normal Ringer solution and in ryanodine, it was abolished by addition of caffeine.
DISCUSSION
The reason for choosing ryanodine instead of caffeine to investigate the involvement of intraterminal Ca2+ release in regulating peptide release was twofold. The first and main reason for this choice was that this was an investigation of whether the process of Ca2+ release was evoked by nerve firing and, hence, played a role in the dynamics of terminal Δ[Ca2+]i under physiological conditions. Therefore, an arbitrary enhancement of this process by caffeine would have no bearing on the investigation. The second reason was that caffeine also affects process(es) other than the ryanodine-sensitive pathway. A study on intraterminal Ca2+ release from the IP3-sensitive store is currently underway. Caffeine has been much used in various tissue for the sole purpose of detecting the involvement of Ca2+ release through the ryanodine channels (for review, see Tsien and Tsien, 1990). Recent results suggest that this simple interpretation of the effects of caffeine is not always justified (Bezprozvanny et al., 1994; Hoffer and Machen, 1994).
As shown in Results, the intraterminal ryanodine channels had properties that were comparable to ryanodine channels studied in isolation. They could be activated by [Ca2+]ibetween 40 and 2.6 μm (Rousseau et al., 1988;Bezprozvanny et al., 1991), blocked by 1–10 μm ryanodine (Rousseau et al., 1987; Ashley, 1989; McPherson et al., 1991), and facilitated by caffeine (Endo, 1985; Rousseau et al., 1988; McPherson et al., 1991). Thus, it is likely that the intraterminal channels also have a very fast activation time constant (which was 1.4 msec for the isolated cardiac channels; Gyorke et al., 1994). The small size of a typical nerve terminal (quasispheres with diameters of 0.5–5 μm) allows the Ca2+ entering through the plasma membrane channels to equilibrate within 10 msec (Peng and Zucker, 1993) and, therefore, can increase the rate of Ca2+release from the smooth endoplasmic reticulum within this time. If the intraterminal ryanodine channels can be activated as fast as the isolated channels, then Ca2+-dependent phenomena that occur at the terminals with a delay of ≥10 msec after the initial Ca2+ influx through the plasma membrane channels can potentially be affected by the intraterminal Ca2+ release through the ryanodine channels.
Exocytosis of dense-cored vesicles is one such phenomenon because the shortest synaptic delays of postsynaptic current caused by release of LHRH are >100 msec. In half of the terminals studied, ryanodine reduced the peak [Ca2+]i elevation to the threshold level for LHRH release. It is likely, therefore, that for these terminals, Ca2+ released through the ryanodine channels supplied the Ca2+ elevation sufficient for LHRH release whereas the influx through the plasma membrane Ca2+channels had only primed it (Peng and Zucker, 1992, 1993). For the rest of the units, Ca2+ release through the ryanodine channels increased the peak amplitude and the duration of the Ca2+elevation. The resultant increase of the time integral of Ca2+ elevation above the threshold level for LHRH release is likely to enhance the release because this time integral has been shown to be proportional to LHRH release (Peng and Zucker, 1993).
The variability of ryanodine inhibition for different units was attributable mainly to the different peak Ca2+ reached by the responses in normal Ringer solution as shown in Figure 4. Considering that other variables such as SER content for a given unit and whether the release channels were blocked or locked at a subconductance state by ryanodine might also played a role, the variability in ryanodine effects for different units is not surprising. The maximum percent inhibition for different unit was measured for responses evoked by 100, 300, 600, 800, and 1000 stimuli. There is no apparent correlation between the number of stimuli and the percent inhibition by ryanodine across different units.
Other examples of Ca2+-dependent phenomena that occur at the terminals with a delay of ≥10 msec after the initial Ca2+ influx through the plasma membrane channels are facilitation and potentiation. Therefore, studies of these processes should include an investigation of the involvement of the intraterminal Ca2+ release mechanism. Moreover, when studying these processes, it should be noted that although photolysis of Ca2+ chelators has become a valuable tool, this technique may not produce uniform increases in intraterminal Ca2+because of the probable spatial heterogeneity of Δ[Ca2+] near the smooth endoplasmic reticulum.
In sharp contrast, the exocytosis of the synaptic vesicles in response to a single action potential is not likely to be affected by Ca2+ release from the intraterminal stores. The main reason for this is the very brief (≤200 μsec) delay between Ca2+ influx through the voltage-gated Ca2+channels at the active zone and the postsynaptic response (Llinas et al., 1981).
Because release from the ryanodine-sensitive store can elevate the intraterminal [Ca2+] by an amount as large as 1.6 μm, and the store can take 40 sec or more to be depleted, it is obvious that the intraterminal Ca2+ release process can play a significant role in determining the dynamics of Δ[Ca2+] tens of seconds after the closure of the plasma membrane Ca2+ channels. Calcium-dependent processes in the nerve terminals that require seconds or longer of Ca2+elevation can thereby be profoundly affected by this intraterminal Ca2+ release process.
Ca2+ oscillation is typically induced and studied by reagents such as caffeine, IP3, and neurotransmitters that elevate intracellular [Ca2+] at rest in the somata of cells (Lechleiter et al., 1991; Friel and Tsien, 1992; Kohda et al., 1996). Here I report that Ca2+ oscillation also occurred within intact nerve terminals in response to the firing of action potentials. It was also produced by inhibition, instead of facilitation, of Ca2+ release from an intraterminal store. Because the oscillations occurred during the firing of the nerve terminals, its consequences on synaptic transmission will be explored further.
Footnotes
This work was supported by the Alfred P. Sloan Foundation and a grant from the National Institute of Neurological Disease and Stroke (NS32429). I thank Drs. David Ferster and Aaron Turkewitz for editing this manuscript.
Correspondence should be addressed to Yan-yi Peng, Department of Pharmacological and Physiological Sciences, Committees on Neurobiology and Cell Physiology, The University of Chicago, 947 East 58th Street, Chicago, IL 60637.
REFERENCES
- 1.Ashley RH. Activation and conductance properties of ryanodine-sensitive calcium channels from brain microsomal membranes incorporated into planar lipid bilayers. J Membr Biol. 1989;111:179–189. doi: 10.1007/BF01871781. [DOI] [PubMed] [Google Scholar]
- 2.Baluk P. Scanning electron microscopic studies of bullfrog sympathetic neurons exposed by enzymatic removal of connective tissue elements and satellite cells. J Neurocytol. 1986;15:85–95. doi: 10.1007/BF02057907. [DOI] [PubMed] [Google Scholar]
- 3.Bezprozvanny I, Watras J, Ehrlich BE. Bell-shaped calcium-response curves of Ins(1,4,5)P3- and calcium-gated channels from endoplasmic reticulum of cerebellum. Nature. 1991;351:751–754. doi: 10.1038/351751a0. [DOI] [PubMed] [Google Scholar]
- 4.Bezprozvanny I, Bezprozvanny S, Ehrlich BE. Caffeine-induced inhibition of inositol(1,4,5)-trisphosphate-gated calcium channels from cerebellum. Mol Biol Cell. 1994;5:97–103. doi: 10.1091/mbc.5.1.97. [DOI] [PMC free article] [PubMed] [Google Scholar]
- 5.Dodd J, Horn JP. A reclassification of B and C neurones in the ninth and tenth paravertebral sympathetic ganglia of the bullfrog. J Physiol (Lond) 1983;334:255–269. doi: 10.1113/jphysiol.1983.sp014493. [DOI] [PMC free article] [PubMed] [Google Scholar]
- 6.Endo M. Calcium release from sarcoplasmic reticulum. Curr Top Membr Transp. 1985;25:181–230. [Google Scholar]
- 7.Fabiato A. Time and calcium dependence of activation and inactivation of calcium-induced release of calcium from the sarcoplasmic reticulum of a skinned canine cardiac Purkinje cell. J Gen Physiol. 1985;85:247–289. doi: 10.1085/jgp.85.2.247. [DOI] [PMC free article] [PubMed] [Google Scholar]
- 8.Friel DD, Tsien RW. A caffeine- and ryanodine-sensitive Ca2+ store in bullfrog sympathetic neurones modulates effects of Ca2+ entry on [Ca2+]. J Physiol (Lond) 1992;450:217–246. doi: 10.1113/jphysiol.1992.sp019125. [DOI] [PMC free article] [PubMed] [Google Scholar]
- 9.Gyorke SP, Velez B Suarez-Isla, Fill M. Activation of single cardiac and skeletal ryanodine receptor channels by flash photolysis of caged Ca2+. Biophys J. 1994;66:1879–1886. doi: 10.1016/S0006-3495(94)80981-6. [DOI] [PMC free article] [PubMed] [Google Scholar]
- 10.Hartter DE, Burton PR, Laveri LA. Distribution and calcium-sequestering ability of smooth endoplasmic reticulum in olfactory axon terminals of frog brain. Neuroscience. 1987;23:371–386. doi: 10.1016/0306-4522(87)90297-1. [DOI] [PubMed] [Google Scholar]
- 11.Heuser JE, Reese TS, Landis DMD. Functional changes in frog neuromuscular junctions studied with freeze-fracture. J Neurocytol. 1974;3:109–131. doi: 10.1007/BF01111936. [DOI] [PubMed] [Google Scholar]
- 12.Hoffer AM, Machen TE. Direct measurement of free Ca in organelles of gastric epithelial cells. Am J Physiol. 1994;267:G442–G451. doi: 10.1152/ajpgi.1994.267.3.G442. [DOI] [PubMed] [Google Scholar]
- 13.Hoth M, Penner R. Depletion of intracellular calcium stores activates a calcium current in mast cells. Nature. 1992;355:353–356. doi: 10.1038/355353a0. [DOI] [PubMed] [Google Scholar]
- 14.Kohda M, Komori S, Unno T, Ohashi H. Carbachol-induced [Ca2+]i oscillations in single smooth muscle cells of guinea-pig ileum. J Physiol (Lond) 1996;492:315–338. doi: 10.1113/jphysiol.1996.sp021311. [DOI] [PMC free article] [PubMed] [Google Scholar]
- 15.Lechleiter J, Girard S, Peralta E, Clapham D. Spiral calcium wave propagation and annihilation in Xenopus laevis oocytes. Science. 1991;252:123–126. doi: 10.1126/science.2011747. [DOI] [PubMed] [Google Scholar]
- 16.Llinas R, Steinberg IZ, Walton K. Relationship between presynaptic calcium current and postsynaptic potential in squid giant synapse. Biophys J. 1981;33:323–352. doi: 10.1016/S0006-3495(81)84899-0. [DOI] [PMC free article] [PubMed] [Google Scholar]
- 17.Mason MJ, Garcia-Rodriguez C, Grinstein S. Coupling between intracellular Ca2+ stores and the Ca2+ permeability of the plasma membrane. J Biol Chem. 1991;266:20856–20862. [PubMed] [Google Scholar]
- 18.McGraw CF, Somlyo AV, Blaustein MP. Localization of calcium in presynaptic nerve terminals. J Cell Biol. 1980;85:228–241. doi: 10.1083/jcb.85.2.228. [DOI] [PMC free article] [PubMed] [Google Scholar]
- 19.McPherson PS, Kim Y-K, Valdivia H, Knudson M, Takekura H, Franzini-Armstrong C, Coronado R, Campbell KP. The brain ryanodine receptor: a caffeine-sensitive calcium release channel. Neuron. 1991;7:17–25. doi: 10.1016/0896-6273(91)90070-g. [DOI] [PubMed] [Google Scholar]
- 20.Miller RJ. The control of neuronal Ca2+ homeostasis. Prog Neurobiol. 1991;37:255–285. doi: 10.1016/0301-0082(91)90028-y. [DOI] [PubMed] [Google Scholar]
- 21.Peng Y-y Y-y. Ryanodine decreased the amplitude and increased the rate of decay of nerve-evoked Ca2+ transients at the presynaptic terminals of bullfrog sympathetic ganglia. Soc Neurosci Abstr. 1993;19:903. [Google Scholar]
- 22.Peng Y-y (1994) Dynamics of presynaptic Ca2+ and peptide release in bullfrog sympathetic ganglia. In: Computation in neurons and neural systems, pp 39–44.
- 23.Peng Y-y Y-y. Neuropeptide transmission regulated by intraterminal calcium release through ryanodine channels. Soc Neurosci Abstr. 1995;20:25. [Google Scholar]
- 24.Peng Y-y Y-y, Horn JP. Continuous repetitive stimuli are more effective than bursts for evoking LHRH release in bullfrog sympathetic ganglia. J Neurosci. 1991;11:85–95. doi: 10.1523/JNEUROSCI.11-01-00085.1991. [DOI] [PMC free article] [PubMed] [Google Scholar]
- 25.Peng Y-y Y-y, Zucker RS. Intracellular Ca2+ measurements with Fura-2 in presynaptic terminals in bullfrog sympathetic ganglia. Soc Neurosci Abstr. 1991;17:1. [Google Scholar]
- 26.Peng Y-y Y-y, Zucker RS. Release of LHRH is linearly related to the time integral of presynaptic Ca2+ elevation above a threshold level in bullfrog sympathetic ganglia. Soc Neurosci Abstr. 1992;18:576. doi: 10.1016/0896-6273(93)90334-n. [DOI] [PubMed] [Google Scholar]
- 27.Peng Y-y Y-y, Zucker RS. Release of LHRH is linearly related to the time integral of presynaptic Ca2+ elevation above a threshold level in bullfrog sympathetic ganglia. Neuron. 1993;10:465–473. doi: 10.1016/0896-6273(93)90334-n. [DOI] [PubMed] [Google Scholar]
- 28.Robitaille R, Adler EM, Charlton MP. Strategic location of calcium channels at transmitter release sites of frog neuromuscular synapses. Neuron. 1990;5:773–779. doi: 10.1016/0896-6273(90)90336-e. [DOI] [PubMed] [Google Scholar]
- 29.Randriamampita C, Tsien RY. Emptying of intracellular Ca2+ stores releases a novel small messenger that stimulates Ca2+ influx. Nature. 1993;364:809–814. doi: 10.1038/364809a0. [DOI] [PubMed] [Google Scholar]
- 30.Rousseau E, LaDine J, Liu Q, Meissner G. Activation of the Ca2+ release channel of skeletal muscle sarcoplasmic reticulum by caffeine and related compounds. Arch Biochem Biophys. 1988;267:75–86. doi: 10.1016/0003-9861(88)90010-0. [DOI] [PubMed] [Google Scholar]
- 31.Rousseau E, Smith JS, Meissner G. Ryanodine modifies conductance and gating behavior of single Ca2+ release channel. Am J Physiol. 1987;253:C364–C368. doi: 10.1152/ajpcell.1987.253.3.C364. [DOI] [PubMed] [Google Scholar]
- 32.Taxi J. The neuron. Elsevier; Amsterdam: 1967. Observations on the ultrastructure of the ganglionic neurons and synapses of the frog Rana esculenta. [Google Scholar]
- 33.Tsien RW, Tsien RY. Calcium channels, stores, and oscillations. Annu Rev Cell Biol. 1990;6:715–760. doi: 10.1146/annurev.cb.06.110190.003435. [DOI] [PubMed] [Google Scholar]