Abstract
Leech heart interneurons were voltage-clamped with realistic waveforms to investigate the currents underlying the oscillation in the cells. By estimating the leak current parameters in regions in which there was little contamination by voltage-gated currents, it was possible to measure the Ca2+ current, the persistent Na+ current, IP, and the hyperpolarization-activated inward current,Ih.
The experiments verified a prediction of a computer model of HN cells that the shape of the typical waveform was such that the low-threshold Ca2+ currents were partially inactivated during a slow up-ramp to a plateau potential. A step within the same range of the membrane potential as the realistic waveform produced >4 times as much Ca2+ current. In two-cell voltage-clamp experiments, the step produced 20 times more graded inhibition than the normal presynaptic waveform. When the presynaptic heart interneuron oscillated with spikes, the graded inhibition was larger. The difference may arise from integration of a slowly decaying component of the spike-mediated inhibition.
The persistent Na+ current had a very low threshold. During the most hyperpolarized phase of the waveform,IP deactivated to 50% of its maximum conductance. A substantial part of IP, therefore, was effectively contributing to the leak current in the HN cells.
The h-current increased for waveforms that had longer periods, whereas increasing the h-current in the model reduced the period. The h-current thus provides negative feedback to perturbations that alter the period of the oscillation.
Keywords: central pattern generator (CPG), neural oscillator, voltage-clamp, model, graded synapse, h-current
Rhythmic motor patterns such as breathing, heartbeat (in certain invertebrates), feeding and chewing, and locomoting are programmed in part by rhythmically active neural networks called pattern generators (Arshavsky et al., 1989, 1993;Benjamin and Elliott, 1989; De Schutter, 1989; Brodfuehrer et al., 1995; Harris-Warrick, 1993; Calabrese, et al., 1995; Dean and Cruse, 1995). Rhythmicity in these networks derives from the activity of core oscillator networks that often contain neurons with inherent burst activity (Harris-Warrick, 1993; Rossignol and Dubuc, 1994).
Understanding how these neural oscillators work at the level of inherent membrane properties (voltage-gated conductances) and synaptic interactions within the network requires modeling studies at various levels (Wallén et al., 1992; Wang and Rinzel, 1992; Williams, 1992; Rowat and Selverston, 1993; Skinner et al., 1994a,b; Wolf and Roberts, 1995). These models can lead to conclusions that can be tested directly by physiological experiments.
We have been studying the neural oscillator that paces the pattern generator for heartbeat in the medicinal leech. This “beat timing oscillator” consists of two bilateral pairs of reciprocally inhibitory segmental heart interneurons (HN cells) that are linked together by two pairs of segmental coordinating interneurons (see Fig.1A). Each of these reciprocally inhibitory pairs can act as an independent oscillator, when the segmental ganglion in which it resides is isolated from the rest of the ventral nerve cord (see Fig. 1B).
Fig. 1.
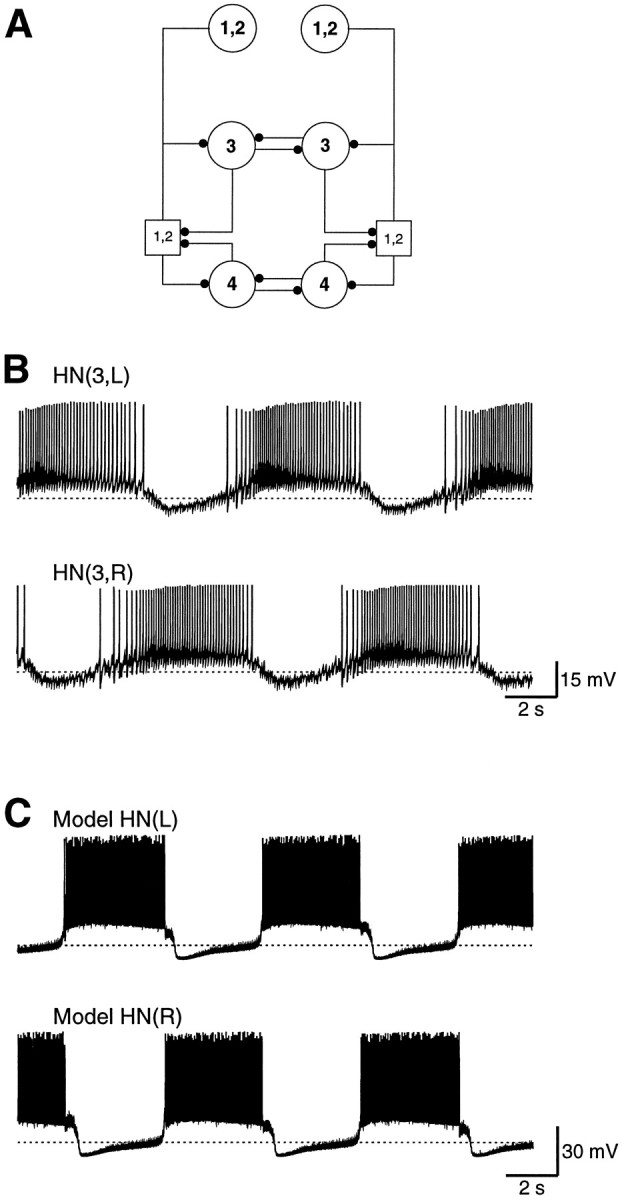
A, The leech heartbeat rhythm originates in a small network of identified heart interneurons (HN cells). The pair of HN cells in each of ganglion 3 and ganglion 4 are individual oscillators. The two oscillators are coupled through posterior processes of the HN cells in ganglia 1 and 2. The HN(1) and HN(2) cells are lumped together. Typically, action potential initiation in the HN(1) and HN(2) cells occurs in a compartment in ganglion 4. B, The oscillation in the HN cells in an isolated ganglion 3. C, The oscillation in a model of the reciprocally inhibitory HN cells. Dashed lines indicate a potential of −50 mV.
Several ionic currents have been identified in single-electrode voltage-clamp studies that contribute to the activity of oscillator heart interneurons. These include the fast Na+ current that mediates spikes, the leak current, two low-threshold Ca2+currents (Angstadt and Calabrese, 1991), three outward currents (Simon et al., 1992), a hyperpolarization-activated inward current (Ih) (Angstadt and Calabrese, 1989; DiFrancesco and Noble, 1989), and a low-threshold persistent Na+current (IP) (Opdyke and Calabrese, 1994). The inhibition between oscillator interneurons consists of a graded component that is associated with the low-threshold Ca2+currents (ICaS and ICaF) (Angstadt and Calabrese, 1991) and a spike-mediated component that appears to be mediated by an as yet uncharacterized high-threshold Ca2+ current (Simon et al., 1994). Spike-mediated transmission is sustained even at the high spike frequency observed during normal bursting (Nicholls and Wallace, 1978a,b), whereas graded transmission wanes during a burst because of the inactivation of low-threshold Ca2+ currents (Angstadt and Calabrese, 1991). Blockade of synaptic transmission with bicuculline leads to tonic activity in oscillator heart interneurons. In reduced Na+and elevated Ca2+ salines, spikes are blocked and oscillations based solely on graded synaptic transmission occur (Arbas and Calabrese, 1987a,b). Dynamic clamp (Sharp et al., 1993a,b) studies in which reciprocal inhibition was artificially restored demonstrated that even nonfatiguing inhibition sustains oscillation (Skinner et al., 1994).
These currents have been incorporated into a model of a pair of HN cells. The model generates activity that closely approximates that observed for an elemental oscillator (see Fig. 1C). Analysis of current flows during this activity (Nadim et al., 1995; Olsen et al., 1995) indicates that graded transmission occurs only at the beginning of the inhibitory period, acting to turn off the opposite neuron; sustained inhibition of the opposite neuron is all spike-mediated. During the inhibited phase of the oscillation, the membrane potential rises slowly because of the slow activation ofIh. During this slow rise, much ofICaF and ICaS is inactivated, thus limiting plateau formation and graded synaptic transmission. IP plays a particularly important role in sustaining spike activity during the burst phase. In this study, we test these conclusions of the model by performing a voltage-clamp analysis of oscillator neurons and oscillator neuron pairs using waveforms based on the slow wave of oscillation recorded in these neurons.
MATERIALS AND METHODS
Leeches, Hirudo medicinalis, were obtained from Leeches U.S.A. and Biopharm and maintained in artificial pond water at 15°C. Animals were anesthetized in ice-cold saline, and ganglia 3 and 4 were dissected out. Single ganglia were pinned ventral-side-up in Petri dishes lined with SYLGARD (bath volume 0.5 ml). The ganglionic sheath over the cell bodies was removed with fine microscissors.
The preparations were continuously superfused with normal leech saline (Nicholls and Baylor, 1968) containing (in mm): 115 NaCl, 4 KCl, 1.8 CaCl2, 10 glucose, 10 HEPES, and adjusted to pH 7.4. After penetration and identification of the HN cells in normal saline, the superfusion was switched to one of three types of salines: to study the Ca2+ and synaptic currents, the Na+ was substituted with 108.2 mmN-methyl-d-glucamine and 2 mmCs+, and the CaCl2 concentration was raised to 5 mm; to study the P-current, the CaCl2 was substituted with 1.8 mm MnCl2, the NaCl concentration was decreased to 113 mm, and 2 mmCsCl was added; and to study the h-current, CaCl2 was substituted with 1.8 mm MnCl2. Cesium selectively blocks the h-current, and manganese blocks the Ca2+ currents.
Sharp electrodes were pulled from borosilicate glass (1 mm outer diameter, 0.75 mm inner diameter) and filled with either 4 m K-acetate and 20 mm KCl (electrode resistance 25–35 MΩ) to measure the h-current or 2 m K-acetate, 10 mm KCl, and 1.8 m tetraethylammonium-acetate (TEA+, which suppresses outward currents) (Simon et al., 1992) to isolate the Ca2+ current and the P-current. Capacitance in the microelectrode was reduced by coating the electrodes with SYLGARD (Laurent, 1991) and by minimizing the bath level.
The HN cells were voltage-clamped with two Axoclamp-2A amplifiers operating in the single-electrode voltage-clamp (SEVC) mode with sample rates above 2.8 kHz. The electrode potential of each system was monitored on an oscilloscope to ensure that the potential settled between current injection cycles. The two electrodes were separated by a grounded metal plate above the bath to remove crosstalk between the electrodes. The output bandwidth was set to 300 Hz, and the feedback gain was from 8 to 90 nA/mV. The output was sent through an external amplifier and recorded on a video cassette recorder modified for FM recording (Vetter, model 240). The experiments were later played back and digitized with Axotape software (Axon Instruments, TL-1 A/D interface, sample rates >2.5 kHz) and analyzed with custom-made software under the UNIX operating system. In some experiments, the data were recorded directly with Axotape. In a few experiments, one Axoclamp amplifier was substituted by an NPI amplifier (Adams and List, model SEC-05L) operating at sample rates around 20 kHz.
The realistic voltage waveforms were sent over a serial port from the computer to a Wavetek waveform generator (model 75) before the experiments. During the experiment, the desired waveform was recalled from the memory of the generator and input to the voltage command input on the amplifier. The waveforms were changed during the experiment either by recalling a different waveform or by changing the period of the waveform.
In any voltage-clamp experiment, the lack of space clamp would introduce errors in the measured currents. In particular, the intraganglionic synaptic contacts between reciprocally inhibitory HN cells occur at the distal tips of the dendrites (Tolbert and Calabrese, 1985). One may worry, therefore, whether the Ca2+ and synaptic currents in the tips of the dendrites are satisfactorily voltage-clamped when voltage-clamping the soma. However, the HN cells seem to be electrically compact. The input resistance of the cells in normal saline is high (∼100 MΩ), the spike-mediated IPSPs rise and decay rapidly (total duration of ∼50 msec) and, finally, the most negative potential reached by the HN cells during oscillation (−55 to −60 mV) is near the synaptic reversal potential (−60 mV). Current studies of a compartmental model of the HN cells will better assess the degree of space clamp in the HN cells.
Loose patch recordings were obtained with electrodes that were pulled to 10–20 μm tip diameter, fire-polished, and filled with normal saline. Weak suction was applied through a mouthpiece as the electrode was attached to the HN cell body. The extracellular signal was amplified in a differential AC amplifier (A-M Systems, model 1700) and stored with the intracellular signals.
We have separated the synaptic inhibition into a graded and a spike-mediated component. The graded component is typically long-lasting (1–2 sec), while the spike-mediated component decays in 10–20 msec. An HN cell has a time constant of 50 msec and will low-pass filter the synaptic inhibition in current clamp. The total synaptic inhibition, as experienced by the HN cell, was estimated by low-pass filtering the current recorded in voltage clamp with a running-average filter of width 50 msec. This signal, comprising both the graded and the spike-mediated components, was compared to a signal obtained by manually picking the baseline for the spike-mediated IPSCs. The baseline signal excluded the rapid spike-mediated IPSCs.
Much of the biophysical data was incorporated into a conductance-based model of an elemental (two-cell) oscillator (Nadim et al., 1995; Olsen et al., 1995) using standard Hodgkin–Huxley (Hodgkin and Huxley, 1952) representations of each voltage-gated current. Graded synaptic transmission was modeled by a transfer function, which related postsynaptic conductance to presynaptic Ca2+ build-up and decline via low-threshold Ca2+ currents and a Ca2+ removal mechanism, respectively (Calabrese and De Schutter, 1992; De Schutter et al., 1993). Spike-mediated transmission was modeled so that each presynaptic spike elicits a postsynaptic conductance described by an α function. The α function was derived by fitting average rise and fall times of spike-mediated IPSCs (postsynaptic voltage clamp) in oscillator interneuron pairs (Simon et al., 1994). Because graded synaptic transfer is dependent on presynaptic Ca2+ currents, which inactivate, the postsynaptic response to a voltage-clamp step in the presynaptic cells waned with time in the model as in the real neurons (Angstadt and Calabrese, 1991).
Free parameters in the model are the maximal conductance (ḡion) for each current (voltage-gated or synaptic) (Nadim et al., 1995). The ḡionvalues were adjusted to be close to the average observed experimentally. The reversal potential, Eion, for each current was determined experimentally and was considered fixed. Final selection of parameters to form a canonical model was dictated by model behavior under control conditions, passive response of the model to hyperpolarizing current pulses, and reaction of the model to current perturbations. We also required that the model cells fire tonically when all inhibition between them was blocked, because the real neurons fire tonically in bicuculline (Schmidt and Calabrese, 1992).
The modeling was performed with the Neurolab software (Olsen, 1994) on UNIX workstations. A variable time-step method (LSODES) was used to integrate the model equations. LSODES was designed to handle stiff and sparse systems of equations accurately and efficiently (Hindmarsh, 1983).
RESULTS
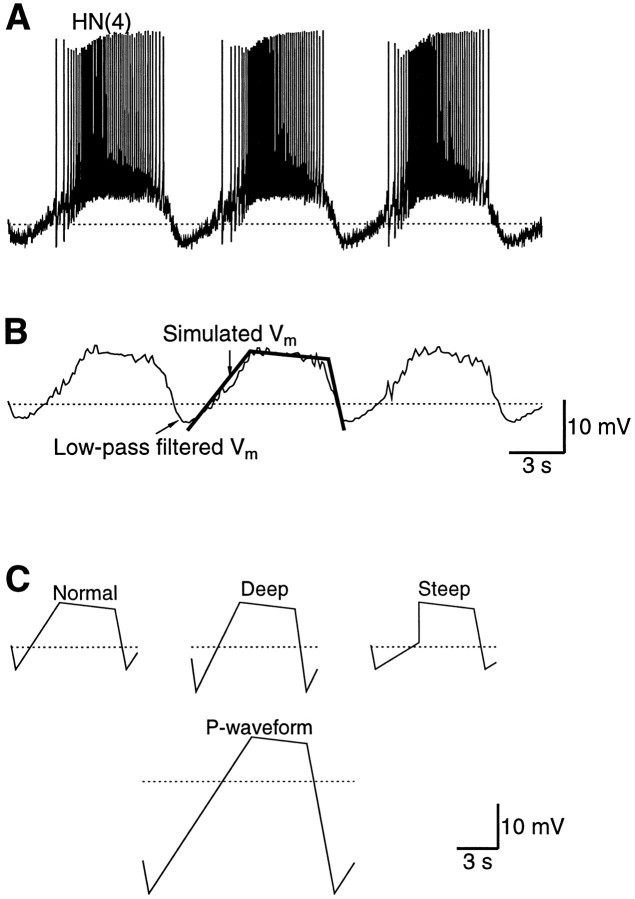
The membrane potential was recorded from an HN(3) cell in an isolated ganglion preparation (Fig.2A). The recorded potential was low-pass-filtered with a moving average filter of width 200 msec. The result was a smooth waveform that represented the slow oscillation in the membrane potential that underlies the bursting activity (Fig.2B). This waveform proved to be satisfactorily approximated by a piece-wise linear waveform comprising three regions: the up-ramp from −55 to −40 mV, the plateau that slowly decayed from −40 to −38.5 mV, and the down-ramp from −38.5 back to −55 mV. Note that the hyperpolarized phase occurred mainly during the early part of the up-ramp. The period of the waveform was set to the period of the oscillation in HN cells under default experimental conditions, i.e., 8 sec (Arbas and Calabrese, 1984). The up-ramp occurred during phase 0–0.4, the plateau during phase 0.4–0.9, and the down-ramp during phase 0.9–1 (Fig. 2B). This waveform will be referred to as the normal waveform. Later, a few variations of the waveform were used as shown in Figure 2C. The HN cells were voltage-clamped with these waveforms under conditions in which the Ca2+ currents, the P-current, or the h-current could be isolated.
Fig. 2.
The HN cells were voltage-clamped using a realistic waveform that approximated the natural HN oscillation.A, The HN membrane potential oscillation. The membrane potential oscillates between −55 mV during the hyperpolarized phase and a base potential of −40 mV during the plateau. During the plateau, the HN cells spike at a frequency of ∼10 Hz. The period of the oscillation ranges from 6 to 12 sec under normal experimental conditions. B, The membrane potential in A was low-pass-filtered with a running average over 200 msec. This signal was then approximated with a piecewise linear waveform, which is referred to in the text as the normal waveform. C, Four variations of the normal waveform were used in the experiments. Shown here are the normal waveform, a variation that goes more hyperpolarized during the hyperpolarized phase (Deep), a variation that has a rapid onset of the plateau (Steep), and the waveform used to obtain the P-current. The P-waveform was obtained by extending the down-ramp and up-ramp down to −75 mV while maintaining the slopes of the Normal waveform. The dotted lines indicate −50 mV.
The Ca2+ and graded synaptic currents were measured in sequences of three to four cycles of each type of waveform. The first waveform of each type was rejected because it contained transients from the previous cycle. The currents were measured as the average of the remaining two to three cycles.
Calcium currents and graded synaptic transmission
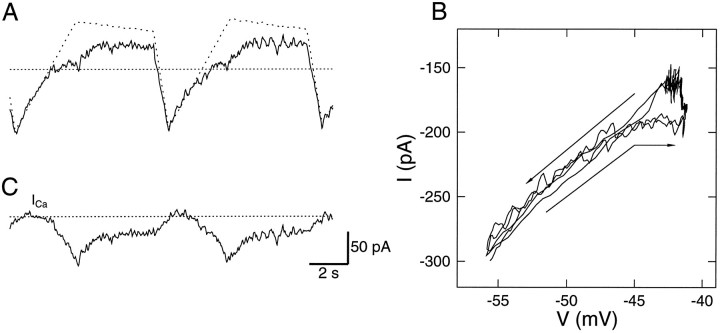
Figure 3A shows the current over two cycles when an HN(4) cell was voltage-clamped with the normal waveform in 0 Na+, 5 mm Ca2+, and 2 mm Cs+ saline. In Figure 3B, the current is plotted versus the membrane potential. From the most hyperpolarized membrane potential, the current initially rose proportionally with the membrane potential. When the potential reached −50 mV, the current became nonlinear with respect to the potential and exposed the activation of inward currents. In the saline used, the only inward currents possible were the Ca2+ currents. While the cell was held on a plateau, the Ca2+ currents inactivated, as can be seen in the vertical region of the I–V plot in Figure 3B. The subsequent hyperpolarization deactivated and removed inactivation from the Ca2+ currents. The linear region below −50 mV was used to calculate the leak conductance and leak reversal potential by linear regression on the I–Vcurve. The correlation coefficients of the fits were typically >0.98.
Fig. 3.
The Ca2+ current was estimated using a novel leak subtraction procedure. An HN(4) cell was voltage-clamped with the normal waveform in 5 mm Ca2+, 0 Na, and 2 mm Cs+. A, The clamp current (solid line) and the calculated leak current (dotted line). The leak current reflects the membrane potential, that is, the normal waveform. The dotted line indicates −0.2 nA.B, the I–V curve of the membrane current inA. The linear region below −50 mV was used to calculate the leak conductance, gl, and the leak reversal potential, El. The leak current in Awas calculated as gl(V − El) (the leak current has no kinetics). Thebottom arrow is adjacent to the current during the rise to the plateau, and the top arrow is above the current during the rapid fall off the plateau. C, The resulting Ca2+ current when subtracting the calculated leak current from the membrane current. The dotted line indicates 0 current.
The values of the leak conductance, gl, were obtained from the slope of the I–V curve, and the leak reversal potential, El, was calculated from the extrapolated I–V curve at I = 0. Based on those two values, the leak current was calculated asIl = gl(V − El) and is shown in Figure 3A. The leak current was subtracted from the total membrane current to obtain the Ca2+ current, which is shown in Figure 3C. The Ca2+ current peaked at 70 pA during the initial plateau phase of the normal waveform and inactivated to 25 pA by the end of the plateau.
Capacitive current will contaminate these measurements according to what waveform was used. Previous ramp experiments in the leech HN cells estimated the leak conductance and reversal potential in normal physiological saline (Nadim et al., 1995). A positive shift in the clamp current of 50 pA was observed at the transition between the down-ramp and the up-ramp. The capacitive current would be negative during the down-ramp and positive during the up-ramp. The absolute value of the capacitive current during the ramps would thus beIC = 25 pA. The slope of those ramps was dV/dt = 50 mV/sec, and fromIC = CdV/dt, the estimated capacitance of the HN cells was 500 pF. This value agrees well with a typical input resistance of 100 MΩ and a typical time constant of 50 msec in the HN cells. In the present experiments, the ramp onto the plateau had a typical slope of 5 mV/sec, thus creating capacitive currents of the order of 2.5 pA. During the down-ramp, the voltage slope was 17 mV/sec, thus generating capacitive currents of 8.5 pA. In all but the h-current experiments, these capacitive currents were negligible.
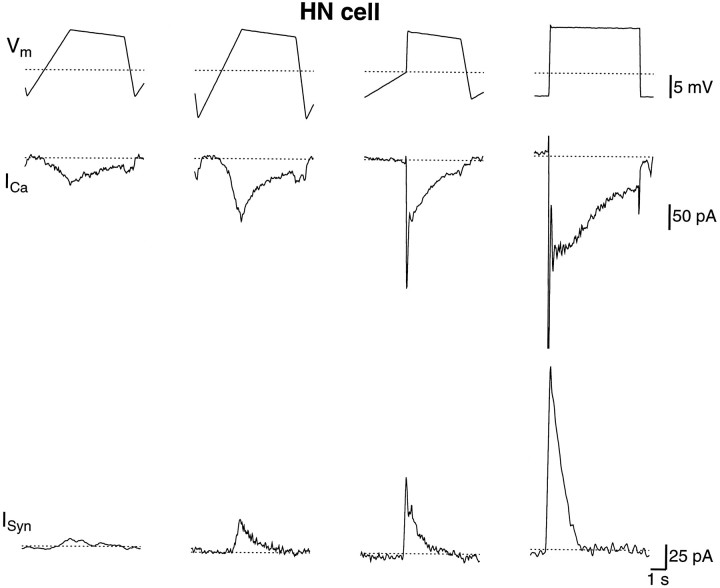
In Figure 4, the Ca2+ currents are shown in an HN(R,4) cell that was voltage-clamped with different waveforms while the postsynaptic HN(L,4) cell was voltage-clamped at −40 mV. The 70 pA of Ca2+ current during the normal waveform produced ∼20 pA of graded inhibition. A waveform that went more negative during the hyperpolarized phase (to −60 instead of −55 mV), while the plateau phase remained the same, removed more Ca2+ inactivation and produced larger Ca2+ currents and graded synaptic inhibition. A waveform that remained hyperpolarized longer and rose abruptly onto the plateau produced less inactivation of the Ca2+ currents during the rising phase and increased the Ca2+ and synaptic currents further. A voltage step from −55 to −40 mV produced a fourfold increase in the slow Ca2+ current compared with the normal waveform and a 20-fold increase in the synaptic current. This experiment confirmed the prediction of a model of oscillatory activity in HN cells that there is substantial inactivation of the Ca2+ currents during the slow rising phase before the plateau and, as a consequence, the graded synaptic inhibition is small.
Fig. 4.
The Ca2+ current and graded synaptic current were subdued during the normal waveform. The HN(4,R) was voltage-clamped with a simulated waveform, and the HN(4,L) was voltage-clamped at −40 mV. Top, The presynaptic voltage waveforms in the right cell; middle, the presynaptic Ca2+ currents in the right cell; bottom, the inhibitory graded synaptic currents in the left cell. The deep and the steep waveforms produced larger Ca2+ and postsynaptic currents than the normal waveform. A step within the same voltage range as the normal waveform led to a severalfold increase in the Ca2+ current and in the graded synaptic current. Thedotted lines indicate −50 mV and 0 current. The saline contained 0 Na+, 5 mm Ca2+, and 2 mm Cs+.
In five experiments, we found the peak Ca2+ current with the normal waveform ranged from 70 to 80 pA and the peak graded synaptic current was between 10 and 25 pA.
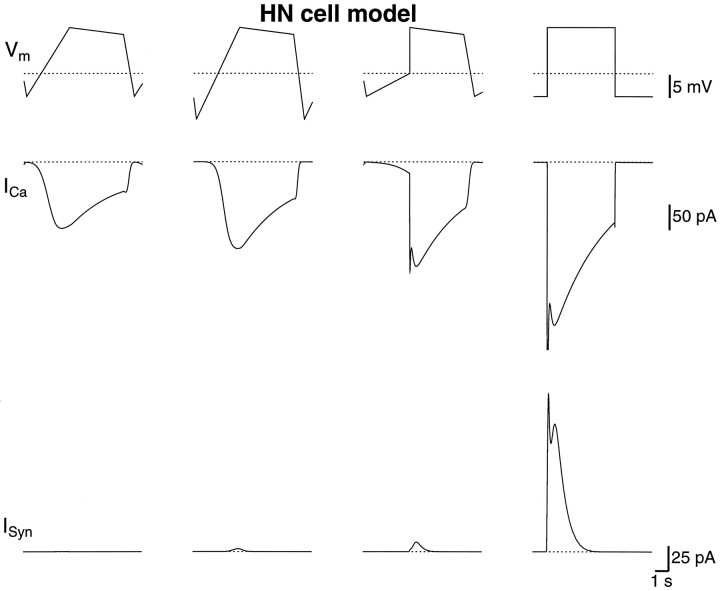
In Figure 5, the same protocol was repeated in the model. Although the Ca2+ currents were larger in the model, presumably because ḡCaF andḡCaS were set high, the relative magnitude for the different waveforms was approximately as in the HN cells. However, the model could not replicate the graded transmission associated with the small Ca2+ currents produced by the normal waveform. When the model of graded synaptic transfer was conceived (De Schutter et al., 1993), no data existed for such small Ca2+ currents. It is no surprise, therefore, that the model did not reproduce the synaptic inhibition for small Ca2+currents. This model must now be improved to account for these results. Preliminary studies indicate that his will be best accomplished within the context of a future multicompartmental model and, therefore, is beyond the scope of this report.
Fig. 5.
The Ca2+ and graded synaptic currents in the model with different applied waveforms. The protocol in the previous figure was repeated in the model. As in the HN cells, the normal waveform gave smaller Ca2+ currents and graded synaptic currents than the other waveforms. The Ca2+currents were slightly larger than in the HN cells, and the shape of the Ca2+ currents matched those measured in the HN cells. For the step waveform, the graded synaptic inhibition was similar to the inhibition measured in the HN cells, whereas the inhibition was smaller than in the HN cells for the other three waveforms. The maximum conductance of the graded synapse was 30 nS. The postsynaptic cell was held at −40 mV. The dotted lines indicate −50 mV and 0 current.
The persistent Na+ current
Previous modeling work recognized the need for an inward current in addition to the Ca2+ currents (Calabrese and De Schutter, 1992). This prediction led to experiments that identified a persistent Na+ current, the P-current, in the HN cells (Opdyke and Calabrese, 1994). The P-current in the HN cells is similar to the proctolin-activated current found in the stomatogastric LP neurons (Golowasch and Marder, 1992). The P-current was isolated using a saline in which the Ca2+ was replaced by Co2+, the h-current was blocked with Cs+ in the bath, and the outward currents were blocked with TEA in the electrodes. Because the P-current’s activation range extends over the entire slow voltage oscillation in the cells but begins to activate at voltages more hyperpolarized than the range of oscillation, it was necessary to extend the normal voltage waveform to more negative potentials to study fully the activation of P-current. The waveform used was similar to the normal waveform but with a hyperpolarized phase that extended to −75 mV (Fig. 2C). The slopes of the up-ramp and down-ramp were as in the normal waveform, thus producing a waveform that had a longer period (13.5 sec).
Figure 6A shows the voltage waveform used to calculate the leak current. The corresponding P-current activated at −65 mV and rose approximately linearly with voltage. Previous experiments ascertained that the activation of the P-current was fast (Opdyke and Calabrese, 1994). In our model, the time constant of activation was set to 10 msec (Nadim et al., 1995). The I–Vplot in Figure 6A shows that at potentials more depolarized than −55 mV there was no hysteresis between the up-ramp and the down-ramp. However, at potentials more hyperpolarized than −55 mV, the current on the down-ramp was clearly more negative than on the subsequent up-ramp. This result suggests that the time constant of activation below −55 mV was longer than that above −55 mV. During the late part of the down-ramp, the P-current took some time to deactivate, and during the early up-ramp, the activation was delayed. The hysteresis seen in Figure 6A is seen even after the effects of capacitive current have been subtracted (top), suggesting that the time constant of activation of IP below −55 mV was longer than the 10 msec assumed in the model.
Fig. 6.
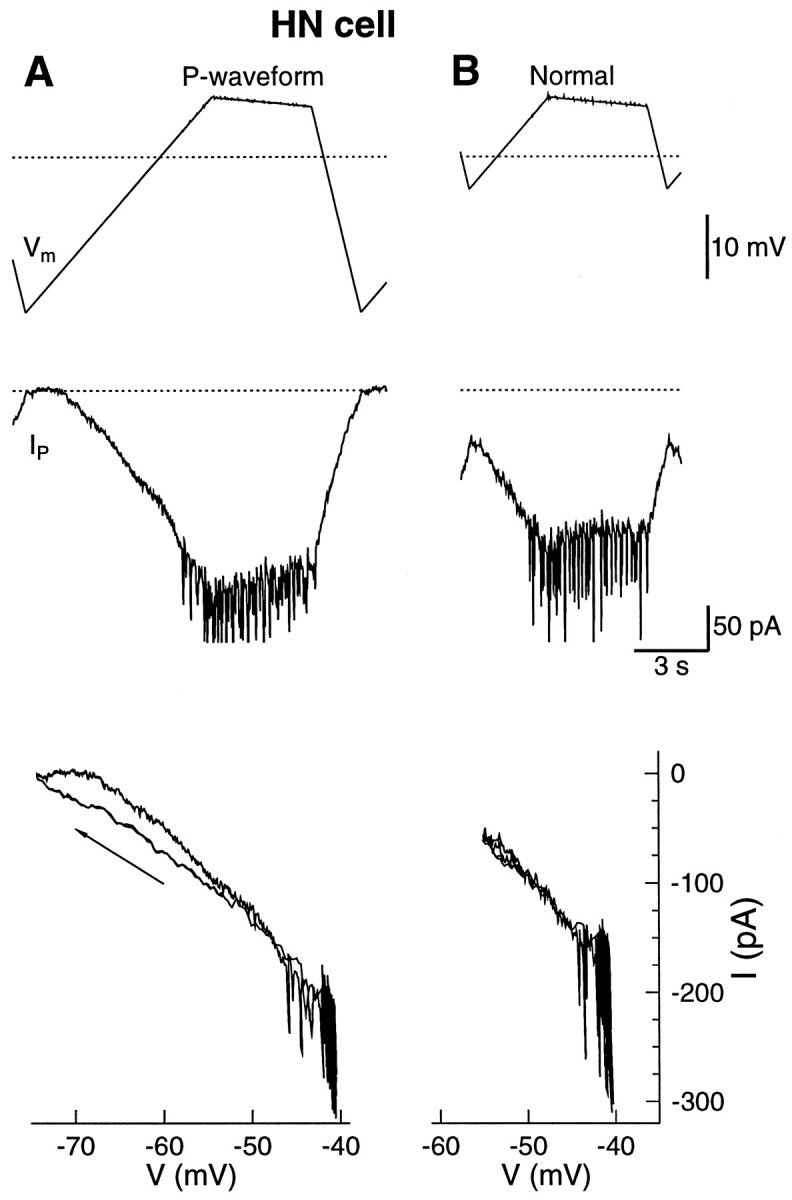
The P-current in an HN(3,R) during the P-waveform and the normal waveform. The Ca2+ in the saline was substituted with an equimolar concentration of Mn2+, and the outward currents were blocked by TEA in the electrodes.A, A waveform that reached more hyperpolarized membrane potential was required to calculate the leak conductance and reversal potential (top). The waveform produced around 220 pA. P-current (middle). The spikes in the record were action potentials that escaped voltage control. The P-current was activated above −65 mV and had negligible inactivation (bottom). Thearrow in the I–V plot indicates the down-ramp.B, The normal waveform was applied between two series of the P-waveform. The average leak conductance and reversal potential from the two series of the P-waveform were used to calculate the leak current. The P-current ranged from a minimum of 60 pA during the hyperpolarized phase to a peak of 180 pA during the plateau. The voltage range of the I–V plot in B is smaller. The dotted lines indicate −50 mV and 0 current.
The P-current reached a peak of 220 pA with the extended waveform. The HN cell produced spikes at potentials above −50 mV. This threshold for spiking was also seen during normal oscillation (Fig. 2). The spike-generating Na+ current was regenerative because of a lack of voltage clamp at the spike initiation zone of the HN cell. The amplifier was apparently unable to clamp the fast Na+current that produced spikes. However, the potential at the soma was relatively unaffected by these spikes (Fig. 6).
To measure the P-current with the normal waveform, the HN cell was voltage-clamped with the extended waveform for 10 cycles, the normal waveform for 9 cycles, and then 7 cycles of the extended waveform. The average leak conductance and leak reversal potential of the two series of extended waveforms was used to calculate the leak current for the normal waveform in the middle. As expected from the extended waveform, the P-current was not deactivated at −55 mV (Fig. 6B). During the normal waveform, the P-current reached a minimum of 60 pA at −55 mV and peaked at 180 pA at the onset of the plateau. No hysteresis between the down-ramp and the up-ramp appeared in the I–Vplot for the normal waveform.
The P-current in the model was activated by the waveforms as shown in Figure 7. From both the trace of the P-current and theI–V plot of the P-current, it was clear that the model P-current activated around −55 mV. Compared to the HN cells, the activation was 10 mV more positive and slightly steeper. As a result of the higher activation threshold, the P-current was more deactivated during the hyperpolarized phase. The minimum P-current was 15 pA, and the maximum was 130 pA. The peak P-current in the model was thus smaller than what was measured in the HN cells.
Fig. 7.
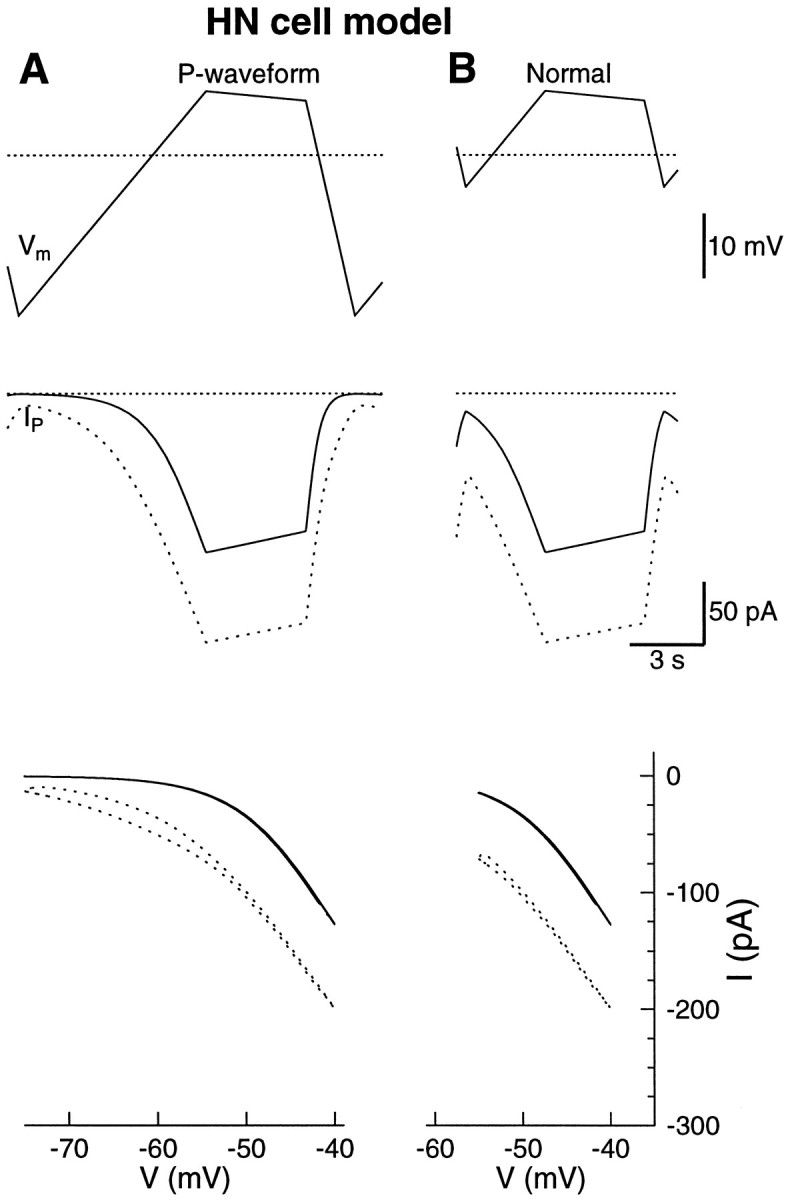
The P-current in the model had a steeper activation curve than the measured P-current. The new model P-current that matches the experimental data in Figure 6 is shown in dotted lines. A, The waveform used to calculate the leak current by the same procedure as in the experiments (top). The threshold for activation of the P-current in the model was higher and steeper (middle, bottom). B, The normal waveform produced 130 pA of P-current. The minimum value of the P-current was 15 pA, which was less than what was found in the HN cells. The dotted lines indicate −50 mV and 0 current.
The new model P-current
The measured IP activated at a more negative potential than the IP in the model. The activation curve in the new model was modified to activate around −65 mV, and the (de)activation time constant was increased from 10 to 210 msec around −65 mV to account for the hysteresis between the down-ramp and the up-ramp (Fig. 6A).
The new equations for the P-current are:
and
with
The current is given by:
where ḡP = 5 nS andENa = 45 mV.
The new model replicated the measured P-current in the HN cells (Fig.7).
The h-current
The h-current is a mixed Na+ and K+current with a reversal potential around −20 mV (Angstadt and Calabrese, 1989). It differs from other inward currents in that it is activated by hyperpolarization. Its time course of activation is ∼1–2 sec, and its role during oscillation is to promote escape from synaptic inhibition (Calabrese and De Schutter, 1992; Wang and Rinzel, 1992).
We do not know of any way to isolate the h-current in the HN cells. To observe the h-current, the P-current and the outward currents must remain unblocked. The outward currents activate above −40 mV (Simon et al., 1992) and thus do not interfere with h-current measurements. As seen in Figure 6B, however, the P-current was active throughout the entire normal waveform. Consequently, to measure the h-current when voltage-clamping an HN cell with the normal waveform, it was necessary to subtract both the leak current and the P-current.
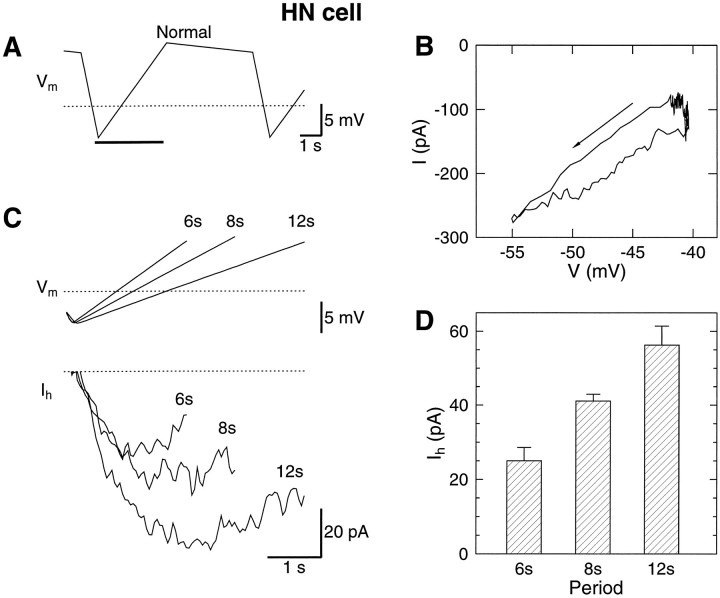
It proved possible to measure the h-current during the up-ramp of the waveform (Fig. 8A). In Figure8B, the I–V plot of the clamp current shows an inward current of ∼50 pA during the up-ramp. The P-current at a given voltage had the same value during the down-ramp and the up-ramp (Fig.6B). The same was true for the leak current. Thus, the h-current at any point during the up-ramp can be obtained as the clamp current at that point minus the clamp current at the same potential during the down-ramp.
Fig. 8.
The h-current can be estimated during the up-ramp of the waveform (A). B, The clamp current is more negative on the up-ramp than on the down-ramp because of the activation of the h-current. The arrow indicates the down-ramp.C, The clamp current at the same potential on the down-ramp was subtracted from the clamp current on the up-ramp. This procedure provided subtraction of both the leak and the P-current. See text for more details. As the period increased from 6 to 12 sec, the h-current doubled in magnitude from 35 to 70 pA. D, The peak h-current versus period of the normal waveform for four HN cells. Thedotted lines indicate −50 mV and 0 current.
In Figure 8C, the h-current is shown for the normal waveform at periods of 6, 8, and 12 sec. The peak h-current at a period of 8 sec was 41 ± 2 pA (n = 11). The normal waveform was stretched to 12 sec, producing 56 ± 5 pA (n = 4) of h-current and compressed to 6 sec, producing 25 ± 4 pA (n = 4) of h-current. For the four experiments in which all three periods were tested, the 6 sec waveform reduced the h-current by 42 ± 5% and the 12 sec waveform increased the h-current by 32 ± 3% with respect to the h-current of the 8 sec waveform. Small corrections to the measured values of the h-current will be mentioned below.
When the normal waveform was shifted by −5 mV in the hyperpolarizing direction, the h-current increased by 41 ± 22% (n = 3). The deep waveform that reached −60 mV during the hyperpolarized phase increased the h-current by 44 ± 6% (n = 4).
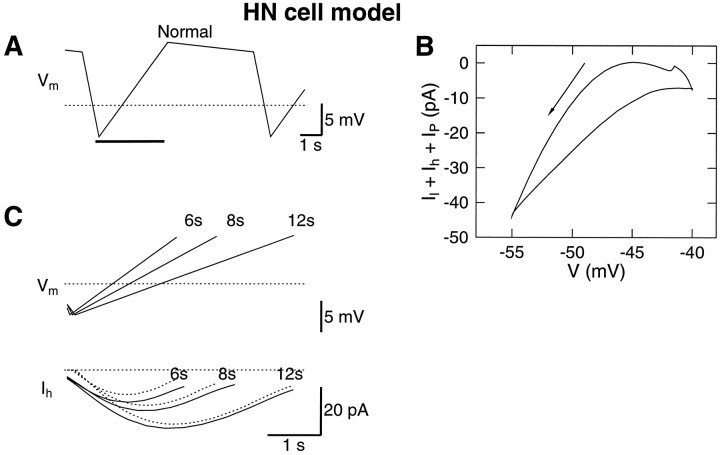
The shape of the model h-current, measured by the same technique used to measure Ih in the HN cells, was similar to that measured in the HN cells (Fig. 9). Changing the period of the waveform produced similar relative changes in the amount of h-current as observed in the HN cells. However, the model current was half of that measured in the cells, suggesting thatḡh was set low.
Fig. 9.
The h-current in the model. A, The h-current was measured during the up-ramp. B, TheI–V curve of the clamp current. The clamp current consisted of the leak current, the P-current, and the h-current. Thearrow indicates the down-ramp. C, The exact h-current in the model is plotted with solid lines. The h-current obtained by the procedure used in the experiments is shown with dotted lines. The overall shape of the h-current in the model was close to that in the cells, whereas the magnitude was half of that in the HN cells. The dotted lines indicate −50 mV and 0 current.
Errors in the measurements were estimated using the model
The h-current at a given point on the up-ramp of the realistic waveform was found by subtracting the membrane current at the same potential on the down-ramp. The procedure assumed that the sum of the leak current, Il, and the P-current,IP, at any potential on the down-ramp was the same as Il + IP at the same potential on the up-ramp. The leak current was linear with respect to the membrane potential, and the P-current had no hysteresis for the normal waveform (Fig. 6B), so this assumption was valid.
The actual h-current was underestimated for two reasons. At the onset of the up-ramp, there was already 5 pA of Ih in the model, whereas the method for measuring Ihgave no current (Fig. 8). This error was due to some activation of the h-current during the rapid down-ramp. As suggested by the model, the difference between the estimated and the actual h-current was greater near the most hyperpolarized potential (Fig. 9C). Later during the up-ramp, the difference decreased. The activation ofIh during the late phase of the down-ramp thus contributed to underestimating Ih during the early up-ramp. In addition, the capacitive current affected the measurement of the h-current because Ih was relatively small. The difference in the capacitive current of 11 pA between the down-ramp and the up-ramp will have to be added to the measured h-current. This correction will be slightly larger for the 6 sec waveform and slightly smaller for the 12 sec waveform. The peak h-current in the model occurred at a point where there appeared to be no contribution from the current activated during the down-ramp; thus, the peak h-current in the HN cells for the 8 sec waveform was estimated to be 50 pA. In the model, Ih had nearly deactivated at the end of the plateau. The down-ramp started with ∼4 pA of h-current active and, therefore, it was unlikely to produce an appreciable error in the measurements of Ih in the HN cells.
In the model, the new P-current activated at such hyperpolarized potentials that it possibly interfered with the leak subtraction procedure. When the procedure was applied on the model with the new P-current, the portion of the up-ramp that was used to calculate the leak current in the experiments was contaminated with some P-current. The consequent errors in the calculated leak parameters caused a 10–15% underestimate in the resulting IPmeasurement. This should be considered an upper bound on the error in the measurements in the HN cells.
Graded and spike-mediated synaptic inhibition during oscillation with spikes
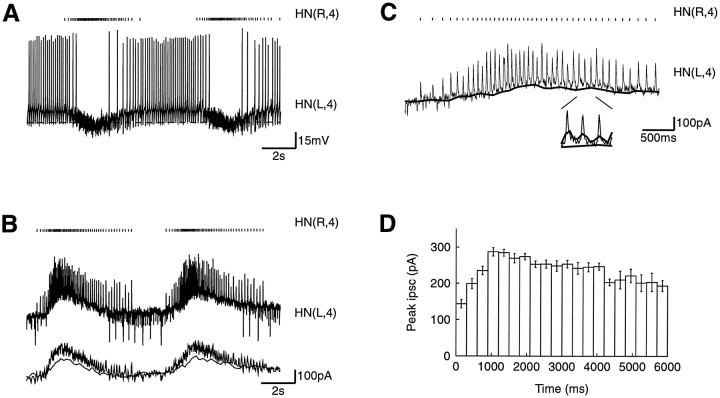
In a preparation that consists of ganglia 3 and 4, phase-locked oscillations between the pair of HN cells in each of ganglia 3 and 4 occurs (Peterson, 1983a,b). The two elemental oscillators are coordinated via the processes of the HN(1) and HN(2) cells (Fig.1A), so that the HN(4) oscillator leads the HN(3) oscillator by ∼20°. The membrane potential oscillation in an HN(L,4) cell in such a preparation was indistinguishable from the oscillation in an isolated ganglion (Fig.10A).
Fig. 10.
Synaptic inhibition in normal saline. The HN(L,4) cell was voltage-clamped while the contralateral HN(R,4) cell was driven by the HN(3) cells via the HN(1,2) cells. A, Normal activity in the HN(4) cells. The action potentials of the HN(R,4) cell were monitored with a loose patch electrode on the cell soma, and each spike in the HN(R,4) cell is marked above the intracellular record of the HN(L,4) membrane potential. B, The inhibitory synaptic current from the HN(R,4) cell to the HN(L,4) cell shown while voltage-clamping the HN(L,4) cell at −55 mV. The spike-mediated IPSCs occurred on top of graded inhibitory synaptic current. Below the recorded current trace, two traces show the slow oscillation in the current. The trace with the largest amplitude is a low-pass-filtered version of the HN(L,4) current (moving average over 50 msec), and the trace with the smallest amplitude is the current immediately before spike-mediated inhibitory currents (baseline current, seeC). A few spikes escaped voltage control during the noninhibited phase simultaneously with electrical EPSPs from the HN(X) cell (Calabrese, 1977). C, Expanding the first cycle inB. Each spike in the HN(R,4) cell gives rise to a spike-mediated IPSC in the HN(L,4) cell. The difference between the recorded current and the baseline of the spike-mediated IPSCs (thick trace) shows the contribution of the fast spike-mediated IPSCs to the total synaptic inhibition (also inB). A few extra IPSCs from the HN(L,1) and HN(L,2) cells can be seen between the IPSCs from the HN(R,4) cell. The insetshows three IPSCs on a 5× expanded time scale as well as the low-pass-filtered current (upper thick line) and the baseline current (lower thick line). D, The amplitude of the spike-mediated IPSCs in the postsynaptic HN(L,4) cell was modulated. The time indicated was from the first spike in the bursts. The histogram comprises IPSCs from nine successive bursts, has a binwidth of 300 msec, and each bin up to 3.5 sec contained >20 spikes.
The HN(L,4) cell was voltage-clamped at −55 mV, just below the spike threshold for the HN cells, and the contralateral HN(4,R) cell continued to burst (Fig. 10B). The simultaneous recording from the HN(R,4) cell with a loose patch electrode showed a similar spike pattern to that of the intracellular electrode, thus suggesting that the oscillation in the HN(4,R) cell with the HN(4,L) cell voltage-clamped was similar to the normal oscillation (Fig.1B). Individual HN cells are not endogenous bursters, so the HN(4,R) cell was driven by the oscillation in the HN(3) cells via the HN(1) and HN(2) cells (Peterson, 1983a,b).
The inhibitory current from the presynaptic HN(R,4) cell consisted of two components: spike-mediated IPSCs with a duration of 20–25 msec and an amplitude of 150–300 pA riding on a slowly rising and then falling envelope of synaptic current that lasted ∼3 sec per cycle (Fig.10B,C). The total effective synaptic current in this complex waveform was estimated by low-pass filtering with a moving average filter of width 50 msec which, being at the time constant of the HN cells, should integrate the synaptic current as the cell would when in current clamp. The graded synaptic current was estimated by manually detecting the baseline from which the spike-mediated IPSC rose. Both of these signals are shown in Figure 10, B and C. The amplitude of the low-pass-filtered signal (270 pA) was approximately twice the amplitude of the baseline signal (150 pA), shown expanded in Figure 10C. The increased graded synaptic inhibition measured by this method compared to that of the realistic waveforms could result from the spike-mediated IPSCs having two components: one rapidly decaying and one slowly decaying. The low-pass-filtered signal included both of these components, and the baseline signal excluded only the rapidly decaying component. The difference between the low-pass-filtered signal and the baseline signal thus indicated that the rapidly decaying component contributed 120 pA to the total inhibitory current, and the graded and the slowly decaying spike-mediated inhibition was given by the baseline signal of 150 pA. Alternatively, the difference could result from space-clamp problems or, given the sensitivity of graded transmission to the voltage excursions demonstrated in our experiments, some small difference in the membrane excursion of HN cells recorded extracellularly (as in these experiments) and those recorded with microelectrodes, which were used to generate our realistic waveform.
The first spikes in the bursts of the presynaptic HN(R,4) cell produced IPSCs in the HN(L,4) cell with amplitude of 150 pA. Within 1 sec, the amplitude of the IPSCs increased to 300 pA (Fig. 10C,D). The amplitude of the IPSCs then slowly decreased to 200 pA for the last spikes in the bursts.
DISCUSSION
The computer model of the oscillation in the HN cells predicted small Ca2+ currents and little graded synaptic inhibition (Nadim et al., 1995; Olsen et al., 1995). We voltage-clamped HN cells with realistic waveforms to verify this prediction and to validate the other voltage-gated inward currents in the model.
Low-threshold Ca2+ currents
The realistic waveform inactivated the low-threshold Ca2+ currents before the peak Ca2+ current occurred. As the waveform was extended in the hyperpolarized phase to a more negative potential, the Ca2+ current was increased as more inactivation was removed at the more negative potential. With a waveform that stayed hyperpolarized and rose rapidly onto a plateau, the peak Ca2+ current was increased from that of the normal waveform because of less inactivation during the rapid rise to the plateau. Consequently, at the onset of the plateau, more Ca2+ conductance was available. A step from the most hyperpolarized potential of the normal waveform to the most depolarized potential produced a severalfold increase in the Ca2+current, hence showing the ability of the shape of the waveform, not only its potential range, to modulate the amount of current expressed.
h- and P-current
In this study, it was found that the P-current was not turned off during the normal waveform. The P-current deactivated only to ∼50% at the most hyperpolarized membrane potential. One part ofIP remained on throughout the oscillation, and one part was turned on and off. The part that remained on can be considered to contribute to the leak current, altering the effective leak conductance and reversal potential. Although the leak current appears not to be very interesting, the period of the model was sensitive to the parameters of the leak current (Olsen et al., 1995). Thus, modulation of IP could affect the oscillation by changing either the leak-like part that remains on throughout the oscillation or the part that is activated by the oscillation. Modulation of a current by shifting the activation curve will have, in general, an effect on both parts.
Increasing the leak conductance, ḡl, in the model speeds up the oscillation, whereas increasing the conductance of the P-current slows the oscillation down (Olsen et al., 1995). Increasing the leak-like bias part of IP will effectively contribute to an increase in the leak conductance and elevation of the leak reversal potential towards the Na+reversal potential—both of these changes in the leak current speed the oscillation up (Olsen et al., 1995). Therefore, the period increase observed when increasing ḡP must be due to the increase in the oscillation-gated part of the P-current. Previous studies demonstrated that the P-current was important for controlling spike frequency during the bursts (Olsen et al., 1995).
For the P-current, ∼50% of the total current was activated at the most hyperpolarized phase, and 50% was gated by the normal waveform. In contrast, the Ca2+ current and the h-current were completely turned off at the hyperpolarized phase and the end of the plateau, respectively.
The HN cells were observed to have twice as much h-current as the HN model cells. This result suggests that the escape mechanism is even stronger in the HN cells than in the model.
In the model, the h-current had a strong influence on the period. Increasing the maximal conductance, ḡh, enabled the slowly activating h-current to overcome the synaptic inhibition sooner and produce a depolarization that triggered the plateau potential, thus decreasing the period of the oscillation (Olsen et al., 1995). The results from voltage-clamping an HN cell with realistic waveforms appeared to give the opposite results: increasing the period of the waveform increased the h-current present (Fig.8D). With longer period of the waveform, the HN cell was held longer at hyperpolarized potentials, thus activating more h-current. This experiment shows that the h-current is not only a candidate for changing the period of the oscillation—it also provides negative feedback to any process that causes the oscillation to slow down. The h-current, therefore, is important for maintaining stable oscillations of fixed period.
Comparing the P-current and the Ca2+ current during the normal waveform, it appeared that the P-current was generally larger throughout the waveform. However, only approximately half the P-current was gated by the waveform—the other half was not affected by the waveform and could be considered to contribute to the leak current (60–80 pA). As a result, the P-current and the Ca2+current contributed about the same amount of inward current during the plateau phase (70–100 pA) with the respective inward currents during the hyperpolarized phase as a baseline.
Synaptic inhibition
The model predicted that the Ca2+ currents during normal rhythmic activity in the HN cells only produced relatively little graded synaptic inhibition in the contralateral HN cell. The experiments in which one HN cell was voltage-clamped with a realistic waveform, and the opposite HN cell was voltage-clamped at a depolarized potential, revealed little graded synaptic inhibition. Over several experiments, the graded synaptic current was in the 30–40 pA range when the postsynaptic cell was held at −40 mV (Fig. 4). In the same preparations, a step from the most hyperpolarized to the most depolarized membrane potential of the normal waveform produced a 4-fold increase in the Ca2+ currents and a 20-fold increase in the graded synaptic inhibition. In steps to higher potentials, the graded synaptic inhibition reached 300 pA (Angstadt and Calabrese, 1991). It thus appears that only a relatively small fraction of the maximum obtainable graded synaptic inhibition was generated when voltage-clamping the presynaptic HN cell with a realistic waveform of the oscillation.
In the model, the normal waveform produced Ca2+ current approximately as measured in the HN cells. The dynamics of the model Ca2+ current matched the results from the HN cells, although the amplitude was slightly larger in the model.
For the normal waveform, the graded synaptic inhibition was smaller in the model than in the HN cells. In the model, the inhibition for the other waveforms—that produced larger Ca2+ currents and stronger graded inhibition—was similar to what was measured in the HN cells. Because the Ca2+ current in the model was close to the measured Ca2+ current in the HN cells, the difference in the graded synaptic inhibition between the HN cells and the model must arise from the model of the graded synaptic inhibition. The model integrates the Ca2+ influx caused by the Ca2+current and relates the synaptic inhibition to the presynaptic Ca2+ concentration.
The model was based on larger Ca2+ currents that were measured with voltage steps (De Schutter et al., 1993). The model reproduced those experiments only when integrating the Ca2+current above a certain threshold. Our present experiments indicate that the model must have this threshold adjusted so that Ca2+ currents around 60–70 pA produce small graded synaptic inhibition of ∼20 pA. The threshold could be lowered and the other parameters tuned to fit the step data and the present data from realistic waveforms. However, our preliminary studies with compartmental models of HN neurons suggest that the artificial threshold can be eliminated entirely by integrating the Ca2+ current in only the presynaptic compartment(s). We are pursuing this later, more laborious, but ultimately more satisfying, alternative.
When the oscillation in an HN(4) cell was driven by the HN(3) pair, via the HN(1) and HN(2) cells, the graded inhibition in the opposite HN(4) cell was greater than with the normal waveform (Fig. 10). The main difference between the two experiments was that the latter measurement was made in the presence of action potentials in the presynaptic cell.
There is preliminary evidence of a high-threshold Ca2+current that is involved in spike-mediated synaptic inhibition (Simon et al., 1994), and experiments are currently under way in our lab to characterize the Ca2+ current and the spike-mediated synaptic transmission further. Spikes trigger Ca2+ influx, possibly through both low (especially the slowly inactivating component)- and high-threshold Ca2+ currents. The presynaptic Ca2+ concentration, therefore, may have two time constants corresponding to two currents. Consequently, a rapid and a slow decay of the spike-mediated IPSCs may be produced in which the slow component contributes to the overall graded-like synaptic inhibition.
The IPSCs from the initial spikes of the burst in the presynaptic cell had half the amplitude of the IPSCs that occurred 1 sec later (Fig.10D). The amplitude of the IPSCs versus time was similar to the plateau phase of the realistic waveform; it rose to a peak and then slowly decreased in amplitude. The amplitude of the IPSPs from the HN cells to the heart motor neurons (HE cells) and HN cells is modulated by the membrane potential of the presynaptic HN cell from which the spikes were triggered (Nicholls and Wallace, 1978a,b; Thompson and Stent, 1976). As the presynaptic HN cell was depolarized, the IPSPs in the HE cells facilitated. Here, the facilitation of the spike-mediated synaptic inhibition was measured during normal rhythmic activity in the HN cells.
Nicholls and Wallace used high-Mg2+ saline to prevent tonic firing, and the high-Mg2+ saline would not block high- or low-threshold Ca2+ currents. Residual Ca2+ from low-threshold Ca2+ currents (even the small ones recorded with realistic waveforms) could contribute to the observed facilitation of spike-mediated transmission in HE and HN cells.
In summary, it appears that the inhibition between the HN cells has three components. The low-threshold Ca2+ currents produce graded inhibition, and the high-threshold Ca2+ currents produce the obvious short-duration spike-mediated inhibition and contribute to the graded inhibition.
Conclusions
Conventional voltage-clamp protocols use voltage steps to measure the activation and inactivation dynamics of isolated currents. In general, computer models are required to interpret the interaction between the currents in, e.g., producing oscillation. In this study, we have presented an alternative and complementary approach for measuring the currents during the oscillation. Voltage-clamping the HN cells with realistic waveforms, we were able to directly measure how some currents contributed to the inhibition and depolarization in the HN cells. These experiments verified predictions of the model, suggested improvements to the model, and produced further insights into the mechanisms of oscillation in the HN cells.
Footnotes
The experimental work was funded by National Institutes of Health (NIH) Grant NS-24072 to R.L.C., and the modeling was supported by NIH Grant NS-34975 to R.L.C. The experimental work was also supported by a Grass Fellowship from the Grass Foundation to Ø.H.O. The Neurolab modeling software and the HN model equations can be obtained on the Internet athttp://calabreselx.biology.emory.edu
Correspondence and reprint requests should be addressed to Ronald L. Calabrese, Department of Biology, Emory University, 1510 Clifton Road, Atlanta, GA 30322.
REFERENCES
- 1.Angstadt JD, Calabrese RL. A hyperpolarization-activated inward current in heart interneurons of the medicinal leech. J Neurosci. 1989;9:2846–2857. doi: 10.1523/JNEUROSCI.09-08-02846.1989. [DOI] [PMC free article] [PubMed] [Google Scholar]
- 2.Angstadt JD, Calabrese RL. Calcium currents and graded synaptic transmission between heart interneurons of the leech. J Neurosci. 1991;11:746–759. doi: 10.1523/JNEUROSCI.11-03-00746.1991. [DOI] [PMC free article] [PubMed] [Google Scholar]
- 3.Arbas EA, Calabrese RL. Rate modification in the heartbeat central pattern generator of the medicinal leech. J Comp Physiol [A] 1984;155:783–794. [Google Scholar]
- 4.Arbas EA, Calabrese RL. Ionic conductances underlying the activity of interneurons that control heartbeat in the medicinal leech. J Neurosci. 1987a;7:3945–3952. doi: 10.1523/JNEUROSCI.07-12-03945.1987. [DOI] [PMC free article] [PubMed] [Google Scholar]
- 5.Arbas EA, Calabrese RL. Slow oscillations of membrane potential in interneurons that control heartbeat in the medicinal leech. J Neurosci. 1987b;7:3953–3960. doi: 10.1523/JNEUROSCI.07-12-03953.1987. [DOI] [PMC free article] [PubMed] [Google Scholar]
- 6.Arshavsky YI, Orlovsky GN, Panchin Y, Pavlova GA. Control of locomotion in marine mollusc Clione limacina. VII. Reexamination of type 12 interneurons. Exp Brain Res. 1989;78:398–406. doi: 10.1007/BF00228912. [DOI] [PubMed] [Google Scholar]
- 7.Arshavsky YI, Orlovsky GN, Panchin Y, Roberts A, Soffe SR. Neuronal control of swimming locomotion: analysis of the pteropod mollusc Clione and embryos of the amphibian Xenopus. Trends Neurosci. 1993;16:227–233. doi: 10.1016/0166-2236(93)90161-e. [DOI] [PubMed] [Google Scholar]
- 8.Benjamin PR, Elliott JH. Snail feeding oscillator: the central pattern generator and its control by modulatory interneurons. In: Jacklet J, editor. Neuronal and cellular oscillators. Marcel Dekker; New York: 1989. pp. 173–214. [Google Scholar]
- 9.Brodfuehrer PD, Debski EA, O’Gara BA, Friesen WO. Neuronal control of leech swimming. J Neurobiol. 1995;27:403–418. doi: 10.1002/neu.480270312. [DOI] [PubMed] [Google Scholar]
- 10.Calabrese RL. The neural control of alternate heartbeat coordination states in the leech, Hirudo medicinalis. J Comp Physiol [A] 1977;122:111–143. [Google Scholar]
- 11.Calabrese RL, De Schutter E. Motor-pattern-generating networks in invertebrates: modeling our way toward understanding. Trends Neurosci. 1992;15:439–445. doi: 10.1016/0166-2236(92)90007-u. [DOI] [PubMed] [Google Scholar]
- 12.Calabrese RL, Nadim F, Olsen ØH. Heartbeat control of the medicinal leech: a model for understanding the origin, coordination, and modulation of rhythmic motor patterns. J Neurobiol. 1995;27:390–402. doi: 10.1002/neu.480270311. [DOI] [PubMed] [Google Scholar]
- 13.De Schutter E. Computer software for development and simulation of compartmental models of neurons. Comput Biol Med. 1989;19:71–81. doi: 10.1016/0010-4825(89)90001-2. [DOI] [PubMed] [Google Scholar]
- 14.De Schutter E, Angstadt JD, Calabrese RL. A model of graded synaptic transmission for use in dynamic network simulations. J Neurophysiol. 1993;69:1225–1235. doi: 10.1152/jn.1993.69.4.1225. [DOI] [PubMed] [Google Scholar]
- 15.Dean J, Cruse H. Motor pattern generation. In: Arbib MA, editor. The handbook of brain theory and neural networks. MIT; Cambridge: 1995. pp. 600–605. [Google Scholar]
- 16.DiFrancesco D, Noble D. Current If and its contribution to cardiac pacemaking. In: Jacklet JW, editor. Cellular and neuronal oscillators. Marcel Dekker; New York: 1989. pp. 31–58. [Google Scholar]
- 17.Golowasch J, Marder E. Ionic currents of the lateral pyloric neuron of the stomatogastric ganglion of the crab. J Neurophysiol. 1992;67:318–331. doi: 10.1152/jn.1992.67.2.318. [DOI] [PubMed] [Google Scholar]
- 18.Harris-Warrick RM. Pattern generation. Curr Opin Neurobiol. 1993;3:982–988. doi: 10.1016/0959-4388(93)90171-t. [DOI] [PubMed] [Google Scholar]
- 19.Hindmarsh AC. Odepack, a systematized collection of ode solvers. In: Stepleman RS, editor. Scientific computing. North Holland; Amsterdam: 1983. pp. 55–64. [Google Scholar]
- 20.Hodgkin AL, Huxley AF. A quantitative description of membrane current and its application to conduction and excitation in nerve. J Physiol (Lond) 1952;117:500–544. doi: 10.1113/jphysiol.1952.sp004764. [DOI] [PMC free article] [PubMed] [Google Scholar]
- 21.Laurent G. Evidence for voltage-activated outward currents in the neuropilar membrane of locust nonspiking local interneurons. J Neurosci. 1991;11:1713–1726. doi: 10.1523/JNEUROSCI.11-06-01713.1991. [DOI] [PMC free article] [PubMed] [Google Scholar]
- 22.Nadim F, Olsen ØH, De Schutter E, Calabrese RL. Modeling the leech heartbeat elemental oscillator. I. Interactions of intrinsic and synaptic currents. J Comp Neurosci. 1995;2:215–235. doi: 10.1007/BF00961435. [DOI] [PubMed] [Google Scholar]
- 23.Nicholls JG, Baylor DA. Specific modalities and receptive fields of sensory neurons in the CNS of the leech. J Physiol (Lond) 1968;31:740–756. doi: 10.1152/jn.1968.31.5.740. [DOI] [PubMed] [Google Scholar]
- 24.Nicholls JG, Wallace BG. Quantal analysis of transmitter release at an inhibitory synapse in the central nervous system of the leech. J Physiol (Lond) 1978a;281:171–185. doi: 10.1113/jphysiol.1978.sp012415. [DOI] [PMC free article] [PubMed] [Google Scholar]
- 25.Nicholls JG, Wallace BG. Modulation of transmission at an inhibitory synapse in the central nervous system of the leech. J Physiol (Lond) 1978b;281:157–170. doi: 10.1113/jphysiol.1978.sp012414. [DOI] [PMC free article] [PubMed] [Google Scholar]
- 26.Olsen ØH (1994) Exploring temporal computation in neuronal systems. PhD thesis, University of Glasgow.
- 27.Olsen ØH, Nadim F, Calabrese RL. Modeling the leech heartbeat elemental oscillator. II. Exploring the parameter space. J Comp Neurosci. 1995;2:237–257. doi: 10.1007/BF00961436. [DOI] [PubMed] [Google Scholar]
- 28.Opdyke CA, Calabrese RL. A persistent sodium current contributes to oscillatory activity in heart interneurons of the medicinal leech. J Comp Physiol [A] 1994;175:781–789. doi: 10.1007/BF00191850. [DOI] [PubMed] [Google Scholar]
- 29.Peterson EL. Generation and coordination of heartbeat timing oscillation in the medicinal leech. II. Intersegmental coordination. J Neurophysiol. 1983a;49:626–638. doi: 10.1152/jn.1983.49.3.627. [DOI] [PubMed] [Google Scholar]
- 30.Peterson EL. Generation and coordination of heartbeat timing oscillation in the medicinal leech. I. Oscillation in isolated ganglia. J Neurophysiol. 1983b;49:611–626. doi: 10.1152/jn.1983.49.3.611. [DOI] [PubMed] [Google Scholar]
- 31.Rossignol S, Dubuc R. Spinal pattern generation. Curr Opin Neurobiol. 1994;4:894–902. doi: 10.1016/0959-4388(94)90139-2. [DOI] [PubMed] [Google Scholar]
- 32.Rowat PF, Selverston AI. Modeling the gastric mill central pattern generator of the lobster with a relaxation-oscillator network. J Neurophysiol. 1993;70:1030–1053. doi: 10.1152/jn.1993.70.3.1030. [DOI] [PubMed] [Google Scholar]
- 33.Schmidt J, Calabrese RL. Evidence that acetylcholine is an inhibitory transmitter of heart interneurons in the leech. J Exp Biol. 1992;171:329–347. doi: 10.1242/jeb.171.1.329. [DOI] [PubMed] [Google Scholar]
- 34.Sharp AA, ONeil MB, Abbott LF, Marder E. Dynamic clamp: computer-generated conductances in real neurons. J Neurophysiol. 1993a;69:992–995. doi: 10.1152/jn.1993.69.3.992. [DOI] [PubMed] [Google Scholar]
- 35.Sharp AA, ONeil MB, Abbott LF, Marder E. The dynamic clamp: a new approach for understanding the role of ionic conductances in neural network regulation. Biophys J. 1993b;64:103. [Google Scholar]
- 36.Simon TW, Opdyke CA, Calabrese RL. Modulatory effects of FMRF-NH2 on outward currents and oscillatory activity in heart interneurons of the medicinal leech. J Neurosci. 1992;12:525–537. doi: 10.1523/JNEUROSCI.12-02-00525.1992. [DOI] [PMC free article] [PubMed] [Google Scholar]
- 37.Simon TW, Schmidt J, Calabrese RL. Modulation of high-threshold transmission between heart interneurons of the medicinal leech by FMRF-NH2. J Neurophysiol. 1994;71:454–466. doi: 10.1152/jn.1994.71.2.454. [DOI] [PubMed] [Google Scholar]
- 38.Skinner FK, Gramoll S, Calabrese RL, Kopell N, Marder E. Frequency control in biological half-center oscillators. In: Eeckman F, Bower JM, editors. Computation and neural systems. Kluwer Academic; Boston: 1994a. pp. 223–228. [Google Scholar]
- 39.Skinner FK, Kopell N, Marder E. Mechanisms for oscillation and frequency control in reciprocal inhibitory model neural networks. J Comp Neurosci. 1994b;1:69–87. doi: 10.1007/BF00962719. [DOI] [PubMed] [Google Scholar]
- 40.Thompson WJ, Stent GS. Neuronal control of heartbeat in the medicinal leech. II. Intersegmental coordination of heart motor neuron activity by heart interneurons. J Comp Physiol [A] 1976;111:281–307. [Google Scholar]
- 41.Tolbert LP, Calabrese RL. Anatomical analysis of contacts between identified neurons in the heartbeat system of the leech Hirudo medicinalis. Cell Tissue Res. 1985;242:257–267. [Google Scholar]
- 42.Wallén P, Ekeberg Ö, Lansner A, Brodin L, Tråvén H, Grillner S. A computer-based model for realistic simulations of neuronal networks. II. The segmental network generating locomotor rhythmicity in the lamprey. J Neurophysiol. 1992;68:1939–1950. doi: 10.1152/jn.1992.68.6.1939. [DOI] [PubMed] [Google Scholar]
- 43.Wang X-J, Rinzel J. Alternating and synchronous rhythms in reciprocally inhibitory model neurons. Neural Comput. 1992;4:84–97. [Google Scholar]
- 44.Williams TL. Phase coupling by synaptic spread in chains of coupled neuronal oscillators. Science. 1992;258:662–665. doi: 10.1126/science.1411575. [DOI] [PubMed] [Google Scholar]
- 45.Wolf E, Roberts A. The influence of premotor interneuron populations on the frequency of the spinal pattern generator for swimming in Xenopus embryos: a simulation study. Eur J Neurosci. 1995;7:671–678. doi: 10.1111/j.1460-9568.1995.tb00671.x. [DOI] [PubMed] [Google Scholar]


