

Abstract
Locus coeruleus (LC) neurons in brain slices from adult rats were studied using intracellular and extracellular recordings to investigate synchronous activity. Spontaneous field potentials were recorded with extracellular electrodes in solutions containing tetraethylammonium chloride (10 mm) and BaCl2 (1 mm). These field potentials were found throughout but not outside the LC cell body region. No field potentials were observed in control solutions. Paired recordings showed that field potentials were synchronous in all areas of the LC. The synchronous activity was resistant to tetrodotoxin (1 μm) and to the neurotransmitter receptor blockers d-2-amino-5-phosphonopentanoic acid, bicuculline, 6-cyano-7-nitroquinoxaline-2,3-dione, idazoxan, and strychnine, suggesting that this activity was not synaptically driven. Field potentials were also synchronous with oscillations in membrane potential recorded with intracellular electrodes. The oscillations in membrane potential were 5–30 mV in amplitude and had a biphasic waveform. Neither the frequency nor the waveform of the oscillations was dependent on the membrane potential. The glycyrrhetinic acid derivative carbenoxolone and intracellular acidification with CO2 disrupted synchronous activity, suggesting a role of electrotonic coupling. When the cell body region of the LC was isolated from the pericoerulear dendritic regions by sectioning the slice rostral and caudal to the cell body region, synchronous activity was reduced or abolished. Dendritic interaction in the pericoerulear region was also indicated by improved voltage control of the opioid-induced potassium current, as indicated by a shift in the reversal potential to the potassium equilibrium potential. The results suggest that electrical interactions between dendrites outside the cell body region can account for synchronous activity within the nucleus.
Keywords: LC, gap junctions, electrotonic coupling, slices, field potentials, dendrites
The neurons in the locus coeruleus (LC) have widespread projections throughout the brain. Excitatory afferent input to the LC from paragigantocellularis (PGi) appears to result in synchronous activation of LC neurons in vivo and may serve to regulate noradrenergic tone in the widespread projection areas (Aston-Jones et al., 1991). Such synchronous activation would require potent and widespread release of excitatory transmitter onto individual neurons. Another mechanism that could foster synchronous activation of activity without selective synaptic activation is electrotonic coupling between neurons. Electrotonic coupling between cells is one means of intercellular communication used by various tissues, including brain (Paul, 1986; Beyer et al., 1989; Dermeitzel et al., 1989; Traub et al., 1989; Gimlich et al., 1990; Risek et al., 1990).
Developmentally, electrotonic coupling is thought to be an important prelude to the formation of synaptic contacts between cortical neurons (Peinado et al., 1993). Electrotonic coupling between neurons in adult animals has been difficult to demonstrate directly using paired recordings or dye coupling (Llinas, 1985; Dermietzel and Spray, 1993). Despite these difficulties, electrotonic coupling has been proposed to mediate synchronous activity in many areas such as neocortex, hippocampus, retina, inferior olive, and LC (MacVicar and Dudek, 1981;Piccolino et al., 1982; Connors et al., 1983; Llinas and Yarom, 1986;Christie et al., 1989; Bleasel and Pettigrew, 1992; Christie and Jelinek, 1993; Travagli et al., 1995).
In the LC, dye and electrical coupling were found in rats younger than 7 d old, and synchronous oscillations were routinely observed in slices from animals up to 24 d (Christie et al., 1989; Christie and Jelinek, 1993). Demonstration of the presence of coupling and thus the physiological role of coupling in the LC from adult animals has been limited because of the inability to demonstrate direct electrical or dye coupling (Travagli et al., 1995). In some conditions, however, synchronous oscillations have been reported in adult animals (Travagli et al., 1995). In other studies, oscillations in membrane potential (and current) that resembled synchronous activity were evident, even in normal recording solutions (Wang and Aghajanian, 1990; Shen and North, 1992a,b, 1993; Alreja and Aghajanian, 1993, 1994). Such oscillations were not observed in every preparation. We found that the addition of tetraethylammonium chloride (TEA) (10 mm) and BaCl2 (1 mm) to the superfusion solution always revealed synchronous oscillations in LC neurons such that this solution could be used to further characterize this activity in adult rats.
Parts of this work have been published previously in abstract form (Ishimatsu and Williams, 1995).
MATERIALS AND METHODS
Preparation. Exact details of the method of tissue preparation have been published (Williams et al., 1984). Briefly, adult rats (200 gm) were anesthetized with halothane and killed by severing the main blood vessels in the chest, and the brain was removed. Horizontal brain slices (300 μm) containing the LC were cut using a vibratome in cooled artificial CSF (Krebs solution at 4°C) and stored in an oxygenated warm Krebs solution (35°C). For recording, a hemisected slice was placed in a recording chamber and superfused with Krebs solution.
Perfusion and drugs. The slice was superfused (1.5 ml/min) with Krebs solution at 35°C. Krebs solution was saturated with 95% O2/5% CO2 and contained (in mm): 126 NaCl, 2.5 KCl, 1.2 MgCl2, 2.4 CaCl2, 1.2 NaH2PO4, 21 NaHCO3, and 11 glucose. In some experiments, Krebs solution was bubbled with 100% CO2 for 15 min just before experiments to lower the pH from 7.3 to 6.8, measured just before superfusion. All drugs were applied by superfusion. Most experiments were carried out in solution containing TEA (10 mm), TTX (1 μm), and BaCl2 (1 mm), and unless stated otherwise, this will be called TEA Krebs solution. NaCl was reduced by 10 mm. When the potassium concentration was increased, NaCl was reduced by an equimolar amount.
Electrophysiological recordings. Intracellular recordings of the membrane potential were made with glass microelectrodes filled with 2 m KCl having resistances of 26–40 MΩ. In some experiments, two intracellular recordings were made from individual cells. Extracellular recordings of field potentials were made with broken glass electrodes filled with NaCl (500 mm) having resistances of 1–5 MΩ. Measurements of current, voltage, and extracellular activity were made with an Axoclamp 2A amplifier. Records were digitized and saved on computer using PClamp (Axon Instruments, Foster City, CA) and Chart (A.D. Instruments) software. Numerical data are presented as the mean ± SEM.
Histology. In some experiments, cells were labeled with the Cy5-EDA (Biological Detection Systems). This is a bright, water-soluble dye (molecular weight, 699; excitation, 645 nm; emission, 663 nm) that is resistant to fading with repeated or prolonged excitation, such that it is ideal for filling cells with microelectrodes in brain slices. The tips of microelectrodes were filled with a solution of 10 μg/μl Cy5-EDA in KCl (2 m), and cells were impaled as usual using a dissection microscope. At this concentration, it took 2–10 min to fill cells adequately for subsequent visualization with a confocal microscope. Slices were then prepared for catecholamine fluorescence. They were fixed in a solution of glutaraldehyde (0.5%) and formaldehyde (4%) in phosphate buffer (0.1 m, pH 7.0) for 1–2 hr, placed on a coverslip, and dried overnight in a desiccator (De la Torre and Surgeon, 1976). The slice was then covered with mineral oil, and another coverslip was placed over the slice. Catecholamine fluorescence was used to locate the cell body region of the LC with an upright microscope (Nikon), and individual Cy5-filled cells were imaged with a confocal microscope (Noran).
Drugs. Tetrodotoxin (TTX), [Met]5enkephalin (ME),d-2-amino-5-phosphonopentanoic acid (APV), TEA, BaCl2, carbenoxolone, bicuculline, and strychnine were purchased from Sigma (St. Louis, MO). Idazoxan, 6-cyano-7-nitroquinoxaline-2,3-dione (CNQX), and AMPA were purchased from Research Biochemicals International (Natick, MA).
RESULTS
Oscillations in adult LC neurons
The membrane potential in LC neurons ranged from −50 to −60 mV. As reported previously, most neurons were spontaneously active, having action potentials that occurred at a rate of 0.5–2.0 Hz, were 70–80 mV in amplitude, and were 1.2–1.5 msec in duration (measured at the threshold; Williams et al., 1984). When the membrane potential was held more negative than −60 mV, spontaneous activity was abolished. In a solution containing TEA (10 mm), BaCl2 (1 mm), and TTX (1 μm) (TEA Krebs; see Materials and Methods), cells depolarized, and oscillations in the membrane potential were observed within 1–3 min after the onset of superfusion (Fig.1A). When the membrane potential was held near −60 mV, action potentials were often evoked at the peak of the depolarizing phase of the oscillation. In this solution, action potentials were of larger amplitude (50–70 mV) and shorter duration (20–200 msec) (Fig. 1C) than the oscillations and thus were easily distinguished (Figs. 1, 2). When cells were held at more negative potentials, oscillations did not evoke action potentials (Fig. 2A). With the onset of the oscillations in membrane potential, extracellular recordings of field potentials were obtained (Fig. 1A). The field potentials were synchronous with the depolarizing phase of the oscillations (Fig. 1). At steady state, the amplitude of the oscillations ranged from 5 to 30 mV and were biphasic, having a larger depolarizing phase followed by a hyperpolarizing phase, and the oscillations occurred at regular intervals with frequencies that ranged from 0.03 to 0.27 Hz (mean 0.012 ± 0.011 Hz, n = 38), depending of the preparation (Fig. 2A). The hyperpolarizing component of the oscillations rose to a peak (−18.7 ± 0.5 mV, n = 38) within 50–150 msec and declined over a period of 3–20 sec, resembling an afterhyperpolarization (AHP) that followed an action potential (Fig.2B). The voltage and potassium dependence of the hyperpolarizing component of the oscillation were compared to the AHP that followed an action potential evoked by passing current through the intracellular electrode. First, note that the frequency of the oscillations was not reduced by hyperpolarization, even to −120 mV. In addition, the hyperpolarizing component of the oscillations was not changed in amplitude at negative potentials (−22.3 ± 3.7 mV at −60 mV, −19.8 ± 4.2 mV at −80 mV, −19.5 ± 3.9 mV at −120 mV; n = 6). In contrast, the AHP after an evoked action potential reversed polarity at the potassium equilibrium potential (Fig. 2B,D). The voltage independence of these oscillations suggests that they originate electrotonically distant from the recording electrode.
Fig. 1.

TEA-, Ba-, and TTX-containing Krebs (TEA Krebs) evoke synchronous oscillations in membrane potential, action potentials, and extracellular field potentials. A, Thetop trace shows an intracellular recording of membrane potential (dashed line is −60 mV), and the bottom trace shows a recording of field potentials with an extracellular electrode. The larger deflections are action potentials that were evoked at the peak of the depolarizing phase of oscillations. In this cell, the largest oscillations in membrane potential were <25 mV.B, Expanded time scale of the period indicated by theopen box in A. The action potentials and oscillations in membrane potential were synchronous with field potentials. An example of an oscillation is marked with anasterisk and is illustrated at an expanded time base inC. C, Expanded time scale of an intracellular recording of an oscillation (indicated by the asterisk inB), an action potential that arose at the peak of an oscillation, and an extracellular spike (indicated by the solid triangle in B).
Fig. 2.
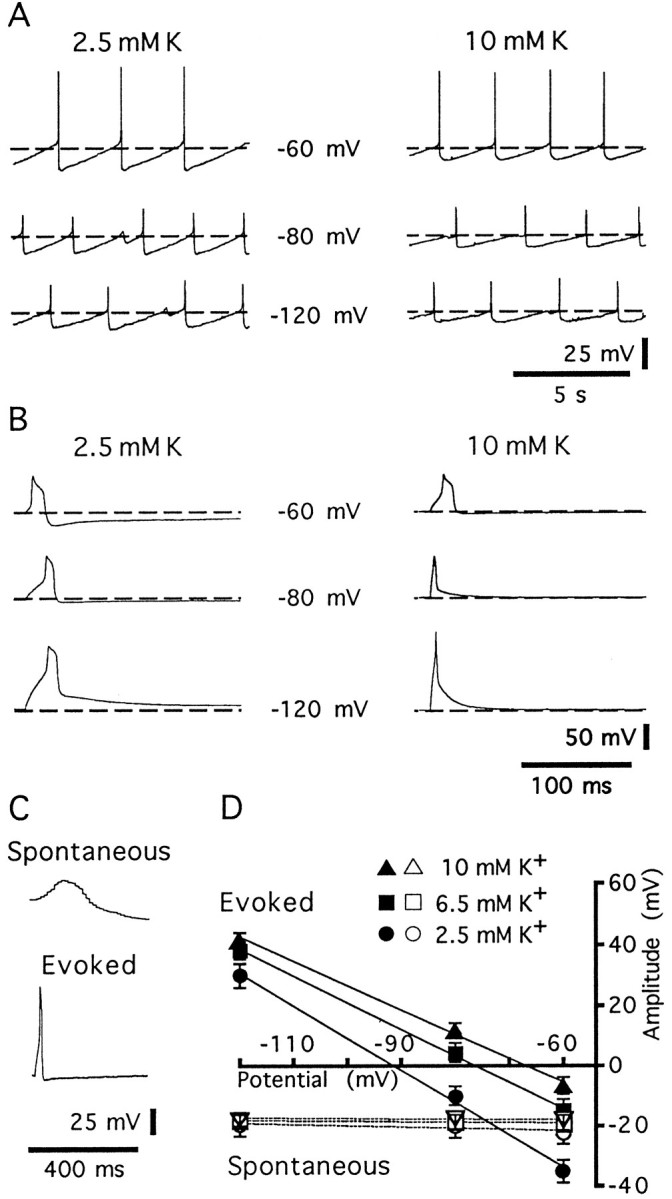
Oscillations of membrane potential are independent of voltage and extracellular potassium concentration. A, Spontaneous activity was examined at −60, −80, and −120 mV, and the extracellular potassium was increased from 2.5 to 10 mm. At −60 mV, an action potential was evoked at the peak of each oscillation. The hyperpolarization after the action potential is therefore the combination of an AHP and the hyperpolarizating phase of the oscillation. The spontaneous oscillations were not affected by increasing extracellular potassium.B, The waveforms of evoked action potentials were tested at −60, −80, and −120 mV in 2.5 and 10 mmK+. In this case, the AHP reversed polarity at hyperpolarized potentials, and this reversal was dependent on the extracellular K+. C, The waveforms of a spontaneous oscillation (Spontaneous) and an action potential (Evoked) are illustrated with the same time scale. The initial membrane potential is −80 mV for both traces.D, Plot of the amplitude of the hyperpolarizing component of the oscillations (open symbols) compared with the AHP (solid symbols) at different membrane potentials and in different potassium concentrations (2.5 mm,circles; 6.5 mm, squares; 10 mm, triangles). Thelines are the best fits using a least-squares analysis. Error bars indicate the SEM (n = 6).
To further characterize the hyperpolarizing component of the oscillation, experiments were carried out in solutions in which the extracellular potassium concentration was increased from control (2.5 mm) to 6.5 and 10 mm (Fig.2A). The amplitude of the hyperpolarizing component of the membrane oscillation, measured at −60 mV, was not changed significantly by these solutions (amplitude: −22.3 ± 3.7 mV in 2.5 mm, −19.1 ± 2.5 in 6.5 mm, −16.2 ± 2.1 in 10 mm; n = 6). In higher external potassium concentrations, there was no suggestion that the hyperpolarizing component was reduced by hyperpolarization. The AHP after an evoked action potential reversed polarity near the equilibrium potential of potassium in all three concentrations of external potassium (reversal potential: −91.0 ± 5.5 mV in 2.5 mm, −75.9 ± 3.7 mV in 6.5 mm, −67.0 ± 2.8 mV in 10 mm; n = 6) (Fig. 2B). These results show that the hyperpolarizing component of the spontaneous oscillations, unlike the AHP, was dependent on neither the membrane potential nor the extracellular potassium. The results suggest that the oscillations observed in this study are similar to the spontaneous oscillations found in slices from neonatal animals in control solutions. Activity was driven by the combination of intrinsic sodium and calcium currents that were followed by the activation of potassium currents (Williams and Marshall, 1987). The lack of reversal of the hyperpolarizing component of the oscillation in neonates and adults may result from a lack of voltage control.
In slices from neonatal animals, the oscillations in membrane potential were synchronous, thus implying that many LC cells fired action potentials during the peak of the oscillation (Christie et al., 1989). To further characterize these oscillations, extracellular recordings were made to determine whether the oscillations were correlated with field potentials. Extracellular activity was not observed in normal Krebs solution but was always found in TEA-containing Krebs. The onset of extracellular activity was detected only at the time when the oscillations in membrane potential were first observed. The presence of electrically evoked extracellular field potentials is used in many slice preparations to indicate the synchronous activation of action potentials in a group of neurons. Because oscillations in membrane potential and extracellular field potentials were completely synchronous, we suggest that the field potentials result from synchronous activity of a group of LC neurons (Fig. 1B). In other experiments, dual intracellular recordings were made in which the two microelectrodes were at least 100 μm apart. Evoked action potentials in one cell were not detected in the second cell; however, all pairs of cells fired synchronous action potentials (n = 6) (Fig. 3).
Fig. 3.

Dual intracellular recordings show synchronous action potentials. This experiment was made from intracellular recordings from two cells: top trace from cell 1 andbottom trace from cell 2. In TEA, BaCl2, and TTX solution, two individual cells show synchronous action potentials (solid triangles) and oscillations (open triangles) of the membrane potential.
Oscillations are synchronous
To determine the origin of the oscillations, an extracellular recording electrode was placed at several positions either inside or outside the LC during simultaneous intracellular recording (n = 6) (Fig. 4). For these experiments, the extracellular recording electrode was placed in different areas while the slice was visualized with a dissection microscope. With use of transillumination, the cell body region is easily distinguishable as a translucent area. Estimates of the distances between recording sites were aided by the electron microscope grid that is placed on top of the slice for stabilization purposes. Extracellular field potentials were observed only when the recording electrode was placed inside the cell body region of the LC. No activity was detected outside the LC. To test the possibility that the oscillations were initiated at one point within the nucleus and radiated from that site, dual extracellular recordings were made between different parts of the LC. One electrode was placed on the extreme ventricular (medial) side of the nucleus, and the second was placed in three positions: close (<100 μm), intermediate (200 μm), and far (>300 μm) from the first electrode (Fig. 5). The difference in the time at which the field potentials reached a peak was measured between the electrodes in each position. The averaged interval between peaks at each position was 10 msec or less (far, 8.2 ± 3.9 msec; intermediate, 10.7 ± 5.6 msec; close, 2.7 ± 4.9 msec; n = 8 slices) (Fig.5). There was no significant difference in the interval between the peaks at any of the three positions. These results suggest that the oscillations were not driven by a subgroup of cells but were synchronous throughout the nucleus.
Fig. 4.

Synchronous activity is found throughout the LC cell body region but not outside that area. The extent of synchronous oscillations was examined by recording field potentials from various positions either inside or outside the LC. Membrane potential was measured intracellularly from the point marked by the X.Top trace (I) shows membrane potential, and bottom trace (E) shows field potential of each panel. The schematic illustrates the cell body region of LC in a slice. The boundary of the fourth ventricle is shown (4V); the numbers show positions from which extracellular field potential recordings were made, inside (1–3) and outside (4–6) the cell body region of the LC.
Fig. 5.

Field potentials are synchronous in the entire cell body area of the LC. Field potentials were recorded from two positions inside the LC using two extracellular electrodes. The schematic illustrates the positions at which field potentials were recorded. One electrode was fixed at the place indicated by theX (potentials illustrated with the dotted lines). A second electrode was placed close (C), intermediate (I), or far (F) (potentials illustrated with the solid line). Sample records are shown at close, intermediate, and far position. This experiment was carried out in recordings from eight slices obtained from five animals.
Spontaneous activity is not driven by synaptic transmission
To test the possibility that synaptic transmission triggers the oscillations in membrane potential, all experiments were carried out in the presence of TTX (1 μm). In addition, the effect of a series of neurotransmitter receptor antagonists that are known to block electrically evoked synaptic potentials was tested (Cherubini et al., 1988). The combination of APV (100 μm), idazoxan (1 μm), CNQX (10 μm), bicuculline (10 μm), and strychnine (10 μm) did not abolish or attenuate the membrane oscillations (n = 12; not shown).
Oscillations can be modified
If the synchronous activity was the result of the firing of a network of cells, the only effective method that would modulate this activity would be to change the membrane potential of all the cells simultaneously. One method used to accomplish this aim was to superfuse agents known to affect all LC neurons. The addition of BaCl2 (1 mm) to the TEA-containing Krebs solution depolarized cells and evoked membrane oscillations even when the membrane potential of an individual cell was held at a very negative potential (n = 86) (Fig.6A). A similar increase in synchronous activity was also observed in experiments using the glutamate receptor agonist α-amino-3-hydroxy-5-methyl-4-isolxanzolepropionic acid (AMPA) (Fig. 7C). To inhibit LC neurons, ME (10 μm) was superfused. A lower concentration of BaCl2 (100 μm) was used for these experiments to avoid complete blockade of the potassium conductance affected by ME (Williams et al., 1988). Under these conditions, the increase in potassium conductance caused by ME caused a decrease in the spontaneous activity. In all experiments, the frequency of the oscillations was reduced significantly by ME (0.10 ± 0.013 Hz in control, 0.018 ± 0.006 Hz in ME, n = 10;p < 0.001) (Fig. 6B). During perfusion of ME, current injection resulted in the generation of action potentials that were not detected with the extracellular recording. These results suggest that the oscillations are regulated by the activity of neurons in the entire nucleus, and the activity of any single neuron has little significance.
Fig. 6.

Barium and enkephalin modulate the frequency of synchronous activity. A, Top trace shows potential, and bottom trace shows current. Dotted line shows −60 mV. TEA (10 mm) and TTX (1 μm) were present throughout the experiment. Thebar indicates the period of superfusion of BaCl2 (1 mm). BaCl2 induced the membrane potential oscillations that were present even at −120 mV. This effect was reversible on washout. B, Top trace (I) shows membrane potential, and bottom trace (E) shows field potential. This experiment was carried out in the presence of TEA (10 mm), TTX (1 μm), and BaCl2 (100 μm).Met-Enkephalin (10 μm) was added to the bath solution during the period showing an open bar. Enkephalin decreased the frequency of oscillations. Current injection was used to evoke action potentials in the cell recorded intracellularly, but those action potentials were not detected with the extracellular electrode.
Fig. 7.

Carbenoxolone and acidification disrupt synchronous activity. A, Top trace(I) shows membrane potential, middle trace(E) shows field potential, and bottom trace shows current. The dashed line indicates −60 mV. Before perfusion of carbenoxolone, synchronous action potentials and field activity were observed. After perfusion of carbenoxolone (100 μm, 90 min), spontaneous action potentials were observed at the zero current level, but no oscillations in membrane potential or field potentials were observed. The effect of carbenoxolone was irreversible. B, Low-pH solution was perfused during the period indicated by the bar. Cell acidification reversibly depolarized the cell and blocked field potential activity, despite the presence of action potentials observed with intracellular recordings. C, In the same cell as shown in B, superfusion of AMPA (0.5 μm) depolarized the neuron and increased the rate of action potentials, oscillations, and extracellular field potential activity. The firing remained synchronous during the depolarization induced by AMPA.
Gap junction blockers disrupt oscillations
The glycyrrhetinic acid derivative carbenoxolone, an agent that has been reported to decrease dye transfer between cells (Davidson et al., 1986; Davidson and Baumgarten, 1988; Martin et al., 1991), was tested on the oscillations. After superfusion of carbenoxolone (100 μm) for 1 hr, oscillations in membrane potential and spontaneous field potential activity were abolished (n = 5). Evoked and spontaneous action potentials, however, were still present (Fig. 7A).
Intracellular acidification also blocks gap junctions (Turin and Warner, 1980; Lo Turco and Kriegstein, 1991). Low-pH TEA Krebs (pH 6.8) produced a reversible depolarization of 10–20 mV accompanied by a decreased frequency of spontaneous synchronous activity (n = 10) (Fig. 7B). The effect of low-pH solution was reproducible with repeated short (1–2 min) applications, but longer applications resulted in a reduction of the viability of the slice. Because of the depolarization induced by the low-pH solution, experiments with the glutamate receptor agonist AMPA were carried out to serve as controls for the depolarizing effect (n = 5). AMPA (500 nm) caused a depolarization of comparable amplitude to the low-pH solutions and increased the frequency of synchronous spontaneous activity measured with both intracellular and extracellular recordings. Despite the depolarization, synchronous activity was maintained, suggesting that the depolarization induced by low-pH solution did not account for the decrease in spontaneous activity (Fig. 7C).
Dendrites are necessary for synchronous oscillations
In dye-coupling experiments using neonatal animals, it was shown that the only sites at which LC cells made contact were between dendrites (Christie and Jelinek, 1993). It is known that a substantial portion of the dendritic arbor of LC neurons extends outside the cell body region in both the caudal and rostromedial directions (Aston-Jones et al., 1995). This observation was confirmed in horizontal slices in which cells were filled with Cy5 and catecholamine fluorescence was imaged (Fig. 8). To examine the role of the pericoerulear dendrites in the synchronous activity, the cell body region in slices was isolated by sectioning the slice rostromedial and caudal to the cell body region (n = 7). In these slices, the cell body region was preserved but projections out of the area were sectioned. In all slices examined, there were multiple processes found along the sectioned portion of the slice (Fig.9). The frequency of synchronous oscillations was reduced significantly in the resectioned slices (control, 0.89 ± 0.01 Hz; resectioned slices, 0.024 ± 0.01 Hz; n = 7 for each; p = 0.001) (Table1). The development of synchronous oscillations after application of the TEA solution was also prolonged from 3 min (in control slices) to >15 min (in resectioned slices). Finally, oscillations in resectioned slices were qualitatively different, being smaller in amplitude and irregular in frequency (Fig.9). These results suggest that the pericoerulear processes play an important role in the synchronous activity observed in the LC.
Fig. 8.

Dendrites extend beyond the cell body region of the LC in the rostral and caudal directions. Left, Confocal image of 10 Cy5-filled neurons. This image highlights the extent of the dendritic arbor of these cells. To avoid saturation of the detection system in the cell body region, images in this area were collected with lower-intensity illumination. Thus, the dendrites in the area proximal to the cell body region are not clearly visualized. Right, Catecholamine fluorescence image of the same slice to indicate the extent of the cell body region. The ventrical is on theright, and rostral is toward the top.Bottom, A voltage recording illustrating the typical spontaneous activity observed in these control slices.
Fig. 9.
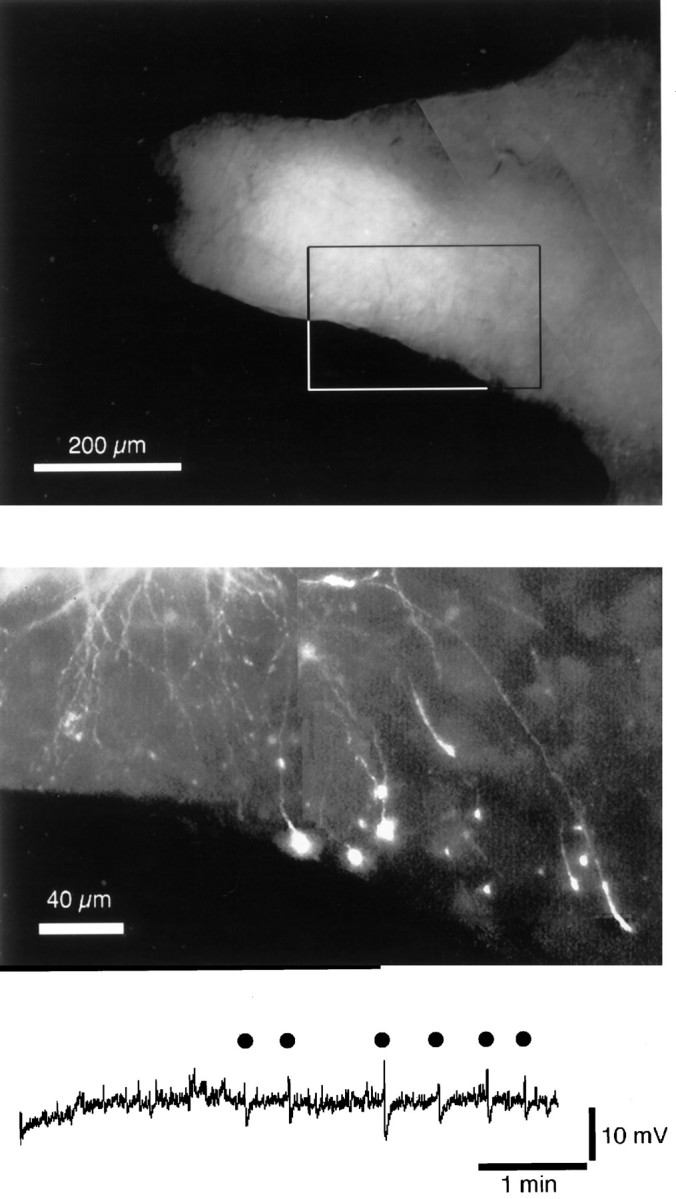
In resectioned slices, oscillations in membrane potential induced by TEA are small, erratic, and of low frequency.Top, The catecholamine fluorescence in the resectioned area of a slice. The top and bottom of this section were the cut regions of the slice caudal and rostral to the cell body region, respectively. The fourth ventrical is to the left.Middle, A confocal image of the area indicated by thebox at the top to illustrate the cut dendrites that extended rostrally. In this slice, six cells were filled with Cy5.Bottom, A voltage record from a resectioned slice (951206) to illustrate the small size and erratic frequency of the oscillations in membrane potential that were commonly found in resection slices. Thedots indicate where changes in membrane potential were counted as oscillations.
Table 1.
Summary of results obtained from control and resectioned slices
| Cell | Oscillations | ME current | ||
|---|---|---|---|---|
| Number in 5 min | Frequency (Hz) | At −60 mV (pA) | Reversal potential (mV) | |
| Control slices | ||||
| 950928 | 40 | 0.13 | ||
| 950929 | 25 | 0.083 | ||
| 951010 | 22 | 0.073 | ||
| 951019 | 22 | 0.073 | ||
| 951020 | 21 | 0.07 | ||
| 951027 | 17 | 0.057 | ||
| 951121 | 40 | 0.13 | ||
| (FromTravagli et al., 1995) | (300–400) | (−132 ± 3.2) | ||
| Resectioned slices | ||||
| 951130 | 21 | 0.07 | 174 | |
| 951201 | 1 | 0.003 | 98 | |
| 951204 | 0 | 0 | 94 | −110 |
| 951205 | 7 | 0.02 | 70 | −110 |
| 951206 | 6 | 0.02 | 70 | −111 |
| 951212 | 15 | 0.05 | 123 | −136 |
| 951218 | 1 | 0.003 | 86 | −115 |
| 960226a | 145 | −119 | ||
| 960226b | 141 | −106 | ||
Resectioned slices are those in which knife cuts were made rostral and caudal to the cell body region of the locus coeruleus.
It has been reported previously that the reversal potential of the ME-induced current was often more negative than the potassium equilibrium potential (Alreja and Aghajanian, 1993; Travagli et al., 1995). One explanation is that the space clamp of the opioid current is poor because of electrotonic interactions between LC neurons (Travagli et al., 1995). In slices in which the synchronous oscillations were reduced by sectioning the slice rostral and caudal to the LC cell body region, the reversal potential of the ME-induced current was −116 ± 4 mV (n = 7) (Table 1), which is less negative than that reported in horizontal slices using intracellular electrodes (−132 mV; Travagli et al., 1995). The amplitude of the ME current at −60 mV was 106 ± 35 pA, which is smaller than that observed in normal horizontal slices (300–400 pA; Travagli et al., 1995), but not different from that found in slices cut in the coronal plane (Travagli et al., 1996). These results further support an important physiological role of the pericoerulear dendrites from the LC.
DISCUSSION
Synchronous activity
This study shows the presence of synchronous activity of neurons in the nucleus LC from adult rats. Unlike recordings from LC neurons in slices from neonatal animals, oscillations in the membrane were not routinely observed under normal conditions (but see Wang and Aghajanian, 1990; Shen and North, 1992a,b, 1993; Alreja and Aghajanian, 1993, 1994). Synchronous oscillations were always observed in TEA-and BaCl2-containing Krebs, thus allowing further characterization of this activity. In that solution, spontaneous and synchronous field potentials were recorded throughout the nucleus, with extracellular electrodes indicating that a major population of LC neurons fired action potentials at the same time.
Direct proof of electrotonic coupling between LC cells in adult rats has not been possible. There is no evidence of electrical or dye coupling, nor has the presence of connexins in LC cells been studied. Demonstration of electrotonic coupling at other sites in the mammalian CNS have been more successful. In hippocampus, MacVicar and Dudek (1981) found electrotonic coupling with dual-cell intracellular recordings. Synchronous membrane oscillations were demonstrated in inferior olivary neurons (Llinas and Yarom, 1986). Dye coupling between neurons was shown in the nucleus accumbens (O’Donnell and Grace, 1993).
In the LC, synchronous oscillations seemed to be independent of synaptic transmission because they were TTX resistant, were not diminished by a combination of neurotransmitter blockers that eliminated electrically evoked synaptic potentials (APV, bicuculline, CNQX, idazoxan, and strychnine; Cherubini et al., 1988), and were recorded only from inside the LC. The oscillations were independent of membrane potential in the recorded neuron, as was found in neonatal animals (Christie et al., 1989; Christie and Jelinek, 1993). As was determined in slices from neonatal animals, further investigation of the ionic mechanism was limited by the inability to control the voltage. Superfusion with CoCl2 (1 mm) and TTX (1 μm) blocked the oscillations (n = 3; not shown), so as in the neonates, the origin of the oscillations in membrane potential was thought to be driven by the intrinsic spontaneous activity of LC neurons. The voltage independence of the oscillations, both the depolarizing and hyperpolarizing phases, presumably results from the inability to control electrotonically coupled neurons. Control of the population of LC cells was obtained only with the superfusion of agents that affected many cells, such as AMPA and ME. Finally, two manipulations known to block electrotonic coupling in other sites, carbenoxolone and low pH, reduced or abolished the synchronous oscillations in membrane potential (Turin and Warner, 1980; Davidson et al., 1986; Davidson and Baumgarten, 1988; Lo Turco and Kriegstein, 1991; Martin et al., 1991). Taken together, the results suggest that electrotonic coupling between adult neurons may account for the synchronous activity.
TEA was required
Synchronous activity was always observed in the presence of TEA, BaCl2, and TTX. By increasing the membrane resistance with BaCl2 and prolonging the action potential with TEA, action potentials would result in a greater saturation of the network capacitance. The size of the network capacitance was indicated in experiments using neonatal animals in which injection of current into one cell caused a potential change in a second cell (Christie et al., 1989). The time constant of any individual cell was on the order of 10–20 msec, whereas the time constant of the potential change found in receiving cells was 100–300 msec. Electrotonic coupling is considered to act like a low-pass filter for the transmission of signals between neurons (Hagiwara and Morita, 1962; MacVicar and Dudek, 1981; Dudek et al., 1983; Llinas, 1985) and not only allows slow changes in the membrane potential but requires slow changes in potential to be detected. Spontaneous or synaptically evoked action potentials in any individual neuron would not significantly influence the excitability of the nucleus as a whole. Slow and synchronous events, including excitatory synaptic input such as the glutamate-mediated EPSP (total duration = 100–200 msec; Cherubini et al., 1988) and certainly the noradrenergic IPSP (total duration = 2 sec; Egan et al., 1983), will influence the nucleus as a whole. In this way, electrotonic coupling may modify the output of the nucleus, as determined by slow changes in membrane potential in combination with the intrinsic activity of individual neurons and synaptic influences.
Structure of the nucleus
The morphology of LC neurons also may provide the anatomical bases for synchronous activity. The dendritic arbor of any individual LC neuron extends throughout and beyond the cell body region (Aston-Jones et al., 1991, 1995; Ivanov and Aston-Jones, 1995; Shipley et al., 1996). Thus any individual neuron may not make extensive contacts with any other single neuron but could contact many neurons from all parts of the nucleus. In fact, dye-coupling experiments using neonatal animals showed that the only places at which coupled neurons came into close contact were dendritic sites (Christie and Jelinek, 1993). The degree of coupling between neurons in the adult or even in animals older than ∼7 d is markedly reduced, such that dye-coupling experiments have failed. Dilution of dye from the point of contact of an injected cell into the secondary cells could limit detection. Simi- larly, even in neonatal animals the capacitative filtering of an action potential lasting 1.5 msec prevented detection in a second cell that was electrotonically coupled (Christie et al., 1989). These observations suggest that coupling in the LC is distant and involves connections between many different neurons.
The extension of LC dendrites into regions surrounding the cell body region has been recognized as being a potential site for afferent inputs arising from areas different from the restricted areas that innervate the cell bodies (Aston-Jones et al., 1995; Ivanov and Aston-Jones, 1995; Shipley et al., 1996). The results from this study support the suggestion that these pericoerulear areas may have a significant influence on the activity of LC cells and are where the processes from LC cells may interact directly.
Significance
The LC has extensive projections throughout the CNS, such that the regulation of activity in the LC is expected to be important in central noradrenergic tone. Electrotonic coupling between neurons may help regulate activity of cells in the nucleus to facilitate synchronous increases and decreases in the release of noradrenaline. It seems that the only time that electrotonic interactions could play an important role is under conditions in which slow events cause either a significant excitation or inhibition. The activity of a single neuron does not strongly influence other cells in the nucleus. Thus, in the resting state, output from the nucleus would be dependent on the spontaneous activity of individual cells. With the activation of a population of neurons, however, electrotonic coupling would serve to recruit others and thus enhance the overall output from the nucleus. The influence of electrotonic coupling in the LC is clearly not as strong as in syncytial tissues such as heart or smooth muscle, where such coupling results in the propagation of activity in an organized manner. Electrotonic coupling between LC neurons, however, could serve to facilitate synchrony in the event of a large afferent input.
Footnotes
This work was supported by the Markey Foundation and National Institutes of Health Grant DA08163. We thank Dr. E. McCleskey for comments on this manuscript and Chris Maki for assistance with the confocal microscope.
Correspondence should be addressed to Dr. John T. Williams, The Vollum Institute, L474, Oregon Health Sciences University, Portland, OR 97201.
REFERENCES
- 1.Alreja M, Aghajanian GK. Opiates suppress a resting sodium-dependent inward current and outward potassium current in locus coeruleus neurons. J Neurosci. 1993;13:3525–3532. doi: 10.1523/JNEUROSCI.13-08-03525.1993. [DOI] [PMC free article] [PubMed] [Google Scholar]
- 2.Alreja M, Aghajanian GK. QX-314 blocks the potassium but not the sodium-dependent component of the opiate response in locus coeruleus neurons. Brain Res. 1994;639:320–324. doi: 10.1016/0006-8993(94)91746-9. [DOI] [PubMed] [Google Scholar]
- 3.Aston-Jones G, Shipley MT, Chouvet G, Ennis M, Van Bockstaele E, Pieribone V, Shiekkattar R, Akaoka H, Drolet G, Astier B, Charlety P, Valentino RJ, Williams JT. Afferent regulation of locus coeruleus neurons: anatomy, physiology and pharmacology. Prog Brain Res. 1991;88:47–75. doi: 10.1016/s0079-6123(08)63799-1. [DOI] [PubMed] [Google Scholar]
- 4.Aston-Jones G, Shipley MT, Grzanna R. The locus coeruleus, A5 and A7 noradrenergic cell groups. In: Paxinos G, editor. The rat nervous system. Academic; San Diego: 1995. pp. 183–213. [Google Scholar]
- 5.Beyer EC, Kistler J, Paul DL, Goodenough DA. Antisera directed against connexin43 peptides react with a 43 kDa localized to gap junctions in myocardium and other tissues. J Cell Biol. 1989;108:595–605. doi: 10.1083/jcb.108.2.595. [DOI] [PMC free article] [PubMed] [Google Scholar]
- 6.Bleasel AF, Pettigrew AG. Development and properties of spontaneous oscillations of the membrane potential in inferior olivary neurons in the rat. Dev Brain Res. 1992;1:43–50. doi: 10.1016/0165-3806(92)90006-i. [DOI] [PubMed] [Google Scholar]
- 7.Cherubini E, North RA, Williams JT. Synaptic potentials in locus coeruleus neurones. J Physiol (Lond) 1988;406:431–442. doi: 10.1113/jphysiol.1988.sp017389. [DOI] [PMC free article] [PubMed] [Google Scholar]
- 8.Christie MJ, Jelinek HF. Dye-coupling among neurons of the rat locus coeruleus during postnatal development. Neuroscience. 1993;56:129–137. doi: 10.1016/0306-4522(93)90568-z. [DOI] [PubMed] [Google Scholar]
- 9.Christie MJ, Williams JT, North RA. Electrical coupling synchronizes subthreshold activity in locus coeruleus neurons in vitro from neonatal rats. J Neurosci. 1989;9:3584–3589. doi: 10.1523/JNEUROSCI.09-10-03584.1989. [DOI] [PMC free article] [PubMed] [Google Scholar]
- 10.Connors BW, Benardo LS, Prince DA. Coupling between neurons of the developing rat neocortex. J Neurosci. 1983;3:773–782. doi: 10.1523/JNEUROSCI.03-04-00773.1983. [DOI] [PMC free article] [PubMed] [Google Scholar]
- 11.Davidson JS, Baumgarten IM. Glycyrrhetinic acid derivatives: a novel class of inhibitors of gap-junctional intercellular communication. Structure-activity relationships. J Pharmacol Exp Ther. 1988;246:1104–1107. [PubMed] [Google Scholar]
- 12.Davidson JS, Baumgten IM, Harley EH. Reversible inhibition of intercellular junctional communication by glycyrretinic acid. Biochem Biophys Res Commun. 1986;134:29–36. doi: 10.1016/0006-291x(86)90522-x. [DOI] [PubMed] [Google Scholar]
- 13.De la Torre JC, Surgeon JW. A methodological approach to rapid and sensitive monoamine histofluorescence using a modified glyoxylic acid technique: the SPG method. Histochemistry. 1976;49:81–93. doi: 10.1007/BF00495672. [DOI] [PubMed] [Google Scholar]
- 14.Dermeitzel R, Spray DC. Gap junctions in the brain: where, what type, how many and why? Trends Neurosci. 1993;16:186–192. doi: 10.1016/0166-2236(93)90151-b. [DOI] [PubMed] [Google Scholar]
- 15.Dermeitzel R, Traub O, Hwang TK, Beyer E, Bennett MV, Spray DC. Differential expression of three gap junction proteins in developing and mature brain tissues. Proc Natl Acad Sci USA. 1989;86:10148–10152. doi: 10.1073/pnas.86.24.10148. [DOI] [PMC free article] [PubMed] [Google Scholar]
- 16.Dudek FE, Andrew RD, MacVicar BA, Snow RW, Taylor CP. Recent evidence for a possible significance of gap junction and electrotonic synapses in the mammalian brain. In: Elliott KAC, Jasper HH, Vangelder NM, editors. Basic mechanisms of neural hyperexcitability. Liss; New York: 1983. pp. 31–73. [Google Scholar]
- 17.Egan TM, Henderson G, North RA, Williams JT. Noradrenaline mediated synaptic inhibition in locus coeruleus neurones. J Physiol (Lond) 1983;345:477–488. doi: 10.1113/jphysiol.1983.sp014990. [DOI] [PMC free article] [PubMed] [Google Scholar]
- 18.Gimlich RL, Kumar NM, Gilula NB. Differential regulation of the levels of three gap junction mRNAs in Xenopus embryos. J Cell Biol. 1990;110:597–605. doi: 10.1083/jcb.110.3.597. [DOI] [PMC free article] [PubMed] [Google Scholar]
- 19.Hagiwara S, Morita H. Electrotonic transmission between two nerve cells in leech ganglion. J Neurophysiol. 1962;25:721–727. doi: 10.1152/jn.1962.25.6.721. [DOI] [PubMed] [Google Scholar]
- 20.Ishimatsu M, Williams JT. Synchronous oscillations in membrane potential suggests electrotonic coupling in adult rat locus coeruleus. Soc Neurosci Abstr. 1995;21:634. [Google Scholar]
- 21.Ivanov A, Aston-Jones G. Extranuclear dendrites of locus coeruleus neurons: activation by glutamate and modulation of activity by alpha adrenoceptors. J Neurophysiol. 1995;74:2427–2436. doi: 10.1152/jn.1995.74.6.2427. [DOI] [PubMed] [Google Scholar]
- 22.Llinas RR. Electrotonic transmission in the mammalian central nervous system. In: Bennett MVL, Spray DC, editors. Gap junctions. Cold Spring Harbor Laboratory; Cold Spring Harbor, NY: 1985. pp. 337–353. [Google Scholar]
- 23.Llinas R, Yarom Y. Oscillatory properties of guinea-pig inferior olivary neurones and their pharmacological modulation: an in vitro study. J Physiol (Lond) 1986;376:163–182. doi: 10.1113/jphysiol.1986.sp016147. [DOI] [PMC free article] [PubMed] [Google Scholar]
- 24.Lo Turco JJ, Kriegstein AR. Clusters of coupled neuroblasts in embryonic neocortex. Science. 1991;252:563–566. doi: 10.1126/science.1850552. [DOI] [PubMed] [Google Scholar]
- 25.MacVicar BA, Dudek FE. Electrotonic coupling between pyramidal cells: a direct demonstration in rat hippocampal slices. Science. 1981;213:782–785. doi: 10.1126/science.6266013. [DOI] [PubMed] [Google Scholar]
- 26.Martin W, Zemple G, Hulser D, Willecke K. Growth inhibition of oncogene-transformed rat fibroblasts by cocultured normal cells: relevance of metabolic cooperation mediated by gap junctions. Cancer Res. 1991;51:5348–5351. [PubMed] [Google Scholar]
- 27.O’Donnell P, Grace AA. Dopaminergic modulation of dye coupling between neurons in the core and shell regions of the nucleus accumbens. J Neurosci. 1993;13:3456–3471. doi: 10.1523/JNEUROSCI.13-08-03456.1993. [DOI] [PMC free article] [PubMed] [Google Scholar]
- 28.Paul DL. Molecular cloning of cDNA for rat liver gap junction protein. J Cell Biol. 1986;103:123–134. doi: 10.1083/jcb.103.1.123. [DOI] [PMC free article] [PubMed] [Google Scholar]
- 29.Peinado A, Yuste R, Katz LC. Extensive dye coupling between rat neocortical neurons during the period of circuit formation. Neuron. 1993;10:103–114. doi: 10.1016/0896-6273(93)90246-n. [DOI] [PubMed] [Google Scholar]
- 30.Piccolino M, Neyton J, Witkovsky P, Gerschenfeld HM. Gamma-aminobutyric acid antagonists decrease junctional between L-horizontal cells of the retina. Proc Natl Acad Sci USA. 1982;79:3671–3675. doi: 10.1073/pnas.79.11.3671. [DOI] [PMC free article] [PubMed] [Google Scholar]
- 31.Risek B, Guthrie S, Kumar N, Gilula NB. Modulation of gap junction transcript and protein expression during pregnancy in the rat. J Cell Biol. 1990;110:269–282. doi: 10.1083/jcb.110.2.269. [DOI] [PMC free article] [PubMed] [Google Scholar]
- 32.Shen KZ, North RA. Substance P opens cation channels and closes potassium channels in rat locus coeruleus neurons. Neuroscience. 1992a;50:345–353. doi: 10.1016/0306-4522(92)90428-5. [DOI] [PubMed] [Google Scholar]
- 33.Shen KZ, North RA. Muscarine increases cation conductance and decreases potassium conductance in rat locus coeruleus neurones. J Physiol (Lond) 1992b;455:471–485. doi: 10.1113/jphysiol.1992.sp019312. [DOI] [PMC free article] [PubMed] [Google Scholar]
- 34.Shen KZ, North RA. Excitation of rat locus coeruleus neurons by adenosine 5′-triphosphate: ionic mechanism and receptor characterization. J Neurosci. 1993;13:894–899. doi: 10.1523/JNEUROSCI.13-03-00894.1993. [DOI] [PMC free article] [PubMed] [Google Scholar]
- 35.Shipley MT, Fu L, Ennis M, Liu WL, Aston-Jones G. Dendrites of locus coeruleus neurons extend preferentially into two pericoerulear zones. J Comp Neurol. 1996;365:56–68. doi: 10.1002/(SICI)1096-9861(19960129)365:1<56::AID-CNE5>3.0.CO;2-I. [DOI] [PubMed] [Google Scholar]
- 36.Traub O, Look J, Dermeitzel R, Brummer F, Hulser D, Willecke K. Comparative characterization of the 21 kDa and 26 kDa gap junction in murine liver and cultured hepatocytes. J Cell Biol. 1989;108:1039–1051. doi: 10.1083/jcb.108.3.1039. [DOI] [PMC free article] [PubMed] [Google Scholar]
- 37.Travagli RA, Dunwiddie TV, Williams JT. Opioid inhibition in locus coeruleus. J Neurophysiol. 1995;74:519–528. doi: 10.1152/jn.1995.74.2.519. [DOI] [PubMed] [Google Scholar]
- 38.Travagli RA, Wessendorf M, Williams JT. Dendritic arbor of locus coeruleus neurons contributes to opioid inhibition. J Neurophysiol. 1996;75:2029–2035. doi: 10.1152/jn.1996.75.5.2029. [DOI] [PubMed] [Google Scholar]
- 39.Turin L, Warner AE. Intracellular pH in early Xenopus embryos: its effect on current flow between blastomeres. J Physiol (Lond) 1980;300:489–504. doi: 10.1113/jphysiol.1980.sp013174. [DOI] [PMC free article] [PubMed] [Google Scholar]
- 40.Wang YY, Aghajanian GK. Excitation of locus coeruleus neurons by vasoactive intestinal peptide: role of cAMP and protein kinase A. J Neurosci. 1990;10:3335–3343. doi: 10.1523/JNEUROSCI.10-10-03335.1990. [DOI] [PMC free article] [PubMed] [Google Scholar]
- 41.Williams JT, Marshall KC. Membrane properties and adrenergic responses in locus coeruleus neurons in young rats. J Neurosci. 1987;7:3687–3694. doi: 10.1523/JNEUROSCI.07-11-03687.1987. [DOI] [PMC free article] [PubMed] [Google Scholar]
- 42.Williams JT, North RA, Shefner SA, Nishi S, Egan TM. Membrane properties of rat locus coeruleus neurones. Neuroscience. 1984;13:137–156. doi: 10.1016/0306-4522(84)90265-3. [DOI] [PubMed] [Google Scholar]
- 43.Williams JT, North RA, Tokimasa T. Inward rectification of resting and opioid-activated potassium currents in rat locus coeruleus neurons. J Neurosci. 1988;8:4299–4306. doi: 10.1523/JNEUROSCI.08-11-04299.1988. [DOI] [PMC free article] [PubMed] [Google Scholar]