

Abstract
Sedentary behaviour (SB) has been proposed as an ‘independent’ risk factor for chronic disease risk, attracting much research and media attention. Many countries have included generic, non-quantitative reductions in SB in their public health guidelines and calls for quantitative SB targets are increasing. The aim of this narrative review is to critically evaluate key evidence areas relating to the development of guidance on sitting for adults. We carried out a non-systematic narrative evidence synthesis across seven key areas: (1) definition of SB, (2) independence of sitting from physical activity, (3) use of television viewing as a proxy of sitting, (4) interpretation of SB evidence, (5) evidence on ‘sedentary breaks’, (6) evidence on objectively measured sedentary SB and mortality and (7) dose response of sitting and mortality/cardiovascular disease. Despite research progress, we still know little about the independent detrimental health effects of sitting, and the possibility that sitting is mostly the inverse of physical activity remains. Unresolved issues include an unclear definition, inconsistencies between mechanistic and epidemiological studies, over-reliance on surrogate outcomes, a very weak epidemiological evidence base to support the inclusion of ‘sedentary breaks’ in guidelines, reliance on self-reported sitting measures, and misinterpretation of data whereby methodologically inconsistent associations are claimed to be strong evidence. In conclusion, public health guidance requires a consistent evidence base but this is lacking for SB. The development of quantitative SB guidance, using an underdeveloped evidence base, is premature; any further recommendations for sedentary behaviour require development of the evidence base and refinement of the research paradigms used in the field.
Keywords: sedentary, sitting time, physical activity, epidemiology, public health
Introduction
In the last decade, we have witnessed an exponential growth in research concerned with the study of ‘sedentary behaviour’ (SB) and its potential for detrimental effects on health. The origins of the field of SB as distinct from physical activity (PA) can be traced back to two high-profile publications at the turn of the century1 2 that coined the term ‘non-exercise activity thermogenesis’ (NEAT), a term describing incidental movement and non-structured low-intensity PA such as fidgeting, standing, ambulating and incidental walking of light intensity. The NEAT proposition was that as structured exercise makes up a very small proportion of daily PA energy expenditure, obesity can be tackled by energy expenditure increases through incidental movement, fidgeting and less sitting. Some of the first epidemiological studies in the field examined the associations between TV viewing (as a marker of SB) and cardiometabolic outcomes and appeared at around the same time.3–5 Among the first SB studies to examine different domains of sitting with prospective cardiometabolic outcomes was an analysis of the Nurses’ Health Study data.6 A thoughtful review by Hamilton and colleagues in 20077 gave momentum to SB by proposing a public health context and an animal model-based biological mechanism. A large body of research examining the hypothesised links between sitting (or indicators of it) and health outcomes,8 9 interventions to reduce SB10 and SB correlates11 has been generated since. Essentially, the key message has been that the health detriments of sitting are independent of moderate to vigorous physical activity (MVPA); the latter, MVPA, has been the primary focus of the public health guidelines in the previous three decades.12 13
There were calls to introduce public health guidelines on sitting as early as 2008.14 The response to the accumulated research in this area has been the inclusion of SB-related messages in several national PA guidelines aimed at adults and children, including UK,12 Australia,15 New Zealand,16 Canada,17 Germany,18 Norway19 (see table 1) and in statements of eminent scientific authorities.20 A set of quantitative workplace-specific SB guidelines21 recommended reducing work time sitting by up to 4 hours per day. This guideline, however, was not evidence based and it has been criticised for possible sit–stand desk and related industry interference and undeclared conflicts of interest.22 Calls for developing population-wide quantitative sitting guidance continue apace and are often based on cross-sectional findings. The aim of this review is to evaluate key aspects of the SB evidence relating to cardiometabolic health and mortality and to discuss the timeliness of developing specific guidelines on sitting.
Table 1.
Examples of countries with official sedentary behaviour public health guidelines for adults
| Country, year, issuing body | Sedentary behaviour guideline component 1 | Sedentary behaviour guideline component 2 |
| Australia, 2014, Department of Health15 | Minimise the amount of time spent in prolonged sitting* | Break up long periods of sitting as often as possible* |
| Germany, 2017, German Federal Ministry of Health18 | Adults and older adults should avoid long periods of sitting† | Adults and older adults should break up sitting time by physical activity whenever possible† |
| New Zealand, 2015, New Zealand Ministry of Health16 | Sit less‡ | Break up long periods of sitting‡ |
| Norway, 2014, Norwegian Directorate of Health19 | Sedentary time should be reduced* | Long periods of sedentary behaviour should be interrupted with activity breaks* |
| UK, 2011, Department of Health/The Four Home Countries’ Chief Medical Officers12 | All adults should minimise the amount of time spent being sedentary (sitting) for extended periods.§ | Taking regular breaks at work; breaking up sedentary time such as swapping a long bus or car journey for walking part of the way§ |
*The two components appear in the same sentence/as one recommendation.
†The two components appear as separate recommendations.
‡The two components appear as one recommendation but in different sentences.
§In the UK guidelines, sedentary breaks appear as an example of how to minimise sedentary behaviour. In the full guidelines document explanatory notes. it is stated that ‘based on the current evidence, reducing total sedentary time and breaking up extended periods of sitting is strongly recommended’.
Definition of SB: is it not all about sitting?
The ubiquitous behaviour that is considered a health threat is sitting. There are two modern definitions of SB. The first of these definitions is purely physiological and is synonymous with the lower end of the energy expenditure continuum <1.5 metabolic equivalents (METs)23 which, strictly speaking, also includes standing quietly (1.2 MET).24 The second definition has physiological (<1.5 METs) as well as postural (in a sitting or reclining posture) and contextual (waking times) components.25 26 As previously noted,27 the tabled MET values for some common types of sitting range from 1 to 2 MET28 and therefore do not strictly conform with either of these definitions. For example, sitting while fidgeting and sitting in the classroom are both assigned 1.8 MET; driving a car is assigned 2.5 MET. Yet, the health impact of both time spent driving29 and classroom time30 is examined as SB. This lack of consistency on the definition of SB is of concern as it makes the relevant evidence prone to misinterpretations, as shown in figure 1 and discussed in the subsequent sections. Recent efforts to further refine the definition of SB26 by introducing terms such as ‘stationary behaviour’ (lack of ambulatory movement in any posture), for example, may help resolve some of the issues described in the following sections.
Figure 1.

Extrapolation of non-sitting-specific ‘sedentary behaviour’ research findings into messages on the health risks of sitting.
Is sitting an ‘independent’ risk factor?
Perhaps the most powerful driving force for the SB field is the idea that the harms caused by too much sitting cannot be countered by doing sufficient PA, an idea that has been promulgated by both mass media and segments of the research community. For example, a recent media analysis study31 found that almost 40% of SB-related stories in Australian newspapers stated that PA is irrelevant if a person sits for too long or that the benefits of PA are abolished by too much sitting. Despite the lack of any compelling evidence to support it, this idea was disseminated from the early days of SB research and is a view that is still in circulation.20 32
From the epidemiological evidence, it is becoming clear that the associations of sitting time with all-cause mortality (ACM) or cardiovascular disease (CVD) mortality are often seen to be dependent on MVPA levels.33–36 A recent large study involved a pooled individual participant meta-analysis of self-reported sitting studies published as part of the 2016 Lancet Series on Physical Activity (n=1 005 791 for ACM; n=849 108 for CVD mortality analyses).37 Self-reported sitting time was categorised as <4, 4, <6, 6–8, >8 hours/day and the quartiles of PA had medians corresponding to roughly ≤5, 25–35, 50–65 and ≥60–75 minutes/day of moderate intensity activity. Compared with those in the lowest sitting and highest PA group, a dose–response association between sitting time and CVD death was noted in least physically active group with HR increasing from 1.34 (95% CI 1.24 to 1.43) in the bottom to 1.74 (95% CI 1.60 to 1.90) in the top sitting groups. Associations with CVD mortality in the second and third PA quartiles were less dose dependent, less stable and of lower magnitude. There was no evidence for an association between sitting time and CVD mortality risk in the top PA quartile and results for cancer and ACM pointed in the same direction.37 These data do not support the almost concurrently published 2016 Science Advisory from the American Heart Association20 that concluded ‘it is likely that SB influences risk in part through some distinct mechanisms that act independent of MVPA’.
More examples of the perpetuation of the idea of ‘independence from MVPA’ include a recent dose–response meta-analysis that also concluded that sitting was associated with greater risk for several major long-term outcomes ‘independent of PA’.32 Such a conclusion indicates the need for a tighter definition of ‘independent associations’. Studies included in this review32 assessed independence by merely treating MVPA as a potential confounder. Although this approach cannot be discarded,27 32 it is insufficient for understanding independent health effects of sitting on its own as it ignores the evidence of effect modification.33–37 Figure 2 shows a conceptual diagram of how the associations of SB with long-term health outcomes may be dependent on PA.
Figure 2.
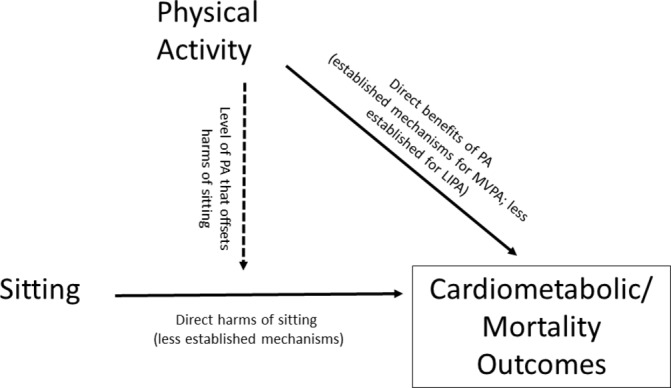
Conceptualisation of the associations between sitting and cardiometabolic/mortality outcomes with physical activity as an effect modifier. LIPA, light intensity physical activity; MVPA, moderate to vigorous physical activity; PA, physical activity.
Other grounds to challenge the idea of ‘independent associations’ is the absence of a convincing biological mechanism through which too much sitting harms health irrespective of PA levels. The first and perhaps still most popular proposed mechanism was an animal model,7 which suggested that prolonged sitting impairs lipoprotein lipase activity and this could be prevented by changing posture to standing, with no further benefit from exercise. But this framework was originally published 15 years ago38 and despite not having been confirmed in humans in it is still cited as a plausible mechanism.32 More recently, prolonged sitting has been implicated in endothelial cell dysfunction caused by reduction in leg blood flow-induced shear stress.39 This is a coherent mechanistic framework but it does not support independent effects of sitting as it acknowledges that endothelial dysfunction is prevented if sitting is preceded by an exercise bout.39 Several other attempts40 41 to identify and develop models for independent mechanisms of the effects of SB on cardiovascular outcomes are also not well developed; thus, the likelihood that SB is mostly the inverse of too little PA is still plausible.
From the public health point of view, the independent association of SB with long-term outcomes, if any, can be used to calculate the theoretical amounts of sitting reductions required to achieve population-wide risk reduction equivalent to meeting the basic MVPA guideline (20%–33% reduction in ACM and CVD mortality risk42 and 13% reduction in type 2 diabetes mellitus (T2DM) risk43). Even if independence from PA is assumed, the reported per-hour 4% increase in ACM and CVD mortality risk among high sitters32 and the linear 1% increase in T2DM risk32 suggest that the sitting reductions required to achieve MVPA guideline equivalent risk reduction is in the order of 5–13 hours/day. Considering that the average daily reductions achieved by recreational and workplace SB interventions is substantially lower (0.5 hours44 and 1.2 hours45), both the clinical and public health impact of the above meta-analytical estimates32 are likely extraneous.
Evidence on TV time as a marker of SB: health risks of sitting or a cluster of confounding?
Much of the early4 5 46 and current47 SB research was concerned with the study of television viewing (TV).48 49 At face value, such a focus is justified because screen media is a major discretionary component of total SB, with national studies showing that as of 2012 adults in, for example, England spent 2.8–3.1 hours/day watching TV.50 However, the literature on TV viewing and health tell us little about sitting. First, studies in adults have established that TV time is poorly correlated to sitting time. The largest (n=5738) such study to date examined the correlation of the National Health and Nutrition Examination Survey (NHANES) TV time questions51 with waist accelerometry-estimated SB but found weak (rho=0.14) or no (rho=0.03) correlations for adults in part-time or full-time employment, respectively. Similar findings have been reported in other large studies that used waist-worn51 52 or thigh-worn accelerometers,53 with coefficients ranging from 0.05 to 0.17.
Besides not reflecting sitting time, TV time is confounded by factors that are strong determinants of poor health outcomes but are not always accounted for, such as dietary intake and TV time snacking,54 socioeconomic status (SES)55 56 and mental health.57 The role of socioeconomic confounding is particularly important. Although higher SES has been linked to higher total sedentary time and occupational sitting time,55 high TV time has been invariably linked to low SES.56 The more aspects of SES are considered (eg, education, occupational class, income), the steeper the socioeconomic gradient of TV time becomes.56 Aspects of TV behaviour, such as programme content or the exposure to negative messages that may act as chronic psychological cardiovascular stressors58 have hardly been acknowledged in the SB literature and are universal residual confounders. Besides, TV evidence becomes less relevant as the recreational screen media landscape is rapidly changing with TV viewing gradually being replaced by small screens such as smartphones and tablets. With all this and other supporting evidence59 in mind, it is unlikely that TV viewing evidence reflects health harms of sitting. The inclusion of such evidence to draw public health guidance on sitting has therefore been problematic.
Interpretation of ‘SB’ studies: ‘Chinese whispers’?
Among studies that reported associations of multiple markers of SB with longitudinal outcomes, TV time invariably shows the most consistent associations.60 61 While this may partly reflect that TV can be recalled more accurately, the literature cited in the previous section indicate that there is little support for the idea that health risks associated with TV viewing9 62 63 can be attributed to sitting. There are several evidence interpretation implications that follow. First, the approach taken by some otherwise high-quality reviews that meta-analyse TV studies together with total sitting studies9 62 is questionable. Such practices unavoidably lead to misleading interpretations about sitting. For example, a meta-analysis of 10 cross-sectional and prospective studies concluded that among all health outcomes, the strongest associations were observed for T2DM, where the highest category of SB time was linked to 112% higher risk for T2DM (95% CI 61% to 178%) compared with the lowest category.62 Another review of prospective studies,9 meta-analysed five of the above studies and also concluded that among all outcomes, the largest effect sizes were again observed for risk for T2DM (>90% increase in risk, 64%–122%). Based on these findings,9 62 diabetes is frequently highlighted as the outcome most closely linked with SB.63 All but one of the original studies in these meta-analyses used TV time as the exposure.3 6 64 65 There are further methodological issues that make such evidence less convincing. For example, the individual studies effect sizes entered in the meta-analysis were often derived using extreme comparisons, for example, ≥7 hour/day versus <1 hour/day66 or ≥40 hour/week versus <1 hour/week.3 PA was not always taken into account62 and estimates were not adjusted for body mass index on the grounds of adiposity being on the causal pathway between SB and the T2DM.62 But this is only an assumption as little evidence supports the notion that sedentary behaviour is associated with subsequent obesity.67 To the contrary, a number of prospective studies68–70 suggest that adiposity determines future SB (and hence adiposity precedes SB on the causal pathway).
More recent prospective studies on total sitting time and incident T2DM found no association,71 72 or associations limited to inactive36 73 or obese36 participants only. This newer evidence suggests that the conclusions of the above reviews9 62 may be potentially misleading if they are interpreted in the context of sitting. The extrapolation of TV time exposure literature findings to draw conclusions on the health risks of ‘sedentary behaviour’ and further translation of this evidence into messages on the health risks of sitting is, unfortunately, common in SB research (figure 1). This inaccurate information transmitted across sequential communications is of concern because evidence from such studies represents a sizeable part of the overall evidence base that has supported the inclusion of SB in public health guidance around the world.12 15 16
How evidence based are the recommendations for breaking sedentary time?
One widely discussed concept in SB is that of ‘sedentary breaks’, referring to interruptions of prolonged sitting. Different variations of such interruptions are included in the guidance of several countries12 15 16 18 19 and in the case of the New Zealand guidelines,16 ‘sit less, breaking sedentary time’ appears before the PA recommendation. Sedentary breaks have been proposed to confer cardiovascular and metabolic benefits even when total sitting time is held constant74 but the evidence supporting their health effects is often inconsistent and limited to small-scale trials in selected samples. Even cross-sectional studies present an unclear picture, including the largest published cross-sectional study of thigh-worn inclinometers that found little evidence for associations of sitting with glucose metabolism among 2497 adults.75 In the study that first introduced the concept, the number of SB breaks of 170 adults was inversely associated with triglycerides and to a lesser extent with adiposity surrogate markers and 2 hour plasma glucose, while there were no associations with blood pressure and high-density lipoprotein (HDL) cholesterol.74 A subsequent larger cross-sectional study among 4757 NHANES participants76 found inverse associations of breaks with waist circumference, C-reactive protein, HDL cholesterol (women only), but no associations with the remaining five examined cardiometabolic risk factors. In cross-sectional studies, the most consistently associated outcomes with sedentary breaks are adiposity related,77 but these may be prone to reverse causation, that is, obese people sit continuously for longer periods of time. Despite this mixed and rather weak evidence, such cross-sectional studies74 76 have been broadly cited as support for the links between sedentary breaks and cardiometabolic health.
To date, very few large-scale prospective studies assessed the links between sedentary breaks and cardiometabolic outcomes and, to our knowledge, none of them fully supports links between frequency of interrupting sitting posture and prospective outcomes. For example, baseline sedentary breaks did not predict any of five cardiometabolic variables at 6-month follow-up in a study of 582 patients with T2DM78 and were not associated with ACM over 5 years of follow-up in a recent study of 1655 older British men.79 To our knowledge, there is only one prospective epidemiological study that provides some support to the sedentary breaks hypothesis, the REasons for Geographic And Racial Differences in Stroke (REGARDS) study of 7985 US adults where longer SB bouts (directly related to infrequent sedentary breaks) were associated with increased ACM risk over 4 years.80 However, this, like both other prospective studies above,78 79 used waist-worn accelerometers and their findings may also reflect interruptions of standing with ambulatory movement (highlighting the benefits of frequent PA), rather than interruptions of sitting with bouts of standing or light ambulation (which is what the sedentary breaks hypothesis postulates). Despite the scarce prospective epidemiological evidence, it is encouraging that some national guidelines18 19 specifically recommend interrupting sitting with physical activity (table 1).
Beyond these uncertainties and the limited support epidemiological evidence offers to the sedentary breaks hypothesis, several laboratory-based trials have consistently shown beneficial effects of interrupting continuous sitting with light PA on postprandial glucose metabolism.77 81–84 Such studies have demonstrated effects of frequent interruptions of continued sitting (eg, 2–3 min of light intensity activity every 20–30 min over several hours) on postprandial glucose and insulin, and to a lesser extent on classical cardiovascular biomarkers such as triglycerides and cholesterol.77 While such studies provide important mechanistic insights, there are several issues that complicate their translation into sitting-specific population guidance. First, it is unclear if the cardiometabolic benefits of sedentary breaks are due to (1) higher energy expended during the light intensity activity bouts, (2) the muscular contraction occurring during the transition from sitting to standing (and vice versa) or (3) by the change in posture (which is what the sedentary breaks hypothesis mostly postulates). The finding that standing breaks appear to have an effect among metabolically compromised (eg, dysglycaemic or patients with T2DM85 but not healthy adults support interpretation (1) or (2): even subtle muscular contraction during the sitting to standing transition generates measurable improvements among those with impaired (elevated) levels of metabolic markers. Second, there is currently no indication that such acute and relatively subtle beneficial responses to interrupting sitting translate into improved long term outcomes. This is an important aspect of the interpretation of these small laboratory-based studies given that the link between surrogate T2DM outcomes and long term cardiovascular implications is not always clear.86 87 For example, evidence from pharmacological trials suggests that even intensive glycaemic control often does not translate into better CVD mortality and morbidity outcomes.86 88 In the absence of any degree of congruence between mechanistic and prospective evidence, the use of such laboratory-based evidence to develop conclusive public health guidance is inappropriate. The inclusion of sedentary breaks in the evidence-based guidance in at least three countries15 16 18 in the last 5 years, based on such limited evidence, calls for a reassessment of the evidence standards in the field. Such assertions are congruent with the most authoritative evidence review to date, the 2018 Physical Activity Guidelines Advisory Committee Scientific Report, which flagged the insufficient evidence in sedentary breaks across all examined health outcomes.89
Studies of objectively measured SB and mortality: can they support sitting guidelines?
A number of predominately US-based studies have examined the association of objectively assessed SB and mortality. Most of these studies used the NHANES data set.60 90 91 Replacing 1 hour of sedentary time with equivalent amounts of light intensity activity was associated with a 55% decrease in ACM risk. Schmid et al used both isotemporal substitution and non-substitution methodology and also reported large effect sizes in 3702 NHANES participants, equivalent to 24%–28% reduction in ACM risk for each hour/day of sedentary time replaced with light intensity activity.92 In the same study,92 however, the non-isotemporal analyses found that SB was unrelated to the risk for CVD death regardless of whether other PA was taken into account or not and that SB was associated with ACM only among physically inactive individuals.92 Evenson et al 60 analysed the association of accelerometry-measured SB, LPA, MPA and MVPA with ACM and CVD mortality in 3809 NHANES participants.92 Once other PA was taken into account neither SB nor light intensity activity were associated with ACM or CVD mortality,60 and these observations were in agreement with a recent, large accelerometry mortality study from the Women’s Health Study cohort.93 By contrast, the REGARDS study found that total SB time was associated with higher ACM risk in 7985 US adults.80 However, it is unclear if these associations were independent of PA as in the stratum of the 1750 participants that met the MPVA guidelines there were only 29 events across four SB groups and estimates were unstable (trend p=0.090).80
The above body of evidence offers little support for guidelines on sitting. First, results from mortality studies are relatively mixed, even when analysed within the same NHANES data set.60 90 91 Most importantly, no published study with mortality or incident disease endpoints, to our knowledge, examined sitting (as a posture). All studies summarised above used waist-worn accelerometers that do not completely distinguish between standing and sitting; their output that is commonly labelled ‘sedentary behaviour’ is actually lack of ambulatory movement (acceleration). Even if such studies that generally supported a deleterious association between SB and mortality were to be considered in isolation, the public health message they would clearly support is ‘move more (at any intensity)/do not stay still’, not ‘sit less’. Such confusion could be resolved in the future if the recently introduced term ‘stationary behaviour’26 is used in a standardised manner and interpreted in terms of benefits of ambulatory movement, not the harms of sitting.
Are we close to understanding the threshold of daily sitting that is harmful?
It is well established that the association of daily sitting time and most long-term outcomes is not linear. Dose–response evidence on mostly self-reported sitting time in adults suggests that CVD risk is elevated at approximately 632–1094 hours/day, while the corresponding threshold for ACM appears to be approximately 8 hours/day.32 95 But how confident can one be that the above self-reported daily thresholds are close to the true population values of sitting? Comparative international studies consistently report median self-reported durations in the region of 5 hours/day.96 97 On the other hand, national surveillance studies that used waist-worn accelerometers61 98 and smaller studies that used inclinometers53 75 reported estimates in the region of 8–9.5 hours/day of SB and sitting, respectively. Taken together, it appears that self-reports may underestimate sedentary time by a relative large margin when compared with objective methods. Although it is difficult to estimate the exact degree of measurement error from self-reported sitting time, the above data suggest this could be as high as a 40%–60%. This may have implications for the thresholds identified in the above meta-analyses.32 95 Theoretically, if assuming a similar proportion of reporting errors from previous epidemiological studies, the daily thresholds94 95 for an association between self-reported sitting and health outcomes at the population level may be as high as 11–13 (ACM) and 14–16 hours/day (CVD). Although the above extrapolations are too crude to form the basis of guidelines, such high amounts of daily sitting may reflect underlying poor health more than a sedentary lifestyle. In the absence of long-term prospective epidemiological evidence from studies that used objective measures of actual sitting (as opposed to absence of ambulatory movement), any quantitative daily sitting guideline may be misleading.
Timeliness of developing quantitative sitting guidance: an evidence base at the crossroads
In its current state, the SB evidence base is insufficiently developed to inform quantitative public health guidance. Some of this uncertainty is due to misleading media reporting and researcher enthusiasm, which portrayed SB evidence as nearly conclusive. The limitations of sitting measurement outlined above is another major issue. While waist worn accelerometers were undoubtedly a major step forward and are useful for understanding the health risks associated with the lack of ambulatory movement, they tell us little about the health risks of actual sitting. Questionnaires are useful and feasible for large-scale observational research and surveillance but they may be prone to systematic reporting bias. Quantitative data from these instruments should be interpreted cautiously and it seems premature to develop quantitative sitting guidelines based on self-reported data only, considering the major advances in the application of objective measures of sitting in ongoing epidemiological studies. Technology that uses thigh-worn sensors or combinations of placements (eg, thigh and hip or back) are more promising for quantifying actual sitting time. To our knowledge, there is no published prospective SB study using such methods. Although the use of such tools in large population studies has been relatively limited in the past, for the first time it seems feasible. Examples include the Maastricht Study76 and the 1970 British Birth Cohort99 that are currently using thigh-worn sensors in estimated samples of appoximately 8000 and 6000–6500 adults, respectively; and the HUNT cohort in Norway100 which is currently using two sensors (thigh-worn and lower back) in an estimated sample of 40 000–50 000 adults. These and several other studies that use similar methods can be linked to mortality and incident morbidity records. Thus, it is likely that these studies, in the near future (perhaps within 5–6 years), will produce evidence on the prospective associations of actual sitting time, sedentary breaks and accumulation patterns with mortality and incident morbidity. Further, emergent analytical approaches that may overcome issues such as collinearity and better handle multibehaviour 24 hours data (eg, compositional data analysis101 and isotemporal substitution102) are increasingly used. These statistical approaches have some clear advantages in that they acknowledge the interdependence of times spent in different components of the 24 hours continuum (sitting, standing, light activity, moderate to vigorous activity and sleep). But when it comes to generating evidence that will inform public health guidance they also have their own challenges, such as is the lack of clarity on how to translate ‘budgets’ consisting three or four components of the 24 PA continuum into simple public health messages. Despite these uncertainties (that will hopefully be resolved as the field evolves), the collective capacity of all these developments, including recent advances in activity pattern recognition,103 may change what we know about the health effects of bodily movement (or lack of it) within the next half decade. Developing credible prospective epidemiological evidence on the independent long-term health effects of sitting with long-term health outcomes is one of the most important links in the public health evidence guidance chain. This link is currently missing.
Conclusion
Calls to introduce specific guidelines on SB were initiated when the state of the evidence was, at best, preliminary and they continue to appear with increased frequency. A glimpse of a ‘breakthrough’ in science often generates overt enthusiasm, especially when amplified by sensationalised headlines in the popular media.31 Because the evidence base is incomplete, rushing to develop quantitative guidelines on sitting is potentially harmful for public health since once established, they are difficult to modify without confusing both health professionals and the public alike. Public health messages about encouraging movement of any intensity may be simpler, easier to communicate to the public and are supported by a continuously expanding literature.79 89 104
Refinement of the research paradigms used in the sedentary behaviour field is the first step towards advancing our understanding of the independent health effects of too much sitting.
Key messages.
The study of sedentary behaviour (usually, but not always, synonymous to ‘sitting too much’) as a health risk has received considerable research attention.
Non-quantitative public sitting guidelines have been included in public health guidance in several countries and usually consist of messages to sit less and break prolonged sitting times.
We still know relatively little about the independent detrimental health effects of sitting, and there are many inconsistencies in how the evidence based was developed and interpreted.
Key issues include an unclear definition, inconsistency between mechanistic and epidemiological evidence, over-reliance on surrogate outcomes and weak epidemiological evidence to even support the existing non-quantitative ‘sedentary breaks’ component of guidelines.
The sedentary behaviour evidence base is underdeveloped and inconsistent; it cannot support quantitative guidance.
Prioritising a message such as ‘move more at any intensity’ while further research gives and robust and consistent answers about sedentary behaviour may be the most prudent course of action.
Footnotes
Contributors: All authors have contributed substantially to the preparation of this manuscript. ES conceived the original idea, carried out the initial literature searches and drafted the first version of the manuscript. UE, DD, MH, AEB and I-ML contributed to the idea, redrafted parts of the manuscript and contributed to further literature searches. All authors revised the manuscript critically several times and contributed intellectually its contents. ES takes responsibility for the integrity and accuracy of the information contained in the article.
Funding: This work was not financially supported directly by any individual, agency or institution. ES is funded by the National Health and Medical Research Council (Australia) through a Senior Research Fellowship and partly supported by a University of Sydney SOAR Fellowship. DD is supported by a Future Leader Fellowship from the National Heart Foundation (Australia); and partly supported by a University of Sydney SOAR Fellowship.
Competing interests: None declared.
Patient consent: Not required.
Provenance and peer review: Not commissioned; externally peer reviewed.
Data sharing statement: No original data are presented in this paper
References
- 1. Levine JA, Eberhardt NL, Jensen MD. Role of nonexercise activity thermogenesis in resistance to fat gain in humans. Science 1999;283:212–4. 10.1126/science.283.5399.212 [DOI] [PubMed] [Google Scholar]
- 2. Levine JA, Lanningham-Foster LM, McCrady SK, et al. Interindividual variation in posture allocation: possible role in human obesity. Science 2005;307:584–6. 10.1126/science.1106561 [DOI] [PubMed] [Google Scholar]
- 3. Hu FB, Leitzmann MF, Stampfer MJ, et al. Physical activity and television watching in relation to risk for type 2 diabetes mellitus in men. Arch Intern Med 2001;161:1542–8. [DOI] [PubMed] [Google Scholar]
- 4. Salmon J, Bauman A, Crawford D, et al. The association between television viewing and overweight among Australian adults participating in varying levels of leisure-time physical activity. Int J Obes Relat Metab Disord 2000;24:600–6. 10.1038/sj.ijo.0801203 [DOI] [PubMed] [Google Scholar]
- 5. Martínez-González MA, Martínez JA, Hu FB, et al. Physical inactivity, sedentary lifestyle and obesity in the European Union. Int J Obes Relat Metab Disord 1999;23:1192–201. [DOI] [PubMed] [Google Scholar]
- 6. Hu FB, Li TY, Colditz GA, et al. Television watching and other sedentary behaviors in relation to risk of obesity and type 2 diabetes mellitus in women. JAMA 2003;289:1785–91. 10.1001/jama.289.14.1785 [DOI] [PubMed] [Google Scholar]
- 7. Hamilton MT, Hamilton DG, Zderic TW. Role of low energy expenditure and sitting in obesity, metabolic syndrome, type 2 diabetes, and cardiovascular disease. Diabetes 2007;56:2655–67. 10.2337/db07-0882 [DOI] [PubMed] [Google Scholar]
- 8. Mahmood S, MacInnis RJ, English DR, et al. Domain-specific physical activity and sedentary behaviour in relation to colon and rectal cancer risk: a systematic review and meta-analysis. Int J Epidemiol 2017;46:1797–813. 10.1093/ije/dyx137 [DOI] [PubMed] [Google Scholar]
- 9. Biswas A, Oh PI, Faulkner GE, et al. Sedentary time and its association with risk for disease incidence, mortality, and hospitalization in adults: a systematic review and meta-analysis. Ann Intern Med 2015;162:123–32. 10.7326/M14-1651 [DOI] [PubMed] [Google Scholar]
- 10. Martin A, Fitzsimons C, Jepson R, et al. Interventions with potential to reduce sedentary time in adults: systematic review and meta-analysis. Br J Sports Med 2015;49:1056–63. 10.1136/bjsports-2014-094524 [DOI] [PubMed] [Google Scholar]
- 11. Stierlin AS, De Lepeleere S, Cardon G, et al. A systematic review of determinants of sedentary behaviour in youth: a DEDIPAC-study. Int J Behav Nutr Phys Act 2015;12:133 10.1186/s12966-015-0291-4 [DOI] [PMC free article] [PubMed] [Google Scholar]
- 12. Department of Health. Start active, stay active: a report on physical activity for health from the four home countries’ chief medical officers London: England, 2011. [Google Scholar]
- 13. US_Department_of_Health_and_Human_Services. Physical activity and health: a report of the surgeon general. Atlanta, GA: US Department of Health and Human Services, Centers for Disease Control and Prevention, National Center for Chronic Disease Prevention and Health Promotion, 1996. [Google Scholar]
- 14. Hamilton MT, Healy GN, Dunstan DW, et al. Too little exercise and too much sitting: inactivity physiology and the need for new recommendations on sedentary behavior. Curr Cardiovasc Risk Rep 2008;2:292–8. 10.1007/s12170-008-0054-8 [DOI] [PMC free article] [PubMed] [Google Scholar]
- 15. Department of Health. Australia’s physical activity and sedentary behaviour guidelines for adults (18–64 years). Canberra, Australia: Australian Government, Department of Health, 2014. [Google Scholar]
- 16. New Zealand Ministry of Health. Eating and activity guidelines for New Zealand adults. Wellington, 2015. [Google Scholar]
- 17. Tremblay MS, Carson V, Chaput JP, et al. Canadian 24-hour movement guidelines for children and youth: an integration of physical activity, sedentary behaviour, and sleep. Appl Physiol Nutr Metab 2016;41(6 Suppl 3):S311–S327. 10.1139/apnm-2016-0151 [DOI] [PubMed] [Google Scholar]
- 18. Fuzeki E, Vogt L, Banzer W. [German national physical activity recommendations for adults and older adults: methods, database and rationale]. Gesundheitswesen (Bundesverband der Arzte des Offentlichen Gesundheitsdienstes 2017;79(S 01):S20–s28. [DOI] [PubMed] [Google Scholar]
- 19. Health NDo. National recommendations: physical activity and sedentary sitting. 2014. https://helsedirektoratet.no/folkehelse/fysisk-aktivitet
- 20. Young DR, Hivert MF, Alhassan S, et al. Sedentary behavior and cardiovascular morbidity and mortality: a science advisory from the american heart association. Circulation 2016;134:e262–79. 10.1161/CIR.0000000000000440 [DOI] [PubMed] [Google Scholar]
- 21. Buckley JP, Hedge A, Yates T, et al. The sedentary office: a growing case for change towards better health and productivity. Expert statement commissioned by public health England and the active working community interest company. Br J Sports Med 2015. [DOI] [PubMed] [Google Scholar]
- 22. Chau JY, McGill B, Freeman B, et al. Overselling sit-stand desks: news coverage of workplace sitting guidelines. Health Commun 2017:1–7. 10.1080/10410236.2017.1359034 [DOI] [PubMed] [Google Scholar]
- 23. Pate RR, O’Neill JR, Lobelo F. The evolving definition of "sedentary". Exerc Sport Sci Rev 2008;36:173–8. 10.1097/JES.0b013e3181877d1a [DOI] [PubMed] [Google Scholar]
- 24. Ainsworth BE, Haskell WL, Whitt MC, et al. Compendium of physical activities: an update of activity codes and MET intensities. Med Sci Sports Exerc 2000;32(9 Suppl):S498–516. 10.1097/00005768-200009001-00009 [DOI] [PubMed] [Google Scholar]
- 25. Network SBR. Standardized use of the terms “sedentary” and “sedentary behaviours”. Appl Physiol Nutr Metab 2012;37:540–2. [DOI] [PubMed] [Google Scholar]
- 26. Tremblay MS, Aubert S, Barnes JD, et al. Sedentary Behavior Research Network (SBRN) – terminology consensus project process and outcome. Int J Behav Nutr Phys Act 2017;14:75 10.1186/s12966-017-0525-8 [DOI] [PMC free article] [PubMed] [Google Scholar]
- 27. Ford ES, Caspersen CJ. Sedentary behaviour and cardiovascular disease: a review of prospective studies. Int J Epidemiol 2012;41:1338–53. 10.1093/ije/dys078 [DOI] [PMC free article] [PubMed] [Google Scholar]
- 28. Ainsworth BE, Haskell WL, Herrmann SD, et al. 2011 Compendium of physical activities: a second update of codes and MET values. Med Sci Sports Exerc 2011;43:1575–81. 10.1249/MSS.0b013e31821ece12 [DOI] [PubMed] [Google Scholar]
- 29. Bakrania K, Edwardson CL, Khunti K, et al. Associations between sedentary behaviors and cognitive function: Cross-sectional and prospective findings from the UK biobank. Am J Epidemiol 2018;187:441–54. 10.1093/aje/kwx273 [DOI] [PubMed] [Google Scholar]
- 30. Sherry AP, Pearson N, Clemes SA. The effects of standing desks within the school classroom: a systematic review. Prev Med Rep 2016;3(Supplement C):338–47. 10.1016/j.pmedr.2016.03.016 [DOI] [PMC free article] [PubMed] [Google Scholar]
- 31. Chau JY, Bonfiglioli C, Zhong A, et al. Sitting ducks face chronic disease: an analysis of newspaper coverage of sedentary behaviour as a health issue in Australia 2000-2012. Health Promot J Austr 2017;28:139–43. 10.1071/HE16054 [DOI] [PubMed] [Google Scholar]
- 32. Patterson R, McNamara E, Tainio M, et al. Sedentary behaviour and risk of all-cause, cardiovascular and cancer mortality, and incident type 2 diabetes: a systematic review and dose response meta-analysis. Eur J Epidemiol 2018;26 10.1007/s10654-018-0380-1 [DOI] [PMC free article] [PubMed] [Google Scholar]
- 33. Chomistek AK, Manson JE, Stefanick ML, et al. Relationship of sedentary behavior and physical activity to incident cardiovascular disease: results from the Women’s Health Initiative. J Am Coll Cardiol 2013;61:2346–54. 10.1016/j.jacc.2013.03.031 [DOI] [PMC free article] [PubMed] [Google Scholar]
- 34. Herber-Gast G-CM, Jackson CA, Mishra GD, et al. Self-reported sitting time is not associated with incidence of cardiovascular disease in a population-based cohort of mid-aged women. Int J Behav Nutr Phys Act 2013;10:55 10.1186/1479-5868-10-55 [DOI] [PMC free article] [PubMed] [Google Scholar]
- 35. Bjørk Petersen C, Bauman A, Grønbæk M, et al. Total sitting time and risk of myocardial infarction, coronary heart disease and all-cause mortality in a prospective cohort of Danish adults. Int J Behav Nutr Phys Act 2014;11:13 10.1186/1479-5868-11-13 [DOI] [PMC free article] [PubMed] [Google Scholar]
- 36. Petersen CB, Bauman A, Tolstrup JS. Total sitting time and the risk of incident diabetes in Danish adults (the DANHES cohort) over 5 years: a prospective study. Br J Sports Med 2016;50:1382–7. 10.1136/bjsports-2015-095648 [DOI] [PubMed] [Google Scholar]
- 37. Ekelund U, Steene-Johannessen J, Brown WJ, et al. Does physical activity attenuate, or even eliminate, the detrimental association of sitting time with mortality? A harmonised meta-analysis of data from more than 1 million men and women. Lancet 2016;388:1302–10. 10.1016/S0140-6736(16)30370-1 [DOI] [PubMed] [Google Scholar]
- 38. Bey L, Hamilton MT. Suppression of skeletal muscle lipoprotein lipase activity during physical inactivity: a molecular reason to maintain daily low-intensity activity. J Physiol 2003;551:673–82. 10.1113/jphysiol.2003.045591 [DOI] [PMC free article] [PubMed] [Google Scholar]
- 39. Padilla J, Fadel PJ. Prolonged sitting leg vasculopathy: contributing factors and clinical implications. Am J Physiol Heart Circ Physiol 2017;313:H722–8. 10.1152/ajpheart.00326.2017 [DOI] [PMC free article] [PubMed] [Google Scholar]
- 40. Thyfault JP, Du M, Kraus WE, et al. Physiology of sedentary behavior and its relationship to health outcomes. Med Sci Sports Exerc 2015;47:1301–5. 10.1249/MSS.0000000000000518 [DOI] [PMC free article] [PubMed] [Google Scholar]
- 41. Carter S, Hartman Y, Holder S, et al. Sedentary behavior and cardiovascular disease risk: mediating mechanisms. Exerc Sport Sci Rev 2017;45:80–6. 10.1249/JES.0000000000000106 [DOI] [PubMed] [Google Scholar]
- 42. Arem H, Moore SC, Patel A, et al. Leisure time physical activity and mortality: a detailed pooled analysis of the dose-response relationship. JAMA Intern Med 2015;175:959–67. 10.1001/jamainternmed.2015.0533 [DOI] [PMC free article] [PubMed] [Google Scholar]
- 43. Aune D, Norat T, Leitzmann M, et al. Physical activity and the risk of type 2 diabetes: a systematic review and dose–response meta-analysis. Eur J Epidemiol 2015;30:529–42. 10.1007/s10654-015-0056-z [DOI] [PubMed] [Google Scholar]
- 44. Shrestha N, Grgic J, Wiesner G, et al. Effectiveness of interventions for reducing non-occupational sedentary behaviour in adults and older adults: a systematic review and meta-analysis. Br J Sports Med 2018:bjsports-2017-098270 10.1136/bjsports-2017-098270 [DOI] [PubMed] [Google Scholar]
- 45. Neuhaus M, Eakin EG, Straker L, et al. Reducing occupational sedentary time: a systematic review and meta-analysis of evidence on activity-permissive workstations. Obesity Reviews 2014;15:822–38. 10.1111/obr.12201 [DOI] [PubMed] [Google Scholar]
- 46. Jakes RW, Day NE, Khaw K-T, et al. Television viewing and low participation in vigorous recreation are independently associated with obesity and markers of cardiovascular disease risk: EPIC-Norfolk population-based study. Eur J Clin Nutr 2003;57:1089–96. 10.1038/sj.ejcn.1601648 [DOI] [PubMed] [Google Scholar]
- 47. Grace MS, Dillon F, Barr ELM, et al. Television viewing time and inflammatory-related mortality. Med Sci Sports Exerc 2017;49:2040–7. 10.1249/MSS.0000000000001317 [DOI] [PubMed] [Google Scholar]
- 48. Dunstan DW, Barr EL, Healy GN, et al. Television viewing time and mortality: the Australian Diabetes, Obesity and Lifestyle Study (AusDiab). Circulation 2010;121:384–91. 10.1161/CIRCULATIONAHA.109.894824 [DOI] [PubMed] [Google Scholar]
- 49. Stamatakis E, Hamer M, Dunstan DW, et al. Screen-based entertainment time, all-cause mortality, and cardiovascular events: population-based study with ongoing mortality and hospital events follow-up. J Am Coll Cardiol 2011;57:292–9. 10.1016/j.jacc.2010.05.065 [DOI] [PubMed] [Google Scholar]
- 50. Shaun Scholes JM. Physical activity in adults : Racher Craig JM, The health survey for England 2012. Leeds: The Health and Social Care Information Centre, 2013. [Google Scholar]
- 51. Clark BK, Healy GN, Winkler EA, et al. Relationship of television time with accelerometer-derived sedentary time: NHANES. Med Sci Sports Exerc 2011;43:822–8. 10.1249/MSS.0b013e3182019510 [DOI] [PMC free article] [PubMed] [Google Scholar]
- 52. Scholes S, Coombs N, Pedisic Z, et al. Age- and sex-specific criterion validity of the health survey for England physical activity and sedentary behavior assessment questionnaire as compared with accelerometry. Am J Epidemiol 2014;179:1493–502. 10.1093/aje/kwu087 [DOI] [PMC free article] [PubMed] [Google Scholar]
- 53. Clark BK, Lynch BM, Winkler EA, et al. Validity of a multi-context sitting questionnaire across demographically diverse population groups: AusDiab3. Int J Behav Nutr Phys Act 2015;12:148 10.1186/s12966-015-0309-y [DOI] [PMC free article] [PubMed] [Google Scholar]
- 54. Pearson N, Biddle SJ. Sedentary behavior and dietary intake in children, adolescents, and adults. A systematic review. Am J Prev Med 2011;41:178–88. 10.1016/j.amepre.2011.05.002 [DOI] [PubMed] [Google Scholar]
- 55. Stamatakis E, Coombs N, Rowlands A, et al. Objectively-assessed and self-reported sedentary time in relation to multiple socioeconomic status indicators among adults in England: a cross-sectional study. BMJ Open 2014;4:e006034 10.1136/bmjopen-2014-006034 [DOI] [PMC free article] [PubMed] [Google Scholar]
- 56. Stamatakis E, Hillsdon M, Mishra G, et al. Television viewing and other screen-based entertainment in relation to multiple socioeconomic status indicators and area deprivation: the Scottish Health Survey 2003. J Epidemiol Community Health 2009;63:734–40. 10.1136/jech.2008.085902 [DOI] [PubMed] [Google Scholar]
- 57. Hamer M, Stamatakis E, Mishra GD. Television- and screen-based activity and mental well-being in adults. Am J Prev Med 2010;38:375–80. 10.1016/j.amepre.2009.12.030 [DOI] [PubMed] [Google Scholar]
- 58. Szabo A, Hopkinson KL. Negative psychological effects of watching the news in the television: relaxation or another intervention may be needed to buffer them!. Int J Behav Med 2007;14:57–62. 10.1007/BF03004169 [DOI] [PubMed] [Google Scholar]
- 59. Hamer M, Yates T, Demakakos P. Television viewing and risk of mortality: exploring the biological plausibility. Atherosclerosis 2017;263:151–5. 10.1016/j.atherosclerosis.2017.06.024 [DOI] [PubMed] [Google Scholar]
- 60. Evenson KR, Wen F, Herring AH. Associations of accelerometry-assessed and self-reported physical activity and sedentary behavior with all-cause and cardiovascular mortality among US adults. Am J Epidemiol 2016;184:621–32. 10.1093/aje/kww070 [DOI] [PMC free article] [PubMed] [Google Scholar]
- 61. Stamatakis E, Hamer M, Tilling K, et al. Sedentary time in relation to cardio-metabolic risk factors: differential associations for self-report vs accelerometry in working age adults. Int J Epidemiol 2012;41:1328–37. 10.1093/ije/dys077 [DOI] [PubMed] [Google Scholar]
- 62. Wilmot EG, Edwardson CL, Achana FA, et al. Sedentary time in adults and the association with diabetes, cardiovascular disease and death: systematic review and meta-analysis. Diabetologia 2012;55:2895–905. 10.1007/s00125-012-2677-z [DOI] [PubMed] [Google Scholar]
- 63. Wijndaele K, Healy GN. Sitting and chronic disease: where do we go from here? Diabetologia 2016;59:688–91. 10.1007/s00125-016-3886-7 [DOI] [PubMed] [Google Scholar]
- 64. Krishnan S, Rosenberg L, Palmer JR. Physical activity and television watching in relation to risk of type 2 diabetes: the Black Women’s Health Study. Am J Epidemiol 2009;169:428–34. 10.1093/aje/kwn344 [DOI] [PMC free article] [PubMed] [Google Scholar]
- 65. Ford ES, Schulze MB, Kroger J, et al. Television watching and incident diabetes: findings from the European Prospective Investigation into Cancer and Nutrition-Potsdam Study. J Diabetes 2010;2:23–7. 10.1111/j.1753-0407.2009.00047.x [DOI] [PubMed] [Google Scholar]
- 66. Matthews CE, George SM, Moore SC, et al. Amount of time spent in sedentary behaviors and cause-specific mortality in US adults. Am J Clin Nutr 2012;95:437–45. 10.3945/ajcn.111.019620 [DOI] [PMC free article] [PubMed] [Google Scholar]
- 67. Biddle SJH, Bengoechea García E, Pedisic Z, et al. Screen time, other sedentary behaviours, and obesity risk in adults: a review of reviews. Curr Obes Rep 2017;6:134–47. 10.1007/s13679-017-0256-9 [DOI] [PubMed] [Google Scholar]
- 68. Ekelund U, Brage S, Besson H, et al. Time spent being sedentary and weight gain in healthy adults: reverse or bidirectional causality? Am J Clin Nutr 2008;88:612–7. 10.1093/ajcn/88.3.612 [DOI] [PubMed] [Google Scholar]
- 69. Pedisic Z, Grunseit A, Ding D, et al. High sitting time or obesity: which came first? Bidirectional association in a longitudinal study of 31,787 Australian adults. Obesity 2014;22:2126–30. 10.1002/oby.20817 [DOI] [PMC free article] [PubMed] [Google Scholar]
- 70. Pulsford RM, Stamatakis E, Britton AR, et al. Sitting behavior and obesity: evidence from the Whitehall II study. Am J Prev Med 2013;44:132–8. 10.1016/j.amepre.2012.10.009 [DOI] [PMC free article] [PubMed] [Google Scholar]
- 71. Stamatakis E, Pulsford RM, Brunner EJ, et al. Sitting behaviour is not associated with incident diabetes over 13 years: the Whitehall II cohort study. Br J Sports Med 2017;51:818–23. 10.1136/bjsports-2016-096723 [DOI] [PubMed] [Google Scholar]
- 72. Bao W, Tobias DK, Bowers K, et al. Physical activity and sedentary behaviors associated with risk of progression from gestational diabetes mellitus to type 2 diabetes mellitus: a prospective cohort study. JAMA Intern Med 2014;174:1047–55. 10.1001/jamainternmed.2014.1795 [DOI] [PMC free article] [PubMed] [Google Scholar]
- 73. Åsvold BO, Midthjell K, Krokstad S, et al. Prolonged sitting may increase diabetes risk in physically inactive individuals: an 11 year follow-up of the HUNT Study, Norway. Diabetologia 2017;60:830–5. 10.1007/s00125-016-4193-z [DOI] [PubMed] [Google Scholar]
- 74. Healy GN, Dunstan DW, Salmon J, et al. Breaks in sedentary time: beneficial associations with metabolic risk. Diabetes Care 2008;31:661–6. 10.2337/dc07-2046 [DOI] [PubMed] [Google Scholar]
- 75. van der Berg JD, Stehouwer CDA, Bosma H, et al. Associations of total amount and patterns of sedentary behaviour with type 2 diabetes and the metabolic syndrome: the Maastricht Study. Diabetologia 2016;59:709–18. 10.1007/s00125-015-3861-8 [DOI] [PMC free article] [PubMed] [Google Scholar]
- 76. Healy GN, Matthews CE, Dunstan DW, et al. Sedentary time and cardio-metabolic biomarkers in US adults: NHANES 2003–06. Eur Heart J 2011;32:590–7. 10.1093/eurheartj/ehq451 [DOI] [PMC free article] [PubMed] [Google Scholar]
- 77. Chastin SFM, Egerton T, Leask C, et al. Meta-analysis of the relationship between breaks in sedentary behavior and cardiometabolic health. Obesity 2015;23:1800–10. 10.1002/oby.21180 [DOI] [PubMed] [Google Scholar]
- 78. Cooper AR, Sebire S, Montgomery AA, et al. Sedentary time, breaks in sedentary time and metabolic variables in people with newly diagnosed type 2 diabetes. Diabetologia 2012;55:589–99. 10.1007/s00125-011-2408-x [DOI] [PubMed] [Google Scholar]
- 79. Jefferis BJ, Parsons TJ, Sartini C, et al. Objectively measured physical activity, sedentary behaviour and all-cause mortality in older men: does volume of activity matter more than pattern of accumulation? Br J Sports Med. 2018 doi: 10.1136/bjsports-2017-098733. [DOI] [PMC free article] [PubMed] [Google Scholar]
- 80. Diaz KM, Howard VJ, Hutto B, et al. Patterns of sedentary behavior and mortality in U.S. Middle-aged and older adults: a national cohort study. Ann Intern Med 2017;167:465 10.7326/M17-0212 [DOI] [PMC free article] [PubMed] [Google Scholar]
- 81. Benatti FB, Ried-Larsen M. The effects of breaking up prolonged sitting time: a review of experimental studies. Med Sci Sports Exerc 2015;47:2053–61. 10.1249/MSS.0000000000000654 [DOI] [PubMed] [Google Scholar]
- 82. Pulsford RM, Blackwell J, Hillsdon M, et al. Intermittent walking, but not standing, improves postprandial insulin and glucose relative to sustained sitting: a randomised cross-over study in inactive middle-aged men. J Sci Med Sport 2017;20 10.1016/j.jsams.2016.08.012 [DOI] [PubMed] [Google Scholar]
- 83. Dempsey PC, Larsen RN, Sethi P, et al. Benefits for type 2 diabetes of interrupting prolonged sitting with brief bouts of light walking or simple resistance activities. Diabetes Care 2016;39:964–72. 10.2337/dc15-2336 [DOI] [PubMed] [Google Scholar]
- 84. Dunstan DW, Kingwell BA, Larsen R, et al. Breaking up prolonged sitting reduces postprandial glucose and insulin responses. Diabetes Care 2012;35:976–83. 10.2337/dc11-1931 [DOI] [PMC free article] [PubMed] [Google Scholar]
- 85. Henson J, Davies MJ, Bodicoat DH, et al. Breaking up prolonged sitting with standing or walking attenuates the postprandial metabolic response in postmenopausal women: a randomized acute study. Diabetes Care 2016;39:130–8. 10.2337/dc15-1240 [DOI] [PubMed] [Google Scholar]
- 86. Mannucci E, Dicembrini I, Lauria A, et al. Is glucose control important for prevention of cardiovascular disease in diabetes? Diabetes Care 2013;36(Suppl 2):S259–63. 10.2337/dcS13-2018 [DOI] [PMC free article] [PubMed] [Google Scholar]
- 87. Lipska KJ, Krumholz HM. Is hemoglobin A1c the right outcome for studies of diabetes? JAMA 2017;317:1017–8. 10.1001/jama.2017.0029 [DOI] [PMC free article] [PubMed] [Google Scholar]
- 88. Rodríguez-Gutiérrez R, Montori VM. Glycemic control for patients with type 2 diabetes mellitus: our evolving faith in the face of evidence. Circ Cardiovasc Qual Outcomes 2016;9:504–12. 10.1161/CIRCOUTCOMES.116.002901 [DOI] [PMC free article] [PubMed] [Google Scholar]
- 89. Physical Activity Guidelines Advisory Committee. 2018 Physical activity guidelines advisory committee scientific report. Washington, DC: U.S. Department of Health and Human Services, 2018. [Google Scholar]
- 90. Koster A, Caserotti P, Patel KV, et al. Association of sedentary time with mortality independent of moderate to vigorous physical activity. PLoS One 2012;7:e37696 10.1371/journal.pone.0037696 [DOI] [PMC free article] [PubMed] [Google Scholar]
- 91. Schmid D, Ricci C, Leitzmann MF. Associations of objectively assessed physical activity and sedentary time with all-cause mortality in US adults: the NHANES Study. PLoS One 2015;10:e0119591 10.1371/journal.pone.0119591 [DOI] [PMC free article] [PubMed] [Google Scholar]
- 92. Schmid D, Ricci C, Baumeister SE, et al. Replacing sedentary time with physical activity in relation to mortality. Medicine & Science in Sports & Exercise 2016;48:1312–9. 10.1249/MSS.0000000000000913 [DOI] [PubMed] [Google Scholar]
- 93. Lee IM, Shiroma EJ, Evenson KR, et al. Accelerometer-measured physical activity and sedentary behavior in relation to all-cause mortality: the women’s health study. Circulation 2018;137 10.1161/CIRCULATIONAHA.117.031300 [DOI] [PMC free article] [PubMed] [Google Scholar]
- 94. Pandey A, Salahuddin U, Garg S, et al. Continuous dose-response association between sedentary time and risk for cardiovascular disease: a meta-analysis. JAMA Cardiol 2016;1:575–83. 10.1001/jamacardio.2016.1567 [DOI] [PubMed] [Google Scholar]
- 95. Chau JY, Grunseit AC, Chey T, et al. Daily sitting time and all-cause mortality: a meta-analysis. PLoS One 2013;8:e80000 10.1371/journal.pone.0080000 [DOI] [PMC free article] [PubMed] [Google Scholar]
- 96. Bauman A, Ainsworth BE, Sallis JF, et al. The descriptive epidemiology of sitting. A 20-country comparison using the International Physical Activity Questionnaire (IPAQ). Am J Prev Med 2011;41:228–35. 10.1016/j.amepre.2011.05.003 [DOI] [PubMed] [Google Scholar]
- 97. Bennie JA, Chau JY, van der Ploeg HP, et al. The prevalence and correlates of sitting in European adults - a comparison of 32 Eurobarometer-participating countries. Int J Behav Nutr Phys Act 2013;10:107 10.1186/1479-5868-10-107 [DOI] [PMC free article] [PubMed] [Google Scholar]
- 98. Matthews CE, Chen KY, Freedson PS, et al. Amount of time spent in sedentary behaviors in the United States, 2003-2004. Am J Epidemiol 2008;167:875–81. 10.1093/aje/kwm390 [DOI] [PMC free article] [PubMed] [Google Scholar]
- 99. Elliott J, Shepherd P. Cohort profile: 1970 british birth cohort (BCS70). Int J Epidemiol 2006;35:836–43. 10.1093/ije/dyl174 [DOI] [PubMed] [Google Scholar]
- 100. Krokstad S, Langhammer A, Hveem K, et al. Cohort profile: the HUNT Study, Norway. Int J Epidemiol 2013;42:968–77. 10.1093/ije/dys095 [DOI] [PubMed] [Google Scholar]
- 101. Chastin SFM, Palarea-Albaladejo J, Dontje ML, et al. Combined effects of time spent in physical activity, sedentary behaviors and sleep on obesity and cardio-metabolic health markers: a novel compositional data analysis approach. PLoS One 2015;10:e0139984 10.1371/journal.pone.0139984 [DOI] [PMC free article] [PubMed] [Google Scholar]
- 102. Stamatakis E, Rogers K, Ding D, et al. All-cause mortality effects of replacing sedentary time with physical activity and sleeping using an isotemporal substitution model: a prospective study of 201,129 mid-aged and older adults. Int J Behav Nutr Phys Act 2015;12:121 10.1186/s12966-015-0280-7 [DOI] [PMC free article] [PubMed] [Google Scholar]
- 103. Skotte J, Korshøj M, Kristiansen J, et al. Detection of physical activity types using triaxial accelerometers. J Phys Act Health 2014;11:76–84. 10.1123/jpah.2011-0347 [DOI] [PubMed] [Google Scholar]
- 104. Chastin SFM, De Craemer M, De Cocker K, et al. How does light-intensity physical activity associate with adult cardiometabolic health and mortality? Systematic review with meta-analysis of experimental and observational studies. Br J Sports Med 2018:bjsports-2017-097563 10.1136/bjsports-2017-097563 [DOI] [PMC free article] [PubMed] [Google Scholar]